Embed Size (px)
Citation preview

ExoMars Rover Battery Modeling & Life Tests
Geoff Dudley
NASA Aerospace Battery Workshop Huntsville USA November 16-18 2010

ExoMars Rover Battery | G. Dudley | Nov 16-18 2010 | NASA Aerospace Battery Workshop | Page 2
ExoMars Rover
• Mass is critical ! • Nominal mission duration: 180 sols
Battery
Battery
ExoMars Rover Battery | G. Dudley | Nov 16-18 2010 | NASA Aerospace Battery Workshop | Page 3
Background to tests - 1
• Low ambient temperature means either battery has to operate cold or extra is energy needed from somewhere to maintain higher battery temperature
• Li-Ion cell manufacturers data sheets show discharge capability down to below -20 deg. C but rarely indicate low temperature charge capability
• Required charge rates are quite low for rover application so low-temperature charging was investigated
• ABSL recommended 4 cell candidates for low temperature tests at ESTEC (based on specific energy at low temperatures)
• 2 of these down-selected for life tests as 6s1p strings: • ABSL 18650 LV (2.2 Ah nameplate capacity) • ABSL 18650 NL (2.4 Ah nameplate capacity)

ExoMars Rover Battery | G. Dudley | Nov 16-18 2010 | NASA Aerospace Battery Workshop | Page 4
Background to tests - 2
• ESTEC tests carried out under contract to ABSL in the frame of ExoMars phase B1 “Rover Vehicle Battery Breadboard” activity.
– By 180 cycles of life testing both cell types showed large dispersion in voltage, capacity and resistance
– Evidence for lithium plating
• Characterisation tests performed in parallel with life tests – NL cell model (derived from these) subsequently confirmed that Li plating
was inevitable at the charge rates previously used. – Model used to help select a more suitable charge management
• New life tests on new 6s1p modules of NL and LV cell types with new charge management
– After 120 sols discontinued worst-performing cell module (LV) and replaced by second NL module using more aggressive charge management

ExoMars Rover Battery | G. Dudley | Nov 16-18 2010 | NASA Aerospace Battery Workshop | Page 5
NL cell characterization tests
• Tests essentially the same as reported for the Sony 18650HC model [1] – Internal resistance - C/5 cycling between 4.2 and 2.9V with current-
interruption resistance measurements at -20, -10, 0, 20, and 30 deg. C. (also provides calibration for thermal measurements).
– Diffusion resistance and hysteresis - Cycling between 4.2 and 2.9V at different constant currents between C/2 and C/200. Done at -20, 0, +20 deg. C
– Variation of cell EMF with temperature - Temperature cycling between -25 and +25 deg. C of open-circuit cells at 24 different states of charge
• No individual electrode EMF measurements available for this cell - ‘guesstimated’ from literature data (next viewgraph)
ExoMars Rover Battery | G. Dudley | Nov 16-18 2010 | NASA Aerospace Battery Workshop | Page 6
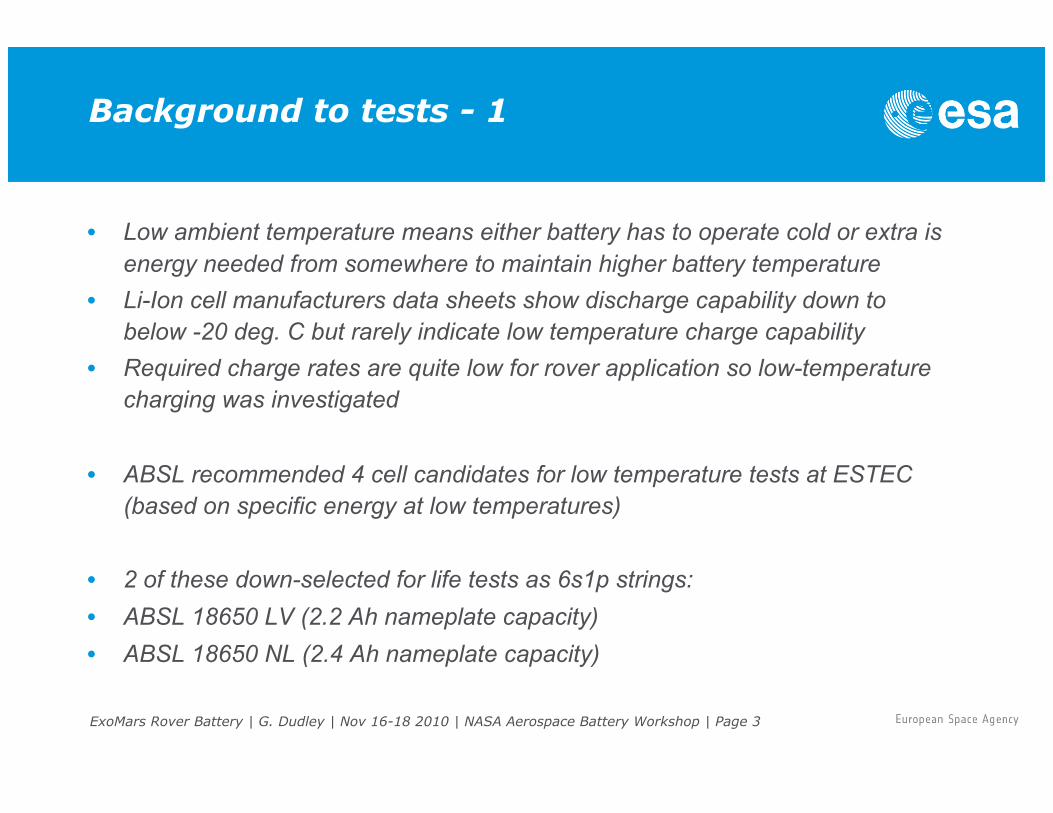
NL cell electrode EMF versus SoC - 1
• No individual electrode EMF data available for 18650NL cell
• Literature data for graphite electrode EMF varies considerably
• Plotting dEMF/dAh versus Ah discharged suggests peak at -1.05 Ah corresponds to inflection in graphite EMF at x = 0.55
• If correct, x = 1 is at 0.3 Ah overcharge - reasonable
Ramadass et al (polynomial) [3] Doyle et al (expression) [2] Lee et al (extracted from figure) [4]
Cell

ExoMars Rover Battery | G. Dudley | Nov 16-18 2010 | NASA Aerospace Battery Workshop | Page 7
NL cell electrode EMF versus SoC - 2
• Plotted Measured cell EMF + published negative EMFs
- Lee data (blue) gave smoothest predicted positive electrode EMF
- Negative EMF curve adjusted to remove regions of negative slope at low states of charge
Electrode EMFs used in model (in future intend to replace with measured data)
+ electrode Cell
- electrode
Cell
Ramadass [3] Lee [4] Doyle [2]

ExoMars Rover Battery | G. Dudley | Nov 16-18 2010 | NASA Aerospace Battery Workshop | Page 8
Characterization test chamber
Test cell Un-cycled cell NL LV
Differential thermocouple
• Cell in N2 flow measuring delta temperature between test cell and un-cycled cell
ExoMars Rover Battery | G. Dudley | Nov 16-18 2010 | NASA Aerospace Battery Workshop | Page 9
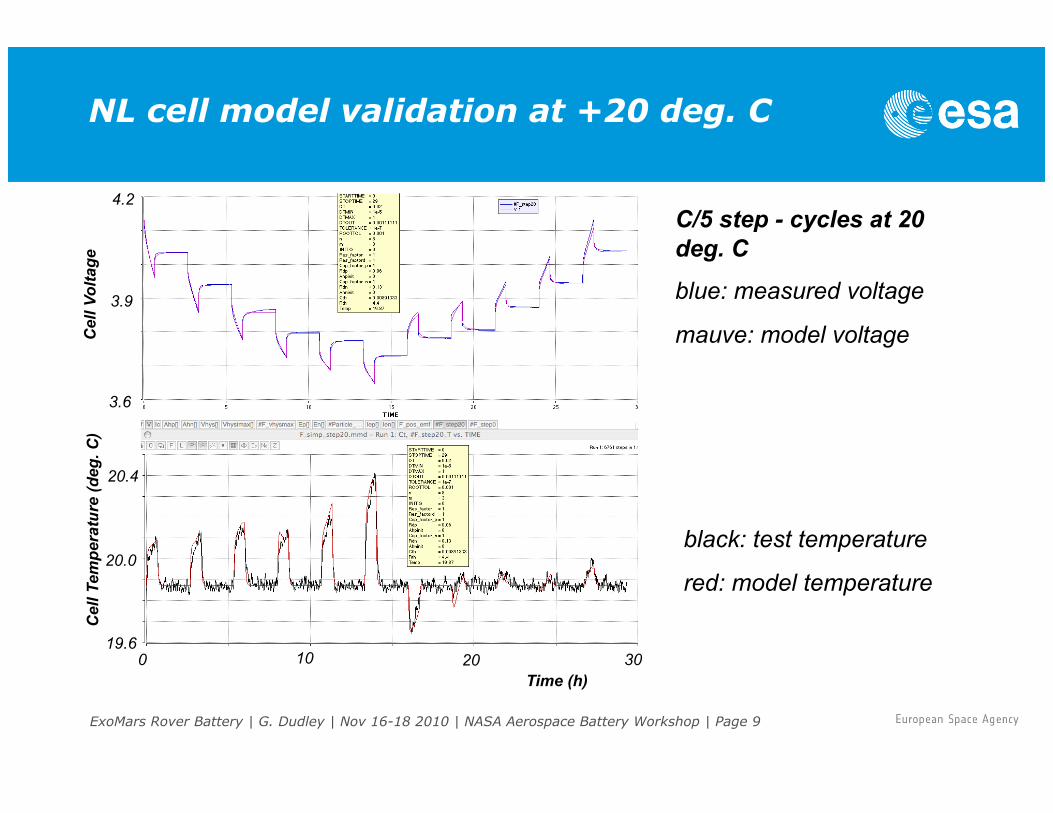
NL cell model validation at +20 deg. C
C/5 step - cycles at 20 deg. C
blue: measured voltage
mauve: model voltage
black: test temperature
red: model temperature
0 10 20 30
20.0
20.4
19.6
3.6
4.2
3.9
Cel
l Tem
pera
ture
(deg
. C)
Cel
l Vol
tage
Time (h)

ExoMars Rover Battery | G. Dudley | Nov 16-18 2010 | NASA Aerospace Battery Workshop | Page 10
NL cell model validation at -20 deg. C
C/50 step-cycles at -20 deg. C
mauve: test voltage
blue: model voltage
black: test temperature
red: model temperature
180 0
3.6
60 120
4.2
3.9
-20.00
-19.94
Cel
l Tem
pera
ture
(deg
. C)
Cel
l Vol
tage
Time (h)
ExoMars Rover Battery | G. Dudley | Nov 16-18 2010 | NASA Aerospace Battery Workshop | Page 11
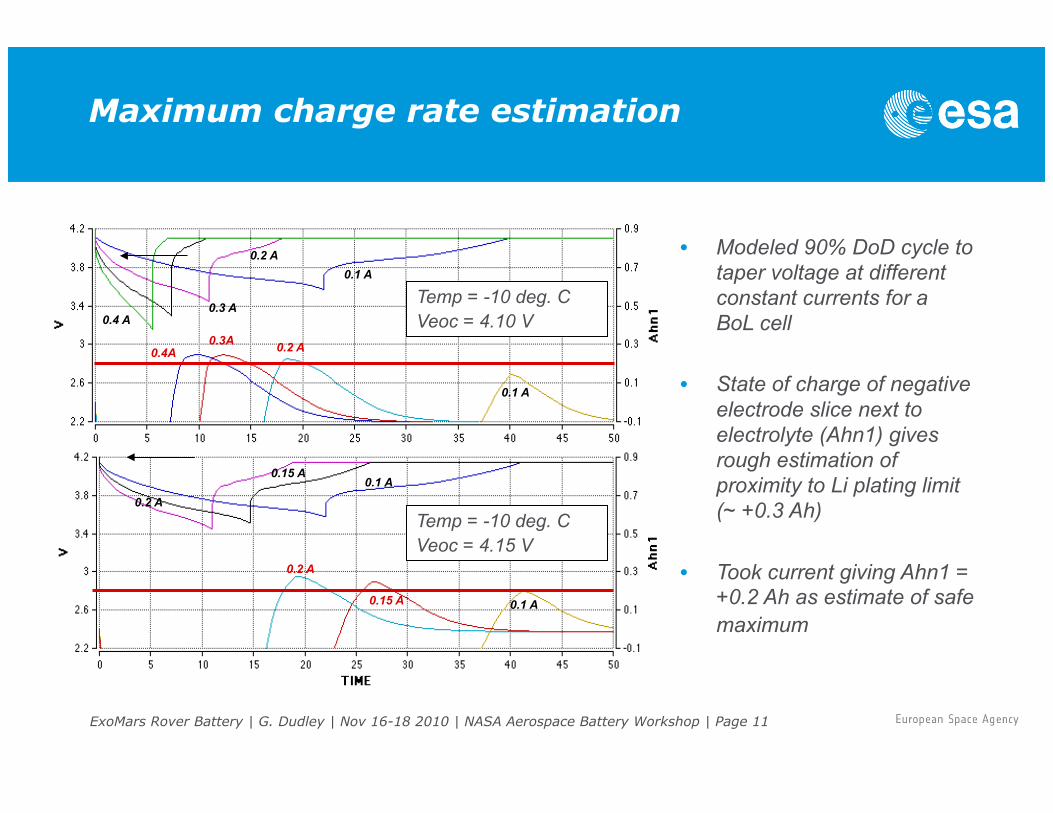
Maximum charge rate estimation
• Modeled 90% DoD cycle to taper voltage at different constant currents for a BoL cell
• State of charge of negative electrode slice next to electrolyte (Ahn1) gives rough estimation of proximity to Li plating limit (~ +0.3 Ah)
• Took current giving Ahn1 = +0.2 Ah as estimate of safe maximum
0.2 A 0.3 A
0.4 A
0.1 A 0.15 A 0.2 A
0.1 A
0.1 A 0.15 A 0.2 A
0.1 A 0.2 A 0.3A
0.4A Temp = -10 deg. C Veoc = 4.10 V
Temp = -10 deg. C Veoc = 4.15 V

ExoMars Rover Battery | G. Dudley | Nov 16-18 2010 | NASA Aerospace Battery Workshop | Page 12
Proposed battery charge management
• To minimise required heater power while retaining a simple passive thermal control system, battery must be insulated as much as possible consistent with avoiding overheating in worst hot case
0
0.2
0.4
0.6
0.8
1
1.2
1.4
-30 -20 -10 0 10 20
Temperature
Curr
ent
limit
(A
/st
ring)
4.2 V
4.1 V4.10 V
4.15 V • Resulting maximum ‘safe’ charge
rates versus temperature with taper voltage of 4.10 and 4.15 V
• Proposal: Charge the battery at the highest safe rate possible at its current temperature and use any extra solar array power to heat battery
ExoMars Rover Battery | G. Dudley | Nov 16-18 2010 | NASA Aerospace Battery Workshop | Page 13
NL 1 Module Test

ExoMars Rover Battery | G. Dudley | Nov 16-18 2010 | NASA Aerospace Battery Workshop | Page 14
NL 1 cell module life test objectives
• Objectives: - To validate proposed charge control and thermal management under worst-case power
conditions (mid-winter day length, minimum SA power, Earth - communications just before dawn) assuming 15-string battery with 1 failed string
- To show adequate end of mission performance - To validate electrical/thermal model so it can be used later for battery design
optimisation - To investigate whether cells remain balanced in state of charge without cell balancing
electronics
• End of mission performance criterion: - At end of nominal mission (180 sols) night discharge must use less than 70% of
available energy
ExoMars Rover Battery | G. Dudley | Nov 16-18 2010 | NASA Aerospace Battery Workshop | Page 15
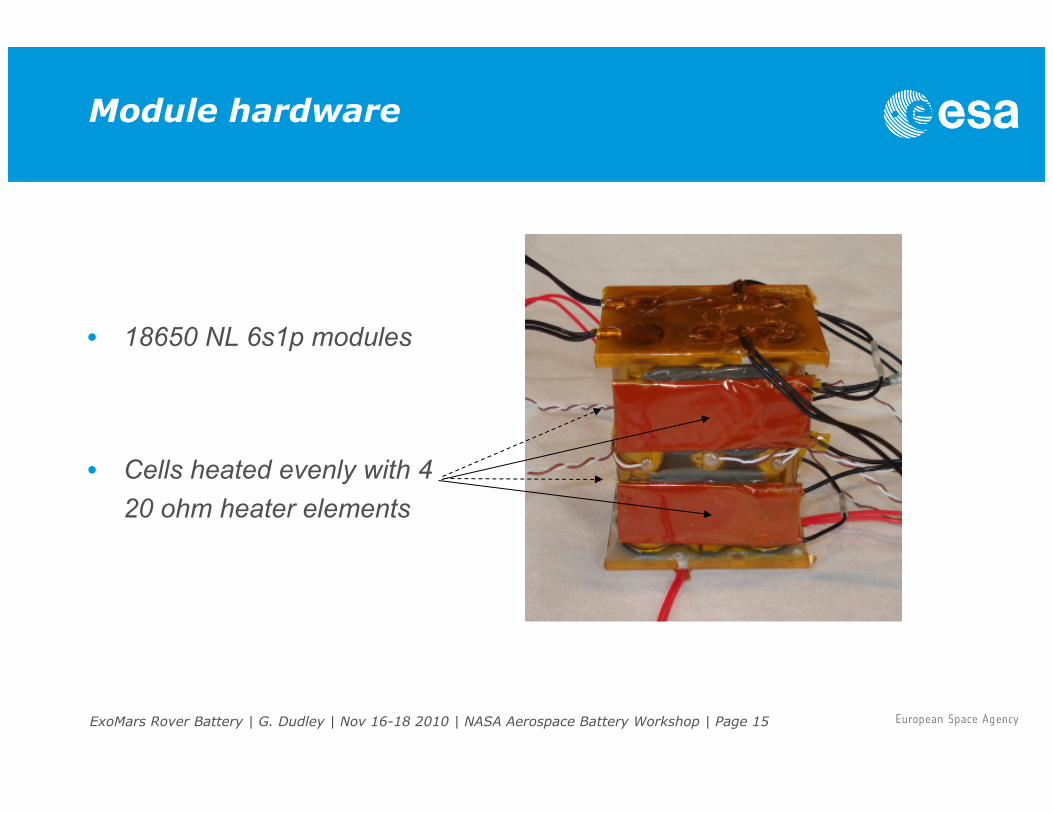
Module hardware
• 18650 NL 6s1p modules
• Cells heated evenly with 4 20 ohm heater elements

ExoMars Rover Battery | G. Dudley | Nov 16-18 2010 | NASA Aerospace Battery Workshop | Page 16
Test Environment
• Module placed in insulating polystyrene foam box.
• Module in test chamber with dry nitrogen circulation (to prevent condensation) at -26 deg. C (chosen to give minimum module temperature of -20 deg. C)
• Thermal resistance ~ 130 deg.C / W (believed to be easily achievable in rover)

ExoMars Rover Battery | G. Dudley | Nov 16-18 2010 | NASA Aerospace Battery Workshop | Page 17
Test NL 1: “Conservative” charge management
• Low risk charge profile (taper charge voltage = 4.1 and no charging below -10 deg. C). • Max charge current calculated from the table below:
– Linear interpolation in regions -10.5 to -9.5 and -5.5 to -4-5
• Priority for available solar array power: 1) Power essential loads 2) Charge battery (up to maximum current) 3) Heat battery with remaining power up to maximum of 0 deg. C (when the battery can
accept the maximum current capability of the battery charger)
Temperature (deg. C) Max charge current (A)
<= -10.5 0
- 9.5 0.174
- 5.5 0.174
>= -4.5 0.290

ExoMars Rover Battery | G. Dudley | Nov 16-18 2010 | NASA Aerospace Battery Workshop | Page 18
NL 1 module test profile
• Real time day, accelerated night (Night loads increased to meet real-time energy demand)
1: Night discharge - reduced to 8h for acceleration
2: Telecommunication peak (0.15h)
4: Midday load peak (drill)
3: Morning (sunlight) charge/heat
5: Afternoon (sunlight) charge/heat
SA power Heater power
Battery power Cell temperature

ExoMars Rover Battery | G. Dudley | Nov 16-18 2010 | NASA Aerospace Battery Workshop | Page 19
NL 1 module BoL (sol 3): model comparison with test results
– Black: test – Green:
model
– Black: test – Red: model
– Green: test – Blue:
model
Time (h) 0 20 10 -20 -10
0
0.0 0.2
-0.2
4.0 4.2 3.8 3.6 3.4
Tem
p (d
eg. C
) C
urre
nt (A
) C
ell V

ExoMars Rover Battery | G. Dudley | Nov 16-18 2010 | NASA Aerospace Battery Workshop | Page 20
NL 1 battery Voltage & temperature
• Small drop in minimum battery voltage
• Chamber temperature -26 deg. C to give minimum battery temperature of -20 deg.C
• No change in battery temperature with cycling
• Conclusion: • Very stable performance
Sol 5 Sol 171
Sol 5 Sol 171
Sol 820
Sol 820

ExoMars Rover Battery | G. Dudley | Nov 16-18 2010 | NASA Aerospace Battery Workshop | Page 21
NL 1 module cell voltages
Sol 5
Sol 820
• Cell 2 has higher voltage at low temperatures than the others, which are very close
• After 820 sols little additional voltage dispersion except for cell 3
3
2
ExoMars Rover Battery | G. Dudley | Nov 16-18 2010 | NASA Aerospace Battery Workshop | Page 22
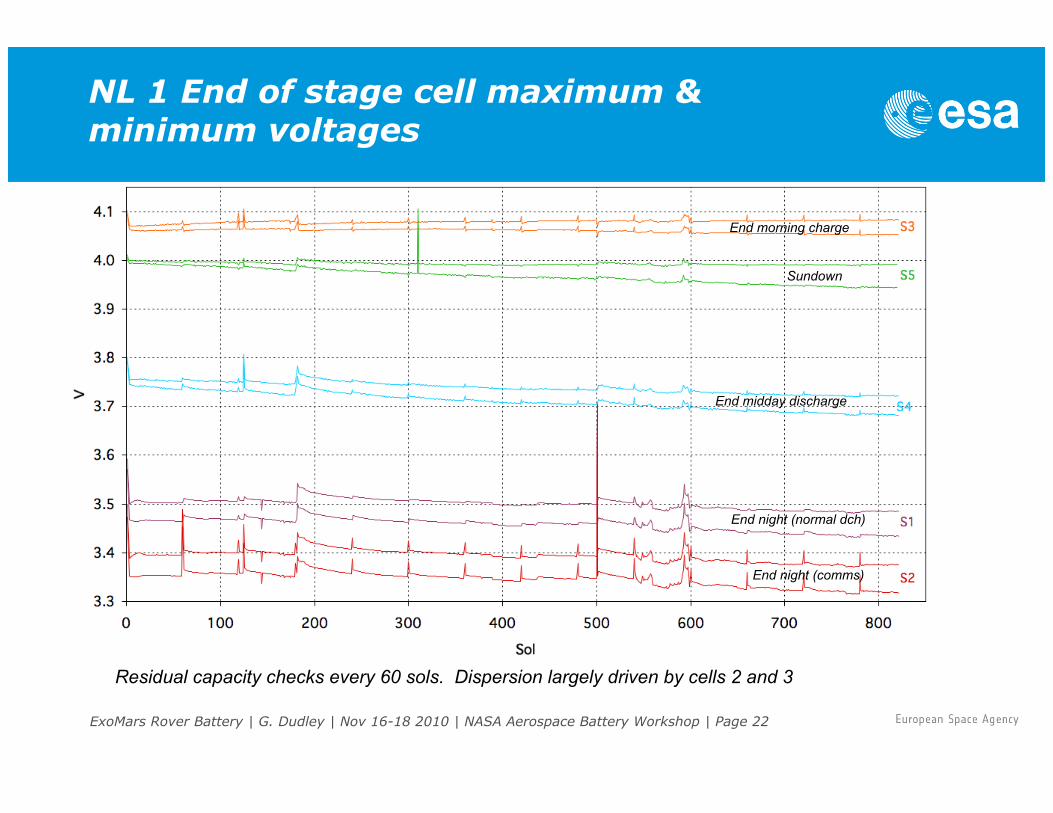
NL 1 End of stage cell maximum & minimum voltages
End night (comms) End night (normal dch)
Sundown
End midday discharge
End morning charge
Residual capacity checks every 60 sols. Dispersion largely driven by cells 2 and 3
ExoMars Rover Battery | G. Dudley | Nov 16-18 2010 | NASA Aerospace Battery Workshop | Page 23
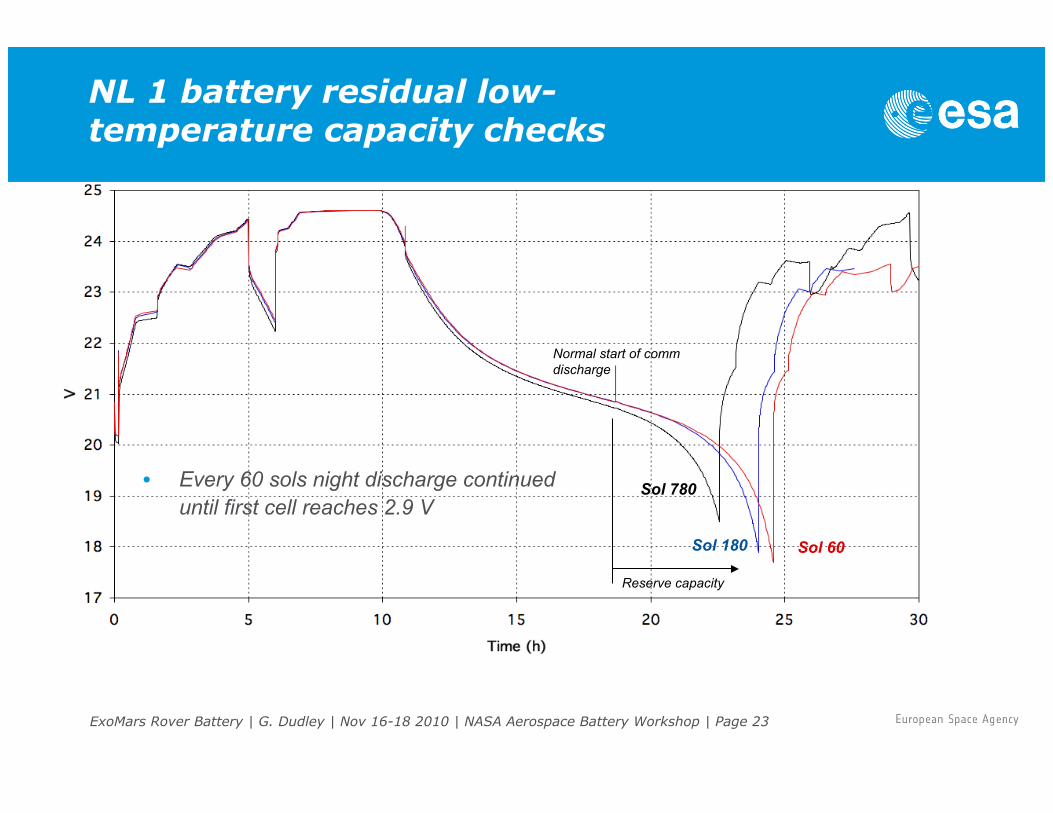
NL 1 battery residual low-temperature capacity checks
Reserve capacity
Normal start of comm discharge
Sol 60 Sol 180 Sol 780 • Every 60 sols night discharge continued
until first cell reaches 2.9 V
ExoMars Rover Battery | G. Dudley | Nov 16-18 2010 | NASA Aerospace Battery Workshop | Page 24
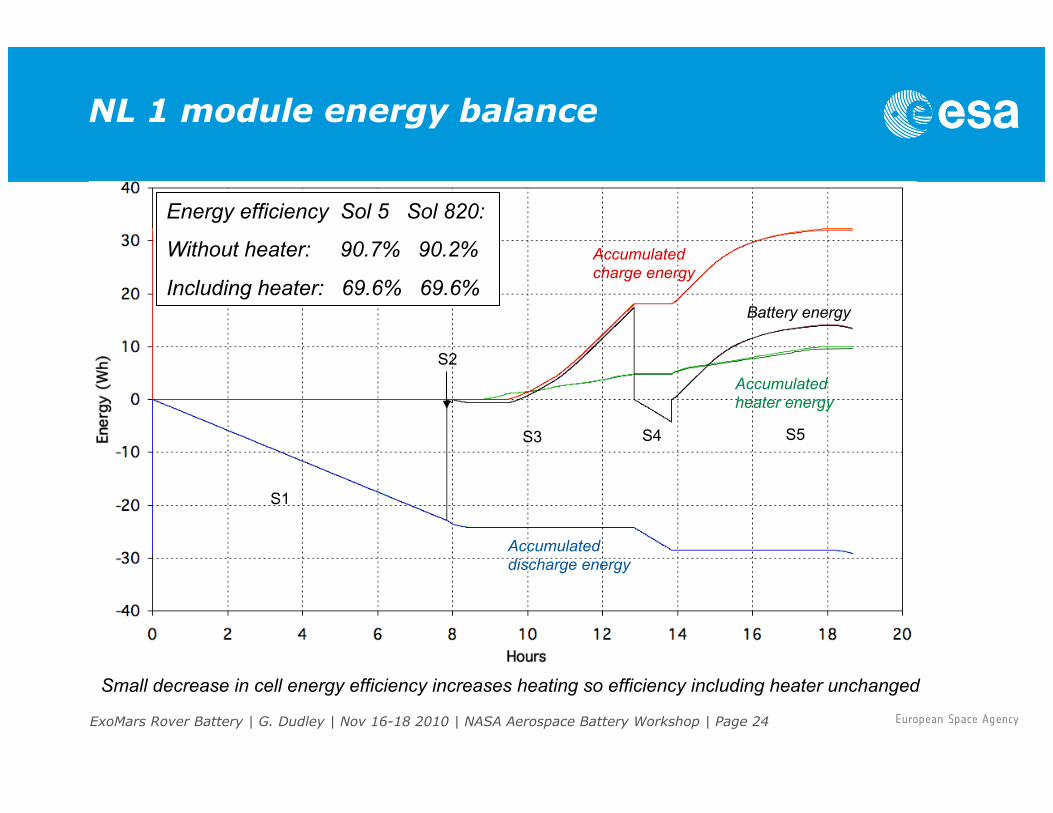
NL 1 module energy balance
Accumulated heater energy
Accumulated charge energy
Accumulated discharge energy
Battery energy
S1
S2
S3 S4 S5
Energy efficiency Sol 5 Sol 820:
Without heater: 90.7% 90.2%
Including heater: 69.6% 69.6%
Small decrease in cell energy efficiency increases heating so efficiency including heater unchanged
ExoMars Rover Battery | G. Dudley | Nov 16-18 2010 | NASA Aerospace Battery Workshop | Page 25
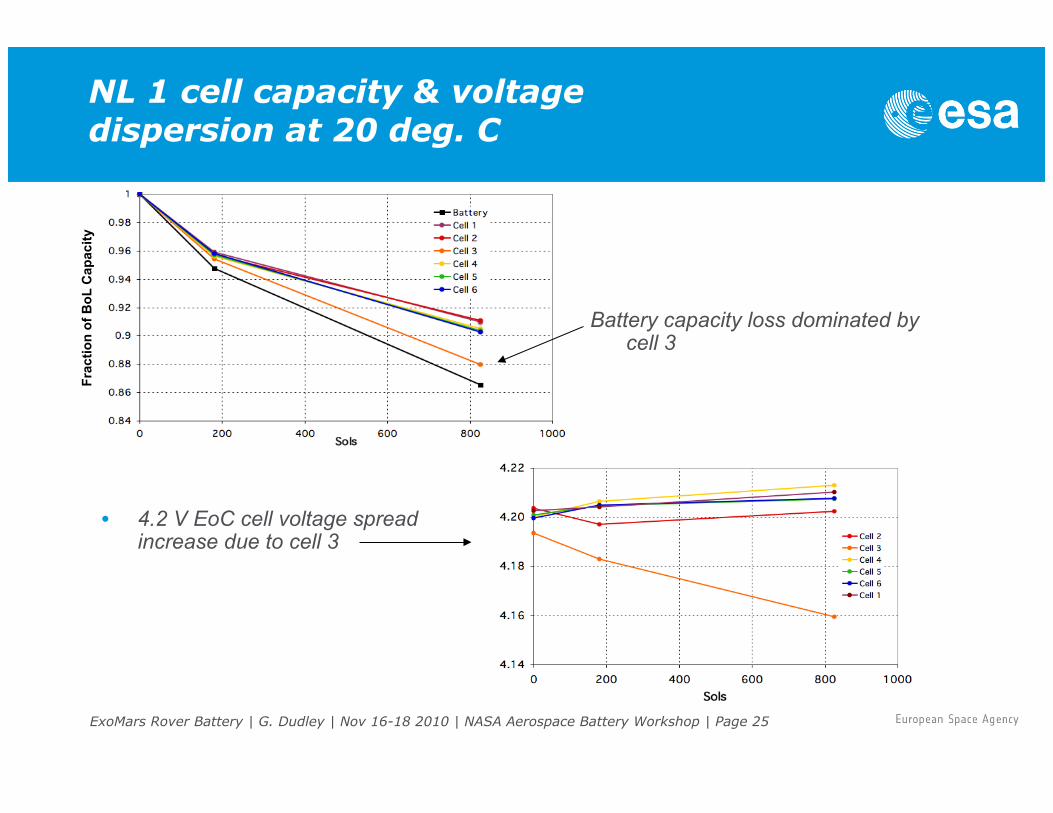
NL 1 cell capacity & voltage dispersion at 20 deg. C
• 4.2 V EoC cell voltage spread increase due to cell 3
Battery capacity loss dominated by cell 3
Frac
tion
of B
oL C
apac
ity

ExoMars Rover Battery | G. Dudley | Nov 16-18 2010 | NASA Aerospace Battery Workshop | Page 26
NL 1 cell resistance at 20 deg. C
• Measurements made during 20 deg. C capacity check
• Values are average over discharge and charge
• 100 mS current-interruption method

ExoMars Rover Battery | G. Dudley | Nov 16-18 2010 | NASA Aerospace Battery Workshop | Page 27
NL 2 Module Test
ExoMars Rover Battery | G. Dudley | Nov 16-18 2010 | NASA Aerospace Battery Workshop | Page 28
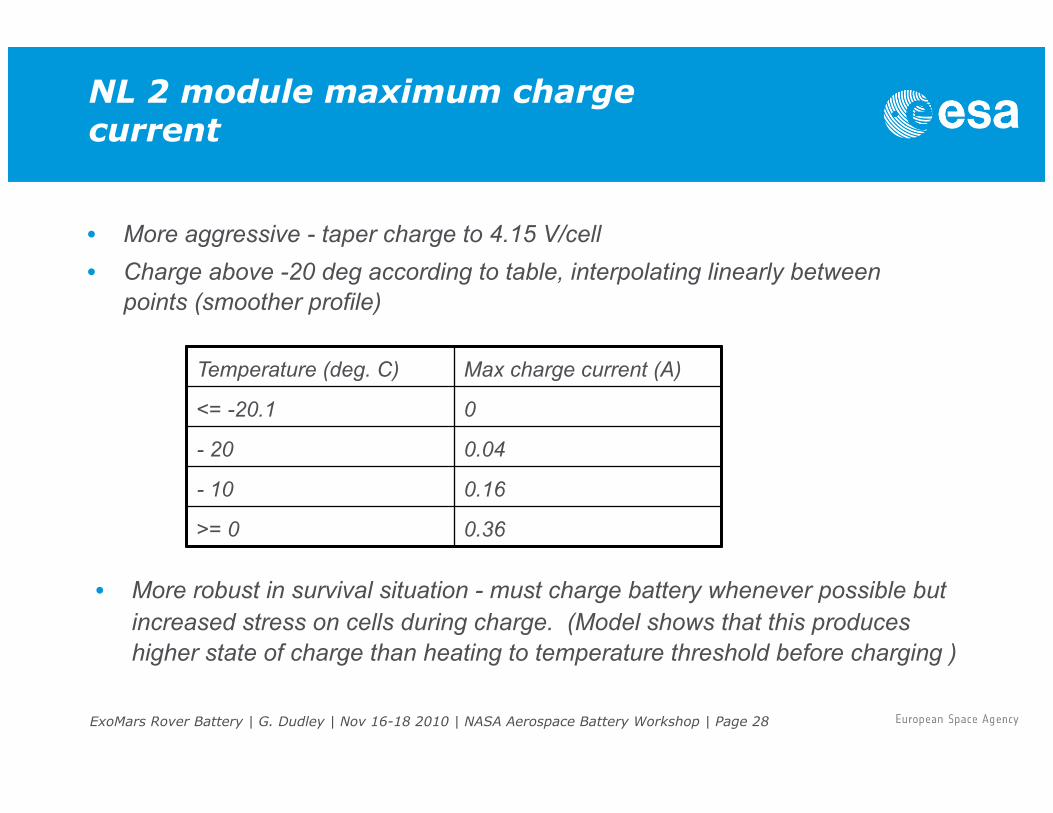
NL 2 module maximum charge current
• More aggressive - taper charge to 4.15 V/cell • Charge above -20 deg according to table, interpolating linearly between
points (smoother profile)
• More robust in survival situation - must charge battery whenever possible but increased stress on cells during charge. (Model shows that this produces higher state of charge than heating to temperature threshold before charging )
Temperature (deg. C) Max charge current (A)
<= -20.1 0
- 20 0.04
- 10 0.16
>= 0 0.36
ExoMars Rover Battery | G. Dudley | Nov 16-18 2010 | NASA Aerospace Battery Workshop | Page 29
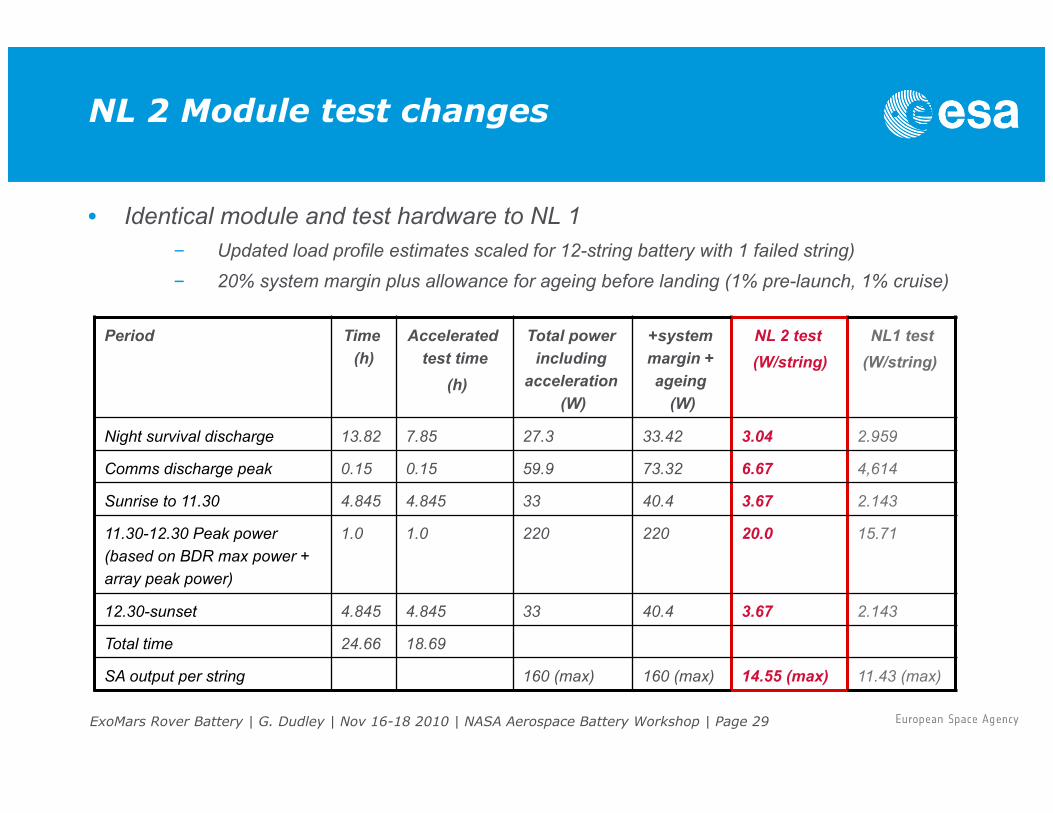
NL 2 Module test changes
• Identical module and test hardware to NL 1 – Updated load profile estimates scaled for 12-string battery with 1 failed string) – 20% system margin plus allowance for ageing before landing (1% pre-launch, 1% cruise)
Period Time (h)
Accelerated test time
(h)
Total power including
acceleration (W)
+system margin + ageing
(W)
NL 2 test (W/string)
NL1 test (W/string)
Night survival discharge 13.82 7.85 27.3 33.42 3.04 2.959
Comms discharge peak 0.15 0.15 59.9 73.32 6.67 4,614
Sunrise to 11.30 4.845 4.845 33 40.4 3.67 2.143
11.30-12.30 Peak power (based on BDR max power + array peak power)
1.0 1.0 220 220 20.0 15.71
12.30-sunset 4.845 4.845 33 40.4 3.67 2.143
Total time 24.66 18.69
SA output per string 160 (max) 160 (max) 14.55 (max) 11.43 (max)

ExoMars Rover Battery | G. Dudley | Nov 16-18 2010 | NASA Aerospace Battery Workshop | Page 30
NL 2 - model shows need for comms pre-heat
Ahn1 without pre-heating Ahn1 with pre-heating
Test result with pre-heating
Model,with pre-heating Model,without pre-heating
Cel
l Vol
tage
Ahn
1
-2.4 Ah
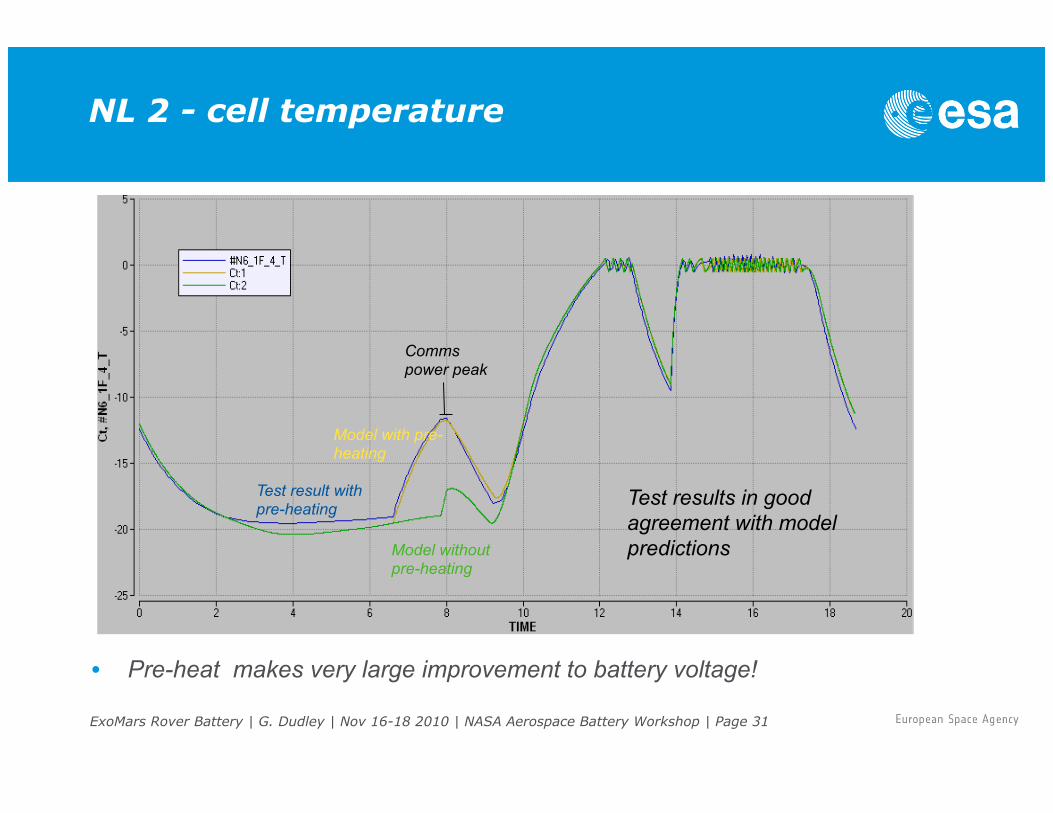
• Model showed need to pre-heat battery to prevent bus collapse when communications required just before dawn (worse-case timing)
– 0.62 W/string heater power for 75 min before start of communications discharge should produce the same battery voltage at start of pre-heat as at end of communications discharge
– First test cycles confirmed model predictions - no adjustment of pre-heat necessary.
ExoMars Rover Battery | G. Dudley | Nov 16-18 2010 | NASA Aerospace Battery Workshop | Page 31
NL 2 - cell temperature
• Pre-heat makes very large improvement to battery voltage!
Test result with pre-heating
Model with pre-heating
Model without pre-heating
Comms power peak
Test results in good agreement with model predictions

ExoMars Rover Battery | G. Dudley | Nov 16-18 2010 | NASA Aerospace Battery Workshop | Page 32
NL 2 battery Voltage & temperature
• Very little voltage change with cycling
• Ambient temperature -26 deg. C
• No change in battery temperature with cycling
• Conclusion: Stable performance
Sol 5 Sol 179 Sol 765

ExoMars Rover Battery | G. Dudley | Nov 16-18 2010 | NASA Aerospace Battery Workshop | Page 33
NL 2 cell voltage
Sol 5
Sol 765
• Cell voltage dispersion increase but very small at end of charge
• Cells remain sufficiently balanced in state of charge without need for balancing circuits

ExoMars Rover Battery | G. Dudley | Nov 16-18 2010 | NASA Aerospace Battery Workshop | Page 34
NL 2 end of stage maximum and minimum voltages
End night (comms) End night (normal dch)
End preheat
End midday discharge
Sundown
End morning charge
• Minimum cell voltage dropping faster than in NL 1 test. End of life near.

ExoMars Rover Battery | G. Dudley | Nov 16-18 2010 | NASA Aerospace Battery Workshop | Page 35
NL 2 battery energy balance
Accumulated heater energy
Accumulated charge energy
Accumulated discharge energy
Battery energy Pre-heat
Energy efficiency Sol 5 Sol 765:
Without heater: 90.8% 89.7%
Including heater: 72.1% 72.0%
S1 S2
S3 S4
S5 S6
• Efficiency drop without heater is twice that for LN 1 but still very small.

ExoMars Rover Battery | G. Dudley | Nov 16-18 2010 | NASA Aerospace Battery Workshop | Page 36
NL 2 cell capacity & voltage dispersion at 20 deg. C
• No 4.2 V EoC cell voltage spread increase since sol 180
• Battery capacity loss slightly less than NL 1 but average loss per cell is higher
Frac
tion
of B
oL C
apac
ity
ExoMars Rover Battery | G. Dudley | Nov 16-18 2010 | NASA Aerospace Battery Workshop | Page 37
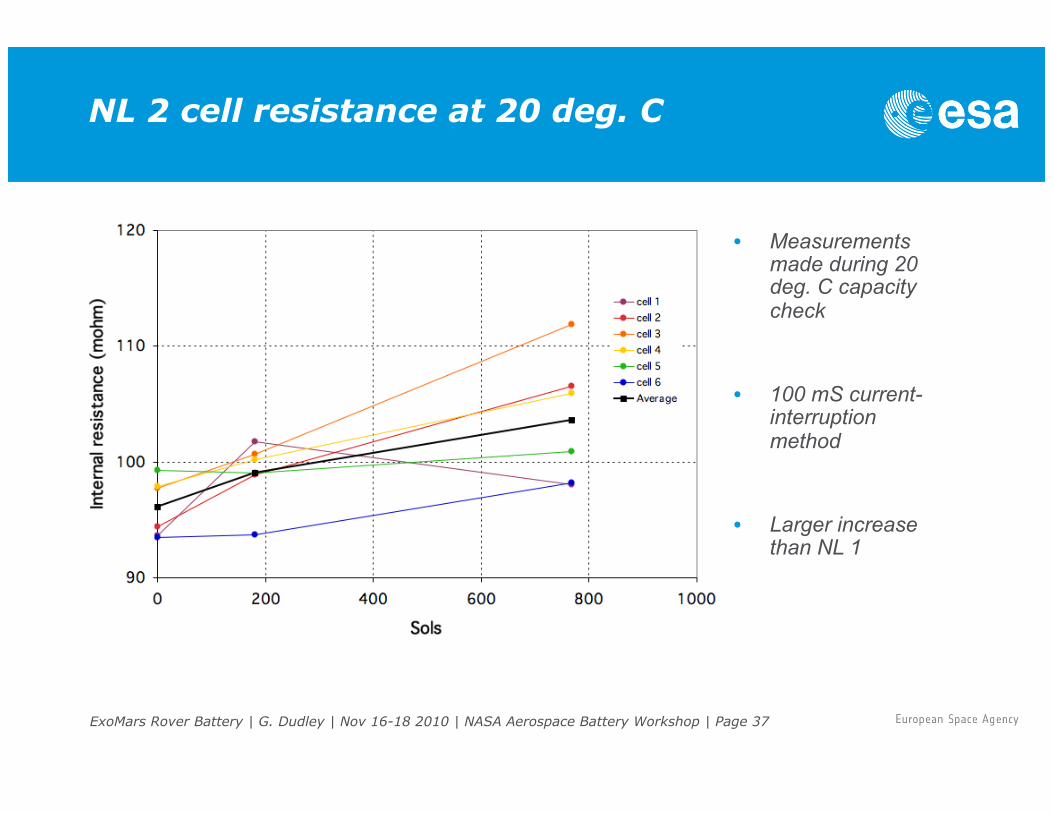
NL 2 cell resistance at 20 deg. C
• Measurements made during 20 deg. C capacity check
• 100 mS current-interruption method
• Larger increase than NL 1

ExoMars Rover Battery | G. Dudley | Nov 16-18 2010 | NASA Aerospace Battery Workshop | Page 38
Discharge energy reserve
• Target was for end of night discharge energy to remain above 70% of the available energy after 180 sols (i.e 43% margin in Wh required)
• Graphs compare discharge energy during capacity checks with required energy and required energy with margin.
• Module NL 1 exceeded margin until 720 sols whereas NL 2 exceeded it until 260 sols
Wh required Wh required
Wh required + 43% margin
Wh required + 43% margin
NL 1 NL 2
ExoMars Rover Battery | G. Dudley | Nov 16-18 2010 | NASA Aerospace Battery Workshop | Page 39
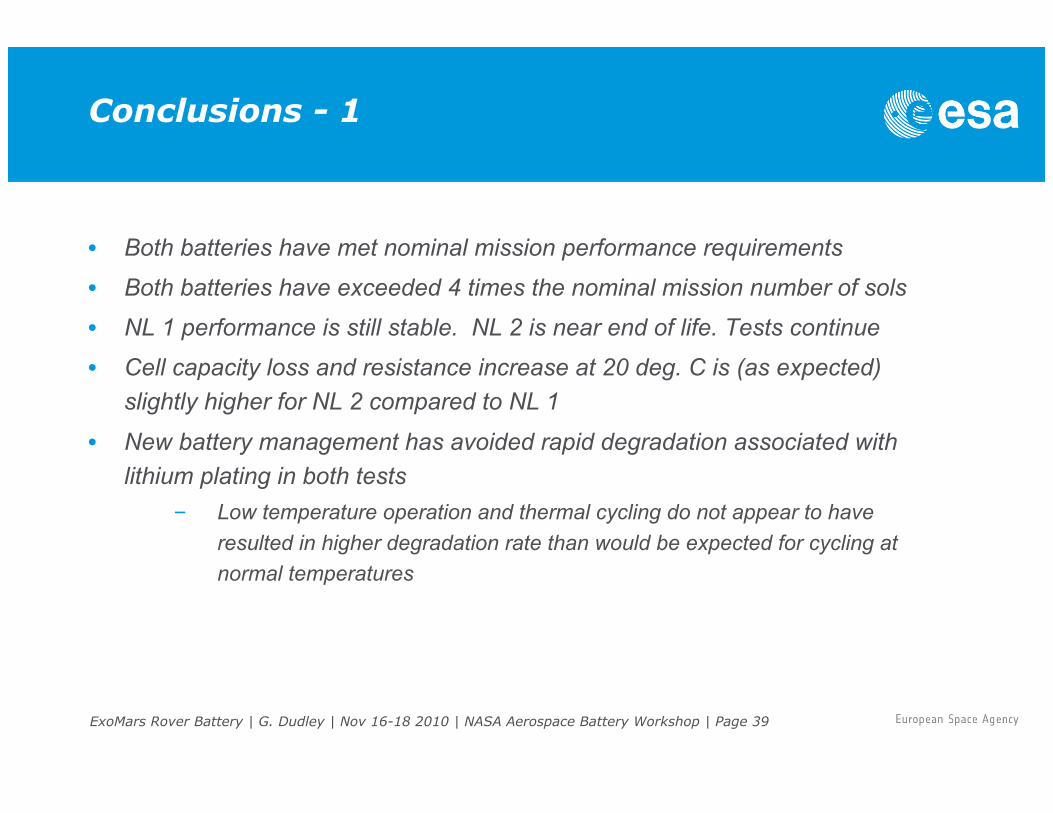
Conclusions - 1
• Both batteries have met nominal mission performance requirements
• Both batteries have exceeded 4 times the nominal mission number of sols
• NL 1 performance is still stable. NL 2 is near end of life. Tests continue
• Cell capacity loss and resistance increase at 20 deg. C is (as expected) slightly higher for NL 2 compared to NL 1
• New battery management has avoided rapid degradation associated with lithium plating in both tests
– Low temperature operation and thermal cycling do not appear to have resulted in higher degradation rate than would be expected for cycling at normal temperatures
ExoMars Rover Battery | G. Dudley | Nov 16-18 2010 | NASA Aerospace Battery Workshop | Page 40
Conclusions - 2
• With thermal insulation level used in test, round-trip energy efficiency including battery heating is about 70% including energy used to heat battery
• Battery thermal insulation resistance limited by need to avoid overheating in worst hot case.
• Hot case currently envisioned would allow use of better insulation, further improving round-trip energy efficiency
• Cell model is validated by (BoL) test results
• Model will be a useful tool for rover battery electrical/thermal design and optimization. Should reduce the need for further testing as the mission profile inevitably changes

ExoMars Rover Battery | G. Dudley | Nov 16-18 2010 | NASA Aerospace Battery Workshop | Page 41
Conclusions - 3
• It should be possible to use batteries with commercial lithium ion cells not specially designed to operate at low temperatures
• Cell SoC balancing electronics is not required for the ABSL 18650 NL cell • Even taking into account the power needed to heat the battery, the overall round trip
energy efficiency is still attractive at around 70%.
• The NL 1 module gives 86 Wh/kg based on actual discharge energy and cell mass (but excluding structure). For NL 2 this is increased to 92 Wh/kg. Adding the 43% margin the accessible specific energies are 122 and 129 Wh/kg respectively.
• Mass is more important than energy efficiency for this application so this solution might still be competitive against use of cells with better low temperature performance if that performance comes at the price of reduced specific energy
• This solution would however be less able to survive after enforced low-temperature hibernation

ExoMars Rover Battery | G. Dudley | Nov 16-18 2010 | NASA Aerospace Battery Workshop | Page 42
Acknowledgements
• ABSL (Naseer Ahmed, Chris Chetwood) for entrusting the work to us and the supply of test cells and modules
• Stephane Zimmerman (ESTEC), Stephen Gavin, Chris Draper & Adrian Bull (Astrium UK) for ensuring that the test profiles were coherent to project requirements
• The ESBTC lab team and in particular Natascha Klein for setting up and running the unusually complicated test hardware and software
• Max Schautz (ESTEC) for managing related tests and for valuable discussions

ExoMars Rover Battery | G. Dudley | Nov 16-18 2010 | NASA Aerospace Battery Workshop | Page 43
References
1. Electrical/Thermal Model of a Sony 18650HC Li-Ion Cell, G. J. Dudley, J. De Roche, F. Tonicello, C. Thwaite, Proc. ‘Seventh European Space Power Conference’, Stresa, Italy, 9-13 May 2005 (ESA SP-589, May 2005)
2. Computer Simulations of a Lithium-Ion Polymer Battery and Implications for Higher Capacity Next-Generation Battery Designs, M Doyle and Y Fuentes, Journal of The Electrochemical Society, 150 (6) A706-A713 (2003)
3. Mathematical modeling of the capacity fade of Li-ion cells, P. Ramadass, B. Haran, R. White, B. N. Popov, Journal of Power Sources 123 (2003) 230-240
4. Identity and thermodynamics of lithium intercalated in graphite, Hsiang-Hwan Lee, Chi-Chao Wan, Yung-Yun Wang, Journal of Power Sources 114 (2003) 285-291