Embed Size (px)
Citation preview
Institut für Organische Chemie und Biochemie
der Technischen Universität München
2-Aminopurine and Pyrenylethyne-Modified Uridine as
Fluorescent Probes for the Investigation of Nucleic Acids and
Their Interactions
Manuela Johanna Rist
Vollständiger Abdruck der von der Fakultät für Chemie der Technischen Universität
München zur Erlangung des akademischen Grades eines
Doktors der Naturwissenschaften
genehmigten Dissertation.
Vorsitzender: Univ.-Prof. Dr. J. Buchner
Prüfer der Dissertation: 1. Univ.-Prof. Dr. H. Kessler
2. Adjunct Assistant Professor J. P. Marino, PhD,
University System of Maryland/USA
3. Univ.-Prof. Dr. M.-E. Michel-Beyerle, i. R.
Die Dissertation wurde am 22.01.2003 bei der Technischen Universität München eingereicht
und durch die Fakultät für Chemie am 28.02.2003 angenommen.


dedicated to my parents and Burkhard

Thanks
The work for this PhD thesis has been carried out from October 1999 to December 2001 at
the Center for Advanced Research in Biotechnology in Rockville, Maryland, in the group of
Prof. Dr. J. P. Marino, and from January 2002 to January 2003 in the group of Prof. Dr. H.
Kessler at the “Institut für Organische Chemie und Biochemie der Technischen Universität
München” under the supervision of Dr. Hans-Achim Wagenknecht.
First and foremost, I would like to thank Prof. Dr. John P. Marino for making it possible for
me to spend two years of my time as a PhD student in his group, enjoying excellent facilities
and resources. I was so fortunate as to reap the benefits of his superb supervision and
guidance but at the same time having the freedom I needed to perform my work.
My special thanks go to Prof. Dr. Horst Kessler for taking me up in his group so
spontaneously. In Munich I enjoyed a hearty welcome and excellent working conditions.
Also, I would like to thank Dr. Hans-Achim Wagenknecht for his preeminent supervision
during my time in his group and for always being available for questions and discussions.
Prof. Dr. Hannelore Daniel I thank very much for supporting my extravagant idea of spending
most of my PhD time in the US.
At CARB I would like to thank
• Dr. Karen A. Lacourciere for introducing me into the secrets of fluorescence
spectroscopy and biochemical lab work in real life,
• my lab colleagues Dr. Burkhard Luy, Nanda Mahashetty, Dr. Eric S. Dejong and Dr. M.
Rita Mihailescu for a warm and hearty lab atmosphere and many interesting
discussions,
• Prof. Dr. James T. Stivers for stimulating discussions and help with the interpretation of
sometimes confusing fluorescence data,
• Dr. Fenhong Song for the synthesis of many DNA templates and labeled RNA samples,
• Nadik Abdulaev for his help with the HPLC,
• Pat Alexander, Mike Tangrea, Kathryn Fisher, Prof. Phil Bryan and Prof. John Orban
for countless lunchtime discussions and insights into the American way of seeing
things,
• Mariela Urrutia, Dr. Paloma Fernandez-Varela, Dr. Pia Bonander and Dr. Nicklas
Bonander for the oasis in the 'other world' of CARB,
• Tom Belcher, Tim Bennett, Grace Bromfield, Cindy Denisac, Darwin Diaz, Jonathan
Dill, Tom Dimsdale, Al Ledford, Davin Mackesy, Michelle Stanton and Frank Wallis
for the assistance with all the ‘little’ things,
• and all the other wonderful people at CARB who made my stay there so interesting and
unforgettable.
I would also like to thank
• Prof. Lynne Regan (Yale University) for providing us with purified Rom protein, and
• Dr. T. E. Shrader (Albert Einstein College of Medicine) for providing us with plasmid
pT7-911Q
In Munich I would like to thank
• my lab colleagues Nicole Amann, Alessandro Righi, Elke Mayer, Stefan Mitschke,
Peter Kaden, Clemens Wagner and Linda Valis for the great lab atmosphere, many
stimulating and also entertaining discussions,
• Nicole especially for making the new start in a new lab much easier and for ceaselessly
trying to turn me into a 'real' chemist,
• Georgette Thumshirn for the help with the HPLC,
• Claudia Dahmen for the occasional lift home,
• Herrn Helmut Krause for the prompt measurements of many MALDI-TOF mass
spectra,
• Dr. Torsten Fiebig and his coworkers for the time-resolved transient absorption
measurements,
• Dr. Rainer Häßner and Alexander Frenzel for help with all kinds of computer problems,
• Dr. Burkhard Luy and Dr. Hans-Achim Wagenknecht for the critical reading of this
manuscript,
• Evelyn Bruckmaier and Marianne Machule for secretarial assistance
and all mentioned and unmentioned co-workers for the excellent working atmosphere and for
being not just colleagues but also friends.
My very special thanks go to Dr. Burkhard Luy who helped me regain the fascination for
science and research whenever I had doubts about my work, and without whom this work
would not have been possible in this way.

Index ______________________________________________________________________________________________________
i
INDEX I
ABBREVIATIONS V
1 INTRODUCTION AND MOTIVATION 1
2 BACKGROUND 6
2.1 Fluorescence 6
2.1.1 General Introduction to Fluorescence 6
2.1.2 Investigations of Nucleic Acid Interactions Using Fluorescence Spectroscopy 14
2.1.3 Fluorescent and Chemical Properties of the Nucleotide Base Analogs Used in
this Thesis 15
2.2 Time-Resolved Transient Absorption Spectroscopy 21
2.3 Antisense RNA Systems 22
2.4 Energy and Charge Transfer in DNA 24
2.4.1 Excited State Energy Transfer 24
2.4.2 Charge Transfer 24
2.4.2.1 Mechanisms of Hole Transfer 26
2.4.2.1.1 Superexchange Mechanism 26
2.4.2.1.2 Hopping Mechanism 28
2.4.2.2 Experimental Techniques for Charge Transfer Detection 28
2.4.2.2.1 Oxidative Hole Transfer 29
2.4.2.2.2 Reductive Electron Transfer 32
2.4.2.2.3 Biotechnological Applications of Electron Transfer in DNA 37
3 QUANTITATIVE ANALYSIS OF AN ANTISENSE RNA LOOP-LOOP COMPLEX FROM THE COLE1 PLASMID REPLICATION SYSTEM 39
3.1 Biochemical Background 39
3.2 Sample Preparation and Characterization 41
3.2.1 RNA Oligonucleotide Preparation 41
3.2.2 Samples Used 43
Index ______________________________________________________________________________________________________ ii
3.2.3 Native Gel Electrophoresis and UV Melt 43
3.3 Fluorescence Experiments 46
3.3.1 Kinetics of Kiss Formation with Mg2+ 46
3.3.2 Proposed Model: a Two-Step Mechanism for RNA Kissing 53
3.3.3 Metal Ion Requirement for the RNA Loop-Loop Complex Formation. 55
3.3.4 Rom Binding Kinetics 60
3.4 Summary 62
4 INVESTIGATION OF THE DIMERIZATION AND STRUCTURAL ISOMERIZATION OF THE DIMERIZATION INITIATION SITE (DIS) STEM-LOOP FROM HIV-1 64
4.1 Introduction 64
4.2 Preliminary Experiments 69
4.2.1 Homodimers 69
4.2.2 Heterodimers 71
4.3 Fluorescence Experiments with Second Set of Heterodimers 75
4.3.1 Sample Design 75
4.3.2 Results 76
4.3.2.1 DIS Kissing Dimer Kinetics 76
4.3.2.2 DIS Conversion 80
4.3.2.3 NCp7 Mechanism 83
4.3.2.4 Junction Mutants 88
4.3.2.5 Proposed Model for DIS Conversion 91
4.4 Summary 95
5 EXCIMER FORMATION IN DNA STUDIED WITH 2-AP FLUORESCENT MARKERS 97
5.1 Introduction 97
5.2 Sample Design and Control Experiments 97
Index ______________________________________________________________________________________________________
iii
5.3 Results and Discussion 100
5.3.1 Steady-State Fluorescence Spectroscopy 100
5.3.2 Time-Resolved Transient Absorption Spectroscopy 105
5.4 Conclusion 107
6 STUDIES OF CHARGE TRANSFER IN 2-AMINOPURINE CONTAINING DINUCLEOTIDES 108
6.1 Introduction 108
6.2 Sample Design and Control Experiments 108
6.3 Results and Discussion 110
7 REDUCTIVE ELECTRON TRANSFER STUDIED WITH 5-(1-
PYRENYLETHYNYL)-2' DEOXYURIDINE (PY-≡-DU) 116
7.1 Introduction 116
7.2 Sample Preparation and Control Experiments 117
7.3 Results 121
8 SUMMARY 126
9 MATERIALS AND METHODS 128
9.1 Materials 128
9.2 Frequently Used Buffers 128
9.3 General Work Procedures 128
9.3.1 Denaturing Polyacrylamide Gel Electrophoresis (PAGE) 128
9.3.2 Native Polyacrylamide Gel Electrophoresis 129
9.3.3 High-Performance Liquid Chromatography (HPLC) 130
9.3.4 Lyophilization 130
9.3.5 Annealing of RNA or DNA Duplexes 130
9.3.6 Snap Cooling 130
Index ______________________________________________________________________________________________________ iv
9.3.7 MALDI-TOF Mass Spectroscopy 130
9.3.8 UV/Vis Spectroscopy 130
9.3.9 UV Melts 131
9.3.10 Circular Dichroism Spectroscopy (CD) 131
9.4 Protein Preparations 132
9.4.1 T7 Polymerase 132
9.4.2 Nucleocapsid Protein (NCp7) 132
9.5 Oligonucleotide Preparations 134
9.5.1 RNA Transcription and Purification 134
9.5.2 DNA Synthesis and Purification 135
9.5.3 5-(1-pyrenylethynyl)-2'-deoxyuridine Containing DNA: Synthesis and
Purification 136
9.6 Fluorescence Experiments 138
9.6.1 Fluorescence Experiments on RNA 138
9.6.2 Fluorescence Experiments on DNA 144
10 LITERATURE 145
Abbreviations ______________________________________________________________________________________________________
v
Abbreviations
ε extinction coefficient
τ life time
λ wavelength
°C degree Celsius
µl microliter
µM micromolar
µmol micromole
2-AP 2-aminopurine
5-I-dU 2’-deoxy-5-iodouridine
8-oxo-dG 8-oxo-deoxyguanine
A acceptor
A adenine/adenosine
A electronic absorption
Å Ångström
ACS American chemical society
AIDS acquired immunodeficiency syndrome
APS ammonium peroxodisulfate
BME β-mercaptoethanol
bp base pair
C cytosine/cytidine
CA capsid protein
CD circular dichroism
cm centimeter(s)
CPG controlled pore glass
CT charge transfer
d dimer
D donor
dATP deoxyadenosine triphosphate
Abbreviations ______________________________________________________________________________________________________ vi
dCTP deoxycytidine triphosphate
ddH2O distilled and deionized water
DEPC diethyl pyrocarbonate
dGTP deoxyguanosine triphosphate
DIS dimerization initiation site
dIz imidazolone
DLS dimer linkage structure
DMF dimethylformamide
DMSO dimethylsulfoxide
DNA deoxyribonucleic acid
dOz oxazolone
DTT dithiothreitol
dTTP deoxythymidine triphosphate
E efficiency
E. coli escherichia coli
e.g. for example (exempli gratia)
EDTA ethylene diamine tetraacetic acid
ET electron transfer
F fluorescence
Fapy-dG formamidopyrimidine
FISH fluorescence in situ hybridization
FRET fluorescence resonance energy transfer
fs femtosecond(s)
g gram(s)
G guanine/guanosine
h hour(s)
HIV-1 human immunodeficiency virus type-1
HOMO highest occupied molecular orbital
HT hole transfer
I intensity
I inosine
i. e. that is (id est)
IC internal conversion
IN integrase
Abbreviations ______________________________________________________________________________________________________
vii
IPTG Isopropyl β-D-1-thiogalactopyranoside
KD equilibrium binding constant
l liter(s)
LB Luria broth
LUMO lowest unoccupied molecular orbital
m monomer
M molar
MA matrix protein
MALDI-TOF matrix-assisted laser desorption ionization-time of flight
mg milligram(s)
min minute(s)
ml milliliter(s)
mM millimolar
mm millimeter(s)
mRNA messenger RNA
ms millisecond(s)
Na-Pi sodium phosphate
NC nucleocapsid
NCp7 nucleocapsid protein 7
n/d not determined
Ni-NTA Ni-nitrilotriacetic acid
nm nanometer(s)
nt nucleotide
NTP nucleoside triphosphate
OD260 optical density at wavelength 260 nm
P phosphorescence
PAGE polyacrylamide gel electrophoresis
PBS primer binding site
PCET proton-coupled electron transfer
PCR polymerase chain reaction
PEG polyethylene glycol
PEI polyethyleneimine
PMSF phenylmethylsulfonyl fluoride
PR protease
Abbreviations ______________________________________________________________________________________________________ viii
psi punds per square inch
Py-≡-dU 5-(1-pyrenylethynyl)-2’-deoxyuridine
Py-dU 5-(pyren-1-yl)-2’-deoxyuridine
r distance
R0 Förster distance
R.T. room temperature
RNA ribonucleic acid
Rom RNA one modulator
RP-HPLC reverse-phase high performance liquid chromatography
rpm revolutions per minute
RT reverse transciptase
S0 ground state
S1 lowest excited singlet state
S2 excited singlet state
sec second(s)
SNP single nucleotide polymorphism
SU surface glycoprotein
ST singlet-triplet intersystem crossing
T thymin/thymidin
T1 triplet state
TBAF tetra-n-butyl ammonium fluoride
TBE Tris borate EDTA buffer
TBM Tris borate MgCl2 buffer
TBCa Tris borate CaCl2 buffer
TEA triethylamine
TEMED N,N,N’,N’-tetramethylethylenediamine
THF tetrahydrofuran
Tm melting temperature
TM trans membrane protein
Tris tris(hydroxymethyl)aminomethane
tRNA transfer RNA
Trp tryptophan
UV ultra violet
V Volt
Abbreviations ______________________________________________________________________________________________________
ix
Vis visible
VR vibrational relaxation
v/v volume for volume
W Watt
w/v weight for volume
wt wild-type
The nomenclature used in this work is based on the guidelines recommended by Chemical
Abstracts (Chemical Abstracts, ‘Index Guide’, 77, 210) and the IUPAC-IUB commissions
(IUPAC, Eur. J. Biochem. 1971, 21, 455-477; IUPAC, Pure Appl. Chem. 1996, 68, 1919;
IUPAC Commission on Nomenclature of Organic Chemistry (CNOC) and IUPAC-IUB Joint
Commission on Biochemical Nomenclature (JCBN), Biochemistry 1974, 10, 3983; IUPAC-
IUB (JCBN), Eur. J. Biochem. 1984, 138, 9-37).

1 Introduction and Motivation ______________________________________________________________________________________________________
1
1 Introduction and Motivation
Nucleic acids play a central role in biology and life in general: Deoxyribonucleic acid (DNA)
is the “storehouse” of genetic information. It is composed of only four different nucleosides,
adenosine (A), thymidine (T), guanosine (G) and cytidine (C) that are linked covalently
through phosphodiester bonds, but it is complex enough as a biopolymer to store the complete
genetic information of almost every living organism. DNA has two major functions. First, it
has to pass on information through replication possibly error-free, but at the same time allow
evolutionary processes. Damage in the DNA sequence can lead to mutagenesis and
carcinogenesis. Often, damage in DNA is caused by radical reactions as a consequence of
oxidative stress. It has been observed, however, that the site of radical formation is spatially
separated from the site of damage. If and how charge can migrate through DNA therefore has
been discussed extensively and controversially over the past decades. Most work has focused
on oxidative hole transfer, but still very little is known about the mechanism of reductive
electron transfer. The second important function of DNA is to allow expression of the genetic
code under defined conditions. DNA is transcribed into RNA via molecular recognition
through hydrogen bonds between the DNA bases and their corresponding RNA bases.
Subsequently the RNA is translated into proteins. Gene replication and expression are highly
regulated processes. Usually proteins perform these regulatory functions, however in several
bacteria and viruses regulation by antisense RNA was observed. The high specificity of these
antisense interactions led to the promising concept of developing new antisense drugs. For
reasonable drug design, though, it is useful to study native antisense interactions first.
In general, biological systems are too complex to study as a whole, so it is important to
develop model systems to initially study the basic principles of biological processes. One of
the most promising methods to study nucleic acid interactions and also charge transfer
through DNA is fluorescence spectroscopy. The application of fluorescence methods to the
study of macromolecules has seen a dramatic surge in the last few years. Fluorescence
techniques are finding widespread application in biochemical and biophysical studies of
macromolecules, as well as in medicinal, environmental and commercial research efforts. In
studies of nucleic acids, fluorescence spectroscopy provides an important tool for the
detection and probing of structure, dynamics and interactions. The intrinsic fluorescence of
the naturally occurring nucleotide bases in nucleic acids is extremely weak. This drawback
can be inverted into an advantage by the use of non-natural nucleotide base analogs with

1 Introduction and Motivation ______________________________________________________________________________________________________ 2
optimized fluorescence properties (i.e. higher quantum yields and longer lifetimes) that can be
incorporated using standard automated synthetic methods. Since no background fluorescence
of the natural bases is present, site-specific structural and biophysical information in nucleic
acid oligomers can be obtained.
In this thesis, fluorescence detected methods are applied to study antisense RNA interactions
taken from a bacterial and a viral regulatory system and to address energy and charge transfer
in DNA using two nucleoside base analogs.
The present thesis consists of two major parts. In the first part, the nucleoside base analog 2-
aminopurine (2-AP) is used as a fluorescent probe for RNA-RNA interactions. In the second
part, the fluorescence properties and quenching events of 2-AP are investigated in more
detail, and a new fluorescent pyrene-modified nucleoside was developed for the study of
reductive electron transfer in DNA.
The first part addresses the interaction of antisense RNA stem-loops derived from the strongly
regulated plasmid replication system ColE1, and the dimerization initiation site (DIS) of the
human immunodeficiency virus type 1 (HIV-1), respectively.
The ColE1 plasmid system has been studied intensively in the past. The plasmid copy number
is strongly regulated by a kinetically controlled antisense RNA strategy involving RNA I as
the repressor and RNA II as the primer precursor for replication. The auxiliary protein Rom
acts as an additional repressor of replication by binding to the RNA complex and stabilizing
it. Thus, the following questions emerged:
• Is it possible to study the kinetics and the mechanism of antisense RNA loop-loop
kissing complex formation using the 2-AP fluorescence?
• What is the importance of metal ions in this system and what kind of metal ions can
induce complex formation?
• Can Rom binding be measured and quantified using the same fluorescently labeled
RNA molecules?
To address these questions a concept was developed as follows:
1. Site-specific incorporation of the fluorescent nucleoside base analog 2-AP into RNA
sequences derived from the ColE1 transcripts RNA I and RNA II.
2. Determination of equilibrium binding constants as well as on- and off-rates for the
RNA complex formation using steady-state and stopped-flow fluorescence
spectroscopy.
1 Introduction and Motivation ______________________________________________________________________________________________________
3
3. Titration of different mono- and divalent metal ions to the RNA stem-loops to find out
the metal ion dependence of the system and determine apparent binding constants for
the metal ion binding to the RNA complex by steady-state fluorescence.
4. Titration of the Rom protein to RNA loop-loop complexes to determine Rom binding
constants to the RNA.
Subsequently, the 2-AP assay was used for the investigation of the dimerization initiation site
from HIV-1. Dimerization of the RNA genome is vital for HIV. It has been found that the
dimerization is initiated at a stem-loop with a palindromic sequence by a loop-loop interaction
which is followed by a structural isomerization to an extended duplex. Thus, this system can
again be seen as an antisense RNA model. Based on the knowledge on this system, the
questions that arose were:
• What are the kinetics of the RNA loop-loop complex formation?
• Can the loop-loop 'kissing' complex be distinguished from the mature extended duplex
using fluorescence spectroscopy?
• What is the pathway of duplex maturation, does it proceed via the loop-loop complex
as an intermediate, does it follow a strand exchange or a ribozyme-like mechanism as
proposed by Ennifar et al.?[1]
• What is the role of the viral nucleocapsid protein (NCp7) in the maturation process,
and how does it act on the RNA complex?
To answer these questions, the following strategy was planned:
1. Site-specific incorporation of 2-AP into the loop region of RNA sequences derived
from the DIS of HIV-1.
2. Design of RNA sequences containing 2-AP that facilitate observation of loop-loop
kissing complex versus mature extended duplex.
3. Application of the previously developed fluorescence assay to determine equilibrium
binding constants as well as on- and off-rates for the kissing complex formation.
4. Variation of reaction conditions and/or NCp7 concentrations to determine conversion
rates for the structural isomerization from kissing complex to extended duplex and the
role of NCp7 in this process using fluorescence spectroscopy.
5. Titration of RNA complexes to NCp7 to determine protein binding constants by the
intrinsic tryptophan fluorescence.
1 Introduction and Motivation ______________________________________________________________________________________________________ 4
In the first part, changes in the fluorescence signals were exploited to study macromolecular
interactions and dynamics, in the second, the electronic properties of 2-AP in DNA, and
subsequently, electron transfer processes in DNA were the focus of attention.
It is known that energy transfer and charge transfer can occur in photoexcited molecules and
that these processes lead to fluorescence quenching. Together with the observations from the
first part of this thesis, some new questions evolve, which are:
• What happens with the energy of the photoexcited 2-AP? Is it localized on one base or
can it diffuse over several bases?
• Do neighboring bases have an effect on the quenching of 2-AP fluorescence by charge
transfer?
In order to address these questions, it was planned to
1. design DNA assemblies suitable for the investigation of possible excimer or exciplex
formation using steady-state fluorescence and time-resolved transient absorption
spectroscopy,
2. subsequently perform steady-state fluorescence and time-resolved transient absorption
experiments to measure excimer or exciplex formation and determine the rates of their
occurrence and decay,
3. develop a model system for the investigation of the effects of neighboring bases on the
fluorescence quenching of 2-AP by charge transfer, and
4. measure the degree of quenching and the rate of charge transfer of photoexcited 2-AP
using steady-state fluorescence and time-resolved transient absorption spectroscopy.
Based on the relative reduction potentials, one can assume that photoexcited 2-AP can induce
both electron transfer and hole transfer in DNA. DNA-mediated hole transfer has been studied
extensively, but it exists a lack of knowledge about reductive electron transfer. It was shown
in previous experiments that 5-(pyren-1-yl)-2'-deoxyuridine (Py-dU) selectively initiates
reductive electron transfer.[2] Concerning more details of ET in DNA the following questions
were raised:
• Can pyrenylethynyl-uracil-modified DNA act as a selective electron injector similar to
Py-dU?
• Can pyrenylethynyl-modified DNA be synthesized by a solid-phase strategy avoiding
the elaborate phosphoramidite synthesis?
1 Introduction and Motivation ______________________________________________________________________________________________________
5
Consequently, the below-mentioned plan was pursued to answer these questions:
1. Site-specific incorporation of 5-(1-pyrenylethynyl)-2'-deoxyuridine (Py-≡-dU) into
DNA using a new synthetic strategy which involves the combination of standard
automated synthesis and Sonogashira-type cross-coupling reactions on the solid phase.
2. Measuring steady-state fluorescence spectra to estimate the capability of Py-≡-dU to
induce reductive electron transfer in model DNA duplexes.
2 Background ______________________________________________________________________________________________________
6
2 Background
2.1 Fluorescence
2.1.1 General Introduction to Fluorescence
Luminescence is the emission of light that can occur subsequent to absorption when a
molecule excited to a higher order electronic state relaxes back to the ground state.[3] The
absorption of light by a molecule is an electronic transition called electronic absorption or
electronic excitation. The electronic transitions that are interesting for luminescence are the
n→π*, π→π*, and intramolecular charge-transfer transitions of aromatic molecules, and they
are all effected by light of 200 - 1500 nm in wavelength (near ultraviolet, visible and near-
infrared regions of the electromagnetic spectrum).[4] The absorption of light leaves a molecule
in one of a number of possible vibrational levels of one of its electronically excited states
(Figure 2-1).
Although the absorption process is extremely rapid (10-15 s), the sequence of events that
return the excited molecule to its ground state is considerably slower (10-14 to several
seconds). Molecular luminescence is among the slowest of processes in electronically excited
states, requiring from 10-10 to a few seconds, whereas thermal equilibration by loss of
vibrational energy (vibrational relaxation, VR), internal conversion (IC) and singlet-triplet
intersystem crossing (ST) are much faster (10-14 to 10-12 s). Consequently, luminescence
usually originates from thermally equilibrated, electronically excited molecules.[3-5] The
processes which occur between absorption and emission are typically illustrated by a
Jablonski diagram (Figure 2-1).[4, 6]
Depending on the electronic nature of the excited state, lowest excited singlet (S1) versus
triplet (T1), luminescence is divided into two categories, fluorescence (F) and
phosphorescence (P), respectively (Figure 2-1). An important difference between these two
types of luminescence is their average lifetimes. Fluorescence lifetimes are typically on the
order of 10 nanoseconds and correspond to an emission rate of 108 s-1; while phosphorescence
lifetimes are typically on the order of milliseconds to seconds and correspond to emission
rates that are much slower (1000 to 1 s-1).[3, 4]

2 Background ______________________________________________________________________________________________________
7
Figure 2-1. Jablonski Diagram showing photophysical processes of conjugated molecules. Electronic absorption (A) from the lowest vibrational level (v = 0) of the ground state (S0) to the various vibrational levels (v = 0, 1, 2, 3) of the excited singlet states (S1, S2) is followed by rapid, radiationless internal conversion (IC) and vibrational relaxation (VR) to the lowest vibrational level of S1. Competing for deactivation of the lowest excited singlet state S1 are the radiatinoless internal conversion and singlet-triplet intersystem crossing (ST) as well as fluorescence (F). Fluorescence is followed by VR in the ground state. Intersystem crossing is followed by VR in the triplet state (T1). Phosphorescence (P) and noradiative triplet-singlet intersystem crossing (ST) return the molecule from T1 to the ground state (S0). Vibrational relaxation in S0 then thermalizes the 'hot' ground-state molecule. (taken from Sharma and Shulman[4])
The emission rates are critical for luminescence spectroscopy since they govern the time
window during which a luminescent species can monitor its environment. In this work the
focus will be exclusively on fluorescence processes.
An interesting observation with fluorescence is that the energy of the emitted light is usually
lower than the energy of the absorbed light, i.e. emission wavelengths are longer than
absorption wavelengths. This phenomenon is called "Stokes' shift", named after the scientist
who first described this observation, Sir G. G. Stokes,[7] and it can be easily explained by
examination of the Jablonski diagram in Figure 2-1. Although absorption usually occurs to a
higher excited state or higher vibrational levels of excited states, emission always occurs from
lowest vibrational levels of lowest excited states, and is therefore of lower energy than the
absorption. This is also the explanation for the fact that emission spectra usually do not
change irrespective of the excitation wavelength (Kasha's rule).[8]
2 Background ______________________________________________________________________________________________________
8
Fluorescence quantum yield and lifetime
The fluorescence quantum yield and lifetime are the two most important factors that
characterize a given fluorophore. Since intersystem crossing, internal conversion and various
excited-state reactions (vide infra) compete with fluorescence for deactivation of the lowest
excited singlet state of a molecule, not all potentially fluorescent molecules will return to the
ground state by fluorescence. The fraction of excited molecules that fluoresce is called the
quantum yield of fluorescence (ΦF) or fluorescence efficiency, and under given conditions of
temperature and environment is a physical constant of the excited molecular species. In terms
of rates of processes competing for deactivation of the lowest excited singlet state, ΦF is given
by equation 2.1,
where Γ is the rate of fluorescence emission, and knr is the sum of rate constants for all
radiationless processes.[3, 4]
In the absence of any non-radiative pathways, an excited molecule would achieve a
fluorescence quantum yield of unity. In practice, non-radiative loss is almost unavoidable in
molecular systems and variations in these decay processes can be used to probe changes in the
microenvironment of the fluorescent probe.
The reciprocal of Γ is called the fluorescence lifetime (τF) and describes the average time a
molecule spends in the excited state prior to returning to the ground state. As mentioned
above, excited state lifetimes for typical fluorophores are generally about 10 ns.[3, 4] The
fluorescence lifetime defines the time-scale of the interaction of the fluorophore with its
environment and hence governs the time window available for observing dynamic processes
monitored by the fluorophore.
Solvent effects
Solvents influence electronic spectra primarily through their polarity and hydrogen bonding
properties. When a solute molecule becomes more or less polar upon absorption of light, the
excited state may be more or less stabilized relative to the ground state, depending on the
polarity of the solvent. For example, a fluorescent species that becomes more polar upon
absorption, will in a polar solvent be more stabilized in the excited state than in the ground
state. The more polar the solvent, the more the fluorophore will be stabilized in the excited
state, and the energy of the emitted light will therefore decrease with increasing solvent
(2.1) Fnrk+Γ
Γ=Φ
2 Background ______________________________________________________________________________________________________
9
polarity. In other words, the more polar the solvent, the more will the emission shift to longer
wavelengths. Similarly, if the hydrogen bonding capacity of a solute molecule changes upon
excitation, the interaction of the excited state with the hydrogen-bonding solvent may
stabilize or destabilize the excited state relative to the ground state. Accordingly,
incorporation of a fluorophore, such as a fluorescent nucleic acid base analog, into nucleic
acids will affect the electronic spectra, since the environment in a DNA or RNA sequence is
less polar than water and equals more the polarity of an organic solvent like acetonitrile.
Solvent polarity and hydrogen-bonding electrostatic influences upon fluorescence spectra are
qualitatively similar to those upon absorption spectra. Solvent relaxation processes, however,
occur subsequent to absorption and nearly always tend to make fluorescence move to longer
wavelengths with increasing solvent polarity or hydrogen-bonding capacity.[3, 4]
pH influence
Potentially fluorescent molecules have lifetimes in the lowest excited singlet state of 10-11 to
10-7 s. Although these lifetimes are extremely short, some chemical reactions are fast enough
to compete with the photophysical processes that deactivate the excited molecule. Among the
ultrafast reactions are those of excited acidic fluorophores with basic species and of basic
excited fluorophores with acidic species in solution. Because the electron distributions are
different in the excited state from those in the ground state, the degree of acidity or basicity
may be very different for the same molecules in these two states. When acidity or basicity is
manifested in the excited state, competition of these chemical reactions with fluorescence of
the excited species often results in multiple luminescences from solutions in which only a
single species is directly excited. Often the fluorescence spectra will vary with the
concentration of proton acceptors or donors. The quantum yields of fluorescence and the
fluorescence decay profile will then vary with pH in a way that reflects the kinetics of the
reaction in the S1 state. Consequently, fluorescence spectroscopy represents a powerful tool
for the study of some of the most fundamental of chemical reactions.[4]
In this context, the proton-coupled electron transfer (PCET) should also be mentioned. PCET
is an important pathway of charge transport in a variety of biochemical, electrochemical, and
small-molecule organic and inorganic reactions.[9] It has been discussed, for example, for the
photosystem II oxygen evolving complex, whose function is to split water,[10] for the bacterial
reaction centers,[11] and for cytochrome c oxidase.[12] Shafirovich proposed a PCET
mechanism for complexes between nucleic acid bases in DNA and aromatic fluorophores
exhibiting strong fluorescence quenching of the latter by photoinduced electron transfer.[13]

2 Background ______________________________________________________________________________________________________
10
The electron transfer quenching in aqueous medium is proton coupled, as inferred from
isotope effects and the lack of quenching in nonaqueous solvent. The proton comes from the
hydrogen bonding solvent, but the microscopic steps are difficult to elucidate, because the
solvent contributes the proton.[9]
Quenching processes
Any process that decreases the fluorescence intensity of a sample (e.g. excited-state reactions,
molecular rearrangements, energy transfer or charge transfer) is called quenching.
Fluorescence may be quenched as a result of interaction of either the ground or excited state
of the luminescing species with other species in solution. Interaction between the quencher
and the potential fluorophore subsequent to excitation is called dynamic or collisional
quenching - as opposed to static quenching which is characterized by complexation between
the quencher and the potentially fluorescent species in the ground state. Dynamic quenching
takes place during the lifetime of the excited state at a rate governed by the diffusional
properties of the quencher and fluorophore, which means that the efficiency of dynamic
quenching is limited by the lifetime of the excited state of the potential fluorophore and the
concentration of the quenching species. The non-radiative process quenching competes
directly with the parallel reaction of fluorescence emission:
(2.3) )(Quenching *QM Q *M
(2.2) nce)(Fluoresce M *M
2
1
k
k
+→+
+→ hv
In these reactions, the excited molecule is defined as M* and the quencher is defined as Q.
The fluorescence quantum yield in the presence of a quenching agent can be calculated from
equations 2.2 and 2.3 as follows:
[ ][ ] [ ][ ] (2.4)
Q*Mk *Mk*Mk 21
1 F +
=Φ
[ ] [ ][ ][ ] [ ] (2.5) Q
kk 1
*MkQ*Mk *Mk1
1
2
1
21
F
+=+
=Φ
2 Background ______________________________________________________________________________________________________
11
Rewriting this term as an expression of the relative fluorescence (F0/F) gives the Stern-
Volmer equation (equation 2.6),
where F defines the measured fluorescence intensity, F0 is the initial fluorescence, k is the
bimolecular quenching constant, τ0 is the lifetime of the fluorescence and kD is defined as the
Stern-Volmer constant, with kD = k τ0.[3, 4, 14]
HOMO
HOMO
LUMO
LUMO
A*
A-
+
+
D
D+
+
+
+
+
A
A
A
A*
D*
D*
D*
D
Energy transfer
Charge transferElectron transfer
Electronexchange
Dipole-dipole
Holetransfer
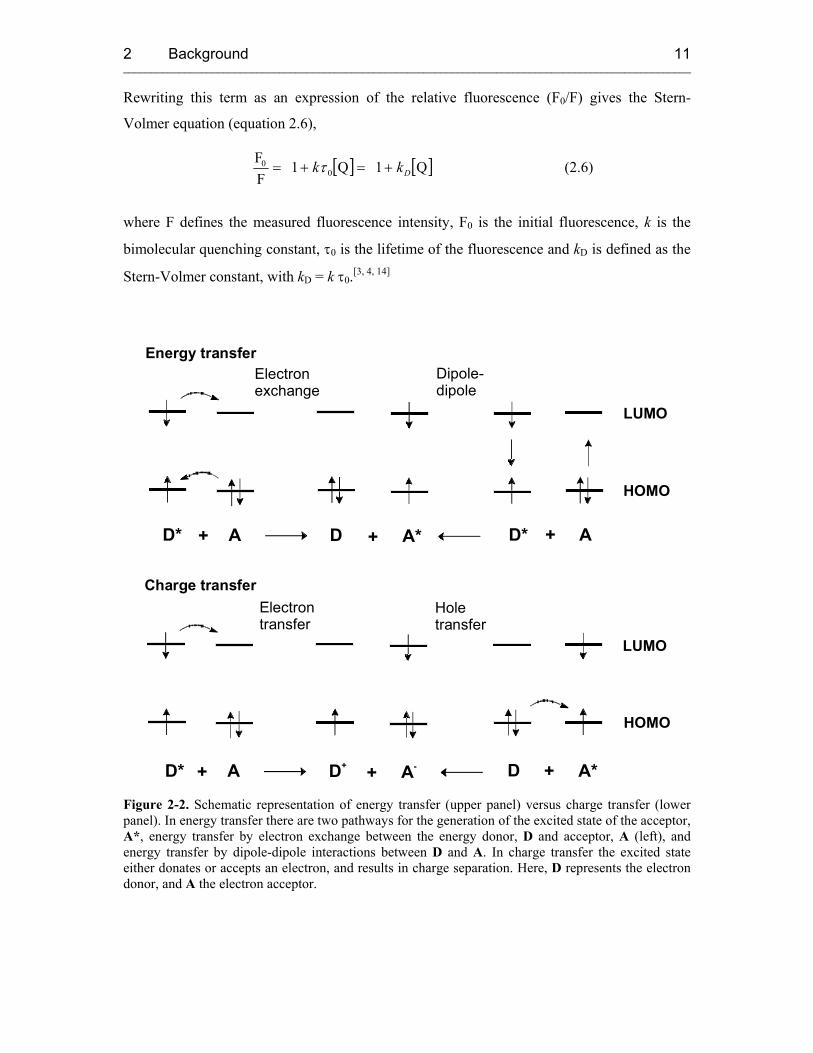
Figure 2-2. Schematic representation of energy transfer (upper panel) versus charge transfer (lower panel). In energy transfer there are two pathways for the generation of the excited state of the acceptor, A*, energy transfer by electron exchange between the energy donor, D and acceptor, A (left), and energy transfer by dipole-dipole interactions between D and A. In charge transfer the excited state either donates or accepts an electron, and results in charge separation. Here, D represents the electron donor, and A the electron acceptor.
[ ] [ ] (2.6) Q1 Q1 FF
00
Dkk +=+= τ
2 Background ______________________________________________________________________________________________________
12
Quenching generates reactive intermediates that rapidly undergo transformations to stable
products. In the case of energy transfer, when the quencher receives the excess energy of the
excited state, the quencher itself becomes excited (equation 2.3 and Figure 2-2) and
subsequently undergoes the same physical and chemical processes as if excited directly.
There are two pathways for energy transfer. Energy transfer by electron exchange requires
some overlap of the orbitals of the excited energy donor D* and the acceptor A. Energy
transfer can also take place via a long-range dipole-dipole interaction. In this case the
electronic transitions take place exclusively within D and A. In photoinduced charge transfer
(Figure 2-2), the excited state either donates an electron to or receives an electron from a
ground-state species, resulting in charge separation.[5]
Concentration Effects
The intensity of fluorescence does not increase linearly with absorber concentration, but
rather exponentially. This becomes already very obvious at absorber concentrations of 10-2M.
Only in the limit of extremely low absorber concentration (<10-4M) does the measured
fluorescence signal vary linearly with absorber concentration. At higher concentrations
solute-solute interactions may add to the nonlinearity of the luminescence intensity versus
absorber concentration curve.[4] The aggregation of an excited-state molecule with a ground-
state molecule produces an excited state complex ("exciplex"). A special case of exciplexes
occur if the excited-state and ground-state molecules are of the same kind, which is then
called an excited state dimer ("excimer"). This species is an emitting charge-transfer complex
that is held together by favorable orbital interactions as well as by Coulombic binding forces.
The exciplex can be regarded as a charge-transfer complex in which charge and electronic
excitation energy are shared by donor and acceptor molecules. Exciplexes are distinct
intermediates in their own right and possess unique properties. For instance, their
fluorescence is almost always at longer wavelengths (lower energy) than the fluorescence of
the excited state.[5] Energy transfer from an excited donor molecule to an originally unexcited
acceptor molecule becomes more probable with increasing solute concentration. There are
different mechanisms of intermolecular energy transfer: The exchange mechanism of
excitation energy transfer is a short range phenomenon. It is only significant, when the
orbitals of donor and acceptor overlap or the donor and acceptor molecule are separated by a
distance no greater than their collision diameter. When the donor and acceptor are in contact,
their highest energy electrons may change places causing the unexcited acceptor to become
excited and the excited donor to relax to the ground state (Figure 2-2, left). This energy

2 Background ______________________________________________________________________________________________________
13
transfer is most efficient when the energy of the fluoresence of the donor lies close to the
energy of the absorption spectrum of the acceptor.[4]
Fluorescence resonance energy transfer (FRET) is a comparatively long-range phenomenon
and depends on: (i) the overlap of the emission spectrum of the donor chromophore with the
absorption spectrum of the acceptor chromophore; (ii) the orientation of the donor and the
acceptor transition dipoles; and (iii) the distance between the donor and the acceptor
chromophores. In other words, FRET requires a transition dipole-dipole interaction between
the two chromophores which makes the efficiency of energy transfer dependent on the
distance and orientation between the two chromophores (Figure 2-2, right). The direct
correlation of measurable FRET efficiency with the distance between the two chromophores
has made FRET one of the most extensively used fluorescence quenching mechanisms for
characterizing macromolecules. FRET efficiency is derived from Förster theory[15, 16] and is
given by equation 2.7, which defines the transfer rate, kT,
(2.7) 1 60
−
=
rRk
dT τ
where R0 (the Förster distance) is the distance for 50% efficiency of energy transfer and is an
inherent characteristic of the donor-acceptor pair and the medium between them, τd is the
lifetime of the donor in the absence of the acceptor and r is the distance between the
fluorophores, with the transition dipole interaction assumed to be the same for both r and R0.
At the Förster distance, the transfer rate is equal to the inverse decay rate of the donor
( 1−= dTk τ ). FRET serves as an extremely useful measure of distances between groups in
macromolecules in a range between 10 and 90 Å. FRET efficiency, E, can be described as a
function of R0 (equation 2.8) and can be monitored using a change in donor lifetime (equation
2.9) or intensity (equation 2.10),
(2.8) 660
60
rRRE+
=
(2.9) 1
−=
d
daEττ
(2.10) 1
−=
d
da
IIE
2 Background ______________________________________________________________________________________________________
14
where τda is the lifetime of the donor in the presence of the acceptor, τd is the lifetime of the
donor in the absence of the acceptor, Ida is the intensity of the donor in the presence of the
acceptor and Id is the intensity of the donor in the absence of the acceptor. Similarly, FRET
efficiency can be monitored as a function of acceptor lifetime or intensity.[3]
2.1.2 Investigations of Nucleic Acid Interactions Using Fluorescence Spectroscopy
Fluorophores can be divided into intrinsic and extrinsic fluorophores. Instrinsic fluorophores
are those which occur naturally in a given sample, for example the aromatic amino acids
tryptophan, tyrosine and phenylalanine in proteins. The intrinsic fluorescence of the naturally
occurring nucleotide bases (guanine (G), adenine (A), thymine (T), uracil (U) and cytosine
(C)) in DNA and RNA is extremely weak.[17] These bases exhibit very short fluorescent
decay times, generally in the range of a few picoseconds, and do not provide much structural
information since signals are normally averaged over all bases in the oligonucleotide
sequence.[18-20] Thus, in contrast to proteins, RNA and DNA molecules in general lack
naturally occurring intrinsic fluorescent reporters. An advantage of the absence of natural
fluorescence from DNA and RNA molecules, however, is that fluorescent signals from
unnatural nucleotide base analogs can be observed without any competing background signal.
Extrinsic fluorophores are those that are added to a sample that does not display the desired
spectral properties. Useful fluorescent probes should display high fluorescence intensity that
is sensitive to its microenvironment, it should be stable during continued illumination and
non-perturbing to the structure of the macromolecule or the process being observed.[3]
Fluorescence measurements can be typically made in two ways. Steady-state measurements
are measured with constant irradiation and observation. Due to the nanosecond timescale of
fluorescence most measurements are made under these conditions, and normally when a
sample is photoexcited, the steady-state condition, i.e. the equilibrium situation between
excitation and decay for the system is reached almost immediately. In contrast, time-resolved
measurements involve the monitoring of a temporal dependence of a given fluorescence
parameter, like emission intensity, lifetime or anisotropy. For these experiments the sample is
exposed to a pulse of light that is shorter than the decay time of the sample and measurements
are then made using a high-speed detection system capable of making discrete observations
within a nanosecond time regime. Time-resolved experiments can provide novel information
about the shape of the macromolecule and its flexibility or multiple conformations which may
2 Background ______________________________________________________________________________________________________
15
not be observed in steady-state measurements due to averaging processes. Nevertheless, the
experimental setup of time-resolved measurements is far more complex and thus experiments
based on steady-state fluorescence measurements are much more widely used.
Fluorescent labeling of nucleic acids has found its use in a number of applications that
previously required radioisotope labeled samples, like DNA sequencing,[21, 22] fluorescence in
situ hybridization (FISH),[23-26] polymerase chain reaction (PCR),[27, 28] etc. Changes in the
fluorescent properties (intensity, anisotropy, lifetime) of the chosen fluorophore which are
observed between the fluorescent species alone versus in complexes can be used to examine
macromolecular interactions. Especially nucleotide base analogs have been exploited to
measure the equilibrium binding kinetics of molecular interactions involving nucleic acids,[29-
38] to unravel folding pathways,[39-43] and to study the basics of energy transfer[44, 45] and
charge transfer through DNA.[46-48]
2.1.3 Fluorescent and Chemical Properties of the Nucleotide Base
Analogs Used in this Thesis
Since naturally occurring nucleotide bases do not display any significant fluorescence,
fluorescent nucleotide base analogs were developed that can be inserted into RNA and DNA
sequences as quasi-intrinsic probes. A number of nucleotide base analogs are well-
characterized for incorporation into oligonucleotides for biophysical and biochemical
studies.[49-61] In the present work, two nucleotide base analogs were used, namely 2-
aminopurine and 5-(1-pyrenylethynyl)-2'-deoxyuridine. In the following section the properties
of these fluorophores will be described.
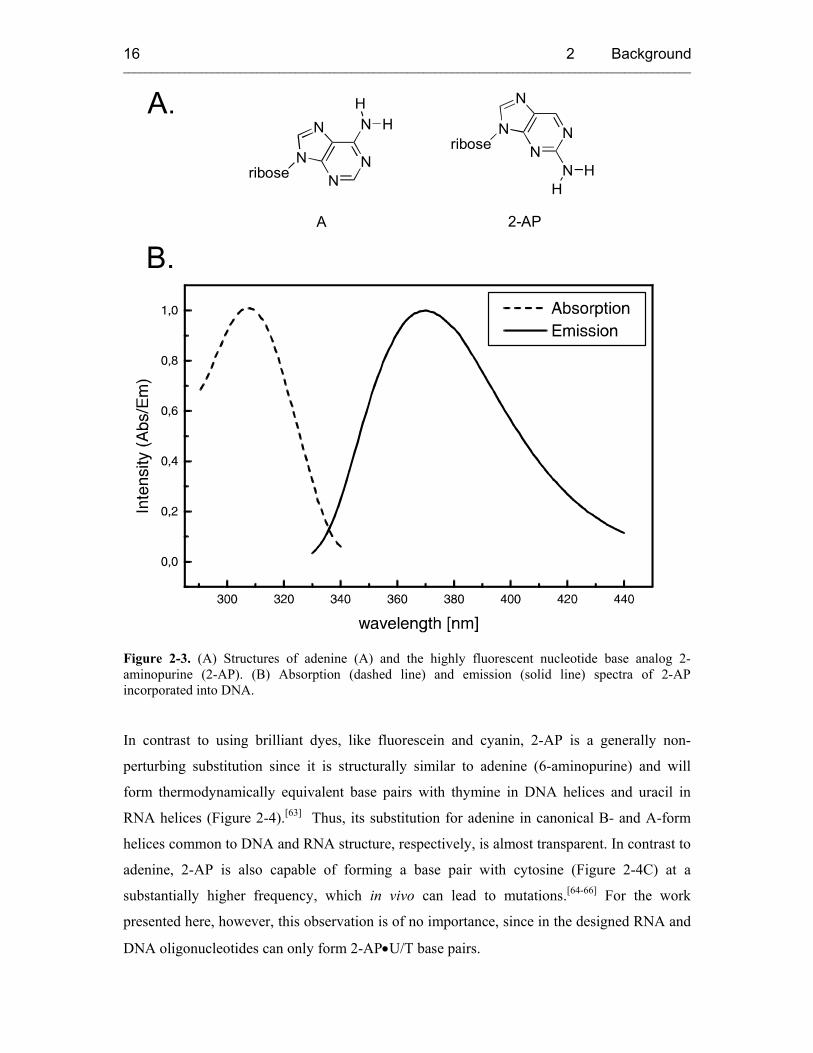
2-aminopurine (2-AP). More than 30 years ago, Stryer and colleagues[49] first demonstrated
that 2-AP (Figure 2-3A), a structural isomer of adenine (A), was strongly fluorescent and
could be selectively excited in the presence of natural bases. Since the lowest excited single
state of Ap, has a π-π* character,[62] its absorption maximum is red-shifted compared to
natural nucleotide bases and lies around 305 nm and its emission spectrum is centered at 370
nm (Figure 2-3B).
2 Background ______________________________________________________________________________________________________
16
NN
N
N
N
ribose
HH
NN
N
N N
ribose
HH
A 2-AP
A.
B.
Figure 2-3. (A) Structures of adenine (A) and the highly fluorescent nucleotide base analog 2-aminopurine (2-AP). (B) Absorption (dashed line) and emission (solid line) spectra of 2-AP incorporated into DNA.
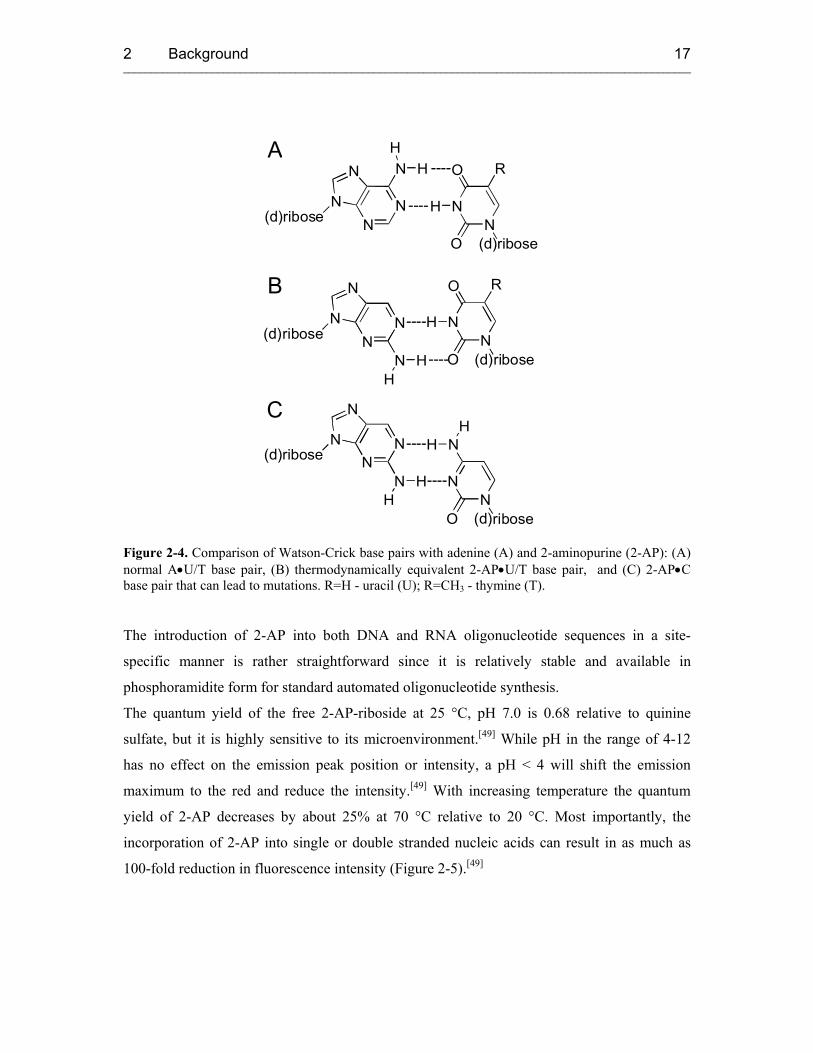
In contrast to using brilliant dyes, like fluorescein and cyanin, 2-AP is a generally non-
perturbing substitution since it is structurally similar to adenine (6-aminopurine) and will
form thermodynamically equivalent base pairs with thymine in DNA helices and uracil in
RNA helices (Figure 2-4).[63] Thus, its substitution for adenine in canonical B- and A-form
helices common to DNA and RNA structure, respectively, is almost transparent. In contrast to
adenine, 2-AP is also capable of forming a base pair with cytosine (Figure 2-4C) at a
substantially higher frequency, which in vivo can lead to mutations.[64-66] For the work
presented here, however, this observation is of no importance, since in the designed RNA and
DNA oligonucleotides can only form 2-AP•U/T base pairs.
2 Background ______________________________________________________________________________________________________
17
NN
O
O
R
H
ribose
NN
N
O
HH
ribose
NN
O
O
R
H
ribose
NN
N
N
N
ribose
HH
NN
N
N
N
ribose
HH
NN
N
N N
ribose
HH
----
----
----
----
----
----A
B
C
(d)
(d)
(d)
(d)
(d)
(d)
Figure 2-4. Comparison of Watson-Crick base pairs with adenine (A) and 2-aminopurine (2-AP): (A) normal A•U/T base pair, (B) thermodynamically equivalent 2-AP•U/T base pair, and (C) 2-AP•C base pair that can lead to mutations. R=H - uracil (U); R=CH3 - thymine (T).
The introduction of 2-AP into both DNA and RNA oligonucleotide sequences in a site-
specific manner is rather straightforward since it is relatively stable and available in
phosphoramidite form for standard automated oligonucleotide synthesis.
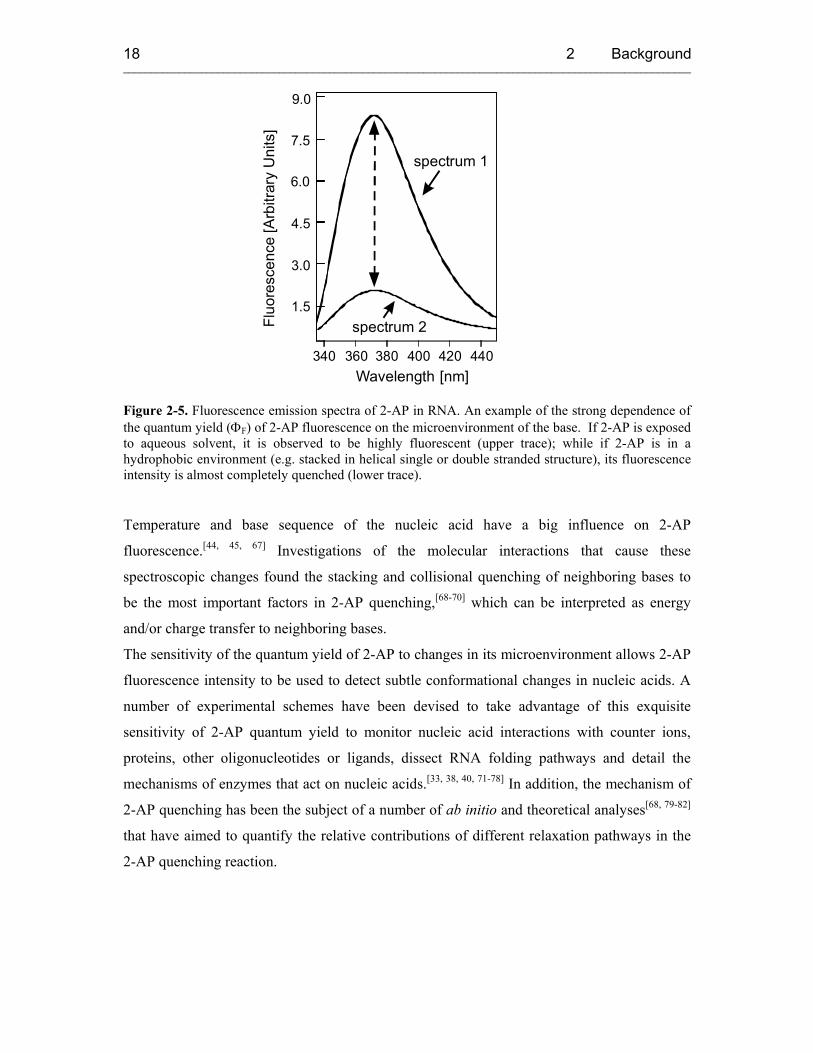
The quantum yield of the free 2-AP-riboside at 25 °C, pH 7.0 is 0.68 relative to quinine
sulfate, but it is highly sensitive to its microenvironment.[49] While pH in the range of 4-12
has no effect on the emission peak position or intensity, a pH < 4 will shift the emission
maximum to the red and reduce the intensity.[49] With increasing temperature the quantum
yield of 2-AP decreases by about 25% at 70 °C relative to 20 °C. Most importantly, the
incorporation of 2-AP into single or double stranded nucleic acids can result in as much as
100-fold reduction in fluorescence intensity (Figure 2-5).[49]
2 Background ______________________________________________________________________________________________________
18
Fluo
resc
ence
[Arb
itrar
y U
nits
]
Wavelength 380360
3.0
340
1.5
4.5
7.5
6.0
9.0
spectrum
440[nm]420400
2
spectrum 1
Figure 2-5. Fluorescence emission spectra of 2-AP in RNA. An example of the strong dependence of the quantum yield (ΦF) of 2-AP fluorescence on the microenvironment of the base. If 2-AP is exposed to aqueous solvent, it is observed to be highly fluorescent (upper trace); while if 2-AP is in a hydrophobic environment (e.g. stacked in helical single or double stranded structure), its fluorescence intensity is almost completely quenched (lower trace).
Temperature and base sequence of the nucleic acid have a big influence on 2-AP
fluorescence.[44, 45, 67] Investigations of the molecular interactions that cause these
spectroscopic changes found the stacking and collisional quenching of neighboring bases to
be the most important factors in 2-AP quenching,[68-70] which can be interpreted as energy
and/or charge transfer to neighboring bases.
The sensitivity of the quantum yield of 2-AP to changes in its microenvironment allows 2-AP
fluorescence intensity to be used to detect subtle conformational changes in nucleic acids. A
number of experimental schemes have been devised to take advantage of this exquisite
sensitivity of 2-AP quantum yield to monitor nucleic acid interactions with counter ions,
proteins, other oligonucleotides or ligands, dissect RNA folding pathways and detail the
mechanisms of enzymes that act on nucleic acids.[33, 38, 40, 71-78] In addition, the mechanism of
2-AP quenching has been the subject of a number of ab initio and theoretical analyses[68, 79-82]
that have aimed to quantify the relative contributions of different relaxation pathways in the
2-AP quenching reaction.
2 Background ______________________________________________________________________________________________________
19
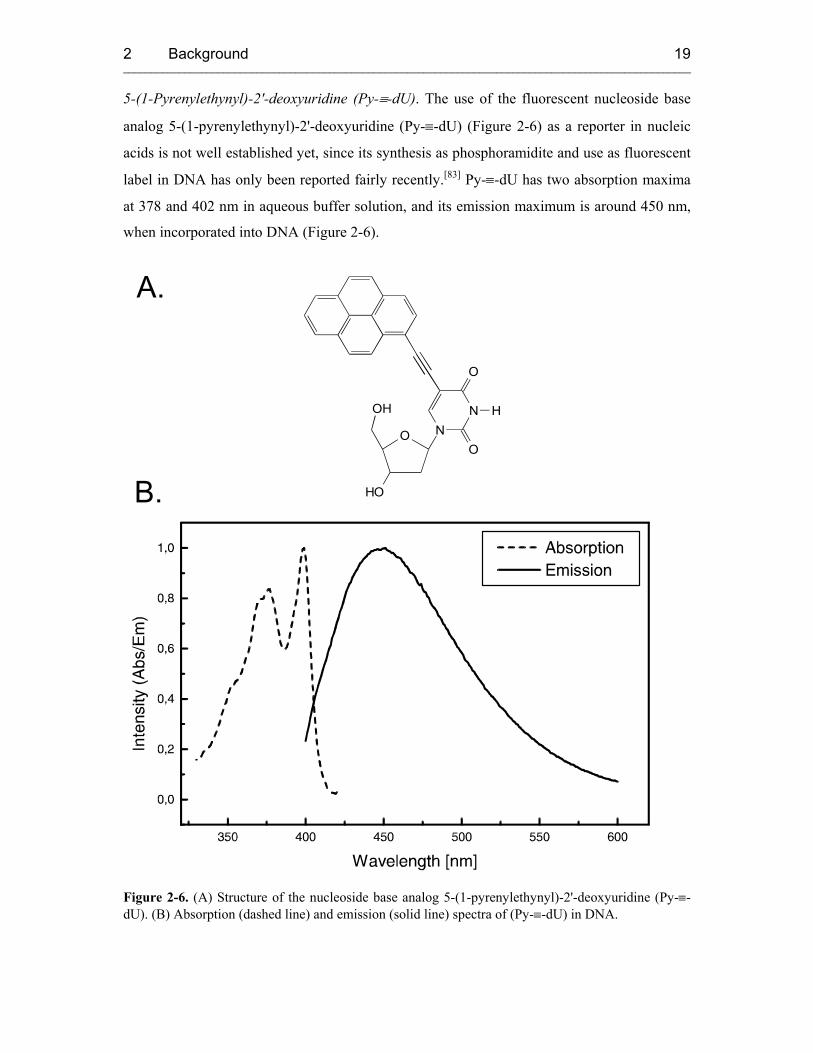
5-(1-Pyrenylethynyl)-2'-deoxyuridine (Py-≡-dU). The use of the fluorescent nucleoside base
analog 5-(1-pyrenylethynyl)-2'-deoxyuridine (Py-≡-dU) (Figure 2-6) as a reporter in nucleic
acids is not well established yet, since its synthesis as phosphoramidite and use as fluorescent
label in DNA has only been reported fairly recently.[83] Py-≡-dU has two absorption maxima
at 378 and 402 nm in aqueous buffer solution, and its emission maximum is around 450 nm,
when incorporated into DNA (Figure 2-6).
A.
B.
NN
O
O
H
O
HO
OH
Figure 2-6. (A) Structure of the nucleoside base analog 5-(1-pyrenylethynyl)-2'-deoxyuridine (Py-≡-dU). (B) Absorption (dashed line) and emission (solid line) spectra of (Py-≡-dU) in DNA.
2 Background ______________________________________________________________________________________________________
20
Fluorescence intensity of Py-≡-dU increases by several fold in double stranded DNA
compared to single stranded and shows a pronounced bathochromic shift.[83] Emission also
increases in single stranded oligonucleotides when a second or third Py-≡-dU unit is inserted
into the sequence adjacent to the first one, which again involves a strong shift of the emission
spectrum to the red. On the other hand, duplex formation of the doubly or triply labeled DNA
oligomers does not induce an increase in fluorescence intensity, but rather a decrease, and the
shift of the emission peak to the red is reduced compared to the mono-substituted duplex.
Unfortunately, this observation is not very well understood. A possible explanation for the red
shift of the fluorescence emission in the multiply labeled single stranded oligonucleotides
might be the formation of excimers between the pyrene nucleoside base analogs, but this does
not explain the emission increase or red shift upon duplex formation. It seems that the Py-≡-
dU moiety forms exciplexes with other neighboring bases, since the fluorophore with the
conjugated pyrenylethynyluracil system is partially stacked in nucleic acid duplexes and
hence preorganized in a state suitable for exciplex formation.[83] Such sensitivity of the Py-≡-
dU residue to the structural surroundings makes this nucleoside potentially useful in probing
various interactions of nucleic acids. Also, the Watson-Crick base pairing (i.e. hydrogen
bonding) properties of the uracil have not been changed by attaching the ethynylpyrene
moiety, and the introduction of Py-≡-dU should not significantly perturb nucleic acid
complexes, since the sterically rigid substituent at position 5 of uracil is directed into the
major groove of the duplex.[84, 85] Taken together the Py-≡-dU group seems to be a promising
fluorescent label for studying interactions involving nucleic acids, such as formation of
nucleic acid complexes and binding to enzymes and other proteins.
It should be pointed out that a structurally very similar compound, 5-(pyren-1-yl)-2'-
deoxyuracil (Py-dU), has been incorporated into DNA duplexes to study DNA-mediated
electron transfer.[2] Based on these reports, it can be concluded that upon photoexcitation Py-
≡-dU should also be able to act as an electron donor into the base stack and therefore might be
a useful probe for the investigation of reductive electron transfer in DNA.
Py-≡-dU is not commercially available as phosphoramidite and synthesis of Py-≡-dU as
phosphoramidite involves several steps with a relatively low overall yield. In the present
work, a new and more efficient way of incorporating Py-≡-dU into DNA using a Pd(0)-
catalyzed Sonogashira cross-coupling reaction will be described.
2 Background ______________________________________________________________________________________________________
21
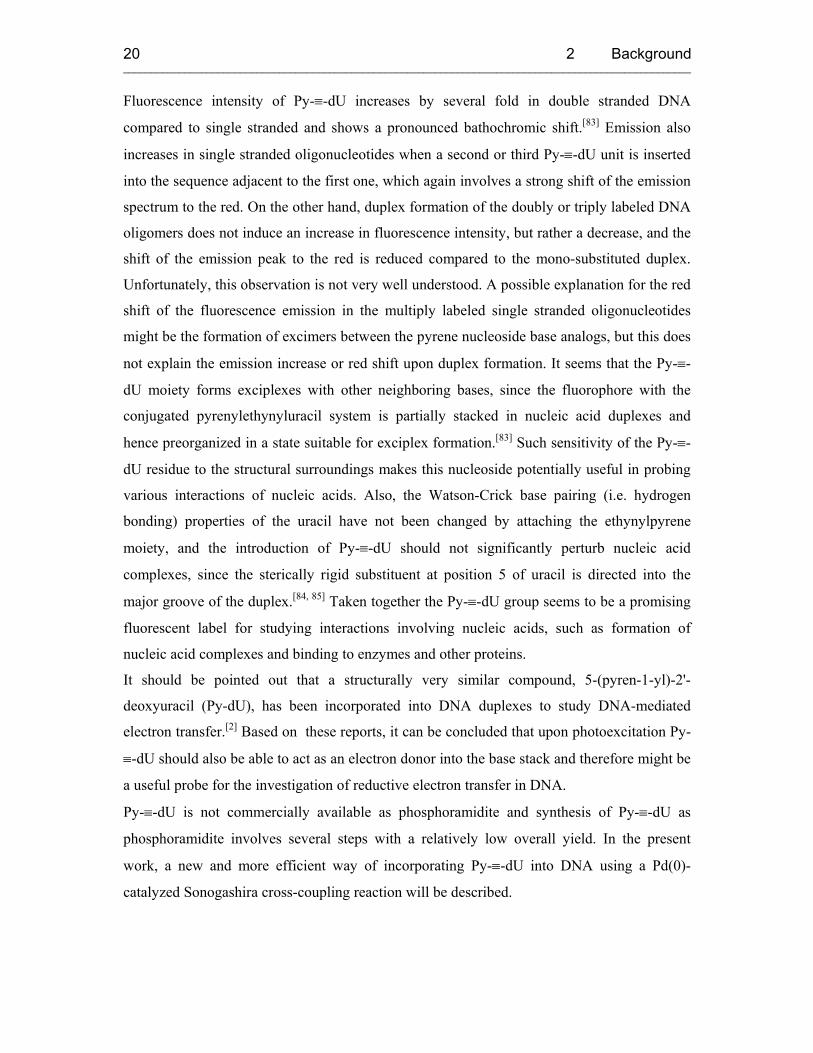
2.2 Time-resolved Transient Absorption Spectroscopy
Time-resolved transient absorption spectroscopy, which is also called pump-probe
spectroscopy, allows observation of population and depopulation of electronic states of
absorbing molecules with a time-resolution down to 50 fs, thus also allowing the observation
of intermediate states. The drawback of this high time-resolution is, that a relatively large
amount of sample is needed, because of the comparatively low sensitivity of the
measurements.[86]
In general, in this method the fluorophore is excited by a short laser pulse (pump pulse) in the
absorption band of the molecule. A second independent pulse with an arbitrary wavelength
(probe pulse) is applied with different time delays, and can probe different states of the
fluorophore by measuring their intermittent absorption (Figure 2-7).
1. If the probe pulse is in the wavelength range of the ground-state absorption, the rate of
back charge transfer can be determined.
2. If the probe pulse is in the wavelength range of the fluorescence, stimulated emission
will occur, and the depopulation of the excited state S1 can be observed.
3. If the probe pulse is outside the fluorescence band, the probability of population of
any intermediate state, such as a charge separated state, can be measured.
E E
hν (λexc)
„pump“
kCT
kBCT
D*
D
D-A+
oder D+A-
hν „probe“
kCT
kBCT
D*
D
D-A+ oder D+A-
hν (λexc)
„pump“
hν „probe“
Figure 2-7. Transient absorption measurements with pump probes outside the fluorescence band.
Based on the resulting time-courses, the lifetimes of the individual states can be determined.
The absorption of a sample with and without previous excitation is measured and the change
of optical density is plotted against time. Depending on the observed processes, absorption,
stimulated emission, bleaching and recovery of the ground-state, the values may be positive
or negative. Amplitudes and time constants of the resulting spectra yield the rates of the
fluorescence, charge separation and charge recombination.[86]

2 Background ______________________________________________________________________________________________________
22
2.3 Antisense RNA Systems
A gene is a coded blueprint for a protein. The code is written in the precisely ordered
sequence of four nucleotide bases, A, T, G, C, that make up DNA. In addition to the covalent
linking of the bases in a DNA strand, A can form two hydrogen bonds with T and G can form
three hydrogen bonds with C to make up the typical double helix-structure of DNA. One
strand containing the 'sense' sequence (genetic code) base-pairs with an 'antisense' sequence
(complementary sequence in the opposite direction) of the second strand. The high specificity
of base pairing is important during DNA replication, where each of the two strands serves as a
template for reconstructing its partner (Figure 2-8). Base pairing specificity is also important
when genetic information is decoded to make proteins. First, DNA is transcribed into RNA,
which is made of the same bases as DNA, except for T, which is replaced by a U. The RNA
molecule that is assembled is antisense to the antisense DNA strand, i.e. it bears the sense
sequence. From this so called messenger RNA molecules proteins are then formed on the
molecular machinery of the ribosomes.[87]
Figure 2-8. Schematic representation of the route from gene to gene product. The coding sense and the antisense strand of DNA complement each other. During the transcription of DNA into RNA, the antisense DNA strand acts as a template for assembling a complementary (sense) messenger RNA molecule. A single-stranded messenger RNA is translated into a protein in the ribosome. However, some genes are regulated by additional transcription of an antisense RNA from the sense DNA strand to prevent translation.
It has been known for a long time that gene expression in both prokaryotes and eukaryotes is
controlled by proteins. In prokaryotes, however, regulatory RNA has also been found. This
regulatory RNA contains a sequence that is complementary to the target RNA, usually a
messenger RNA. Binding of the two RNAs occurs by base pairing, resulting in a fairly stable
2 Background ______________________________________________________________________________________________________
23
complex, so that the target RNA cannot perform its function anymore. Antisense RNA has
been identified in the regulation of diverse and complex phenomena in bacteria such as
plasmid replication, osmoregulation of porin expression, and regulation of phage
reproduction.[88]
Bacterial plasmid replication control systems have been studied in detail. In bacteria genetic
information is encoded in one circular double stranded DNA molecule, the chromosome. In
addition, bacteria often contain extrachromosomal elements called plasmids. They also
contribute to the phenotype of their hosts, for example, by coding for antibiotic resistance,
virulence factors, and catabolic functions. Plasmids control their own replication and are
present at defined copy numbers (plasmid molecules per cell) that are determined by the
plasmids, the host and the growth conditions.[89] Generally, this strong regulation is achieved
by antisense RNA and is based on kinetics, like the rates of synthesis and decay of sense and
antisense element, efficiency of replication and kinetics of the interaction between sense and
antisense element. It seems that a fast rate for complex formation is more important than
binding equilibria.[90]
Regulation or inhibition of gene activity with antisense RNA seems to be universal among
viruses and bacteria.[87] The efficiency of the gene regulation by antisense RNA in nature led
to the development of systems in which artificially constructed antisense genes regulate a
cellular or viral gene of interest. This principle can be used for genetic research, for example
to turn off a gene selectively to study the effects of the defect analogous to a mutation,[87] and
it also led to the idea of using the antisense approach in drug design, i.e. to block the genetic
code to inhibit gene expression associated with diseases. The advantage of using antisense
RNA as gene regulators is the high specificity of binding. For a ligand to bind specifically to a
target sequence in a nucleic acid, it has to base pair with a certain number of nucleotides
depending on the size of the genome. For example, based on the assumption of a statistical
distribution of base pairs in the genome and the same number of A-T and G-C base pairs, the
minimal number of bases that have to be recognized is 7 in the HIV, 12 in E. coli, and 17 in
human DNA.[91]
Studying natural antisense control systems, like the plasmid replication system ColE1, might
help to understand the structural and kinetic basis for how nature has evolved such an
efficient regulatory control system.
2 Background ______________________________________________________________________________________________________
24
2.4 Energy and Charge Transfer in DNA
2.4.1 Excited State Energy Transfer
Understanding the electronic properties of DNA has been the goal of various experimental
and theoretical studies over the last decades. With respect to the biological consequences,
such as mutagenesis, apoptosis and carcinogenesis,[92-94] most effort by far was spent on the
investigation of charge migration processes through the base stack.[95] Although
photoinduced charge transfer is initiated by electronic excitation, no clear picture has yet
emerged of how to describe excitation energy in duplex DNA. A key question which is
crucial for the mechanism of various photoreactions in DNA is whether excited singlet states
of DNA bases are localized or extended over several neighboring bases. Ever since the
pioneering work of Eisinger et al. in 1966,[96, 97] who showed clear evidence for excimer
emission between nucleosides at low temperature, excimers and exciplexes have been
invoked in discussions on nucleic acid components.[17, 96-102] Very recently, Xu and Nordlund
reported the sequence, temperature, concentration and solvent dependence of singlet energy
transfer from normal bases to the base analog 2-aminopurine measured by optical
spectroscopy.[44] They found that adenine was the most efficient energy donor by an order of
magnitude, but conclude that energy transfer at physiological temperatures over more than a
few bases is improbable. The main experimental obstacles which have so far prevented a
systematic investigation of this matter at room temperature are related to the intrinsic
properties of DNA:[103] a) The lowest absorption bands of all four nucleosides are very broad
and overlap strongly in the UV region. Monomer and excimer emission cannot be separated
because of considerable spectral overlap. b) The collective properties of duplex DNA depend
on its base sequence, and therefore only studies with well-defined reference assemblies are
meaningful. c) The natural nucleic acids have very low fluorescence quantum yields due to
ultra short excited state lifetimes, which complicate emission band shape analysis. Only
recently has femtosecond transient absorption spectroscopy been used to study the
photophysical properties of bases and nucleosides.[104-107]
2.4.2 Charge Transfer
Shortly after Watson and Crick discovered the double helical structure of DNA,[108] the
possibility that the one-dimensional array of π-stacked base pairs in B-form DNA might serve
as a pathway for charge migration was suggested over 40 years ago.[109] Since then, many
2 Background ______________________________________________________________________________________________________
25
scientists put their effort into proving this possibility, and the fundamental question if DNA
serves as a medium for long-range charge transfer (CT) was discussed very controversially.
quencherReduced
fluorophoreOxidized
quencher
fluorophore
Electron-poor
Excited
••* -A++D+ AD
LUMO
HOMOHOMO
LUMO
quencherOxidized
fluorophoreReduced
quencher
fluorophore
Electron-rich
Excited
••* - A+ +D+ AD
LUMO
HOMO
HOMO
LUMO
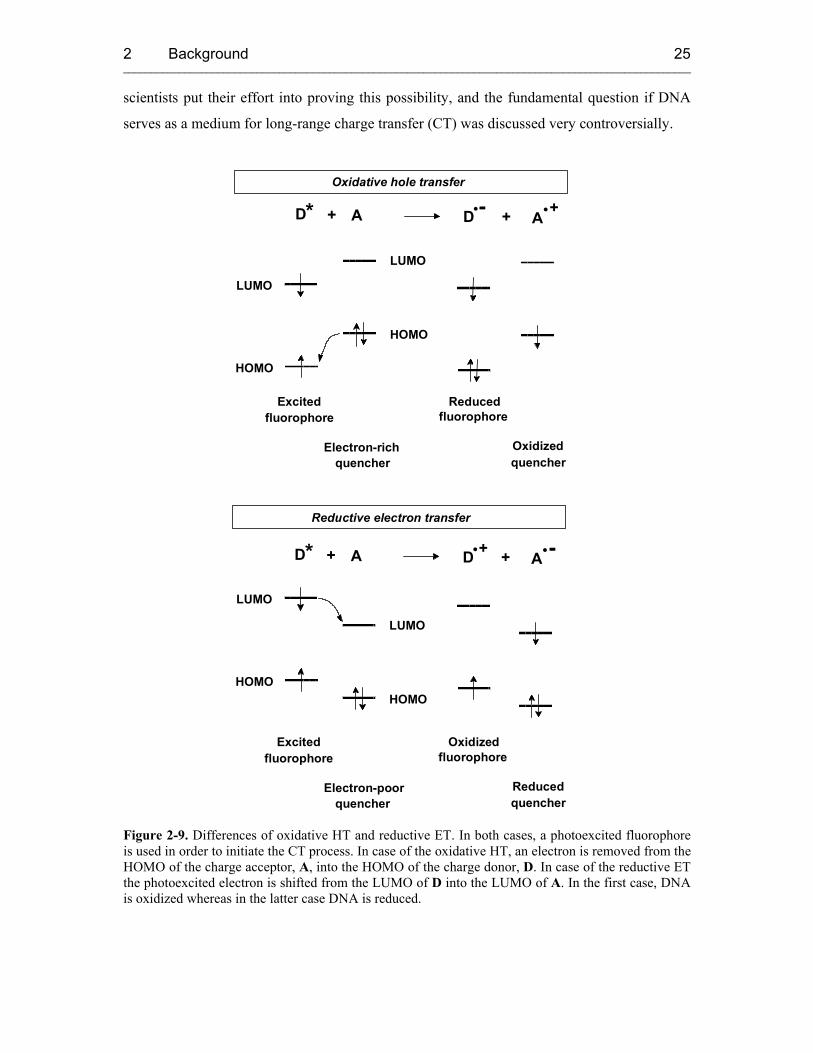
Oxidative hole transfer
Reductive electron transfer
Figure 2-9. Differences of oxidative HT and reductive ET. In both cases, a photoexcited fluorophore is used in order to initiate the CT process. In case of the oxidative HT, an electron is removed from the HOMO of the charge acceptor, A, into the HOMO of the charge donor, D. In case of the reductive ET the photoexcited electron is shifted from the LUMO of D into the LUMO of A. In the first case, DNA is oxidized whereas in the latter case DNA is reduced.
2 Background ______________________________________________________________________________________________________
26
The proposals ranged from DNA being a molecular wire[110] to DNA being an insulator.[111]
By now, it is generally accepted that charge transfer in DNA can occur on an ultrafast
timescale and over long distances.
In general there are two possibilities for CT in DNA:
1. The DNA is oxidized, i.e. an electron is abstracted from the DNA, and a radical with a
positive charge (hole) is generated in the DNA strand. The charge can be transferred through
the base stack. This process can be considered as an oxidative hole transfer (HT) (see Figure
2-9). This positively charged radical may also react with surrounding molecules, like water or
oxygen, and result in oxidative damage to the DNA which in turn can cause mutagenesis and
carcinogenesis.[92, 93, 112-114] Because of the relevance of HT to oxidative damage in DNA a
large number of research groups have focused their work on the photochemically or
photophysically induced oxidation of DNA, and furthermore, on the mobility of the created
positively charged radical in the DNA.
2. The DNA is reduced, i.e. an excess electron is injected into the DNA, and a radical
with a negative charge is generated in the DNA strand. The charge can be transferred through
the DNA. This process can be considered as a reductive electron transfer (ET) (Figure 2-9).
Although ET processes are currently used in DNA chip technology[115-119] and DNA
nanotechnology[120-123], and despite the broad knowledge about these bioanalytical and
biomedical applications, little is known about the behavior of excess electrons in DNA.
2.4.2.1 Mechanisms of Hole Transfer
Several mechanisms, such as the superexchange and the hopping mechanism, have been
proposed, and experimentally verified.[95, 124-127] The two main mechanisms shall be
summarized in the following section.
2.4.2.1.1 Superexchange Mechanism
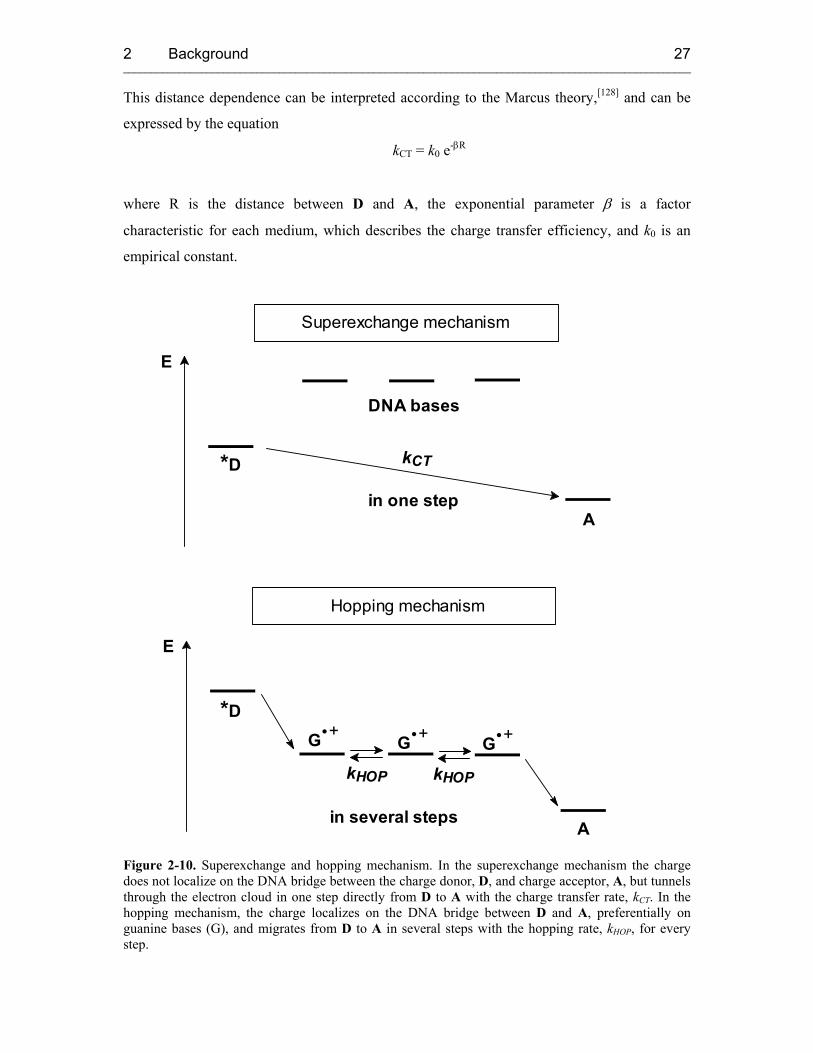
The charge tunnels in one coherent step from D (charge donor) to A (charge acceptor) and
never resides on the DNA bridge between them (Figure 2-10). As a consequence, no
observable radicals of nucleobases in the bridge exist, and only educt and product radicals can
be observed. The probability of the tunneling process depends on the energy difference of D
and A and on the length of the DNA bridge between them. An exponential decrease of the
charge transfer rate (kCT) with the distance between D and A is characteristic for this process.
2 Background ______________________________________________________________________________________________________
27
This distance dependence can be interpreted according to the Marcus theory,[128] and can be
expressed by the equation
kCT = k0 e-βR
where R is the distance between D and A, the exponential parameter β is a factor
characteristic for each medium, which describes the charge transfer efficiency, and k0 is an
empirical constant.
E
G +•G +••+
in several steps
kHOPkHOP
*DG
A
DNA bases
in one step
kCT
E
A
*D
Superexchange mechanism
Hopping mechanism
Figure 2-10. Superexchange and hopping mechanism. In the superexchange mechanism the charge does not localize on the DNA bridge between the charge donor, D, and charge acceptor, A, but tunnels through the electron cloud in one step directly from D to A with the charge transfer rate, kCT. In the hopping mechanism, the charge localizes on the DNA bridge between D and A, preferentially on guanine bases (G), and migrates from D to A in several steps with the hopping rate, kHOP, for every step.
2 Background ______________________________________________________________________________________________________
28
The smaller the value for β, the weaker the distance dependence of the charge transfer rate.
Values of β for CT through proteins lie in the range of 1.0-1.4 Å-1.[129-131] In contrast, β values
determined for CT reactions in DNA can be found in a wide range from β < 0.1 Å-1 up to β =
1.5 Å-1 (Table 2-1).[95, 132] Typical values for charge transfer following a superexchange
mechanism are about 0.7 Å-1. For β-values much smaller than that, an alternative mechanism
has to be considered.
2.4.2.1.2 Hopping Mechanism
The occurrence of very small β values (≤ 0.1 Å-1) exhibiting a very shallow distance
dependence led to the description of an alternative mechanism which is the hopping model. In
contrast to the previously described superexchange mechanism, the positive charge is
transported from D to A in several steps, once it has been injected into the DNA base stack,
and can finally be trapped at a suitable charge acceptor (Figure 2-10). The charge localizes on
bases in the bridge, and radical cation nucleobases other than D and A can be observed as
intermediates. Among the four different DNA bases, guanine can be most easily oxidized.[133,
134] Hence, the G radical cation plays the role of the intermediate charge carrier during the
hopping process. Each hopping step is itself a tunneling process through the intervening A-T
base pairs. In contrast to the superexchange mechanism, the rate of HT by hopping does not
depend on the overall distance between D and A but is only dependent on the number of
hopping steps.[135] Lewis et al. were able to measure the rate for a single hopping step from G
to GG with a hopping rate kHOP = 5 × 10⁷ s-1.[136]
2.4.2.2 Experimental Techniques for Charge Transfer Detection
A lot of different techniques have been used to explore DNA-mediated CT processes, among
these are biochemical methods and spectroscopic measurements. Most experiments were
performed according to the following steps:[95]
1. Labeling of DNA with redoxactive probes through intercalation and/or
covalent linkages.
2. Initiation of CT by photochemical or electrochemical techniques
3. Detection of CT processes by spectroscopic, electrochemical, or biochemical
methods.

2 Background ______________________________________________________________________________________________________
29
2.4.2.2.1 Oxidative Hole Transfer
For the study of oxidative HT a number of model systems have been developed using a
variety of organic and inorganic intercalators or nucleic acid base analogs as charge donors
and acceptors. Usually by absorption of light, the charge donor will be raised into an
electronically excited state, which enables the initiation of charge transfer. According to the
method of detection of the HT process, one can divide most published experiments into
spectroscopic and biochemical studies.
Spectroscopic studies. Organic and inorganic intercalators which have not been covalently
attached to oligonucleotides were first reported for studying CT in DNA. These experiments
provide only little information because of the lack of an accurate measurement of the distance
between the D and A as well as the possibility of the pairing of the intercalators. The
significant experimental improvement came with the DNA assays bearing covalently linked
intercalators. Using these systems, a systematic measurement of the distance dependence and
the base sequence dependence was possible. The spectroscopic techniques that are applied for
the measurement of charge transfer processes are usually time-resolved fluorescence
spectroscopy or time-resolved transient absorption spectroscopy. The most important
spectroscopic studies with a variety of charge donors and acceptors are summarized in Table
2-1.
Biochemical experiments. The G radical cation was identified to be the precursor of a variety
of different oxidative G lesions which are normally described as Gox. Some of these G
oxidation products have been identified (Figure 2-11).[114, 137] Biochemical experiments
explore HT reactions through DNA by an indirect method. As described above, after the
photochemical or photophysical oxidation of DNA using a suitable intercalator, G is
preferentially oxidized. The resulting G radical cation can react with H2O and/or O2 yielding
oxidized G products Gox. Such modified DNA strands can be cleaved at the site of Gox by
treatment using e.g. piperidine at elevated temperature, then separated by gel electrophoresis
and visualized by phosphorimagery using radioactive 32P-labeling.[138]
Three conclusions could be drawn from these experiments:
1. Short-range CT reactions occur on a very fast timescale (kCT = 109 - 1012 s-1).
2. The typical β-value of DNA-mediated CT is 0.6-0.8 Å-1.
3. The intercalation of D and A is crucial for a fast and efficient CT process.

2 Background ______________________________________________________________________________________________________
30
Table 2-1. Summary of important spectroscopic studies on DNA-mediated charge transfer. The rate kCT and distance dependence β are given according to kCT = k0 • e -β • R .
Charge donor /
acceptor covalently attached? β [Å-1] kCT [s-1] Research group Year
E / MV no - 105 Fromherz[139] 1986
E / MV, Ac / DAP no 1.0 108 Harriman[140] 1992
Ru(II) / Rh(III)
complexes yes 0.2 109 Barton[141] 1993
Ru(II) / Rh(III)
complexes yes 1.0-1.5 106 Meade[142] 1995
St / G yes 0.64 108-1012 Lewis[143] 1997
E / Rh(III) complex yes - 1010 Barton[144] 1997
Ac / G yes 1.4 105-1010 Tanaka[145] 1998
E / Z yes - 1012 Barton/Zewail[146] 1999
N / A yes - 109 Lewis[147] 1999
Ap / G yes 0.1-1.0 109-1010 Barton[148] 1999
Ap / G yes 0.75 106-107 Shafirovich[149] 2000
Ap / G yes 0.6 109-1011 Barton/Zewail[46] 2000
Ac / G, Ac / Z yes - 107-1012 Michel-Beyerle[150] 2002
Ru(II) complex / In yes - ≥107 Barton[151] 2002
Abbreviations: A = adenine, Ac = acridine, Ap = 2-aminopurine, DAP = N,N’-dimethyl-2,7-
diazapyrenium, E = ethidium, G = guanine, In = 4-methyl indole, MV = methyl viologen, N =
naphthaline, St = stilbenedicarboxamide, Z = 7-deazaguanine.
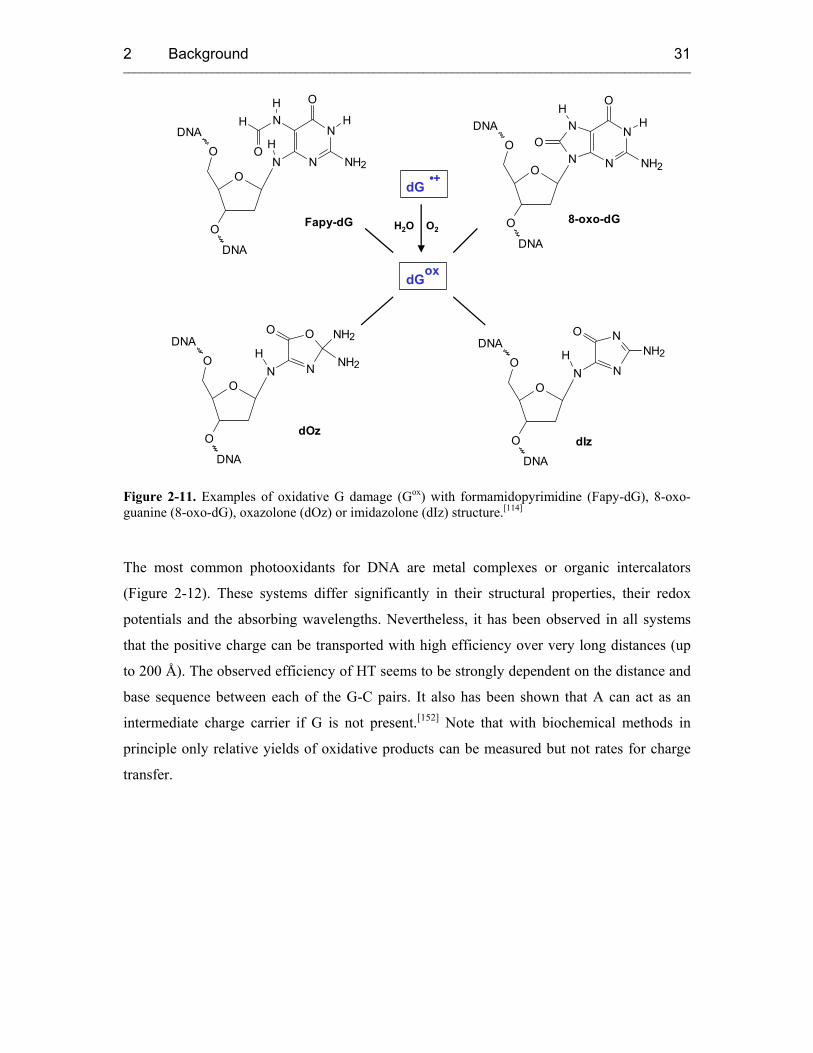
2 Background ______________________________________________________________________________________________________
31
O
O
O
DNA
DNAH
N N
NNH2
O
O
O
O
DNA
DNAH
N N
O
NH2
NH2O
O
O
O
DNA
DNAHN N
NNH
O
H O
H
NH2 O
O
O
DNA
DNA
NH2
H
OH
ON
N
N
N
dG•+
dGox
H2O O28-oxo-dG
dIz
Fapy-dG
dOz
Figure 2-11. Examples of oxidative G damage (Gox) with formamidopyrimidine (Fapy-dG), 8-oxo-guanine (8-oxo-dG), oxazolone (dOz) or imidazolone (dIz) structure.[114]
The most common photooxidants for DNA are metal complexes or organic intercalators
(Figure 2-12). These systems differ significantly in their structural properties, their redox
potentials and the absorbing wavelengths. Nevertheless, it has been observed in all systems
that the positive charge can be transported with high efficiency over very long distances (up
to 200 Å). The observed efficiency of HT seems to be strongly dependent on the distance and
base sequence between each of the G-C pairs. It also has been shown that A can act as an
intermediate charge carrier if G is not present.[152] Note that with biochemical methods in
principle only relative yields of oxidative products can be measured but not rates for charge
transfer.
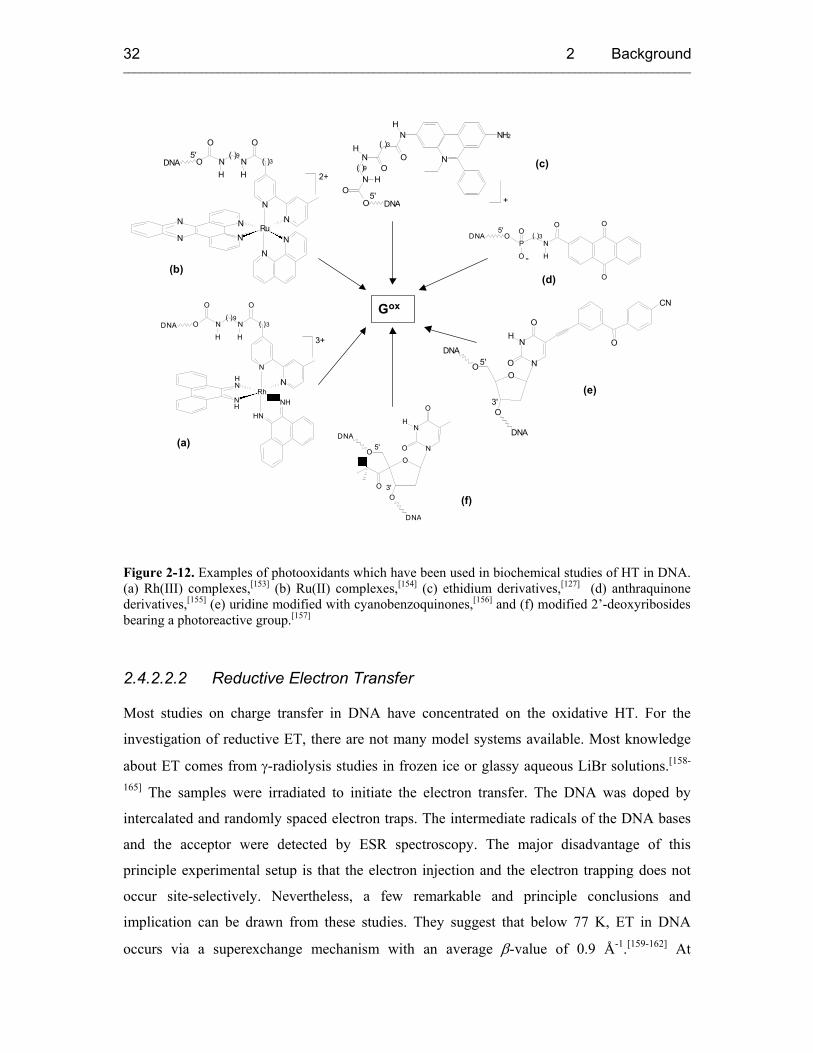
2 Background ______________________________________________________________________________________________________
32
N N
N N
N N
R u
N N
O N H
N H
O O D N A
2+
( ) 9 ( ) 3 5'
( ) 3 ( ) 9 3+
N N
N N
R h
N N
O N H
N H
O O D N A
H H
H H
5'
( )9
NH2N
N
H
OO
NH
N H
O DNAO
( )3
+
O
O
O
N
H
P
O
OODNA ( )3
5'
-
N
N
O
OO
H
O
DNA
O
DNA
O
CN
5'
3'
3'
5'
N
N
O
O
O
H
O
DNA
O
DNA
O
Gox
(a)
(b)
(c)
(d)
(e)
(f)
Figure 2-12. Examples of photooxidants which have been used in biochemical studies of HT in DNA. (a) Rh(III) complexes,[153] (b) Ru(II) complexes,[154] (c) ethidium derivatives,[127] (d) anthraquinone derivatives,[155] (e) uridine modified with cyanobenzoquinones,[156] and (f) modified 2’-deoxyribosides bearing a photoreactive group.[157]
2.4.2.2.2 Reductive Electron Transfer
Most studies on charge transfer in DNA have concentrated on the oxidative HT. For the
investigation of reductive ET, there are not many model systems available. Most knowledge
about ET comes from γ-radiolysis studies in frozen ice or glassy aqueous LiBr solutions.[158-
165] The samples were irradiated to initiate the electron transfer. The DNA was doped by
intercalated and randomly spaced electron traps. The intermediate radicals of the DNA bases
and the acceptor were detected by ESR spectroscopy. The major disadvantage of this
principle experimental setup is that the electron injection and the electron trapping does not
occur site-selectively. Nevertheless, a few remarkable and principle conclusions and
implication can be drawn from these studies. They suggest that below 77 K, ET in DNA
occurs via a superexchange mechanism with an average β-value of 0.9 Å-1.[159-162] At
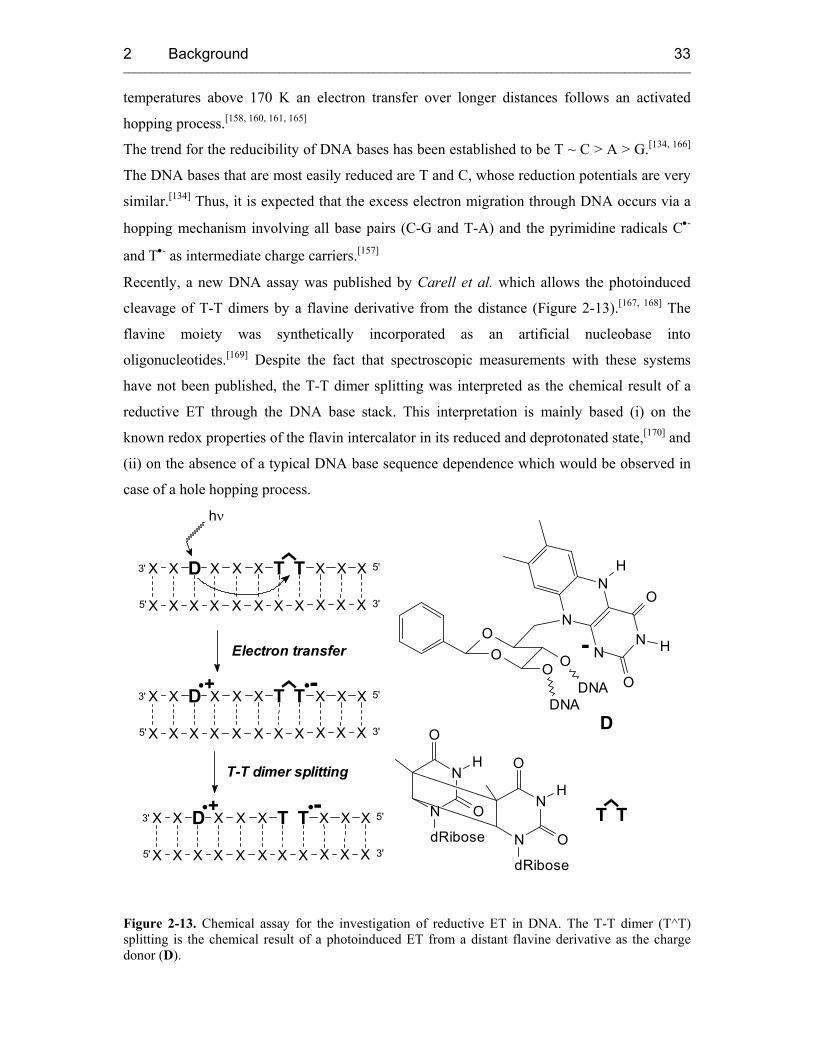
2 Background ______________________________________________________________________________________________________
33
temperatures above 170 K an electron transfer over longer distances follows an activated
hopping process.[158, 160, 161, 165]
The trend for the reducibility of DNA bases has been established to be T ~ C > A > G.[134, 166]
The DNA bases that are most easily reduced are T and C, whose reduction potentials are very
similar.[134] Thus, it is expected that the excess electron migration through DNA occurs via a
hopping mechanism involving all base pairs (C-G and T-A) and the pyrimidine radicals C•-
and T•- as intermediate charge carriers.[157]
Recently, a new DNA assay was published by Carell et al. which allows the photoinduced
cleavage of T-T dimers by a flavine derivative from the distance (Figure 2-13).[167, 168] The
flavine moiety was synthetically incorporated as an artificial nucleobase into
oligonucleotides.[169] Despite the fact that spectroscopic measurements with these systems
have not been published, the T-T dimer splitting was interpreted as the chemical result of a
reductive ET through the DNA base stack. This interpretation is mainly based (i) on the
known redox properties of the flavin intercalator in its reduced and deprotonated state,[170] and
(ii) on the absence of a typical DNA base sequence dependence which would be observed in
case of a hole hopping process.
+ -••
hν
5'
3'
XXX
XXX
X
XX
X
X X
T T
X X X X
X X D X
N
N
O
O
dRibose
H
H
dRibose
O
O
N
N
OO
H
H
O
O
NN
N
N
OO
DNADNA
-
3'
5'
5'
3' XXX
XXX
X
XX
X
X X
T T
X X X X
X X D X
3'
5'
Electron transfer
5'
3'
XXX
XXX
X
XX
X
X X
T T
X X X X
X X D X3'
5'
• •-+
T-T dimer splitting
D
T T
Figure 2-13. Chemical assay for the investigation of reductive ET in DNA. The T-T dimer (T^T) splitting is the chemical result of a photoinduced ET from a distant flavine derivative as the charge donor (D).
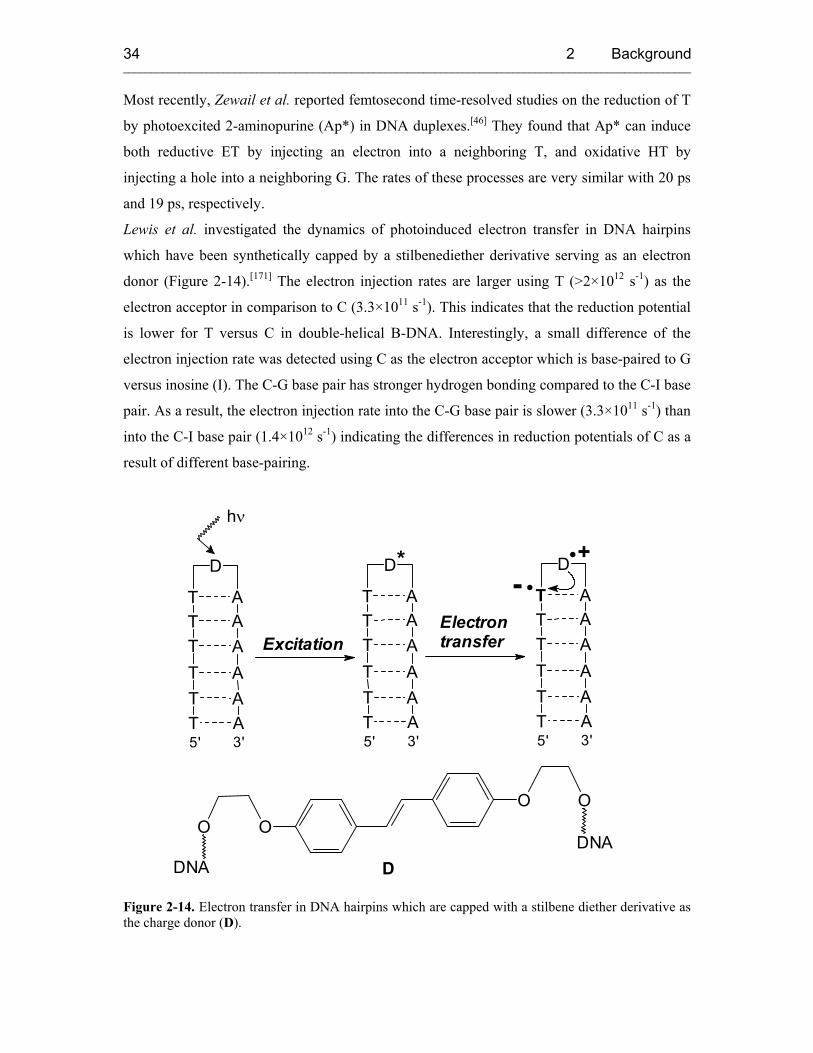
2 Background ______________________________________________________________________________________________________
34
Most recently, Zewail et al. reported femtosecond time-resolved studies on the reduction of T
by photoexcited 2-aminopurine (Ap*) in DNA duplexes.[46] They found that Ap* can induce
both reductive ET by injecting an electron into a neighboring T, and oxidative HT by
injecting a hole into a neighboring G. The rates of these processes are very similar with 20 ps
and 19 ps, respectively.
Lewis et al. investigated the dynamics of photoinduced electron transfer in DNA hairpins
which have been synthetically capped by a stilbenediether derivative serving as an electron
donor (Figure 2-14).[171] The electron injection rates are larger using T (>2×10¹² s-1) as the
electron acceptor in comparison to C (3.3×10¹¹ s-1). This indicates that the reduction potential
is lower for T versus C in double-helical B-DNA. Interestingly, a small difference of the
electron injection rate was detected using C as the electron acceptor which is base-paired to G
versus inosine (I). The C-G base pair has stronger hydrogen bonding compared to the C-I base
pair. As a result, the electron injection rate into the C-G base pair is slower (3.3×10¹¹ s-1) than
into the C-I base pair (1.4×10¹² s-1) indicating the differences in reduction potentials of C as a
result of different base-pairing.
D
•+
OOO O
DNADNA
D
AAA
TTT
ATA
TT
A
3'5'
hν
5' 3'
D
AAA
TTT
ATA
TT
A
ElectrontransferExcitation
D
AAA
TTT
ATA
TT
A
3'5'
- •*
Figure 2-14. Electron transfer in DNA hairpins which are capped with a stilbene diether derivative as the charge donor (D).
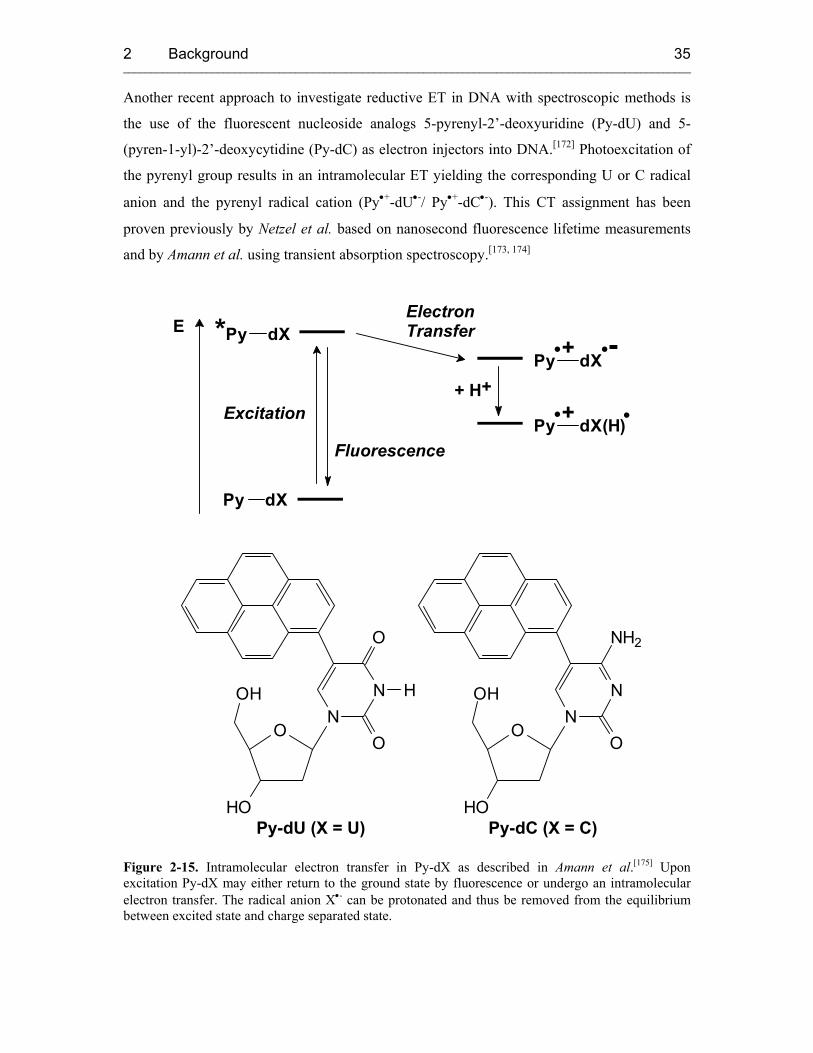
2 Background ______________________________________________________________________________________________________
35
Another recent approach to investigate reductive ET in DNA with spectroscopic methods is
the use of the fluorescent nucleoside analogs 5-pyrenyl-2’-deoxyuridine (Py-dU) and 5-
(pyren-1-yl)-2’-deoxycytidine (Py-dC) as electron injectors into DNA.[172] Photoexcitation of
the pyrenyl group results in an intramolecular ET yielding the corresponding U or C radical
anion and the pyrenyl radical cation (Py•+-dU•-/ Py•+-dC•-). This CT assignment has been
proven previously by Netzel et al. based on nanosecond fluorescence lifetime measurements
and by Amann et al. using transient absorption spectroscopy.[173, 174]
••
Excitation
E+*Py dX
Py dX
ElectronTransfer
Py dX-
O
NN
OH
HO
O
NH2
Py-dC (X = C)Py-dU (X = U)
H
O
O
NN
OH
HO
O
Py dX(H)+• •+ H+
Fluorescence
Figure 2-15. Intramolecular electron transfer in Py-dX as described in Amann et al.[175] Upon excitation Py-dX may either return to the ground state by fluorescence or undergo an intramolecular electron transfer. The radical anion X•- can be protonated and thus be removed from the equilibrium between excited state and charge separated state.
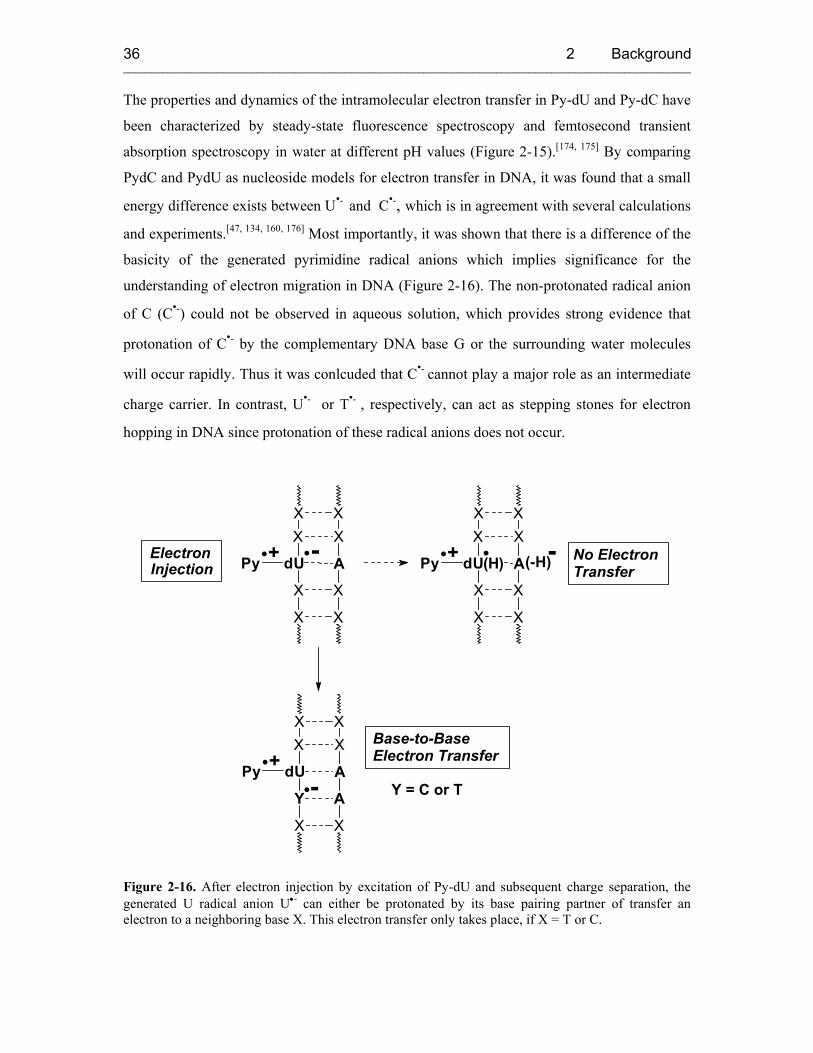
2 Background ______________________________________________________________________________________________________
36
The properties and dynamics of the intramolecular electron transfer in Py-dU and Py-dC have
been characterized by steady-state fluorescence spectroscopy and femtosecond transient
absorption spectroscopy in water at different pH values (Figure 2-15).[174, 175] By comparing
PydC and PydU as nucleoside models for electron transfer in DNA, it was found that a small
energy difference exists between U•- and C•-, which is in agreement with several calculations
and experiments.[47, 134, 160, 176] Most importantly, it was shown that there is a difference of the
basicity of the generated pyrimidine radical anions which implies significance for the
understanding of electron migration in DNA (Figure 2-16). The non-protonated radical anion
of C (C•-) could not be observed in aqueous solution, which provides strong evidence that
protonation of C•- by the complementary DNA base G or the surrounding water molecules
will occur rapidly. Thus it was conlcuded that C•- cannot play a major role as an intermediate
charge carrier. In contrast, U•- or T•- , respectively, can act as stepping stones for electron
hopping in DNA since protonation of these radical anions does not occur.
Base-to-BaseElectron Transfer
••+ -Py dU
X
X X
X
X X
XX
A
Py dU
Y
X X
A
X X
XX
A-
+••
X
X X
X
X X
XX
AdU(H)Py +• • -(-H)InjectionElectron No Electron
Transfer
Y = C or T
Figure 2-16. After electron injection by excitation of Py-dU and subsequent charge separation, the generated U radical anion U•- can either be protonated by its base pairing partner of transfer an electron to a neighboring base X. This electron transfer only takes place, if X = T or C.
2 Background ______________________________________________________________________________________________________
37
Using the nucleoside Py-dU, a range of pyrene-modified duplexes was prepared which differ
mainly in the bases located next to the Py-dU group.[2] The covalently attached pyrene group
is located outside the DNA base stack. Upon excitation, an intramolecular electron transfer in
the Py-dU group represents the injection of an excess electron into the DNA base stack. A
significant quenching of the Py* emission was only detected, if a T or a C was placed
adjacent to the Py-dU group. This observation can be assigned to a base-to-base electron
transfer process (Figure 2-16), which is supported by femtosecond time-resolved pump-probe
laser spectroscopy measurements.
Despite these efforts in understanding reductive ET in DNA, future experiments have to focus
on (i) the dynamics of the electron injection process in a more detailed way, (ii) the base
sequence dependence of ET, (iii) the rate of base-to-base ET in terms of the hopping model,
and (iv) the chemical reactivity of the radical anions in DNA such as cross-linking.
2.4.2.2.3 Biotechnological Applications of Electron Transfer in DNA
From the various studies of charge transfer in DNA it became clear that these processes show
an extreme sensitivity towards perturbation and interruptions of the base-stacking which are
caused by base mismatches or DNA lesions.[46, 135, 150, 176-178] Thus, charge transfer in DNA
should be suitable to obtain an electrochemical readout of DNA chips. The basic idea is that
the subsets of a critical gene are immobilized as single stranded oligonucleotides on an
electrode or chip and contain a redoxactive probe which is intercalated and/or covalently
attached (Figure 2-17). Intact DNA material which is added to the chip forms perfect DNA
duplexes leading to an efficient electron transfer between the chip surface and the distant
redoxactive probe. Base mismatches and DNA lesions significantly interrupt charge transfer
in DNA, and as a result, the electrochemical response is missing. This is a very promising
technique for a reliable detection of genomic sequence variations, like point mutations (single
nucleotide polymorphism, SNP), which is critical for the study of population genetics, for the
clinical diagnostics of cancer, for the diagnosis, and treatment of genetic or viral diseases, and
most recently, for the concept of pharmacogenetics.
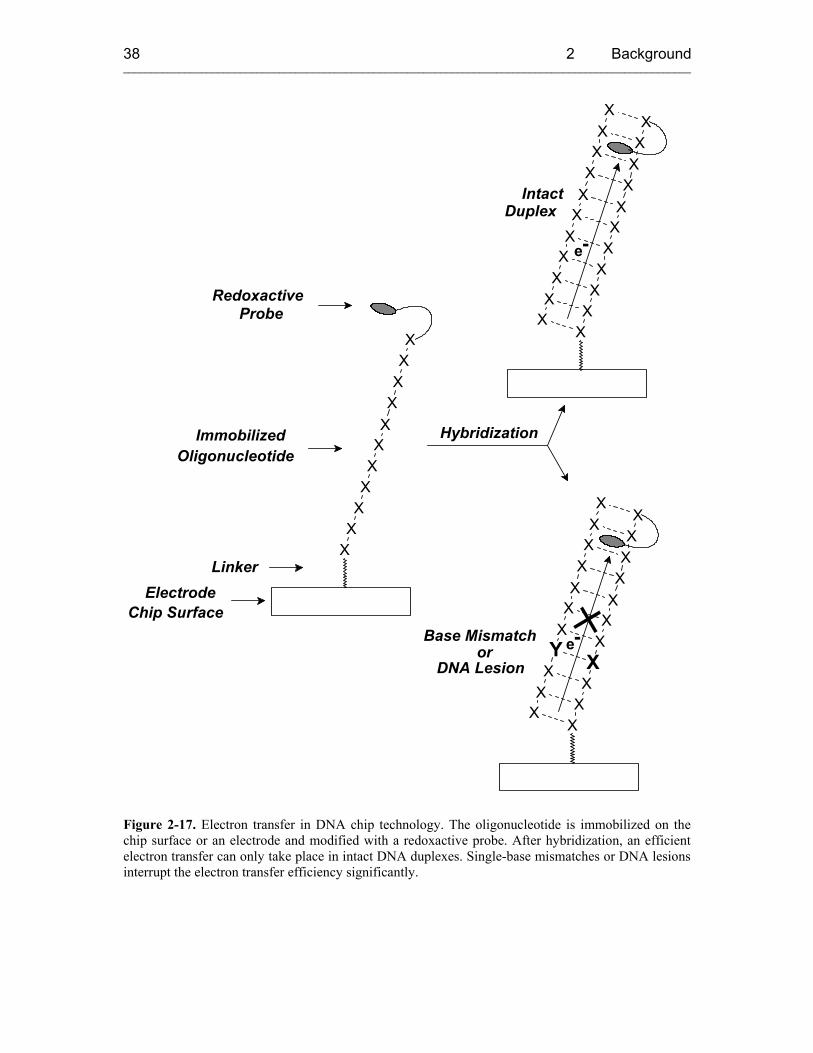
2 Background ______________________________________________________________________________________________________
38
XXX
XX
XX
XX
XX
XXX
XXX
XX
XX
X
XX
XX
XX
X XXX
X
e-
ElectrodeChip Surface
Linker
RedoxactiveProbe
ImmobilizedOligonucleotide
Hybridization
IntactDuplex
Base Mismatch -eorDNA Lesion
XX X
XX
XXXXXX
XXXYX
XX
X
XX
X
Figure 2-17. Electron transfer in DNA chip technology. The oligonucleotide is immobilized on the chip surface or an electrode and modified with a redoxactive probe. After hybridization, an efficient electron transfer can only take place in intact DNA duplexes. Single-base mismatches or DNA lesions interrupt the electron transfer efficiency significantly.
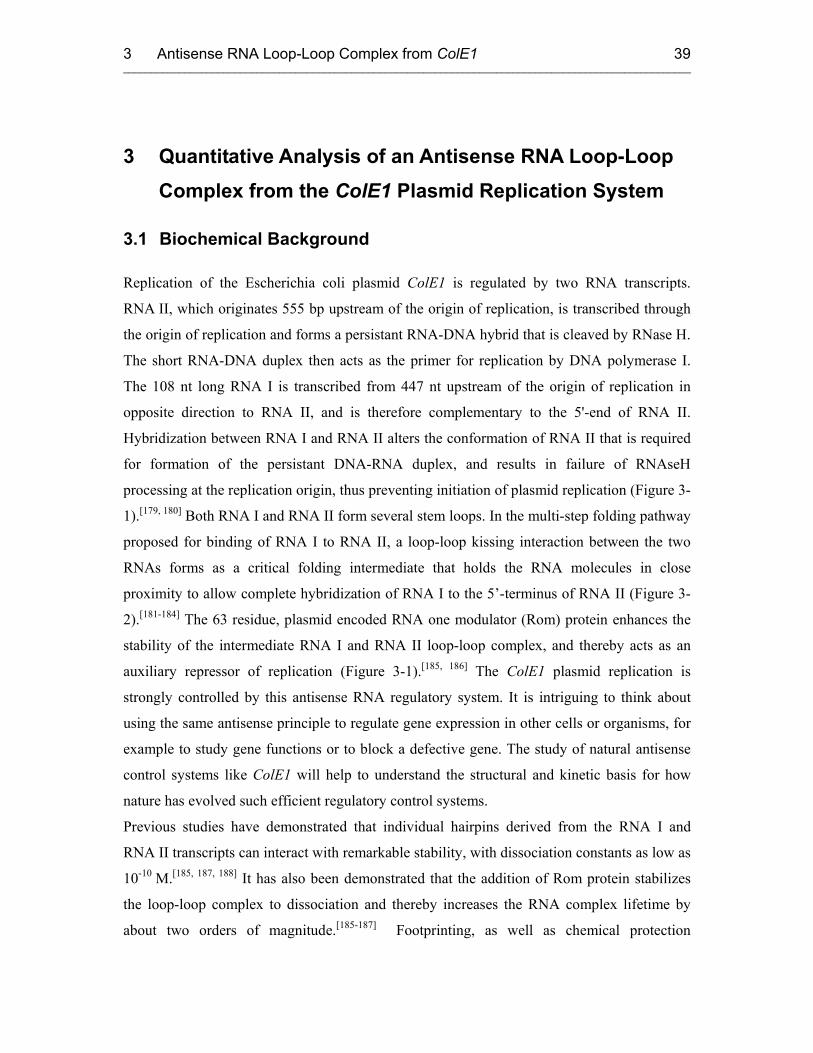
3 Antisense RNA Loop-Loop Complex from ColE1 ______________________________________________________________________________________________________
39
3 Quantitative Analysis of an Antisense RNA Loop-Loop Complex from the ColE1 Plasmid Replication System
3.1 Biochemical Background
Replication of the Escherichia coli plasmid ColE1 is regulated by two RNA transcripts.
RNA II, which originates 555 bp upstream of the origin of replication, is transcribed through
the origin of replication and forms a persistant RNA-DNA hybrid that is cleaved by RNase H.
The short RNA-DNA duplex then acts as the primer for replication by DNA polymerase I.
The 108 nt long RNA I is transcribed from 447 nt upstream of the origin of replication in
opposite direction to RNA II, and is therefore complementary to the 5'-end of RNA II.
Hybridization between RNA I and RNA II alters the conformation of RNA II that is required
for formation of the persistant DNA-RNA duplex, and results in failure of RNAseH
processing at the replication origin, thus preventing initiation of plasmid replication (Figure 3-
1).[179, 180] Both RNA I and RNA II form several stem loops. In the multi-step folding pathway
proposed for binding of RNA I to RNA II, a loop-loop kissing interaction between the two
RNAs forms as a critical folding intermediate that holds the RNA molecules in close
proximity to allow complete hybridization of RNA I to the 5’-terminus of RNA II (Figure 3-
2).[181-184] The 63 residue, plasmid encoded RNA one modulator (Rom) protein enhances the
stability of the intermediate RNA I and RNA II loop-loop complex, and thereby acts as an
auxiliary repressor of replication (Figure 3-1).[185, 186] The ColE1 plasmid replication is
strongly controlled by this antisense RNA regulatory system. It is intriguing to think about
using the same antisense principle to regulate gene expression in other cells or organisms, for
example to study gene functions or to block a defective gene. The study of natural antisense
control systems like ColE1 will help to understand the structural and kinetic basis for how
nature has evolved such efficient regulatory control systems.
Previous studies have demonstrated that individual hairpins derived from the RNA I and
RNA II transcripts can interact with remarkable stability, with dissociation constants as low as
10-10 M.[185, 187, 188] It has also been demonstrated that the addition of Rom protein stabilizes
the loop-loop complex to dissociation and thereby increases the RNA complex lifetime by
about two orders of magnitude.[185-187] Footprinting, as well as chemical protection
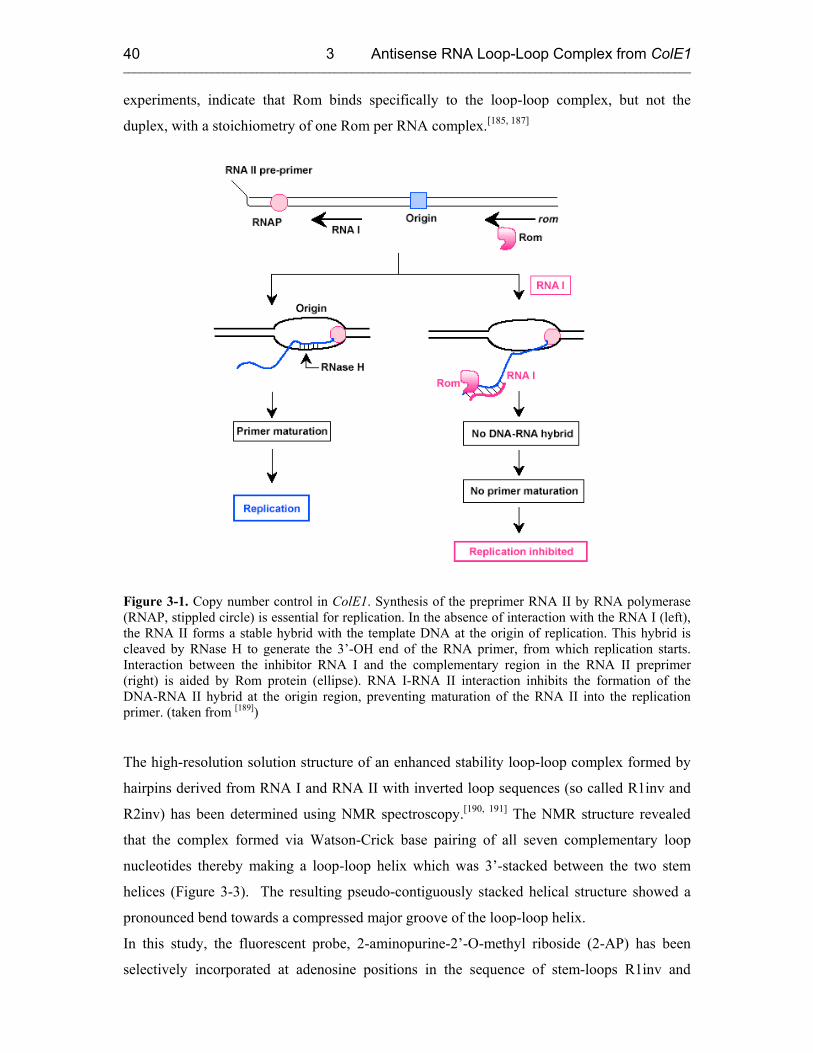
3 Antisense RNA Loop-Loop Complex from ColE1 ______________________________________________________________________________________________________
40
experiments, indicate that Rom binds specifically to the loop-loop complex, but not the
duplex, with a stoichiometry of one Rom per RNA complex.[185, 187]
Figure 3-1. Copy number control in ColE1. Synthesis of the preprimer RNA II by RNA polymerase (RNAP, stippled circle) is essential for replication. In the absence of interaction with the RNA I (left), the RNA II forms a stable hybrid with the template DNA at the origin of replication. This hybrid is cleaved by RNase H to generate the 3’-OH end of the RNA primer, from which replication starts. Interaction between the inhibitor RNA I and the complementary region in the RNA II preprimer (right) is aided by Rom protein (ellipse). RNA I-RNA II interaction inhibits the formation of the DNA-RNA II hybrid at the origin region, preventing maturation of the RNA II into the replication primer. (taken from [189])
The high-resolution solution structure of an enhanced stability loop-loop complex formed by
hairpins derived from RNA I and RNA II with inverted loop sequences (so called R1inv and
R2inv) has been determined using NMR spectroscopy.[190, 191] The NMR structure revealed
that the complex formed via Watson-Crick base pairing of all seven complementary loop
nucleotides thereby making a loop-loop helix which was 3’-stacked between the two stem
helices (Figure 3-3). The resulting pseudo-contiguously stacked helical structure showed a
pronounced bend towards a compressed major groove of the loop-loop helix.
In this study, the fluorescent probe, 2-aminopurine-2’-O-methyl riboside (2-AP) has been
selectively incorporated at adenosine positions in the sequence of stem-loops R1inv and

3 Antisense RNA Loop-Loop Complex from ColE1 ______________________________________________________________________________________________________
41
R2inv (Figure 3-3), such that fluorescence-detected stopped-flow and equilibrium methods
could be used to study the mechanism of this RNA kissing interaction. Using these constructs,
the detailed kinetics of the RNA-RNA interaction, the divalent metal ion requirement for
formation of stable RNA loop-loop complexes and the interaction of Rom with the RNA
complex have been analyzed.
1
2
3
4
5
6
Figure 3-2. Model for the stepwise binding of ColE1 RNA I to RNA II. In step 1 RNA I and RNA II interact at the loops of their folded structures. This interaction facilitates pairing (step 2) that starts at the 5'-end of RNA I (step 3). At this stage, the loop-loop contacts may be broken. Progressive pairing continues as the stem-and-loop structures unfold (steps 4 and 5). It should be noted that the three pairs of loops do not necessarily interact simultaneously, and RNA II may interact in an alternative folded structure. (taken from [88])
3.2 Sample Preparation and Characterization
3.2.1 RNA Oligonucleotide Preparation
Unlabeled RNA hairpins were synthesized by T7 polymerase run-off transcription using
overexpressed and purified T7 polymerase and chemically synthesized DNA templates and
primers according to the method of Milligan and Uhlenbeck.[192] 2-AP labeled RNA hairpins
were chemically synthesized using standard phosphoramidite chemistry. All RNA samples
were purified by preparative scale denaturing polyacrylamide gel electrophoresis (PAGE),
electroeluted, lyophilized, and dialyzed into the standard buffer.
For details see Materials and Methods.
Rom protein was a kind gift from Lynne Regan (Yale University).
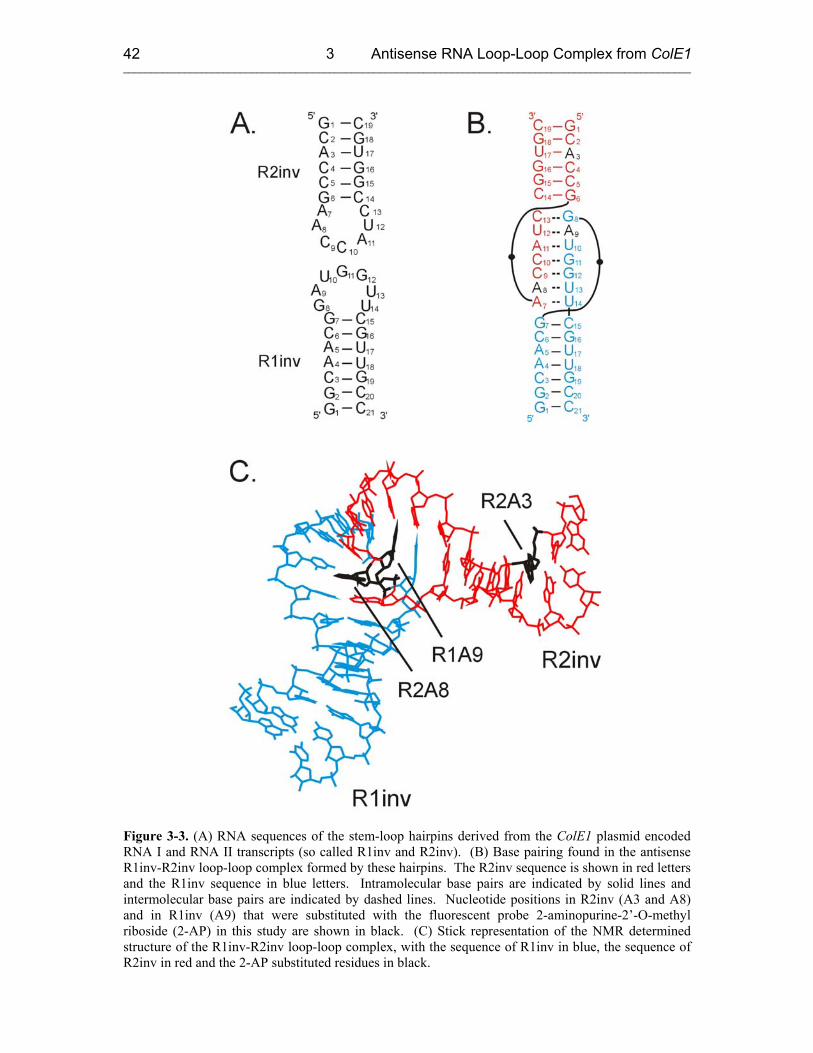
3 Antisense RNA Loop-Loop Complex from ColE1 ______________________________________________________________________________________________________
42
Figure 3-3. (A) RNA sequences of the stem-loop hairpins derived from the ColE1 plasmid encoded RNA I and RNA II transcripts (so called R1inv and R2inv). (B) Base pairing found in the antisense R1inv-R2inv loop-loop complex formed by these hairpins. The R2inv sequence is shown in red letters and the R1inv sequence in blue letters. Intramolecular base pairs are indicated by solid lines and intermolecular base pairs are indicated by dashed lines. Nucleotide positions in R2inv (A3 and A8) and in R1inv (A9) that were substituted with the fluorescent probe 2-aminopurine-2’-O-methyl riboside (2-AP) in this study are shown in black. (C) Stick representation of the NMR determined structure of the R1inv-R2inv loop-loop complex, with the sequence of R1inv in blue, the sequence of R2inv in red and the 2-AP substituted residues in black.
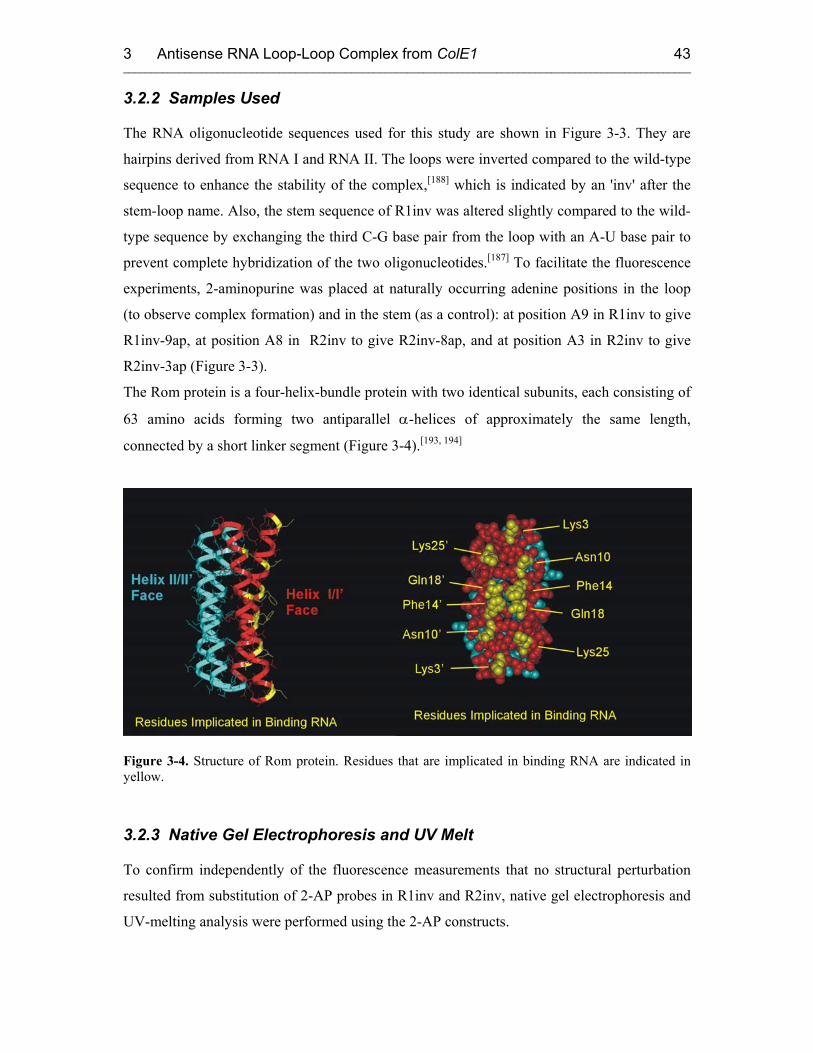
3 Antisense RNA Loop-Loop Complex from ColE1 ______________________________________________________________________________________________________
43
3.2.2 Samples Used
The RNA oligonucleotide sequences used for this study are shown in Figure 3-3. They are
hairpins derived from RNA I and RNA II. The loops were inverted compared to the wild-type
sequence to enhance the stability of the complex,[188] which is indicated by an 'inv' after the
stem-loop name. Also, the stem sequence of R1inv was altered slightly compared to the wild-
type sequence by exchanging the third C-G base pair from the loop with an A-U base pair to
prevent complete hybridization of the two oligonucleotides.[187] To facilitate the fluorescence
experiments, 2-aminopurine was placed at naturally occurring adenine positions in the loop
(to observe complex formation) and in the stem (as a control): at position A9 in R1inv to give
R1inv-9ap, at position A8 in R2inv to give R2inv-8ap, and at position A3 in R2inv to give
R2inv-3ap (Figure 3-3).
The Rom protein is a four-helix-bundle protein with two identical subunits, each consisting of
63 amino acids forming two antiparallel α-helices of approximately the same length,
connected by a short linker segment (Figure 3-4).[193, 194]
Figure 3-4. Structure of Rom protein. Residues that are implicated in binding RNA are indicated in yellow.
3.2.3 Native Gel Electrophoresis and UV Melt
To confirm independently of the fluorescence measurements that no structural perturbation
resulted from substitution of 2-AP probes in R1inv and R2inv, native gel electrophoresis and
UV-melting analysis were performed using the 2-AP constructs.

3 Antisense RNA Loop-Loop Complex from ColE1 ______________________________________________________________________________________________________
44
For all 2-AP RNA constructs used in this study, stable complexes could be observed, that
were super-shifted by Rom protein, under identical native gel conditions as were used to
observe RNA complex formation and Rom binding of the unlabeled hairpins (Figure 3-5).
Figure 3-5. Polyacrylamide assay used to detect the Rom-RNA interaction. The gel was stained with ethidium bromide and visualized on a UV transilluminator. Free R1inv is shown in lanes 1 and 4, R2inv in lane 5. Lanes 6, 7 and 8 show the complexes formed by R1inv + R2inv, R1inv-9ap + R2inv, and R1inv + R2inv-8ap, respectively. Rom binds to these complexes to form a ternary complex, which migrates with even lower mobility, lane 2.
UV-melting curves measured for loop-loop complexes formed by the 2-AP RNA constructs
were practically indistinguishable from melts of unlabeled complexes, with approximately the
same melting temperatures (Tm) observed for loop-loop (Tm ~ 62 °C) and hairpin (Tm > 85
°C) helix melting transitions in all cases (Figure 3-6).

3 Antisense RNA Loop-Loop Complex from ColE1 ______________________________________________________________________________________________________
45
loop-loop kissT ~62°CM
hairpinsT ~85°CM
Figure 3-6. (A) UV-melting curves of kissing complexes with and without 2-AP labels. UV melts were recorded in melting buffer with 5 mM Mg2+, at a heating rate of 0.25°C/min. (B) Derivatives of melting curves with local maxima showing melting temperatures of the loop-loop kissing interaction (Tm~62°C) and hairpins (Tm~85°C), respectively.
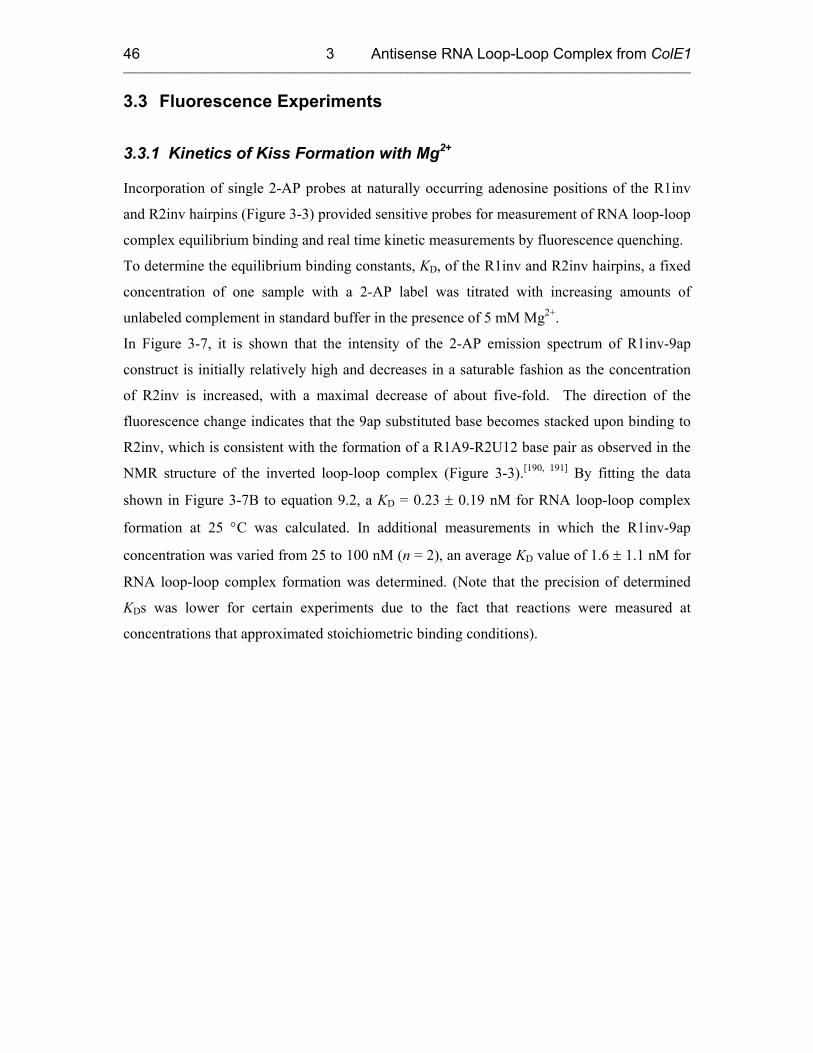
3 Antisense RNA Loop-Loop Complex from ColE1 ______________________________________________________________________________________________________
46
3.3 Fluorescence Experiments
3.3.1 Kinetics of Kiss Formation with Mg2+
Incorporation of single 2-AP probes at naturally occurring adenosine positions of the R1inv
and R2inv hairpins (Figure 3-3) provided sensitive probes for measurement of RNA loop-loop
complex equilibrium binding and real time kinetic measurements by fluorescence quenching.
To determine the equilibrium binding constants, KD, of the R1inv and R2inv hairpins, a fixed
concentration of one sample with a 2-AP label was titrated with increasing amounts of
unlabeled complement in standard buffer in the presence of 5 mM Mg2+.
In Figure 3-7, it is shown that the intensity of the 2-AP emission spectrum of R1inv-9ap
construct is initially relatively high and decreases in a saturable fashion as the concentration
of R2inv is increased, with a maximal decrease of about five-fold. The direction of the
fluorescence change indicates that the 9ap substituted base becomes stacked upon binding to
R2inv, which is consistent with the formation of a R1A9-R2U12 base pair as observed in the
NMR structure of the inverted loop-loop complex (Figure 3-3).[190, 191] By fitting the data
shown in Figure 3-7B to equation 9.2, a KD = 0.23 ± 0.19 nM for RNA loop-loop complex
formation at 25 °C was calculated. In additional measurements in which the R1inv-9ap
concentration was varied from 25 to 100 nM (n = 2), an average KD value of 1.6 ± 1.1 nM for
RNA loop-loop complex formation was determined. (Note that the precision of determined
KDs was lower for certain experiments due to the fact that reactions were measured at
concentrations that approximated stoichiometric binding conditions).
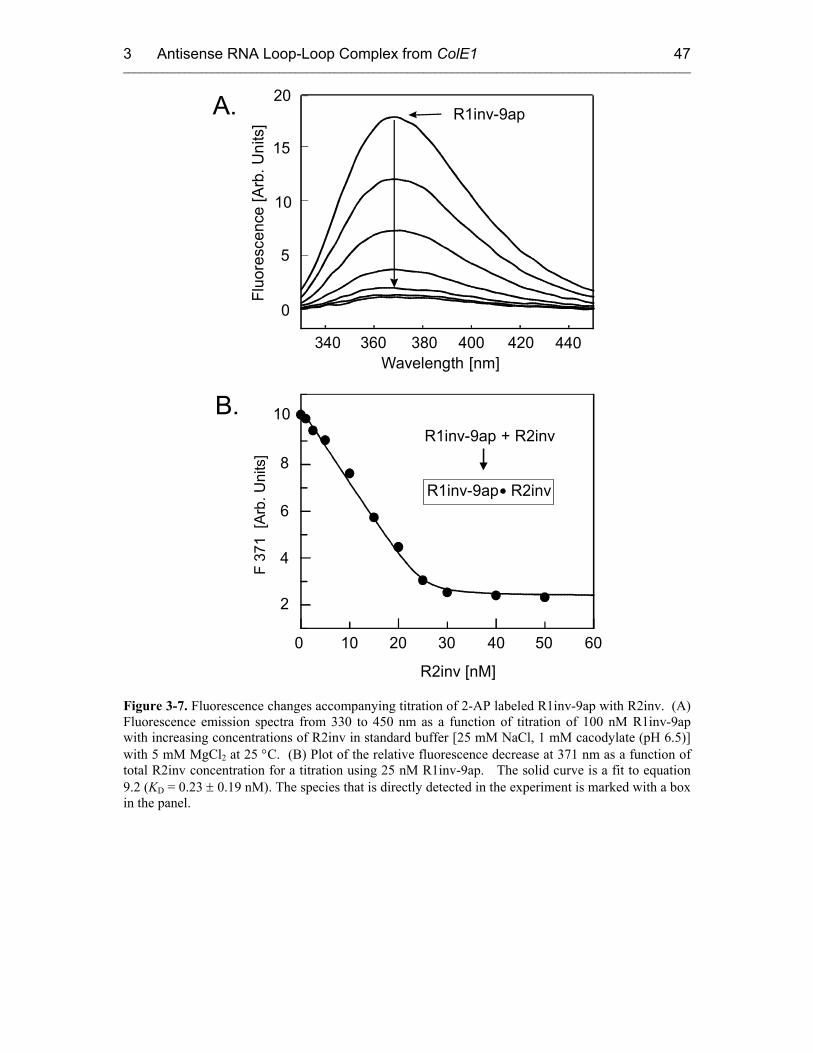
3 Antisense RNA Loop-Loop Complex from ColE1 ______________________________________________________________________________________________________
47
A.
360340 380 400 440
Fluo
resc
ence
[Arb
. Uni
ts]
0
5
10
15
20
Wavelength [nm]420
R1inv-9ap
B.R1inv-9ap + R2inv
200 40 6050
2
4
6
10
8
R2inv [nM]
3010
R1inv-9ap
R2inv
F
371
[Arb
. U
nits
]
Figure 3-7. Fluorescence changes accompanying titration of 2-AP labeled R1inv-9ap with R2inv. (A) Fluorescence emission spectra from 330 to 450 nm as a function of titration of 100 nM R1inv-9ap with increasing concentrations of R2inv in standard buffer [25 mM NaCl, 1 mM cacodylate (pH 6.5)] with 5 mM MgCl2 at 25 °C. (B) Plot of the relative fluorescence decrease at 371 nm as a function of total R2inv concentration for a titration using 25 nM R1inv-9ap. The solid curve is a fit to equation 9.2 (KD = 0.23 ± 0.19 nM). The species that is directly detected in the experiment is marked with a box in the panel.
3 Antisense RNA Loop-Loop Complex from ColE1 ______________________________________________________________________________________________________
48
5
10
15
F 37
1 [A
rb. U
nits
]
0 50 100 150 200R1inv [nM]
R2inv-8ap + R1inv
R2inv-8ap R1inv•
5
10
15
F 37
1 [A
rb. U
nits
]
0 500 1000 1500 2000
R1inv [nM]
R2inv-3ap + R1inv
R2inv-3ap R1inv•
Figure 3-8. Plot of the relative fluorescence decrease at 371 nm as a function of total R1inv concentration for a titration using 100 nM R2inv-8ap. The solid curve is a fit to equation 9.2 (KD = 3.6 ± 2.2 nM). The species that is directly detected in the experiment is marked with a box in the panel. inset: Fluorescence at 371 nm as a function of total R2inv concentration for a titration using 500 nM R2inv-3ap. Fluorescence of the free R2inv-3ap is initially quenched and shows no appreciable change upon titration with R1inv.
The formation of the RNA loop-loop complex could also be monitored using the intensity of
the 2-AP emission spectrum of the R2inv-8ap RNA hairpin construct as a function of R1inv
concentration. For the R2inv-8ap hairpin, the 2-AP emission spectrum is also initially
relatively high and decreases in a saturable fashion as the concentration of R1inv is increased
(Figure 3-8). As observed for the R1inv-9ap construct, the direction of the fluorescence
change indicates that 2-AP probes become stacked upon binding to R1inv, which is again
consistent with the NMR structure of the loop-loop complex. By fitting the data in Figure 3-8
to equation 9.2, a KD = 3.6 ± 2.2 nM for RNA loop-loop complex formation at 25 °C was
calculated. In contrast to these two 2-AP RNA hairpin constructs, a control hairpin with the 2-
AP label placed in the stem (R2inv-3ap) showed an initially highly quenched state in the
hairpin alone and produced no appreciable fluorescence change upon titration with R1inv
(Figure 3-8, inset). This confirms that the principle reason for quenching of the 2-AP probes
placed in the complementary loops is the formation of the loop-loop helix upon RNA-RNA
association and that stacking of the stem base pairs is not significantly perturbed when the
complex forms.
The average KD measured here using 2-AP fluorescence for the inverted RNA loop-loop
complex (KDav = 2.6 ± 1.7 nM) is consistent with the KD = 0.57 nM that was previously
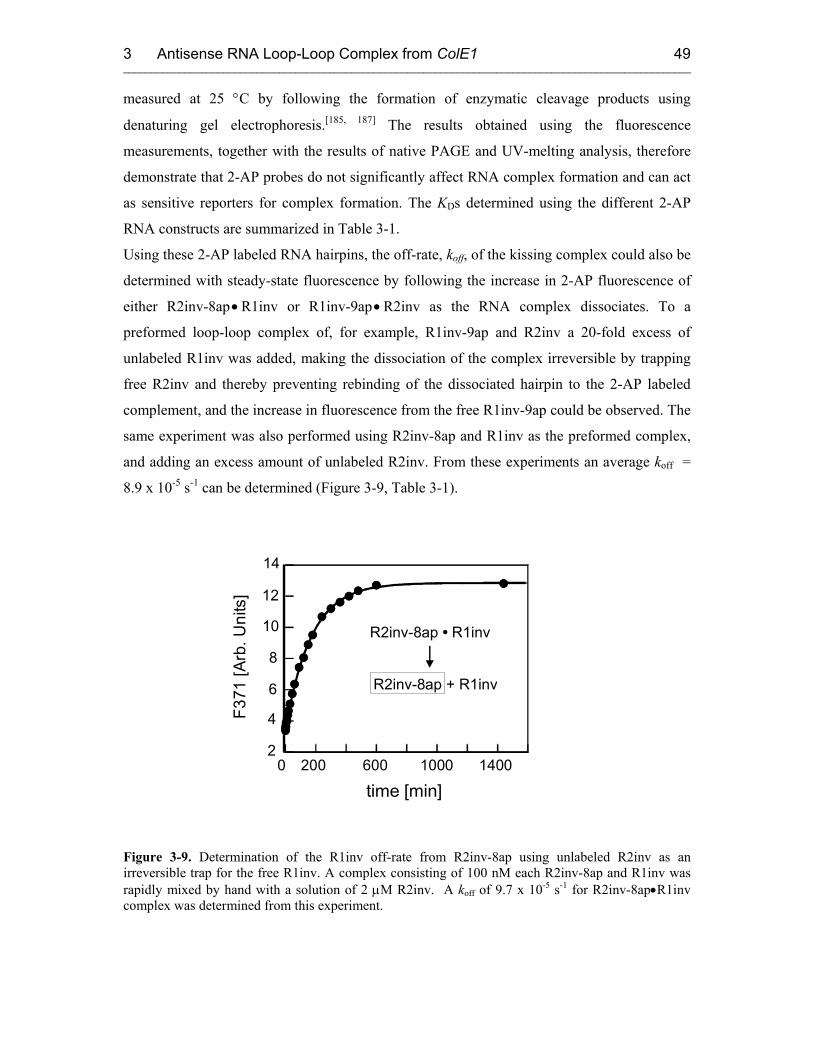
3 Antisense RNA Loop-Loop Complex from ColE1 ______________________________________________________________________________________________________
49
measured at 25 °C by following the formation of enzymatic cleavage products using
denaturing gel electrophoresis.[185, 187] The results obtained using the fluorescence
measurements, together with the results of native PAGE and UV-melting analysis, therefore
demonstrate that 2-AP probes do not significantly affect RNA complex formation and can act
as sensitive reporters for complex formation. The KDs determined using the different 2-AP
RNA constructs are summarized in Table 3-1.
Using these 2-AP labeled RNA hairpins, the off-rate, koff, of the kissing complex could also be
determined with steady-state fluorescence by following the increase in 2-AP fluorescence of
either R2inv-8ap • R1inv or R1inv-9ap • R2inv as the RNA complex dissociates. To a
preformed loop-loop complex of, for example, R1inv-9ap and R2inv a 20-fold excess of
unlabeled R1inv was added, making the dissociation of the complex irreversible by trapping
free R2inv and thereby preventing rebinding of the dissociated hairpin to the 2-AP labeled
complement, and the increase in fluorescence from the free R1inv-9ap could be observed. The
same experiment was also performed using R2inv-8ap and R1inv as the preformed complex,
and adding an excess amount of unlabeled R2inv. From these experiments an average koff =
8.9 x 10⁻⁵ s-1 can be determined (Figure 3-9, Table 3-1).
time [min]2000 1000600 1400
6
2
4
14
8
10
12
F371
[Arb
. Uni
ts]
R2inv-8ap R1inv•
R2inv-8ap + R1inv
Figure 3-9. Determination of the R1inv off-rate from R2inv-8ap using unlabeled R2inv as an irreversible trap for the free R1inv. A complex consisting of 100 nM each R2inv-8ap and R1inv was rapidly mixed by hand with a solution of 2 µM R2inv. A koff of 9.7 x 10⁻⁵ s-1 for R2inv-8ap•R1inv complex was determined from this experiment.
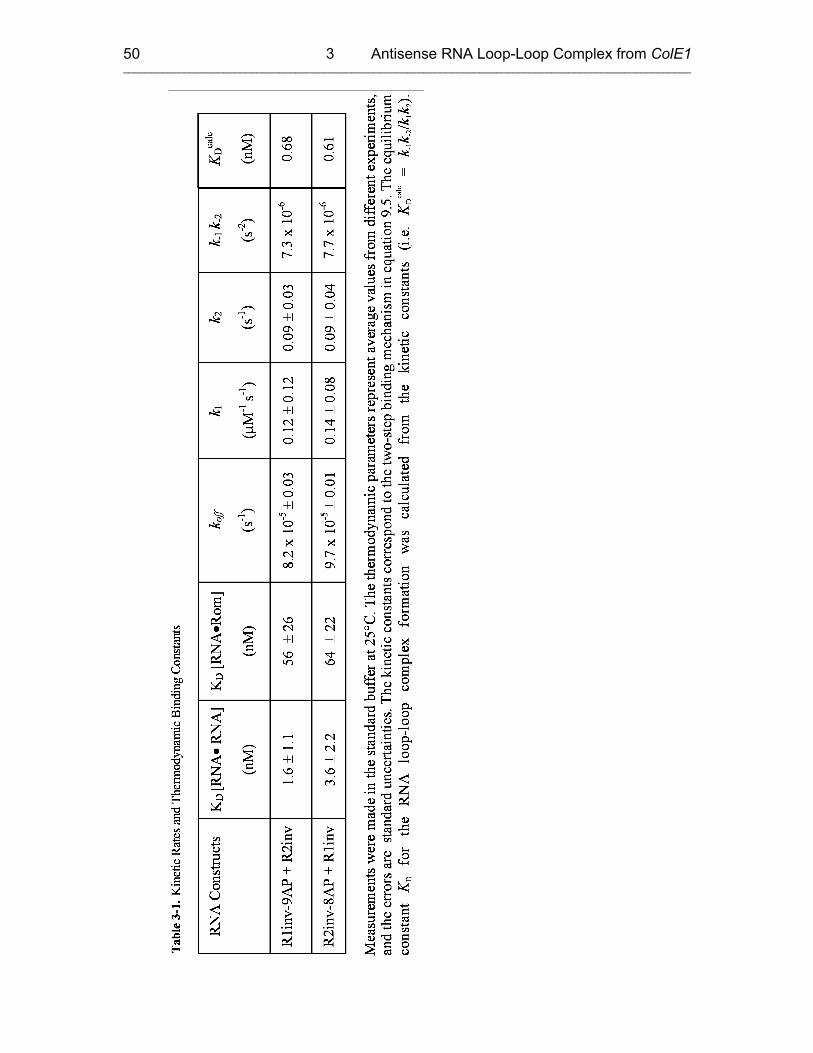
3 Antisense RNA Loop-Loop Complex from ColE1 ______________________________________________________________________________________________________
50
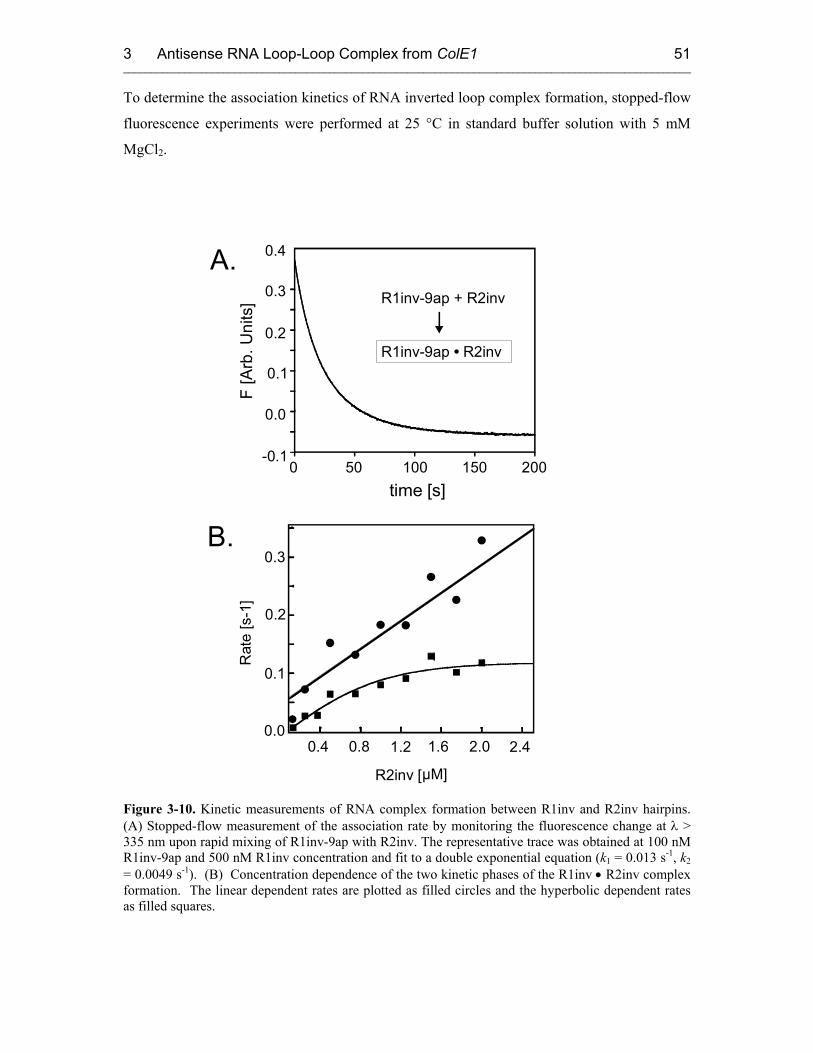
3 Antisense RNA Loop-Loop Complex from ColE1 ______________________________________________________________________________________________________
51
To determine the association kinetics of RNA inverted loop complex formation, stopped-flow
fluorescence experiments were performed at 25 °C in standard buffer solution with 5 mM
MgCl2.
B.
Rat
e [s
-1]
0.3
R2inv [µM]
0.8 1.2 1.6 2.0 2.40.40.0
0.1
0.2
A.
500 100 150 200-0.1
0.0
0.1
0.2
0.3
0.4
time [s]
F [A
rb. U
nits
]
R1inv-9ap R2inv•
R1inv-9ap + R2inv
Figure 3-10. Kinetic measurements of RNA complex formation between R1inv and R2inv hairpins. (A) Stopped-flow measurement of the association rate by monitoring the fluorescence change at λ > 335 nm upon rapid mixing of R1inv-9ap with R2inv. The representative trace was obtained at 100 nM R1inv-9ap and 500 nM R1inv concentration and fit to a double exponential equation (k1 = 0.013 s-1, k2 = 0.0049 s-1). (B) Concentration dependence of the two kinetic phases of the R1inv • R2inv complex formation. The linear dependent rates are plotted as filled circles and the hyperbolic dependent rates as filled squares.
3 Antisense RNA Loop-Loop Complex from ColE1 ______________________________________________________________________________________________________
52
The kinetics of RNA complex formation was followed using pseudo-first order conditions,
where the unlabeled hairpin was present at concentrations 20-fold greater than the labeled
one. The time course of the decrease in 2-AP fluorescence (Ft) as a result of loop-loop
complex formation showed two kinetic phases (Figure 3-10) which suggests a two-step
binding mechanism. Rate constants measured using observed fluorescence changes for the 2-
AP probes placed in the complementary loops of either R1inv or R2inv hairpin were found,
within the error of the measurements, to be the same. Thus, the 2-AP probes appear to report
on similar global folding events associated with RNA binding that are manifested in changes
in the local 2-AP microenvironment.
In experiments using R1inv-9ap as the labeled hairpin and R2inv in concentrations ranging
from 5- to 25-fold R1inv-9ap concentration, one kinetic phase is found to be linearly
dependent on complementary unlabeled RNA hairpin concentration, while a second phase
follows approximately a hyperbolic dependence on unlabeled RNA hairpin concentration
(Figure 3-10).
The concentration dependence of the observed rates of binding was fit using the simple two-
step binding mechanism of equation 3.1:
R1inv + R2inv R1inv•R2inv R1inv•R2inv* (3.1)
k1
k-1
k2
k-2
The linearly dependent rate was fit to the equation kobs = k1[R2inv] + (k-1 + k2 + k-2). For a
kinetic mechanism as described in equation 3.1, the slope of the linear phase is equal to the
observed on-rate, k1, and the y-intercept is equal to the sum of k-1 + k-2 + k2.[195] An average
k1 = 0.13 µM-1 s-1 has been determined based on the slope of the linear phase. For the
hyperbolically dependent phase, the asymptotic rate is equal to the sum k2 + k-2, and the y-
intercept provides a crude estimate of the off-rate k-2. The maximal rate (kmax = k2 + k-2) was
estimated from the maximum of the hyperbolic dependent rate. Since (k-1 + k-2 ) << k2, an
average k2 of 0.09 s-1 was estimated by assuming k-1 and k-2 were equal to zero in these
equations. Due to the extremely slow rates, k-1 and k-2 could not be determined explicitly from
fitting the curves in Figure 3-10B and only an approximate upper limit of 10-2 s-1 can be
assigned for k-1 and k-2. However, using the measured koff, the product of the rate constants
k-2k-1 could be determined by fitting the equation koff = (k-1k-2)/k2 to be 7.5 x 10⁻⁶. The
equilibrium binding constant KD was calculated from the measured microscopic rate
constants, KDcalc = k-1k-2/k1k2, to be on average 0.65 nM, which is in good agreement with the
3 Antisense RNA Loop-Loop Complex from ColE1 ______________________________________________________________________________________________________
53
measured average KD of 2.6 ± 1.7 nM. Thus, the two-step mechanism is consistent with the
thermodynamic measurements on this RNA system. Rate constants for the two-step
mechanism are reported in Table 3-1.
3.3.2 Proposed Model: a Two-Step Mechanism for RNA Kissing
In ColE1, plasmid copy number is controlled kinetically and depends on the rate by which the
antisense(RNA I) - target(RNA II) complex is formed rather than on binding equilibrium. A
kissing interaction is the critical first step in the formation of this antisense (RNA I) - target
(RNA II) complex. Understanding the details of the mechanism for how the antisense RNA I
molecules targets its cognate RNA II target is therefore critical to understanding how these
molecules work in vivo. In this study, the 2-AP fluorescence detected fast kinetic
measurements of the RNA I – RNA II kissing interaction provide the first insight into the
details of this important binding reaction on a millisecond to second time scale. From the
stopped-flow experiments, 2-AP probes substituted in the complementary loops of the R1inv
and R2inv hairpins have been shown to experience at least three different microenvironments
during association of the RNA complex (Figure 3-10). The simplest explanation for this
observation is that the RNA kissing reaction occurs via a two-step mechanism, with a single
kinetic intermediate state. The two-step mechanism for RNA loop-loop complex formation
can be described as an initial encounter of the RNA hairpins in which the complementary
loops of R1inv and R2inv first base pair to form the loop-loop helix (average k1 =
1.3 x 10⁵ M-1 s-1), and then a subsequent isomerization of the RNA complex to the final
tertiary fold in a second slower step (average k2 = 0.09 s-1), where the helical stacking around
the junctions is optimized. This three-state model for the folding trajectory for the kissing
interaction is shown schematically in Figure 3-11. The second-order rate constant measured
for the initial encounter step of the kissing interaction is in the range of values expected for
formation of this type of an antisense complex and is consistent with previous estimates.[185,
187] Since (k-1 + k-2) is estimated to be much less than k2, the folding pathway for the kissing
interaction (Figure 3-11A) shows energetic barriers to the backward k-1 and k-2 rates, which
are significantly higher than the barrier to the forward rate, k2. As a consequence of the
relative values of k-1, k2 and k-2 and the observation that koff can be fit to a single first order
rate, the on-rate can be estimated by k1 (average k1 = 1.3 x 10⁵ M-1 s-1, Table 3-1) and the off-
rate by k-1k-2/k2 (average koff = 8.6 x 10⁻⁵ s-1, Table 3-1). Overall, the low KD value measured
and calculated for the kissing complex formation is therefore largely the result of the slow
off-rate.
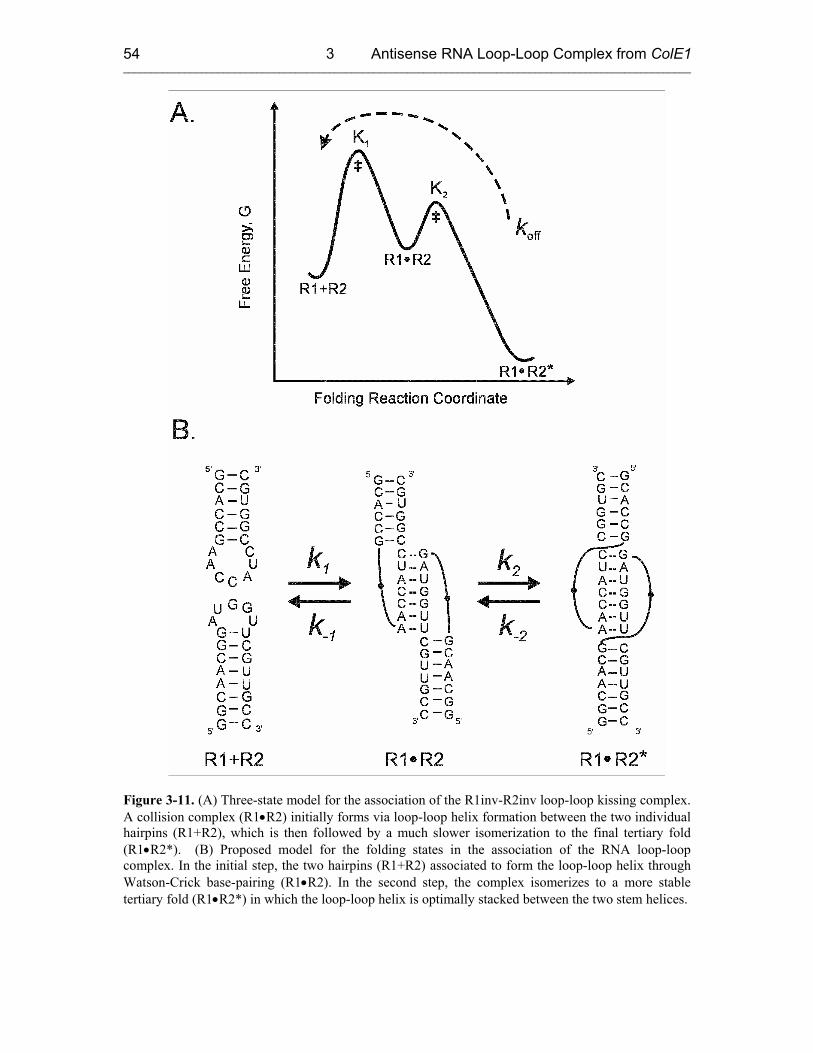
3 Antisense RNA Loop-Loop Complex from ColE1 ______________________________________________________________________________________________________
54
Figure 3-11. (A) Three-state model for the association of the R1inv-R2inv loop-loop kissing complex. A collision complex (R1•R2) initially forms via loop-loop helix formation between the two individual hairpins (R1+R2), which is then followed by a much slower isomerization to the final tertiary fold (R1•R2*). (B) Proposed model for the folding states in the association of the RNA loop-loop complex. In the initial step, the two hairpins (R1+R2) associated to form the loop-loop helix through Watson-Crick base-pairing (R1•R2). In the second step, the complex isomerizes to a more stable tertiary fold (R1•R2*) in which the loop-loop helix is optimally stacked between the two stem helices.

3 Antisense RNA Loop-Loop Complex from ColE1 ______________________________________________________________________________________________________
55
The significant decrease in fluorescence that occurs upon forming the initial encounter
complex is consistent with 2-AP-U base pairing and stacking in the initial binding event of
loop-loop helix formation (Figure 3-11B). The second slower kinetic transient, which has a
smaller amplitude, may represent a final isomerization step in which the RNA complex
assumes its final folded conformation. Such an isomerization step may contribute
significantly to the total free energy of binding of the complex since it would involve
rearrangement to the optimal stacking geometry, especially at the junctions between the stem
helices and the loop-loop helix. This idea is consistent with previous findings that base
stacking contributes most significantly to the thermodynamic stability of RNA kissing
complexes[188] and also suggests that the rate k-2 is likely to be significantly slower than k-1 in
the unfolding pathway.
3.3.3 Metal Ion Requirement for the RNA Loop-Loop Complex Formation
The RNA inverted loop-loop complex investigated here has an extremely stringent divalent
metal ion requirement for formation of a stable interaction. The NMR spectra of the imino
proton region show remarkably that formation of the RNA loop-loop complex absolutely
requires divalent metal ion cofactors even at millimolar concentration of RNA (Figure 3-12).
This contrasts other studied RNA antisense loop-loop complexes that can form at higher
concentrations without a divalent ion cofactor or can form in the presence of monovalent
cations at an approximately 10-fold higher concentration than required for divalent
cations.[196-198]
To further explore the stringency of the requirement of the divalent metal ion cofactor for
RNA complex formation, apparent binding constants for a series of divalent cations binding
to the RNA inverted loop-loop complex were determined (Table 3-2). In this experiment the
decrease in fluorescence (F) at 371 nm was monitored as a fixed concentration of R1inv-9ap
and R2inv, mixed in 1:1 stoichiometry in standard buffer, was titrated with increasing
amounts of the divalent metal ion. Metal binding, which induces RNA complex formation,
was monitored indirectly by measuring 2-AP quenching associated with RNA loop-loop
complex formation, from which apparent binding constants were calculated.
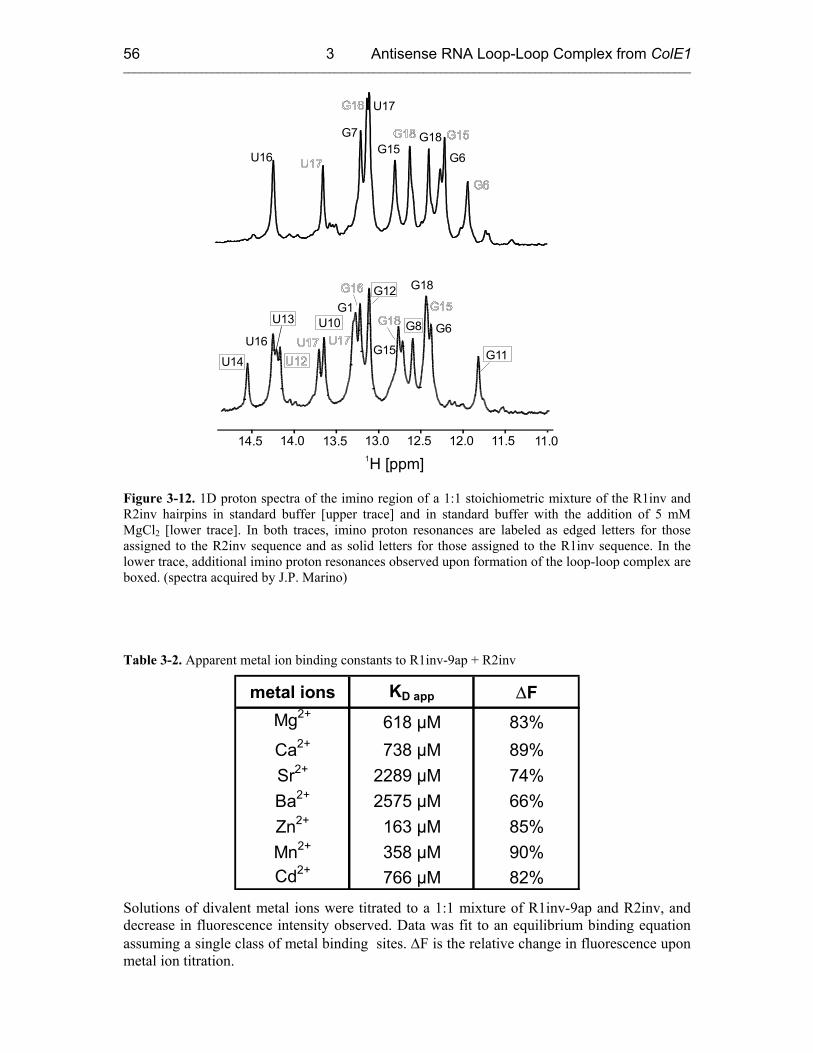
3 Antisense RNA Loop-Loop Complex from ColE1 ______________________________________________________________________________________________________
56
U16
G7
U17
G15G6
G18
U14
U16
U13 U10G1
G12
G15
G8
G11
14.5 14.0 13.013.5 12.5 12.0 11.5 11.01H [ppm]
G6
G18
Figure 3-12. 1D proton spectra of the imino region of a 1:1 stoichiometric mixture of the R1inv and R2inv hairpins in standard buffer [upper trace] and in standard buffer with the addition of 5 mM MgCl2 [lower trace]. In both traces, imino proton resonances are labeled as edged letters for those assigned to the R2inv sequence and as solid letters for those assigned to the R1inv sequence. In the lower trace, additional imino proton resonances observed upon formation of the loop-loop complex are boxed. (spectra acquired by J.P. Marino)
Table 3-2. Apparent metal ion binding constants to R1inv-9ap + R2inv
metal ions KD app ∆FMg2+ 618 µM 83%Ca2+ 738 µM 89%Sr2+ 2289 µM 74%Ba2+ 2575 µM 66%Zn2+ 163 µM 85%Mn2+ 358 µM 90%Cd2+ 766 µM 82%
Solutions of divalent metal ions were titrated to a 1:1 mixture of R1inv-9ap and R2inv, and decrease in fluorescence intensity observed. Data was fit to an equilibrium binding equation assuming a single class of metal binding sites. ∆F is the relative change in fluorescence upon metal ion titration.
3 Antisense RNA Loop-Loop Complex from ColE1 ______________________________________________________________________________________________________
57
In contrast to the observed fluorescence decrease at 371 nm associated with the titration of
R1inv and R2inv with divalent cations, titration of the RNA hairpins with monovalent cations
resulted in no significant change in fluorescence emission at 371 nm up to a concentration of
1.0 M (Figure 3-13A), indicating that the loop-loop complex formation can not be induced by
monovalent cations.
For all divalent metal ions investigated (Table 3-2), binding of the metal, as detected as a
function of loop-loop complex formation, is saturable (Figure 3-13B). However, the extent of
the 2-AP quench upon RNA complex formation observed with different metals varied by up
to a factor of 0.25. For example, titration with strontium resulted in only about 75% of the 2-
AP quench observed in the magnesium experiment (Figure 3-13B). This suggests that for
larger metals to be accommodated into the metal binding pocket, the loop-loop helix in the
RNA complexes are slightly destacked and hence the fluorescence quench is only a fraction
of that observed for smaller metals, like magnesium.

3 Antisense RNA Loop-Loop Complex from ColE1 ______________________________________________________________________________________________________
58
B.
A.
0 10 20 30
F [n
orm
aliz
ed]
0
0.2
0.4
0.6
0.8
1
Mg 2+Sr 2+
MgCl /SrCl [mM]2 2
5
10
15
F 37
1 [A
rb. U
nits
]
0 200 400 600 800 1000NaCl [mM]
Figure 3-13. (A) Titration of 100nM R2inv-8ap + 100nM R1inv with NaCl. No significant or saturable change in fluorescence is observed up to a NaCl concentration of 1M. (B) Fluorescence changes accompanying titration of a 1:1 stoichiometric mixture of R1inv-9ap and R2inv with MgCl2 (solid circles) and SrCl2 (hollow circles). The relative fluorescence decrease at 371 nm as a function of total metal ion concentration is plotted.
These results, together with the fact that monovalent cations can not be substituted for
divalent cations in binding and stabilizing the loop-loop complex, strongly suggest that the
binding site for the required metal ion cofactor must accommodate two positive charges in a
sterically restricted, although somewhat flexible, cavity.
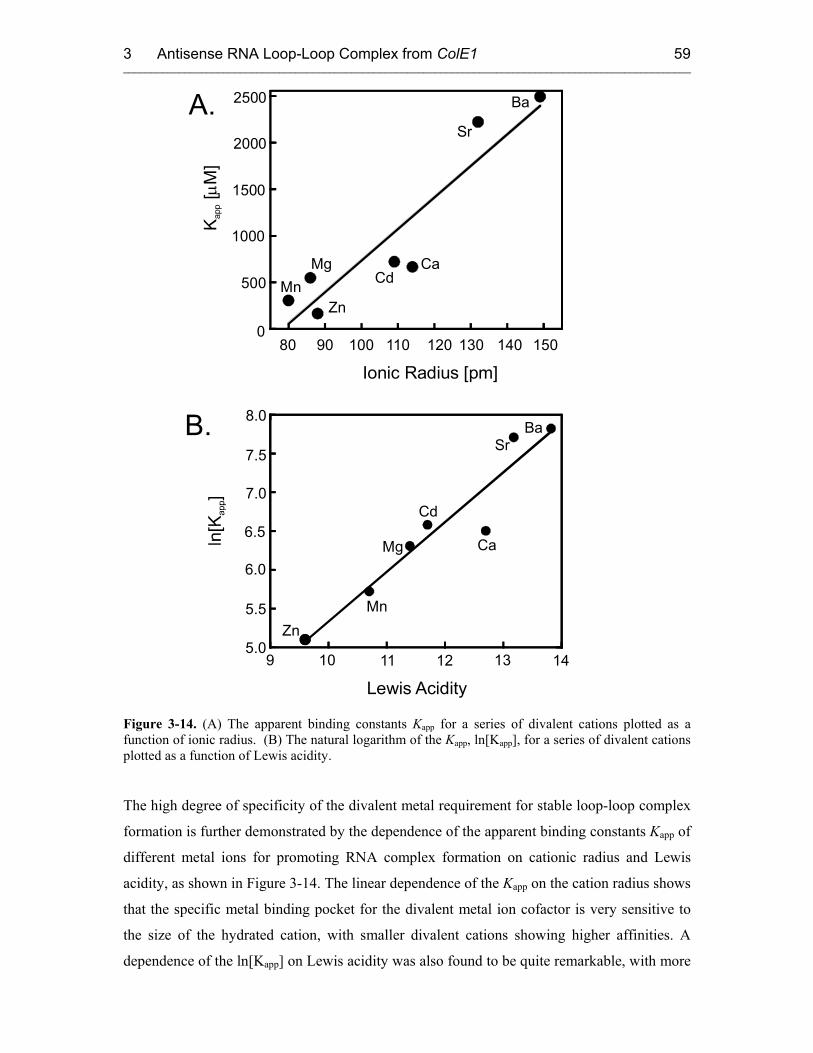
3 Antisense RNA Loop-Loop Complex from ColE1 ______________________________________________________________________________________________________
59
A.
0
2000
2500
1500
1000
K [
M]
app
µ
500
100 110 120 130 140 15080
Ionic Radius [pm]90
MnZn
MgCd
Ca
Sr
Ba
B. 8.0
6.5
6.0
5.5
11 12 13 149
Lewis Acidity10
MnZn
Mg
Cd
Ca
SrBa
5.0
7.0
7.5
Figure 3-14. (A) The apparent binding constants Kapp for a series of divalent cations plotted as a function of ionic radius. (B) The natural logarithm of the Kapp, ln[Kapp], for a series of divalent cations plotted as a function of Lewis acidity.
The high degree of specificity of the divalent metal requirement for stable loop-loop complex
formation is further demonstrated by the dependence of the apparent binding constants Kapp of
different metal ions for promoting RNA complex formation on cationic radius and Lewis
acidity, as shown in Figure 3-14. The linear dependence of the Kapp on the cation radius shows
that the specific metal binding pocket for the divalent metal ion cofactor is very sensitive to
the size of the hydrated cation, with smaller divalent cations showing higher affinities. A
dependence of the ln[Kapp] on Lewis acidity was also found to be quite remarkable, with more
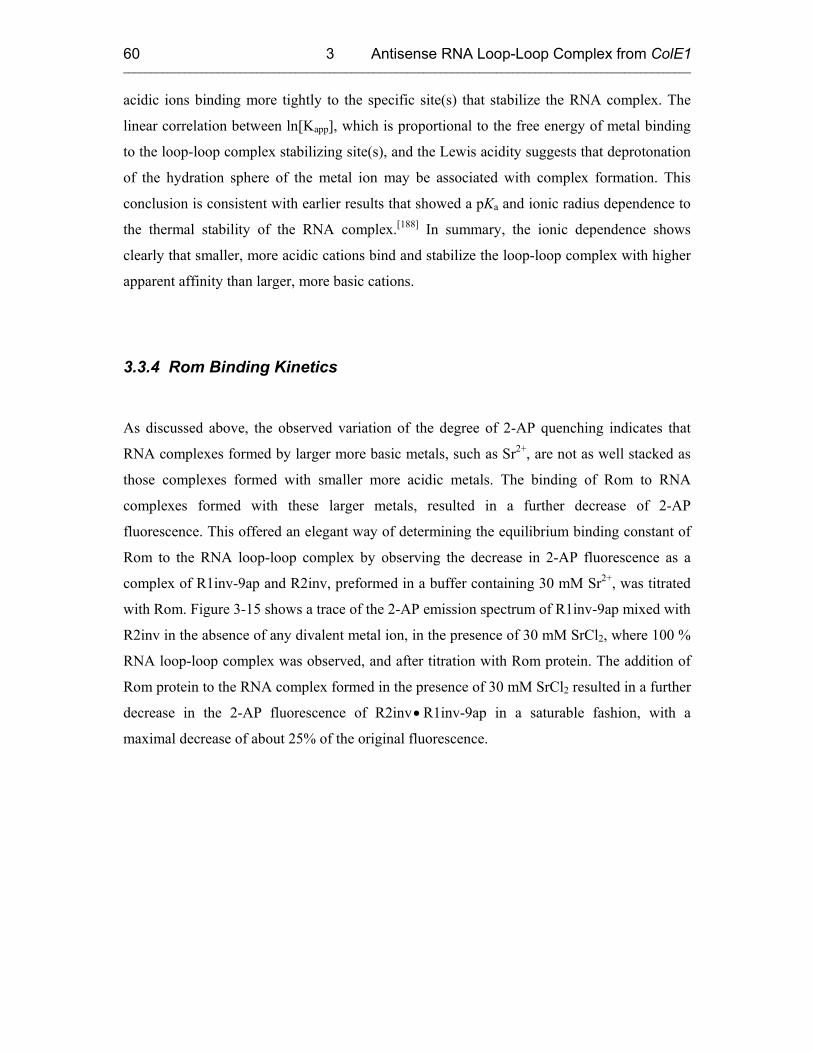
3 Antisense RNA Loop-Loop Complex from ColE1 ______________________________________________________________________________________________________
60
acidic ions binding more tightly to the specific site(s) that stabilize the RNA complex. The
linear correlation between ln[Kapp], which is proportional to the free energy of metal binding
to the loop-loop complex stabilizing site(s), and the Lewis acidity suggests that deprotonation
of the hydration sphere of the metal ion may be associated with complex formation. This
conclusion is consistent with earlier results that showed a pKa and ionic radius dependence to
the thermal stability of the RNA complex.[188] In summary, the ionic dependence shows
clearly that smaller, more acidic cations bind and stabilize the loop-loop complex with higher
apparent affinity than larger, more basic cations.
3.3.4 Rom Binding Kinetics
As discussed above, the observed variation of the degree of 2-AP quenching indicates that
RNA complexes formed by larger more basic metals, such as Sr2+, are not as well stacked as
those complexes formed with smaller more acidic metals. The binding of Rom to RNA
complexes formed with these larger metals, resulted in a further decrease of 2-AP
fluorescence. This offered an elegant way of determining the equilibrium binding constant of
Rom to the RNA loop-loop complex by observing the decrease in 2-AP fluorescence as a
complex of R1inv-9ap and R2inv, preformed in a buffer containing 30 mM Sr2+, was titrated
with Rom. Figure 3-15 shows a trace of the 2-AP emission spectrum of R1inv-9ap mixed with
R2inv in the absence of any divalent metal ion, in the presence of 30 mM SrCl2, where 100 %
RNA loop-loop complex was observed, and after titration with Rom protein. The addition of
Rom protein to the RNA complex formed in the presence of 30 mM SrCl2 resulted in a further
decrease in the 2-AP fluorescence of R2inv• R1inv-9ap in a saturable fashion, with a
maximal decrease of about 25% of the original fluorescence.
3 Antisense RNA Loop-Loop Complex from ColE1 ______________________________________________________________________________________________________
61
B.
Rom [nM]
F 37
1 [A
rb. U
nits
]
5.4
200 300 500400 6001000
5.0
5.8
6.2
6.6 R2inv-8ap R1inv
R2inv-8ap R1inv Rom
A.
340Wavelength [nm]
360 380 420
Fluo
resc
ence
[Arb
. Uni
ts]
0
5
10
15
400 440
R2inv-8ap +R1inv
R2inv-8ap R1inv
R2inv-8ap R1inv Rom
Figure 3-15. Fluorescence changes accompanying titration of the RNA loop-loop complex formed between R1inv and R2inv in the presence of 30 mM SrCl2 with Rom. (A) Fluorescence emission spectra from 330 to 450 nm of the 1:1 stoichiometric mixture of R1inv-9ap and R2inv in standard buffer (R1inv-9ap + R2inv), with 30 mM SrCl2 added (R1inv-9ap•R2inv), and after titration with Rom is completed (R1inv-9ap•R2inv•Rom). Note that at this concentration of Sr+2, 100 % RNA loop-loop complex was observed so that the binding data could be fitted using a single-site binding mode for Rom according to equation 9.4. (B) Plot of the relative fluorescence decrease at 371 nm accompanying titration of 100 nM R1inv•R2inv-8ap complex with increasing concentrations of Rom protein. The solid curve is a fit to equation 9.4 (KD = 64 ± 22 nM). The species that is directly detected in the experiment is marked with a box in the panel.
3 Antisense RNA Loop-Loop Complex from ColE1 ______________________________________________________________________________________________________
62
By fitting the data shown in Figure 3-15B to equation 9.4, a KD = 64 ± 22 nM for Rom
binding to the RNA loop-loop complex at 25 °C was calculated. These results (Table 3-1)
indicate that RNA complexes formed with the 2-AP construct are also still able to bind
specifically to the Rom protein with native-like affinity.[185, 199]
The fluorescence decrease associated with Rom binding to these complexes indicates that
Rom can induce more ideal stacking of the loop-loop helix so that 2-AP becomes more
stacked, and these complexes display the same degree of fluorescence quench as observed for
smaller ideal metals.
The effect of Rom binding on the fluorescence of these loop-loop complexes thus suggests a
possible structural mechanism, involving optimization of base stacking in the loop-loop helix,
for how Rom might stabilize the RNA complex. This mechanism is consistent with previous
studies that indicate that Rom binding induces bending in the RNA loop-loop complex
towards the major groove, which may result from a compression of base pairs in the loop-loop
helix.[190]
3.4 Summary
2-Aminopurine (2-AP) has been shown in previous studies to be a useful probe of the
structure and dynamics of specific sites in DNA,[74, 200] as a monitor for enzyme-DNA[33, 200-
202] and RNA-ligand interactions,[76, 203] and to study Mg2+-dependent conformational changes
in the hammerhead ribozyme.[72, 204] In this study, a general quantitative method is presented
for studying RNA kissing complexes that uses changes in the quantum yield of 2-AP
fluorescence emission. It is shown that substitution of 2-AP at positions in the complementary
loops of the RNA hairpins that form kissing complexes yields constructs that retain the ability
to form native-like interactions, e.g. RNA-RNA kissing and Rom binding, while acting as
extremely sensitive reporters for the RNA-RNA binding reaction.
Using the 2-AP fluorescence quenching assay it was possible to determine not only the
equilibrium binding constants for kissing complex formation of R1inv and R2inv (KDav = 2.6
± 1.7 nM), that are in good agreement with previous measurements,[185, 187, 199] but also the
detailed kinetics of the complex formation. In equilibrium experiments the dissociation
constant of the kissing complex could be determined, whereas the association kinetics were
measured using stopped flow. From these results a two step binding model could be
developed. In addition, the stringent divalent metal ion requirement of this system could be
3 Antisense RNA Loop-Loop Complex from ColE1 ______________________________________________________________________________________________________
63
investigated further, and Rom binding to the kissing complex was measured in real-time in an
elegant way using the presented method.
In contrast to other binding assays, like native gel electrophoresis and filter binding, the 2-AP
fluorescence assay is in general more sensitive and less prone to artifacts that could produce
inaccurate binding constant measurements, since 2-AP probe incorporation is non-perturbing
and binding measurement can be made under native solution conditions. For example, KDs
measured using 2-AP fluorescence for Rom protein binding to the RNA kissing complex are
in good agreement with previous measurements made indirectly by quantification of the
products of RNAse cleavage reactions;[187] while, direct measurements made using native gel
electrophoresis underestimate the KD by approximately an order of magnitude.[199]

4 Dimerization Initiation Site Stem-Loop from HIV-1 ______________________________________________________________________________________________________
64
4 Investigation of the Dimerization and Structural Isomerization of the Dimerization Initiation Site (DIS) Stem-Loop from HIV-1
4.1 Introduction
Since the discovery of the human immunodeficiency virus (HIV) as the causative agent for
the acquired immunodeficiency syndrome (AIDS) in 1983[205-207], much effort has gone into
the development of antiviral drugs against it. Research has focused primarily on studies of the
biology, biochemistry and structural biology of HIV, and on the interaction between viral
components and potential new drug candidates. Several drugs have successfully been
developed and are currently in use in the clinic that inhibit either the viral enzyme reverse
transcriptase (RT) or protease (PR). Unfortunately, the virus has been able to quickly develop
resistance against most of these drugs. In addition, the current use of multidrug ‘cocktails’ is
expensive and compliance with treatment regimens is difficult. It is therefore prudent to
continue to pursue new antiviral therapies that are based on targeting novel viral
components.[208, 209]
Although the past 20 years of research has produced a fairly detailed picture of HIV-1
biology, basic research continues to expand our understanding of how the virus works at the
molecular level and helps to identify new strategies for antiviral therapy. The morphology of
a mature human immunodeficiency virus type-1 (HIV-1) virion is shown in Figure 4-1. The
viral particle is enveloped by a lipid bilayer that is derived from the membrane of the host
cell. The lipid bilayer contains the transmembrane protein (TM, gp41) to which exposed
surface glycoproteins (SU, gp120), responsible for cell recognition, are anchored. The inner
surface of the membrane is lined by a matrix shell composed of approximately 2000 copies of
the matrix protein (MA, p17). In the center of the viral particle a conical capsid core
comprising about 2000 copies of the capsid protein (CA, p24) is located. The capsid contains
two copies of the unspliced viral RNA genome, which is stabilized as a ribonucleoprotein
complex with circa 2000 copies of the nucleocapsid protein (NC, p7), three enzymes, namely
protease (PR), reverse transcriptase (RT), and integrase (IN), and three accessory proteins
(Nef, Vif and Vpr). The viral genome also encodes for three additional accessory proteins

4 Dimerization Initiation Site Stem-Loop from HIV-1 ______________________________________________________________________________________________________
65
(Rev, Tat, Vpu) that function in the host cell but appear not to be packaged into the viral
particle.[208, 209]
Figure 4-1. Morphology of a mature HIV particle. SU = surface protein, NC = nucleocapsid protein, CA = capsid protein, IN = integrase, PR = protease, RT = reverse transcriptase, TM = transmembrane protein, MA = matrix protein, Nef, Vif, Vpr = accessory proteins. (adapted from [209])
In the early phase of the HIV-1 life cycle (Figure 4-2), recognition of the host cell is achieved
by the binding of SU specifically to CD4 receptors. Unlike other retroviruses, in HIV-1 only
the interaction with additional cell surface proteins, like the CCR5 chemokine receptor,
triggers the fusion of virus and cell membranes. After membrane fusion, the virion core enters
the host cell where it is uncoated to expose the ribonucleoprotein complex. RT catalyzes the
reverse transcription of genomic RNA into DNA, which is then transported as part of a
preintegration complex that includes IN, MA, RT and Vpr into the host cell nucleus and
integrated into the host genome by IN. The late phase of the HIV-1 replication cycle starts
with the synthesis of spliced and unspliced viral mRNA transcripts, which are transported out
of the nucleus with the aid of Rev. In the cytosol, the mRNA is translated into the viral
envelope, structural and accessory proteins. The Env precursor polyprotein is synthesized in
the endoplasmatic reticulum, where it is also glycosylated, and is later cleaved to form a TM-
SU complex that localizes at the cell membrane.
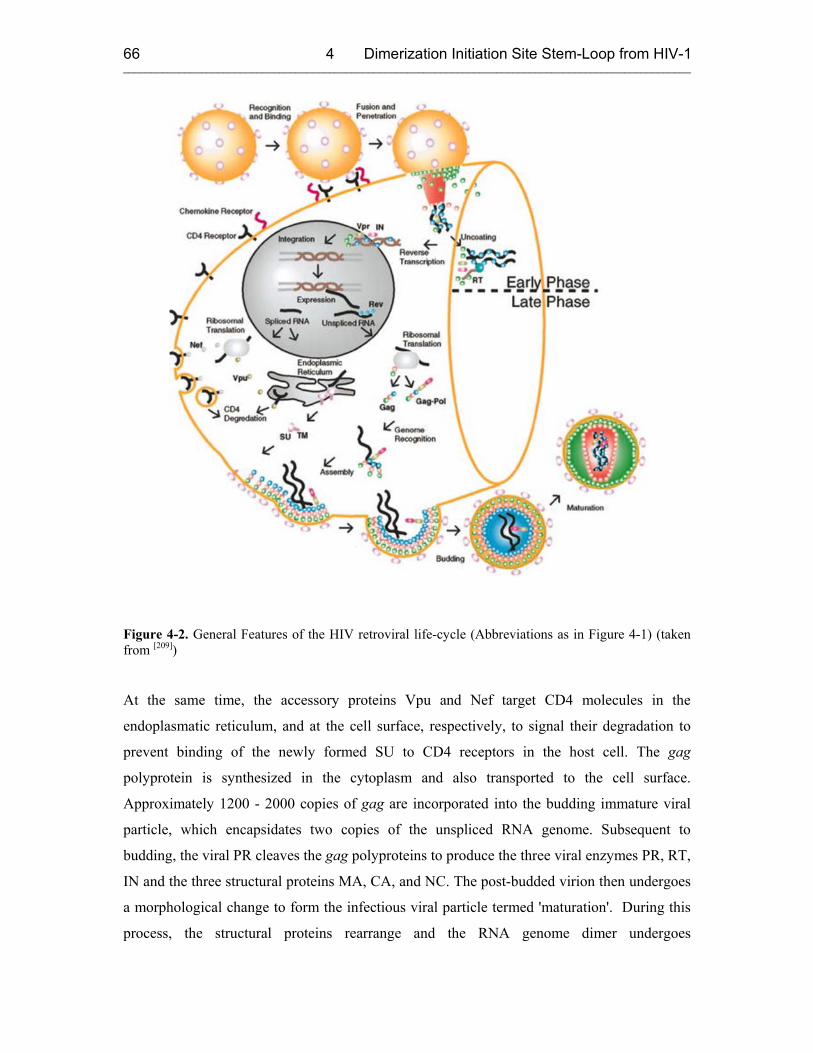
4 Dimerization Initiation Site Stem-Loop from HIV-1 ______________________________________________________________________________________________________
66
Figure 4-2. General Features of the HIV retroviral life-cycle (Abbreviations as in Figure 4-1) (taken from [209])
At the same time, the accessory proteins Vpu and Nef target CD4 molecules in the
endoplasmatic reticulum, and at the cell surface, respectively, to signal their degradation to
prevent binding of the newly formed SU to CD4 receptors in the host cell. The gag
polyprotein is synthesized in the cytoplasm and also transported to the cell surface.
Approximately 1200 - 2000 copies of gag are incorporated into the budding immature viral
particle, which encapsidates two copies of the unspliced RNA genome. Subsequent to
budding, the viral PR cleaves the gag polyproteins to produce the three viral enzymes PR, RT,
IN and the three structural proteins MA, CA, and NC. The post-budded virion then undergoes
a morphological change to form the infectious viral particle termed 'maturation'. During this
process, the structural proteins rearrange and the RNA genome dimer undergoes
4 Dimerization Initiation Site Stem-Loop from HIV-1 ______________________________________________________________________________________________________
67
conformational changes which result in the formation of a more compact, thermodynamically
stable dimer.[208-210]
All known retroviruses package two identical positive copies of their RNA genomes in
budding viral particles.[211, 212] The packaged RNAs form homodimers that are linked non-
covalently through a leader sequence at the 5'-end of the RNA genomic sequence called the
dimer linkage structure (DLS).[213, 214] In HIV-1, dimerization is initiated by a highly
conserved 35-nucleotide stem-loop, called the dimerization initiation site (DIS), which is
located within the DLS.[197, 215, 216] RNA genome dimerization is proposed to be involved in a
number of important events in the retroviral life cycle, including recombination and reverse
transcription,[211] translation of the gag gene,[217] and selective encapsidation and packaging of
genomic RNA.[213, 215, 218-220] Deletion or mutations of the DIS sequence that prevent
dimerization have been found to reduce packaging efficiency 2- to 6-fold,[211, 212] dramatically
decrease viral replication rates[215, 221] and reduce infectivity by as much as a 1,000 fold.[211,
215, 216, 219-222] The apparently critical role of DIS in proper viral packaging and maturation
makes it a potential target for novel antiviral drugs that can inhibit dimerization. For clever
drug design, the kinetics and mechanism of the DIS dimerization need to be studied at first.
The DIS loop contains an auto-complementary hexanucleotide sequence, which is found most
often to be either GUGCAC (subtype A or Mal variant) or GCGCGC (subtype B or Lai
variant), together with highly conserved 5'- and 3'-flanking purine nucleotides (Figure 4-3A).
In vitro experiments have shown that sequences derived from the DLS can spontaneously
form homodimers through a loop-loop kissing interaction[198, 216, 222-226] and that isolated DIS
stem-loops will also self-associate to form homodimer kissing complexes (Figure 4-3B).[198,
211, 223-226] It was demonstrated in vitro that NCp7 activates conversion of metastable
homodimers, formed between short retroviral RNA transcripts either from the 5’-end of
Harvey sarcoma virus or from the Lai subtype of HIV-1, to more stable mature dimer
forms.[227, 228] In further in vitro studies with the Lai sequence variant of HIV-1, the DIS
kissing dimer has been shown to be converted under certain ionic conditions by incubation
either at 55 ºC or with the addition of NCp7 at 37 ºC to a more thermodynamically stable
extended duplex dimer form as shown in Figure 4-3B.[216, 229-231] However, this two-step
dimerization from kiss to duplex dimer was only observed with full length 39mer DIS stem-
loops containing native trinucleotide stem bulges. In these studies, the shorter 23mer DIS
hairpins were observed only in the extended duplex form and 39mer DIS stem-loops lacking
the stem bulge could not be converted by addition of NCp7.[230] Further studies have
indicated that NCp7 can still function as a chaperone in catalyzing the DIS isomerization
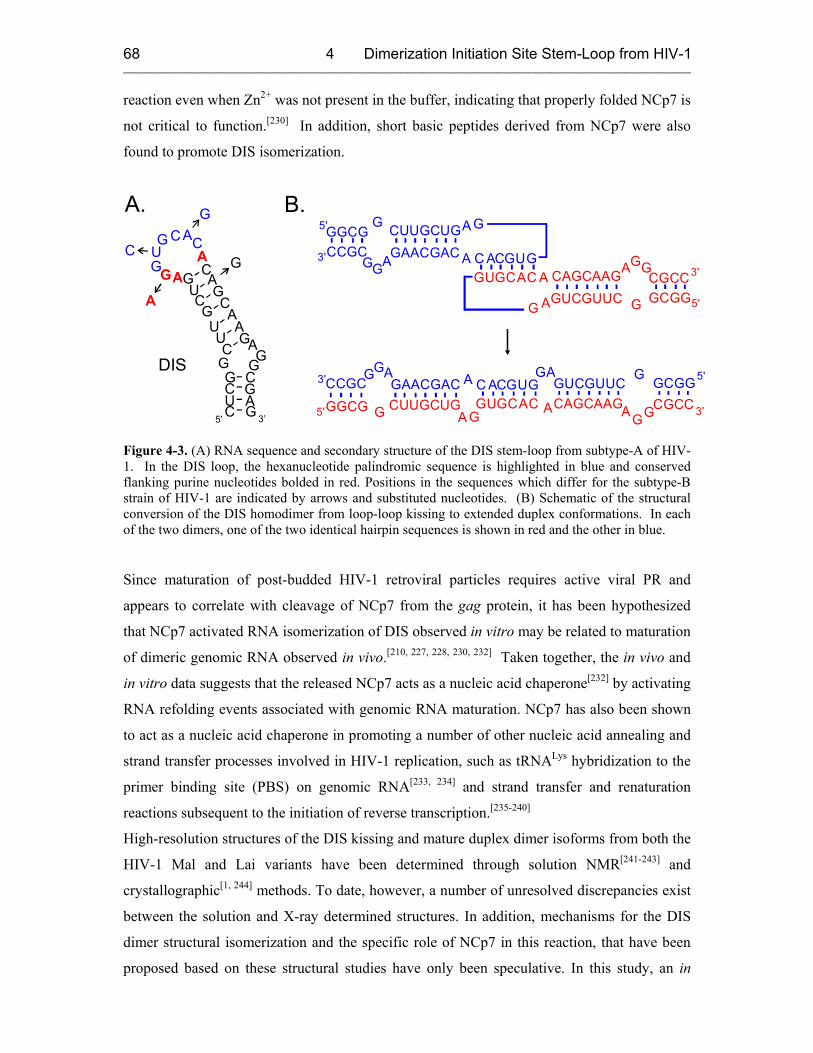
4 Dimerization Initiation Site Stem-Loop from HIV-1 ______________________________________________________________________________________________________
68
reaction even when Zn2+ was not present in the buffer, indicating that properly folded NCp7 is
not critical to function.[230] In addition, short basic peptides derived from NCp7 were also
found to promote DIS isomerization.
GGCGCCGC GAACGAC
CUUGCUG
GG
G
A
A
GG
G
CA C UA
5'
3'
GCGGCGCCCAGCAAG
GUCGUUC
GG
G
A
A
G G
G
CA
CU A
5'
3'
GGCGCCGC GAACGAC
CUUGCUG
GG GA AGG
G
CA
C UA
5'
3' GCGGCGCCCAGCAAG
GUCGUUC
GGG AA
G G
G
C ACU A
5'
3'
B.A.
5'
CGC
G
C GU A
GGU
GG
G
CG CA
AUAC C
AG
G
AG CU
AG
CU
G
C
G
A
3’
A
DIS
Figure 4-3. (A) RNA sequence and secondary structure of the DIS stem-loop from subtype-A of HIV-1. In the DIS loop, the hexanucleotide palindromic sequence is highlighted in blue and conserved flanking purine nucleotides bolded in red. Positions in the sequences which differ for the subtype-B strain of HIV-1 are indicated by arrows and substituted nucleotides. (B) Schematic of the structural conversion of the DIS homodimer from loop-loop kissing to extended duplex conformations. In each of the two dimers, one of the two identical hairpin sequences is shown in red and the other in blue.
Since maturation of post-budded HIV-1 retroviral particles requires active viral PR and
appears to correlate with cleavage of NCp7 from the gag protein, it has been hypothesized
that NCp7 activated RNA isomerization of DIS observed in vitro may be related to maturation
of dimeric genomic RNA observed in vivo.[210, 227, 228, 230, 232] Taken together, the in vivo and
in vitro data suggests that the released NCp7 acts as a nucleic acid chaperone[232] by activating
RNA refolding events associated with genomic RNA maturation. NCp7 has also been shown
to act as a nucleic acid chaperone in promoting a number of other nucleic acid annealing and
strand transfer processes involved in HIV-1 replication, such as tRNALys hybridization to the
primer binding site (PBS) on genomic RNA[233, 234] and strand transfer and renaturation
reactions subsequent to the initiation of reverse transcription.[235-240]
High-resolution structures of the DIS kissing and mature duplex dimer isoforms from both the
HIV-1 Mal and Lai variants have been determined through solution NMR[241-243] and
crystallographic[1, 244] methods. To date, however, a number of unresolved discrepancies exist
between the solution and X-ray determined structures. In addition, mechanisms for the DIS
dimer structural isomerization and the specific role of NCp7 in this reaction, that have been
proposed based on these structural studies have only been speculative. In this study, an in
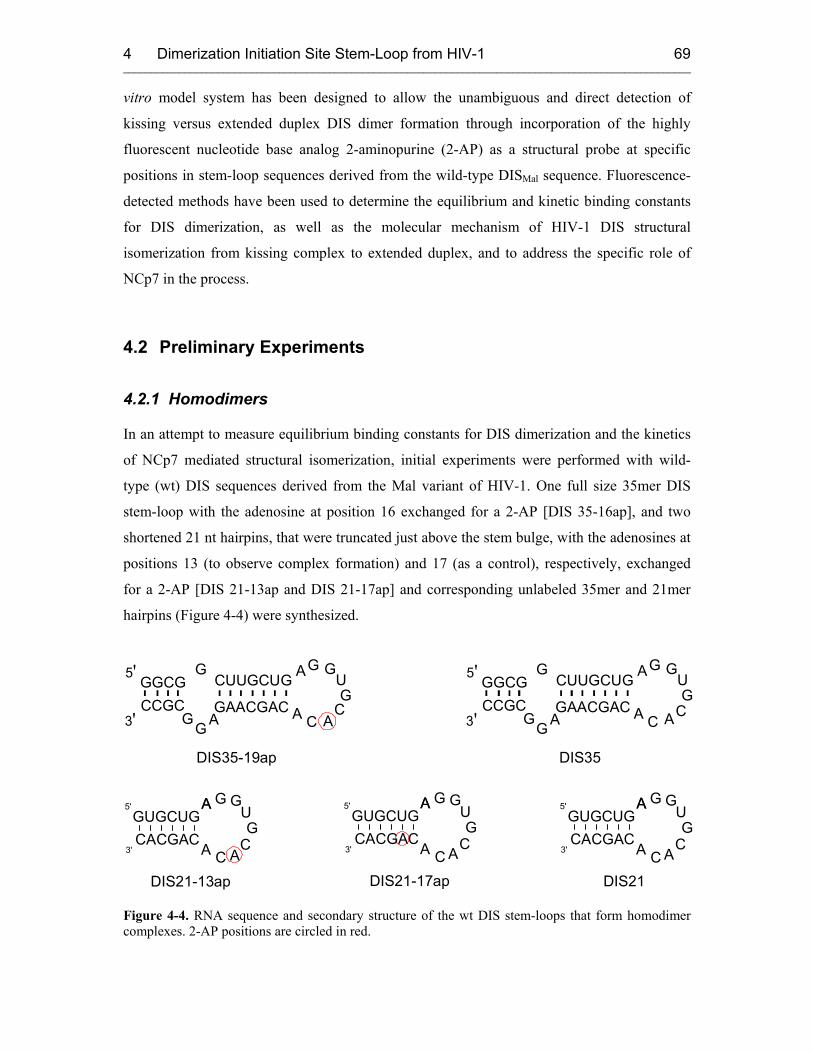
4 Dimerization Initiation Site Stem-Loop from HIV-1 ______________________________________________________________________________________________________
69
vitro model system has been designed to allow the unambiguous and direct detection of
kissing versus extended duplex DIS dimer formation through incorporation of the highly
fluorescent nucleotide base analog 2-aminopurine (2-AP) as a structural probe at specific
positions in stem-loop sequences derived from the wild-type DISMal sequence. Fluorescence-
detected methods have been used to determine the equilibrium and kinetic binding constants
for DIS dimerization, as well as the molecular mechanism of HIV-1 DIS structural
isomerization from kissing complex to extended duplex, and to address the specific role of
NCp7 in the process.
4.2 Preliminary Experiments
4.2.1 Homodimers
In an attempt to measure equilibrium binding constants for DIS dimerization and the kinetics
of NCp7 mediated structural isomerization, initial experiments were performed with wild-
type (wt) DIS sequences derived from the Mal variant of HIV-1. One full size 35mer DIS
stem-loop with the adenosine at position 16 exchanged for a 2-AP [DIS 35-16ap], and two
shortened 21 nt hairpins, that were truncated just above the stem bulge, with the adenosines at
positions 13 (to observe complex formation) and 17 (as a control), respectively, exchanged
for a 2-AP [DIS 21-13ap and DIS 21-17ap] and corresponding unlabeled 35mer and 21mer
hairpins (Figure 4-4) were synthesized.
DIS21
G
A
A G
GC
C
U
A
A
CACGACGUGCUG
3'
5'
GGCGCCGC GAACGAC
CUUGCUG
GG
G
A
A G
G
G
CA C
U
A
5'
3'
DIS35
GGCGCCGC GAACGAC
CUUGCUG
GG
G
A
A G
G
G
CA C
U
A
5'
3'
DIS35-19ap
DIS21-13ap
G
A
A G
GC
C
U
A
A
CACGACGUGCUG
3'
5'
DIS21-17ap
G
A
A G
GC
C
U
A
A
CACGACGUGCUG
3'
5'
Figure 4-4. RNA sequence and secondary structure of the wt DIS stem-loops that form homodimer complexes. 2-AP positions are circled in red.
4 Dimerization Initiation Site Stem-Loop from HIV-1 ______________________________________________________________________________________________________
70
Since these DIS samples could form homodimers, and evidence for an equilibrium mixture of
dimer and monomer states was observed even at nanomolar concentrations, it was not
possible to collect well controlled 2-AP fluorescence-detected binding and kinetic data using
these samples. The two major problems encountered with these samples were:
(1) Since the binding constants of these RNA hairpins were in a range of 1 to 5 nM, it was
not possible to prepare samples containing 100 % of the monomeric species in the
nanomolar concentration ranges required for the fluorescence experiments, even after snap
cooling the RNA samples to kinetically force them into the monomeric hairpin state. At
concentrations of 500 nM RNA, the 2-AP label in the loop was already somewhat
quenched, with DIS35-19ap appearing more quenched than the DIS21-13ap. By
comparison to DIS21-13ap, the 2-AP label in the stem in DIS21-17ap showed about 20 %
of the fluorescence intensity at the same concentration. Since base-paired and stacked 2-
AP probes are expected to show similar degrees of quenching whether in the stem or loop-
loop helix of the dimer, the differences in fluorescence intensities suggest that in the
absence of Mg2+ these hairpins are in an equilibrium between monomer and dimer states.
In addition, non-denaturing polyacrylamide gels demonstrated that at higher micromolar
concentrations the short RNA hairpins existed almost exclusively as dimers. Since this
dimer state was observed using native PAGE in the absence of Mg2+, it was further
concluded that the dimer state was mainly in the mature duplex form, that had isomerized
spontaneously from the kissing dimer.
(2) In the fluorescence experiments, it was not possible with these samples to distinguish
between the kissing complex and extended duplex dimer. In both dimers, the 2-AP labels
incorporated into the loop and stem are base-paired and well stacked. Hence, in both
dimers the 2-AP probe is expected to be in a highly quenched state and therefore no
detectable change in fluorescence of the 2-AP fluorescence would be expected between
the kissing complex and extended duplex dimer (Figure 4-3B).
This first set of samples thus turned out to be impractical for the study of the DIS loop-loop
kissing complex formation and maturation to extended duplex using fluorescence detected
methods. As a consequence, the DIS hairpin samples were modified as described below to
promote the formation of exclusively heterodimer complexes, and 2-AP probes were
selectively incorporated into these samples to allow unambiguous distinction between the two
dimer states.
4 Dimerization Initiation Site Stem-Loop from HIV-1 ______________________________________________________________________________________________________
71
4.2.2 Heterodimers
In previous in vitro studies, it had been found that 5’-leader sequences from the HIV-1 RNA
genome can still dimerize even if the autocomplementary sequence in the DIS loop has been
disrupted so long as a complementary mutation is introduced into a second RNA sequence
species.[221, 245, 246] Based on these results and a philosophy of introducing as few changes as
possible, a second set of samples was synthesized for these studies in which the
autocomplementary sequence in the loop was disrupted to prevent homodimer formation by
alteration of a single base in the loop sequence. A series of complementary RNA hairpins was
made as follows: In the labeled RNA hairpins, the fourth position in the loop was changed
from U to a C, and 2-AP was incorporated at the naturally occurring adenosine at the seventh
position in the loop [DIS35C16-19ap and DIS21C10-13ap], and unlabeled complementary
hairpins with the corresponding A to G mutation in the seventh position in the loop were
designed [DIS35G19 and DIS21G13] (Figure 4-5). In addition, to facilitate direct observation
of the extended duplex dimer formation, hairpins with a 2-AP label added in an extended two-
base 'overhang' at the 5'-end of the stem and not in the loop [DIS35C16e-36ap and
DIS21C10e-22ap], and their respective complements [DIS35G19c and DIS21G13c] were
synthesized (Figure 4-5). As controls, DIS hairpin samples were also designed with loops
complementary to the labeled samples but with stem sequences modified such that only
kissing complexes could form and not extended duplexes [DIS35HxG16 and DIS21HxG13]
(Figure 4-5).
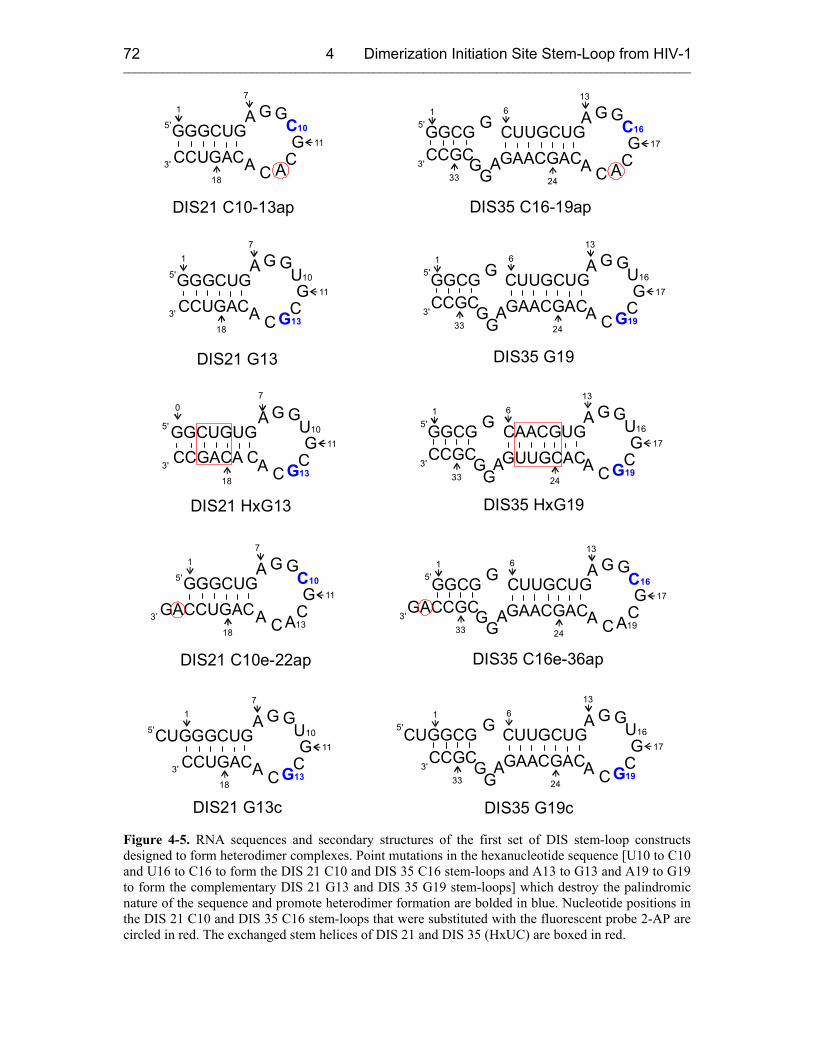
4 Dimerization Initiation Site Stem-Loop from HIV-1 ______________________________________________________________________________________________________
72
DIS21 C10-13ap
DIS21 C10e-22ap
DIS21 G13
DIS21 G13c
DIS21 HxG13
CCUGAC
CCUGAC
GGGCUG
CUGGGCUG
G
G
A
A
A
A
G
G
G
G
C
C
C
C
U10
U10
G13
G13
5'
5'
3'
3'
7
7
1
1
18
18
11
11
CCGACA CGGCUGUG
G
A
A G
GC
C
U10
G13
5'
3'
70
18
11
CCUGAC
GACCUGAC
GGGCUG
GGGCUG
G
G
A
A
A
A
G
G
G
G
C
C
C
C
C10
C10
A
A13
5'
5'
3'
3’
7
7
1
1
18
18
11
11
GGCGCCGC G ACUUGC
CAACGUG
GG
G
A
A G
GG
CA C
U16
G19
5'
3'
1361
2433
17
GGCG
GGCG
CCGC
GACCGC
GAACGAC
GAACGAC
CUUGCUG
CUUGCUG
G
G
G
G
G
G
A
A
A
A
G
G
G
G
G
G
C
C
A
A
C
C
C16
C16
A
A19
5'
5'
3'
3'
13
13
6
6
1
1
24
24
33
33
17
17
GGCG
CUGGCG
CCGC
CCGC
GAACGAC
GAACGAC
CUUGCUG
CUUGCUG
G
G
G
G
G
G
A
A
A
A
G
G
G
G
G
G
C
C
A
A
C
C
U16
U16
G19
G19
5'
5'
3'
3'
13
13
6
6
1
1
24
24
33
33
17
17
DIS35 C16-19ap
DIS35 C16e-36ap
DIS35 G19
DIS35 G19c
DIS35 HxG19
Figure 4-5. RNA sequences and secondary structures of the first set of DIS stem-loop constructs designed to form heterodimer complexes. Point mutations in the hexanucleotide sequence [U10 to C10 and U16 to C16 to form the DIS 21 C10 and DIS 35 C16 stem-loops and A13 to G13 and A19 to G19 to form the complementary DIS 21 G13 and DIS 35 G19 stem-loops] which destroy the palindromic nature of the sequence and promote heterodimer formation are bolded in blue. Nucleotide positions in the DIS 21 C10 and DIS 35 C16 stem-loops that were substituted with the fluorescent probe 2-AP are circled in red. The exchanged stem helices of DIS 21 and DIS 35 (HxUC) are boxed in red.
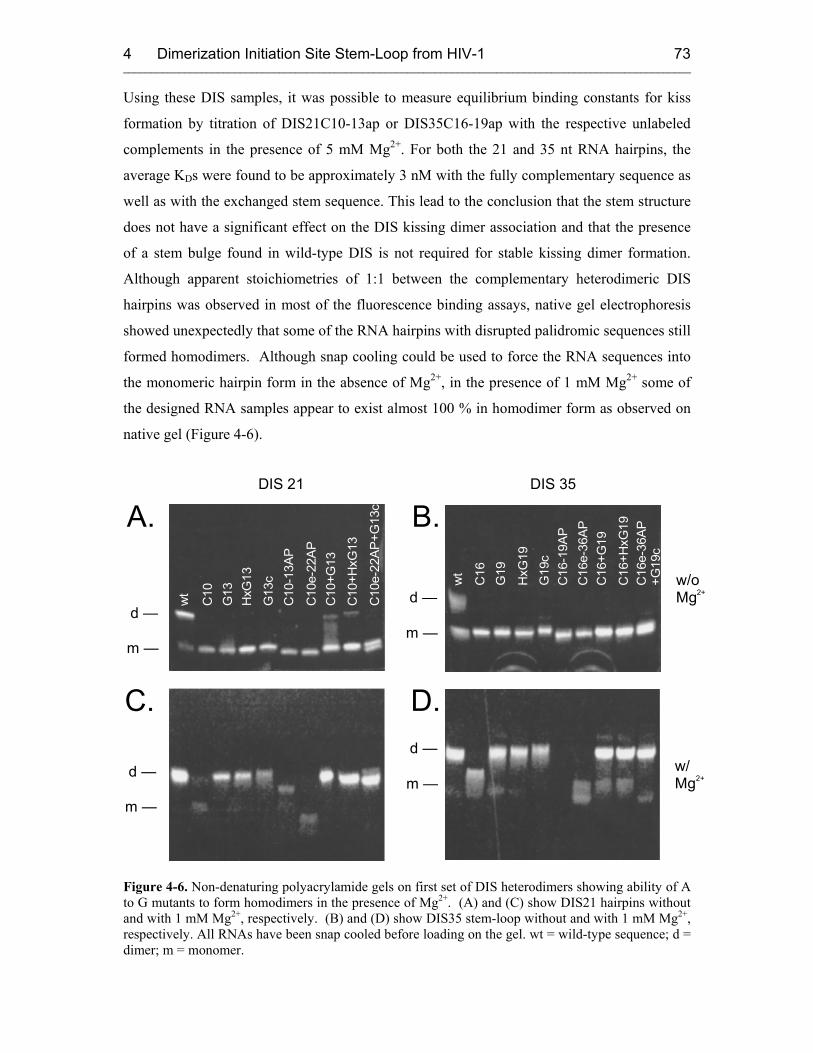
4 Dimerization Initiation Site Stem-Loop from HIV-1 ______________________________________________________________________________________________________
73
Using these DIS samples, it was possible to measure equilibrium binding constants for kiss
formation by titration of DIS21C10-13ap or DIS35C16-19ap with the respective unlabeled
complements in the presence of 5 mM Mg2+. For both the 21 and 35 nt RNA hairpins, the
average KDs were found to be approximately 3 nM with the fully complementary sequence as
well as with the exchanged stem sequence. This lead to the conclusion that the stem structure
does not have a significant effect on the DIS kissing dimer association and that the presence
of a stem bulge found in wild-type DIS is not required for stable kissing dimer formation.
Although apparent stoichiometries of 1:1 between the complementary heterodimeric DIS
hairpins was observed in most of the fluorescence binding assays, native gel electrophoresis
showed unexpectedly that some of the RNA hairpins with disrupted palidromic sequences still
formed homodimers. Although snap cooling could be used to force the RNA sequences into
the monomeric hairpin form in the absence of Mg2+, in the presence of 1 mM Mg2+ some of
the designed RNA samples appear to exist almost 100 % in homodimer form as observed on
native gel (Figure 4-6).
DIS 21 DIS 35
w/o Mg2+
w/ Mg2+
wt
C10
G13
HxG
13
G13
cC
10-1
3AP
C10
e-22
APC
10+G
13
C10
+HxG
13
C10
e-22
AP+G
13c
wt
C16
G19
HxG
19
G19
cC
16-1
9AP
C16
e-36
APC
16+G
19
C16
+HxG
19C
16e-
36AP
+G19
cm —
m —
m —m —
d —d —
d —d —
A. B.
C. D.
Figure 4-6. Non-denaturing polyacrylamide gels on first set of DIS heterodimers showing ability of A to G mutants to form homodimers in the presence of Mg2+. (A) and (C) show DIS21 hairpins without and with 1 mM Mg2+, respectively. (B) and (D) show DIS35 stem-loop without and with 1 mM Mg2+, respectively. All RNAs have been snap cooled before loading on the gel. wt = wild-type sequence; d = dimer; m = monomer.
4 Dimerization Initiation Site Stem-Loop from HIV-1 ______________________________________________________________________________________________________
74
The most likely explanation for this observation is that the DIS21 hairpin with the A13→G13
mutation and DIS 35 hairpins with A19→G19 mutations can tolerate two non-canonical G13-
U10 and G19-U16 wobble mismatched base pairs within the loop-loop helix of homodimers
formed by these hairpins. These DIS mutant sequences demonstrated the high degree of
tolerance of the DIS loop sequence to modification that were originally expected to be more
significantly disruptive of homodimer formation. Another drawback found with this set of
samples was the lack of a significant fluorescence change for the 2-AP probe inserted into the
3’-extended single stranded sequences, DIS21C10e-22ap and DIS35C16e-36ap, that was
anticipated to accompany the structural isomerization to mature duplex. The 2-AP
fluorescence in both DIS21C10e-22ap and DIS35C16e-36ap samples was found to be highly
quenched even in monomeric hairpins, indicating that the 2-AP probe in the single stranded
tail at the 5'-end of the stem is already well stacked. Thus, upon strand exchange and base pair
formation with the complementary DIS stem-loops, no significant fluorescence emission
change can be observed. In hindsight this result was not so surprising since single stranded
overhanging sequences of RNA, as well as DNA, are often expected to be well stacked even
in the absence of base pairing and therefore would be expected to be highly quenched. In light
of later studies on charge transfer in DNA (chapter 6), it seems that the G next to 2-AP at the
3'-end of the RNA sequence, was not a good choice, since it can quench 2-AP fluorescence by
hole transfer.
In summary, although fluorescence detection of kissing complex formation was achieved for
the first time with this set of mutated DIS stem-loops, homodimer binding reactions were still
observed that might contaminate the analysis of the equilibrium binding curves and more
likely complicate any kinetic analysis. Moreover, the use of differences in fluorescence
intensity of a 2-AP probe inserted into a 3’-extension of a DIS stem helix as mode for the
detection of kissing complex versus extended duplex also did not prove successful. These DIS
hairpin were therefore not used further and a second set of heterodimeric DIS hairpins was
designed and synthesized.
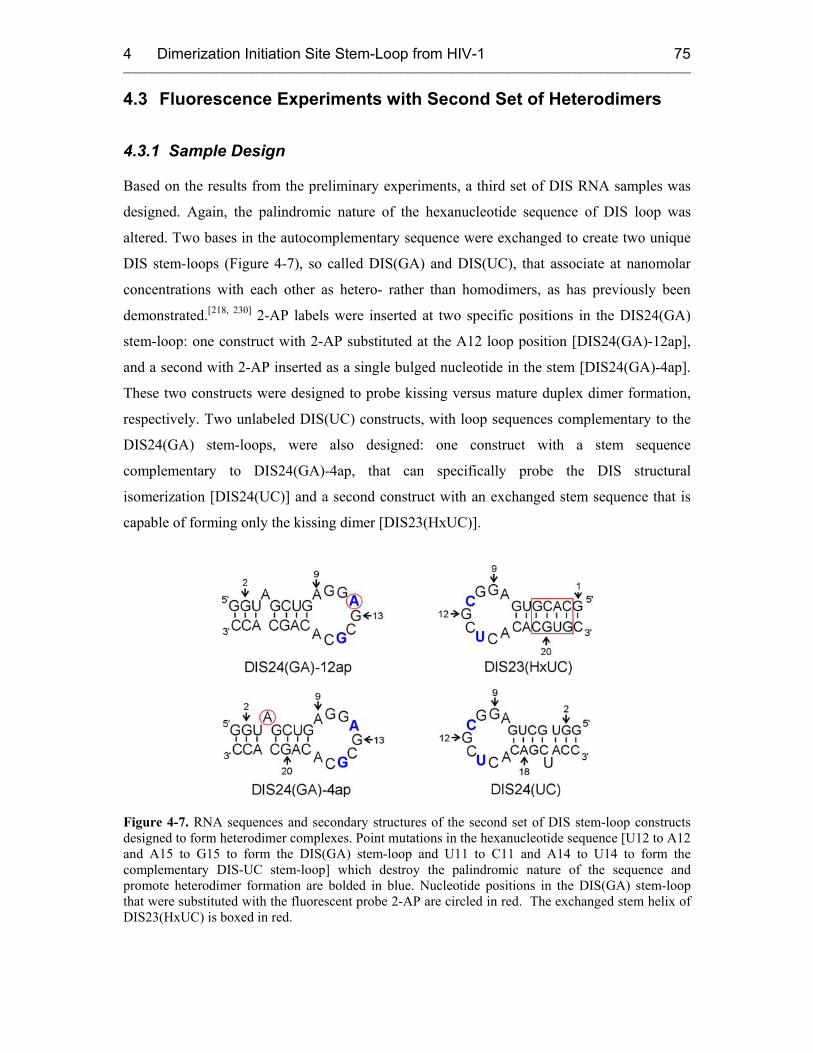
4 Dimerization Initiation Site Stem-Loop from HIV-1 ______________________________________________________________________________________________________
75
4.3 Fluorescence Experiments with Second Set of Heterodimers
4.3.1 Sample Design
Based on the results from the preliminary experiments, a third set of DIS RNA samples was
designed. Again, the palindromic nature of the hexanucleotide sequence of DIS loop was
altered. Two bases in the autocomplementary sequence were exchanged to create two unique
DIS stem-loops (Figure 4-7), so called DIS(GA) and DIS(UC), that associate at nanomolar
concentrations with each other as hetero- rather than homodimers, as has previously been
demonstrated.[218, 230] 2-AP labels were inserted at two specific positions in the DIS24(GA)
stem-loop: one construct with 2-AP substituted at the A12 loop position [DIS24(GA)-12ap],
and a second with 2-AP inserted as a single bulged nucleotide in the stem [DIS24(GA)-4ap].
These two constructs were designed to probe kissing versus mature duplex dimer formation,
respectively. Two unlabeled DIS(UC) constructs, with loop sequences complementary to the
DIS24(GA) stem-loops, were also designed: one construct with a stem sequence
complementary to DIS24(GA)-4ap, that can specifically probe the DIS structural
isomerization [DIS24(UC)] and a second construct with an exchanged stem sequence that is
capable of forming only the kissing dimer [DIS23(HxUC)].
Figure 4-7. RNA sequences and secondary structures of the second set of DIS stem-loop constructs designed to form heterodimer complexes. Point mutations in the hexanucleotide sequence [U12 to A12 and A15 to G15 to form the DIS(GA) stem-loop and U11 to C11 and A14 to U14 to form the complementary DIS-UC stem-loop] which destroy the palindromic nature of the sequence and promote heterodimer formation are bolded in blue. Nucleotide positions in the DIS(GA) stem-loop that were substituted with the fluorescent probe 2-AP are circled in red. The exchanged stem helix of DIS23(HxUC) is boxed in red.
4 Dimerization Initiation Site Stem-Loop from HIV-1 ______________________________________________________________________________________________________
76
These samples finally provided an in vitro model system with reliable, unambiguous, and
sensitive fluorescent probes for monitoring kissing complex, as well as NCp7 activated
duplex formation.
The NCp7 protein is a 72 amino acid protein, common to all HIV-1 variants, containing two
Zn-knuckles of the CCHC-motif with a basic linker. The protein sequence used in these
studies is essentially wild-type (wt), but consists of only the first 55 amino acids. The
truncated 55 amino acid NCp7 sequence contains only a single tryptophan in the C-terminal
Zn-knuckle. Sequence and secondary structure are shown in Figure 4-11.
4.3.2 Results
4.3.2.1 DIS Kissing Dimer Kinetics
Using this new set of heterodimer forming samples, equilibrium and kinetic binding constants
for the DIS loop-loop kissing interaction were determined. Titration of the DISMal derived
hairpin, DIS24(GA)-12ap, substituted with 2-AP at position A12 in the loop (Figure 4-7) with
either of the complementary DIS(UC) stem-loops [DIS24(UC) or DIS23(HxUC)] in the
presence of 5 mM Mg2+ at 25 °C, results in an approximately 6-fold decrease in 2-AP
fluorescence emission (Figure 4-8). The direction and magnitude of this fluorescence change
indicates that the 2-AP substituted base becomes significantly stacked upon binding, which is
consistent with 2-AP•U base pairing that would accompany the formation of the DIS kissing
complex loop-loop helix. From the fluorescence detected equilibrium binding experiments,
these heterodimeric DIS kissing complexes were found to have an average equilibrium
binding constant KD = 3 ± 1 nM. This result is consistent with previous measurements made
using other techniques,[223-226] and is in the same range as was determined for the entire 35-
nucleotide DIS stem-loop in chapter 4.2.2. These truncated DIS stem-loops therefore
faithfully mimic the kissing association of the wild-type 35-nucleotide DIS stem-loop and
provide a useful in vitro system for modeling this interaction.
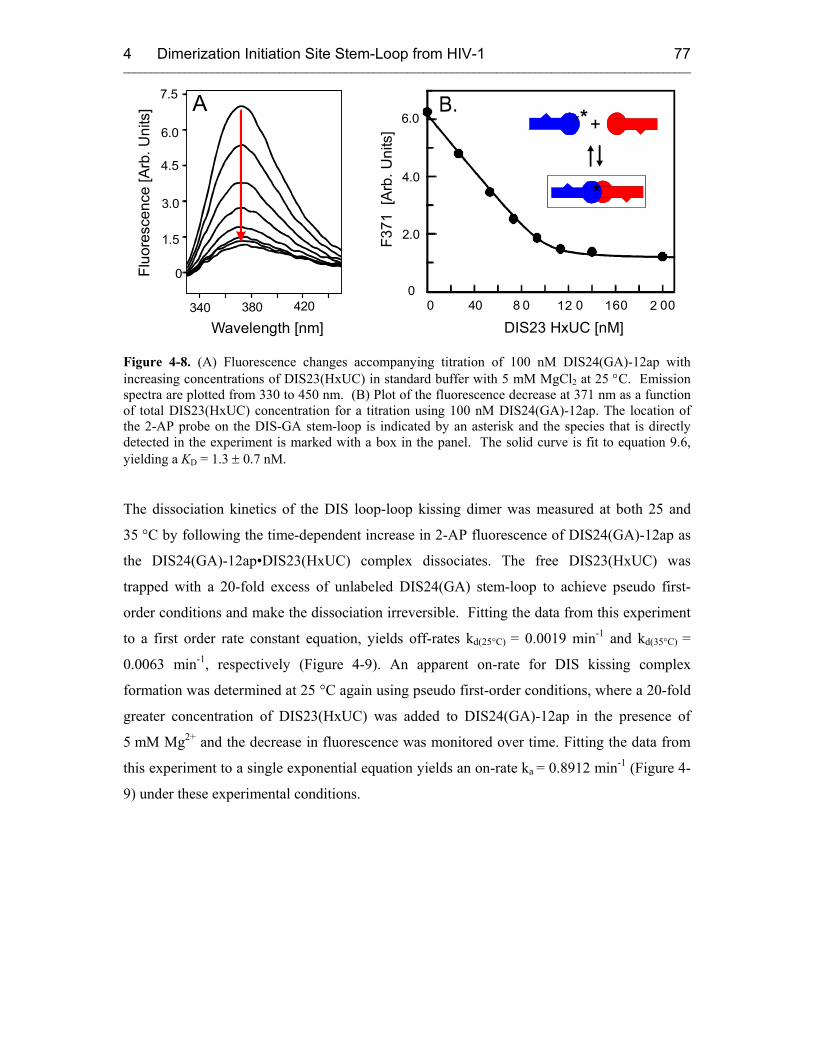
4 Dimerization Initiation Site Stem-Loop from HIV-1 ______________________________________________________________________________________________________
77
0
2.0
4.0
DIS23 HxUC [nM]0 8 0 12 0 160 2 0040
6.0
F371
[Arb
.Uni
ts] +*
*
340 380
Fluo
resc
ence
[Arb
.Uni
ts]
3.0
1.5
4.5
7.5
Wavelength [nm]420
0
A6.0
Figure 4-8. (A) Fluorescence changes accompanying titration of 100 nM DIS24(GA)-12ap with increasing concentrations of DIS23(HxUC) in standard buffer with 5 mM MgCl2 at 25 °C. Emission spectra are plotted from 330 to 450 nm. (B) Plot of the fluorescence decrease at 371 nm as a function of total DIS23(HxUC) concentration for a titration using 100 nM DIS24(GA)-12ap. The location of the 2-AP probe on the DIS-GA stem-loop is indicated by an asterisk and the species that is directly detected in the experiment is marked with a box in the panel. The solid curve is fit to equation 9.6, yielding a KD = 1.3 ± 0.7 nM.
The dissociation kinetics of the DIS loop-loop kissing dimer was measured at both 25 and
35 °C by following the time-dependent increase in 2-AP fluorescence of DIS24(GA)-12ap as
the DIS24(GA)-12ap•DIS23(HxUC) complex dissociates. The free DIS23(HxUC) was
trapped with a 20-fold excess of unlabeled DIS24(GA) stem-loop to achieve pseudo first-
order conditions and make the dissociation irreversible. Fitting the data from this experiment
to a first order rate constant equation, yields off-rates kd(25°C) = 0.0019 min-1 and kd(35°C) =
0.0063 min-1, respectively (Figure 4-9). An apparent on-rate for DIS kissing complex
formation was determined at 25 °C again using pseudo first-order conditions, where a 20-fold
greater concentration of DIS23(HxUC) was added to DIS24(GA)-12ap in the presence of
5 mM Mg2+ and the decrease in fluorescence was monitored over time. Fitting the data from
this experiment to a single exponential equation yields an on-rate ka = 0.8912 min-1 (Figure 4-
9) under these experimental conditions.
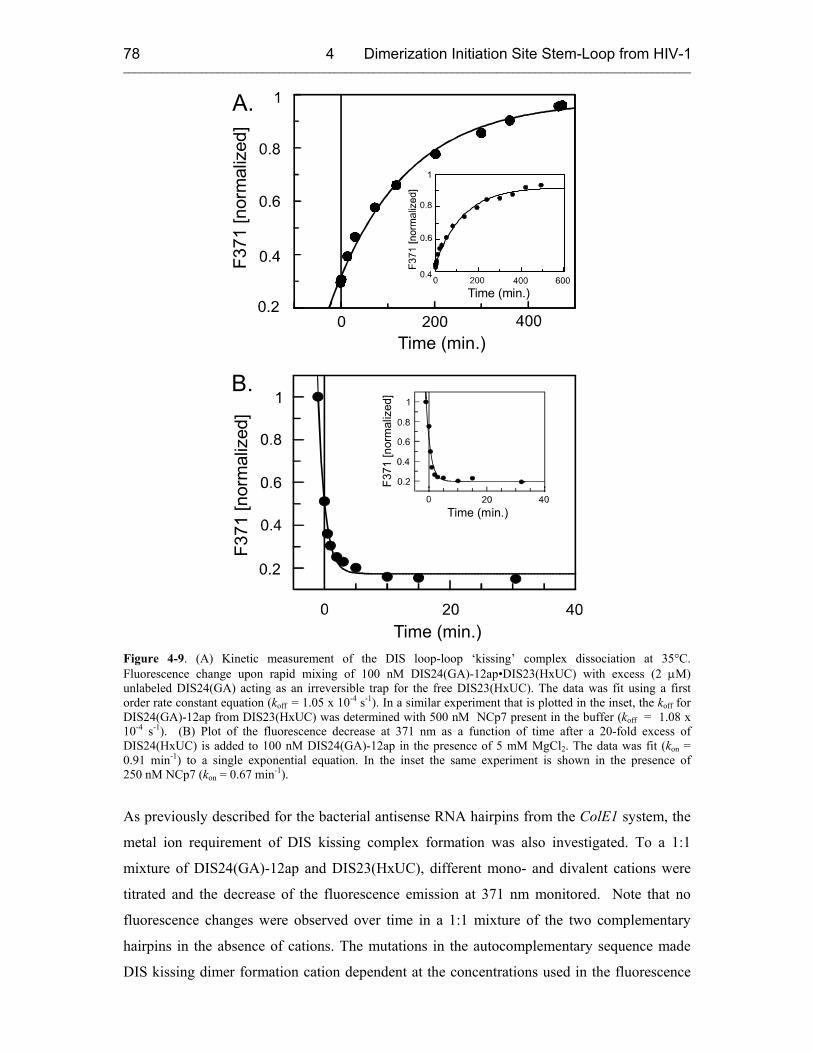
4 Dimerization Initiation Site Stem-Loop from HIV-1 ______________________________________________________________________________________________________
78
A.
Time (min.)
Time (min.)
F371
[nor
mal
ized
]
Time (min.)
F371
[nor
mal
ized
]
B.
Time (min.)
F371
[nor
mal
ized
]
Figure 4-9. (A) Kinetic measurement of the DIS loop-loop ‘kissing’ complex dissociation at 35°C. Fluorescence change upon rapid mixing of 100 nM DIS24(GA)-12ap•DIS23(HxUC) with excess (2 µM) unlabeled DIS24(GA) acting as an irreversible trap for the free DIS23(HxUC). The data was fit using a first order rate constant equation (koff = 1.05 x 10⁻⁴ s-1). In a similar experiment that is plotted in the inset, the koff for DIS24(GA)-12ap from DIS23(HxUC) was determined with 500 nM NCp7 present in the buffer (koff = 1.08 x 10⁻⁴ s-1). (B) Plot of the fluorescence decrease at 371 nm as a function of time after a 20-fold excess of DIS24(HxUC) is added to 100 nM DIS24(GA)-12ap in the presence of 5 mM MgCl2. The data was fit (kon = 0.91 min-1) to a single exponential equation. In the inset the same experiment is shown in the presence of 250 nM NCp7 (kon = 0.67 min-1).
As previously described for the bacterial antisense RNA hairpins from the ColE1 system, the
metal ion requirement of DIS kissing complex formation was also investigated. To a 1:1
mixture of DIS24(GA)-12ap and DIS23(HxUC), different mono- and divalent cations were
titrated and the decrease of the fluorescence emission at 371 nm monitored. Note that no
fluorescence changes were observed over time in a 1:1 mixture of the two complementary
hairpins in the absence of cations. The mutations in the autocomplementary sequence made
DIS kissing dimer formation cation dependent at the concentrations used in the fluorescence
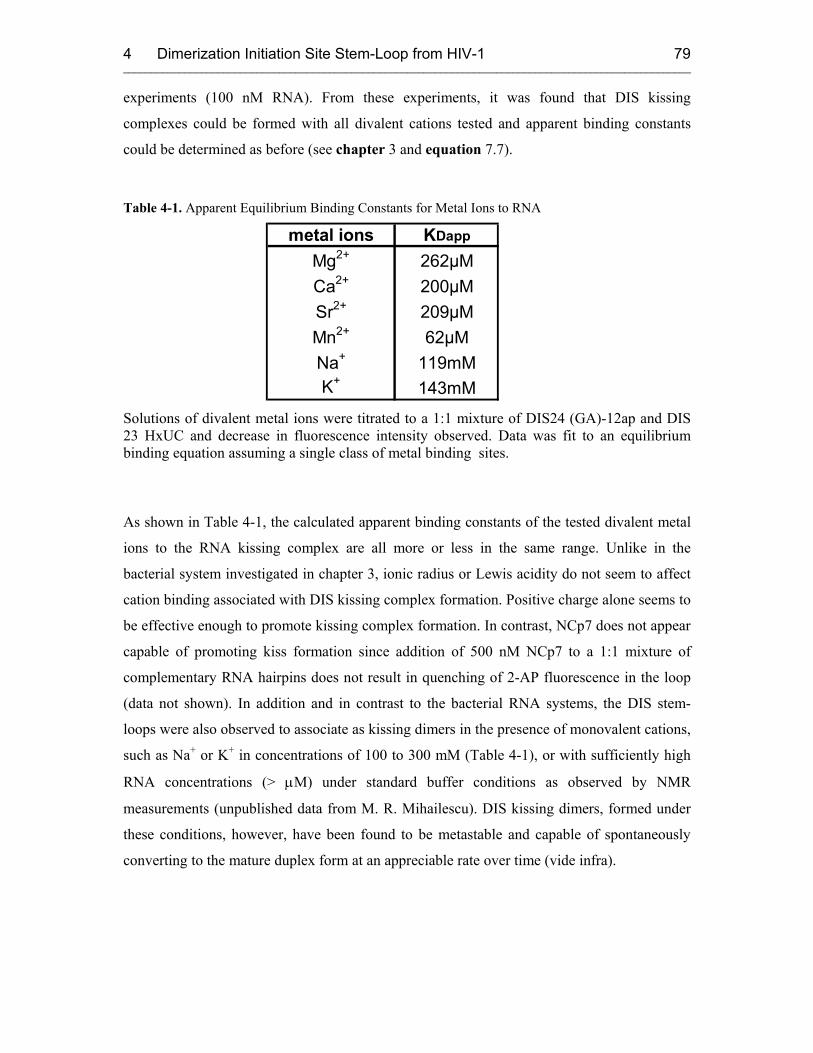
4 Dimerization Initiation Site Stem-Loop from HIV-1 ______________________________________________________________________________________________________
79
experiments (100 nM RNA). From these experiments, it was found that DIS kissing
complexes could be formed with all divalent cations tested and apparent binding constants
could be determined as before (see chapter 3 and equation 7.7).
Table 4-1. Apparent Equilibrium Binding Constants for Metal Ions to RNA
metal ions KDapp
Mg2+ 262µMCa2+ 200µMSr2+ 209µMMn2+ 62µMNa+ 119mMK+ 143mM
Solutions of divalent metal ions were titrated to a 1:1 mixture of DIS24 (GA)-12ap and DIS 23 HxUC and decrease in fluorescence intensity observed. Data was fit to an equilibrium binding equation assuming a single class of metal binding sites.
As shown in Table 4-1, the calculated apparent binding constants of the tested divalent metal
ions to the RNA kissing complex are all more or less in the same range. Unlike in the
bacterial system investigated in chapter 3, ionic radius or Lewis acidity do not seem to affect
cation binding associated with DIS kissing complex formation. Positive charge alone seems to
be effective enough to promote kissing complex formation. In contrast, NCp7 does not appear
capable of promoting kiss formation since addition of 500 nM NCp7 to a 1:1 mixture of
complementary RNA hairpins does not result in quenching of 2-AP fluorescence in the loop
(data not shown). In addition and in contrast to the bacterial RNA systems, the DIS stem-
loops were also observed to associate as kissing dimers in the presence of monovalent cations,
such as Na+ or K+ in concentrations of 100 to 300 mM (Table 4-1), or with sufficiently high
RNA concentrations (> µM) under standard buffer conditions as observed by NMR
measurements (unpublished data from M. R. Mihailescu). DIS kissing dimers, formed under
these conditions, however, have been found to be metastable and capable of spontaneously
converting to the mature duplex form at an appreciable rate over time (vide infra).
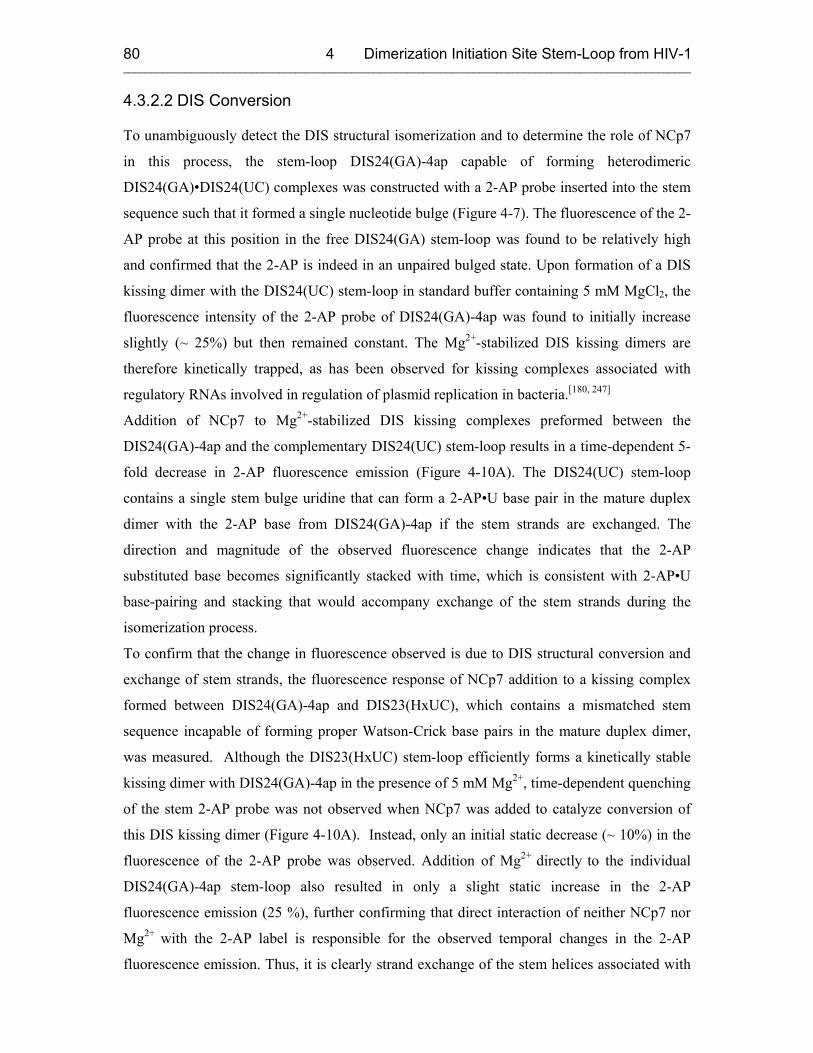
4 Dimerization Initiation Site Stem-Loop from HIV-1 ______________________________________________________________________________________________________
80
4.3.2.2 DIS Conversion
To unambiguously detect the DIS structural isomerization and to determine the role of NCp7
in this process, the stem-loop DIS24(GA)-4ap capable of forming heterodimeric
DIS24(GA)•DIS24(UC) complexes was constructed with a 2-AP probe inserted into the stem
sequence such that it formed a single nucleotide bulge (Figure 4-7). The fluorescence of the 2-
AP probe at this position in the free DIS24(GA) stem-loop was found to be relatively high
and confirmed that the 2-AP is indeed in an unpaired bulged state. Upon formation of a DIS
kissing dimer with the DIS24(UC) stem-loop in standard buffer containing 5 mM MgCl2, the
fluorescence intensity of the 2-AP probe of DIS24(GA)-4ap was found to initially increase
slightly (~ 25%) but then remained constant. The Mg2+-stabilized DIS kissing dimers are
therefore kinetically trapped, as has been observed for kissing complexes associated with
regulatory RNAs involved in regulation of plasmid replication in bacteria.[180, 247]
Addition of NCp7 to Mg2+-stabilized DIS kissing complexes preformed between the
DIS24(GA)-4ap and the complementary DIS24(UC) stem-loop results in a time-dependent 5-
fold decrease in 2-AP fluorescence emission (Figure 4-10A). The DIS24(UC) stem-loop
contains a single stem bulge uridine that can form a 2-AP•U base pair in the mature duplex
dimer with the 2-AP base from DIS24(GA)-4ap if the stem strands are exchanged. The
direction and magnitude of the observed fluorescence change indicates that the 2-AP
substituted base becomes significantly stacked with time, which is consistent with 2-AP•U
base-pairing and stacking that would accompany exchange of the stem strands during the
isomerization process.
To confirm that the change in fluorescence observed is due to DIS structural conversion and
exchange of stem strands, the fluorescence response of NCp7 addition to a kissing complex
formed between DIS24(GA)-4ap and DIS23(HxUC), which contains a mismatched stem
sequence incapable of forming proper Watson-Crick base pairs in the mature duplex dimer,
was measured. Although the DIS23(HxUC) stem-loop efficiently forms a kinetically stable
kissing dimer with DIS24(GA)-4ap in the presence of 5 mM Mg2+, time-dependent quenching
of the stem 2-AP probe was not observed when NCp7 was added to catalyze conversion of
this DIS kissing dimer (Figure 4-10A). Instead, only an initial static decrease (~ 10%) in the
fluorescence of the 2-AP probe was observed. Addition of Mg2+ directly to the individual
DIS24(GA)-4ap stem-loop also resulted in only a slight static increase in the 2-AP
fluorescence emission (25 %), further confirming that direct interaction of neither NCp7 nor
Mg2+ with the 2-AP label is responsible for the observed temporal changes in the 2-AP
fluorescence emission. Thus, it is clearly strand exchange of the stem helices associated with
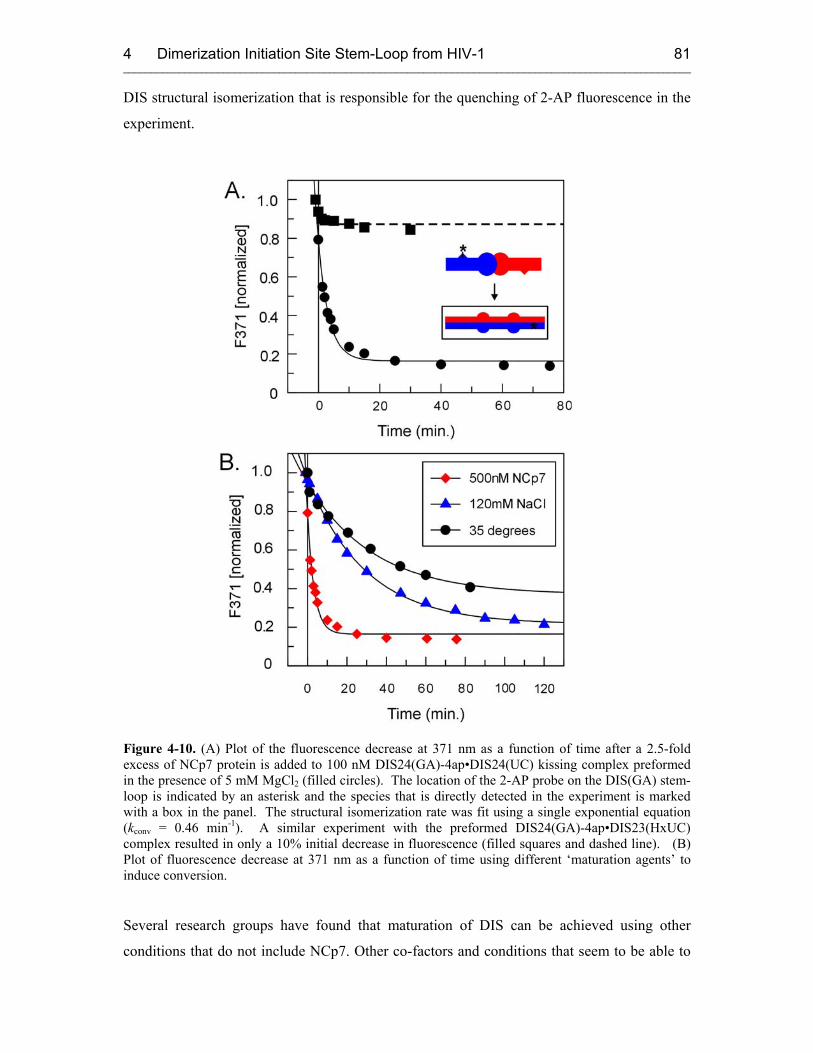
4 Dimerization Initiation Site Stem-Loop from HIV-1 ______________________________________________________________________________________________________
81
DIS structural isomerization that is responsible for the quenching of 2-AP fluorescence in the
experiment.
Figure 4-10. (A) Plot of the fluorescence decrease at 371 nm as a function of time after a 2.5-fold excess of NCp7 protein is added to 100 nM DIS24(GA)-4ap•DIS24(UC) kissing complex preformed in the presence of 5 mM MgCl2 (filled circles). The location of the 2-AP probe on the DIS(GA) stem-loop is indicated by an asterisk and the species that is directly detected in the experiment is marked with a box in the panel. The structural isomerization rate was fit using a single exponential equation (kconv = 0.46 min-1). A similar experiment with the preformed DIS24(GA)-4ap•DIS23(HxUC) complex resulted in only a 10% initial decrease in fluorescence (filled squares and dashed line). (B) Plot of fluorescence decrease at 371 nm as a function of time using different ‘maturation agents’ to induce conversion.
Several research groups have found that maturation of DIS can be achieved using other
conditions that do not include NCp7. Other co-factors and conditions that seem to be able to
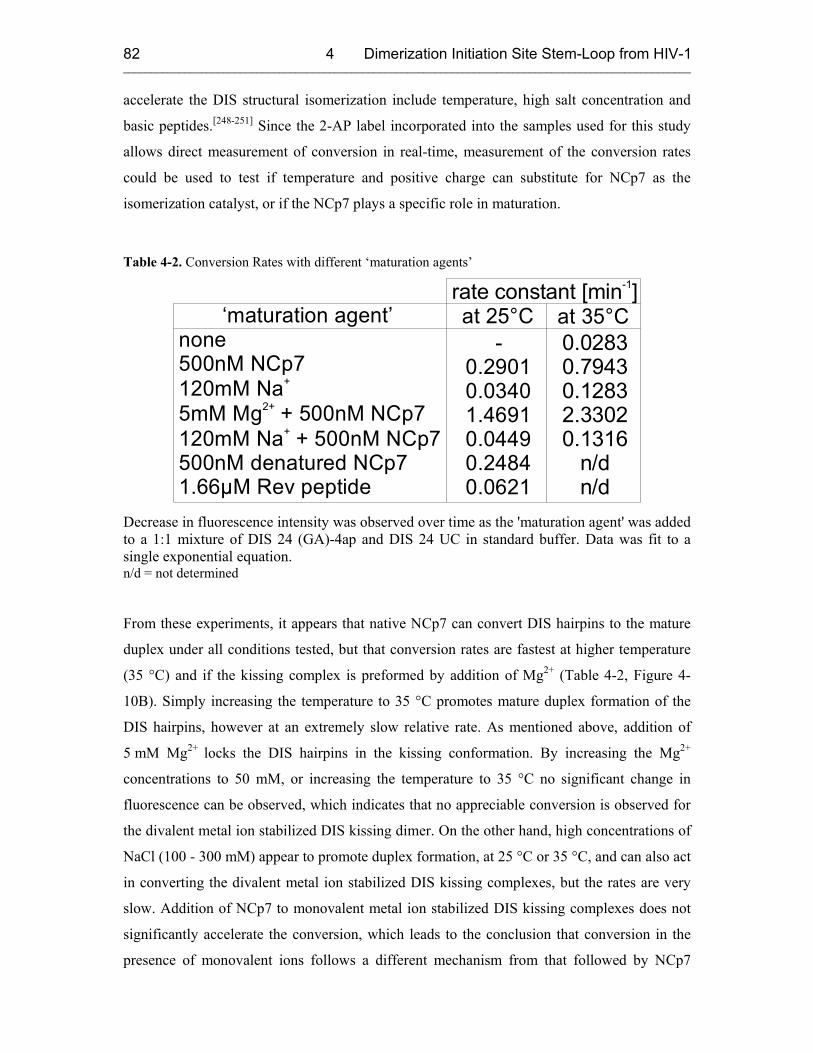
4 Dimerization Initiation Site Stem-Loop from HIV-1 ______________________________________________________________________________________________________
82
accelerate the DIS structural isomerization include temperature, high salt concentration and
basic peptides.[248-251] Since the 2-AP label incorporated into the samples used for this study
allows direct measurement of conversion in real-time, measurement of the conversion rates
could be used to test if temperature and positive charge can substitute for NCp7 as the
isomerization catalyst, or if the NCp7 plays a specific role in maturation.
Table 4-2. Conversion Rates with different ‘maturation agents’
‘maturation agent’none500nM NCp7120mM Na 5mM Mg + 500nM NCp7120mM Na + 500nM NCp7500nM denatured NCp71.66µM Rev peptide
+
2+
+
rate constant [min ]-1
at 25°C0.02830.79430.12832.33020.1316 n/d n/d
-0.29010.03401.46910.04490.24840.0621
at 35°C
Decrease in fluorescence intensity was observed over time as the 'maturation agent' was added to a 1:1 mixture of DIS 24 (GA)-4ap and DIS 24 UC in standard buffer. Data was fit to a single exponential equation. n/d = not determined
From these experiments, it appears that native NCp7 can convert DIS hairpins to the mature
duplex under all conditions tested, but that conversion rates are fastest at higher temperature
(35 °C) and if the kissing complex is preformed by addition of Mg2+ (Table 4-2, Figure 4-
10B). Simply increasing the temperature to 35 °C promotes mature duplex formation of the
DIS hairpins, however at an extremely slow relative rate. As mentioned above, addition of
5 mM Mg2+ locks the DIS hairpins in the kissing conformation. By increasing the Mg2+
concentrations to 50 mM, or increasing the temperature to 35 °C no significant change in
fluorescence can be observed, which indicates that no appreciable conversion is observed for
the divalent metal ion stabilized DIS kissing dimer. On the other hand, high concentrations of
NaCl (100 - 300 mM) appear to promote duplex formation, at 25 °C or 35 °C, and can also act
in converting the divalent metal ion stabilized DIS kissing complexes, but the rates are very
slow. Addition of NCp7 to monovalent metal ion stabilized DIS kissing complexes does not
significantly accelerate the conversion, which leads to the conclusion that conversion in the
presence of monovalent ions follows a different mechanism from that followed by NCp7

4 Dimerization Initiation Site Stem-Loop from HIV-1 ______________________________________________________________________________________________________
83
acting on the divalent metal ion stabilized DIS kissing complexes. The 22 amino acid Rev
peptide, derived from the 116 residue HIV viral protein Rev, was also assayed for its ability to
promote DIS conversion. Rev contains 10 arginines and is a highly basic peptide, which has
little structure in solution. Using the fluorescence assay, it was demonstrated that Rev can also
act in converting DIS, but that a much higher concentration is needed to catalyze the reaction
in comparison to NCp7 and the rates are again significantly slower than with NCp7.
To test if the folded state of NCp7 is important for is activity as a RNA folding chaperone, the
protein structure was disrupted through removal of the Zn2+ ions by treatment with the
aromatic nitroso-compound, 3-Nitrosobenzamide. Removal of the zinc is expected to disrupt
the native Zn-knuckle structures of NCp7. Performing the conversion experiment with
denatured NCp7 showed that this form of NCp7 could still convert DIS kiss to duplex, but not
quite as effectively as the native NCp7. This result is in agreement with an earlier study with
the DIS Lai sequence.[230] Thus, the catalytic function of NCp7 in DIS maturation can not be
reduced solely to its positive charge. Of all the conditions tested, folded NCp7 is the agent
with the most effective conversion rates when added to the divalent metal ion stabilized DIS
kissing dimer (Table 4-2). These conditions most likely reflect those in vivo and lead to the
possibility that protease activated NCp7 could be a mechanism for temporal control of
maturation of the packaged immature genomic RNA dimer in the post budded viral particle.
Newly transcribed copies of HIV-1 genomic RNA might first associate in cells via a kissing
dimer since these types of dimers form with relatively fast kinetic association rates and are
quite stable under native cell conditions where Mg2+, as well as other divalent metal ions are
present. Proteolytic release of NCp7 in the post-budded immature viral particle would then
allow absolute temporal control over DIS refolding and associated viral maturation.
4.3.2.3 NCp7 Mechanism
To further elucidate the role of NCp7 in the DIS dimer isomerization, the importance of
preformation of the DIS kissing dimer structure in specific NCp7 binding and activity was
examined using antisense oligonucleotide probes (Figure 4-11). DIS conversion rates were
measured essentially as described above in the presence of a 10-fold excess of 6mer and 7mer
antisense DNA oligonucleotides complementary to the central loop sequence, which compete
with the DIS(UC) for binding to the DIS(GA) loop and thereby slow down the
DIS(GA)•DIS(UC) kissing association rate.[224] At a 10-fold excess concentration, saturated
binding of the oligonucleotides to the DIS(GA) loop is observed (data not shown). If
preformation of the DIS kissing dimer structure is important for NCp7 activated
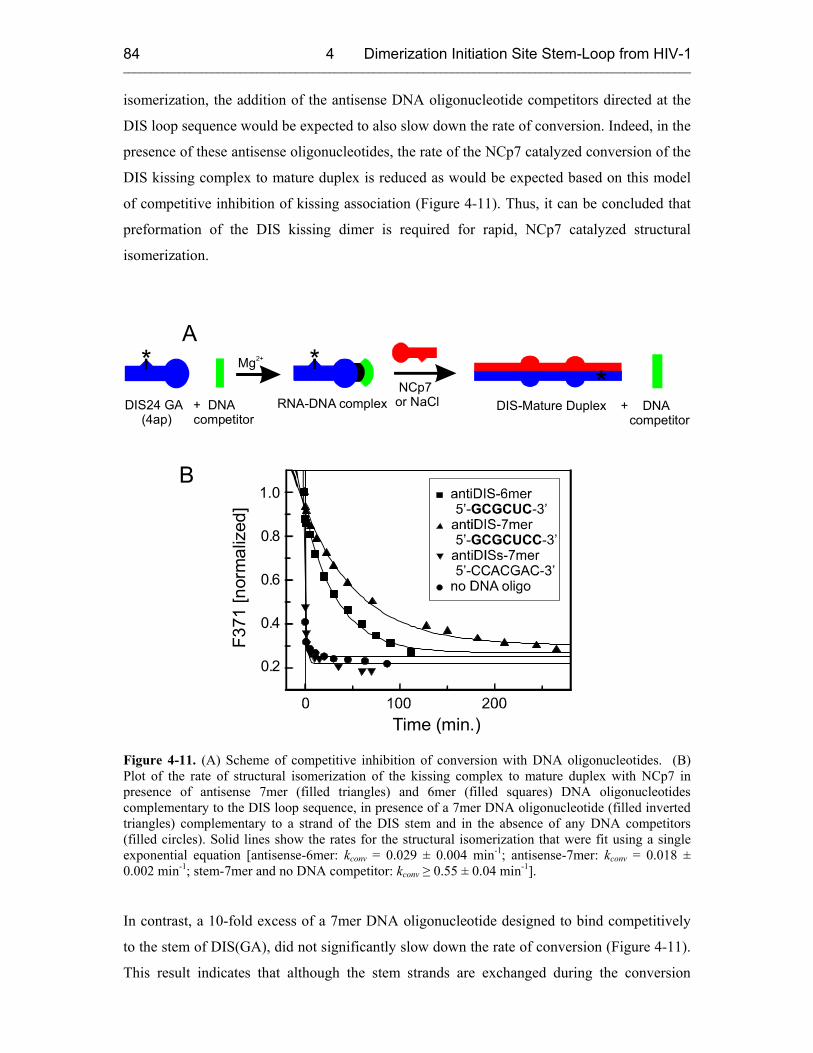
4 Dimerization Initiation Site Stem-Loop from HIV-1 ______________________________________________________________________________________________________
84
isomerization, the addition of the antisense DNA oligonucleotide competitors directed at the
DIS loop sequence would be expected to also slow down the rate of conversion. Indeed, in the
presence of these antisense oligonucleotides, the rate of the NCp7 catalyzed conversion of the
DIS kissing complex to mature duplex is reduced as would be expected based on this model
of competitive inhibition of kissing association (Figure 4-11). Thus, it can be concluded that
preformation of the DIS kissing dimer is required for rapid, NCp7 catalyzed structural
isomerization.
B
F371
[nor
mal
ized
]
Time (min.)
0.2
0.4
0.6
0.8
1.0
A
NCp7 or NaCl
*DIS-Mature Duplex + DNA competitor
DIS24 GA + DNA competitor (4ap)
* Mg2+ *RNA-DNA complex
Figure 4-11. (A) Scheme of competitive inhibition of conversion with DNA oligonucleotides. (B) Plot of the rate of structural isomerization of the kissing complex to mature duplex with NCp7 in presence of antisense 7mer (filled triangles) and 6mer (filled squares) DNA oligonucleotides complementary to the DIS loop sequence, in presence of a 7mer DNA oligonucleotide (filled inverted triangles) complementary to a strand of the DIS stem and in the absence of any DNA competitors (filled circles). Solid lines show the rates for the structural isomerization that were fit using a single exponential equation [antisense-6mer: kconv = 0.029 ± 0.004 min-1; antisense-7mer: kconv = 0.018 ± 0.002 min-1; stem-7mer and no DNA competitor: kconv ≥ 0.55 ± 0.04 min-1].
In contrast, a 10-fold excess of a 7mer DNA oligonucleotide designed to bind competitively
to the stem of DIS(GA), did not significantly slow down the rate of conversion (Figure 4-11).
This result indicates that although the stem strands are exchanged during the conversion
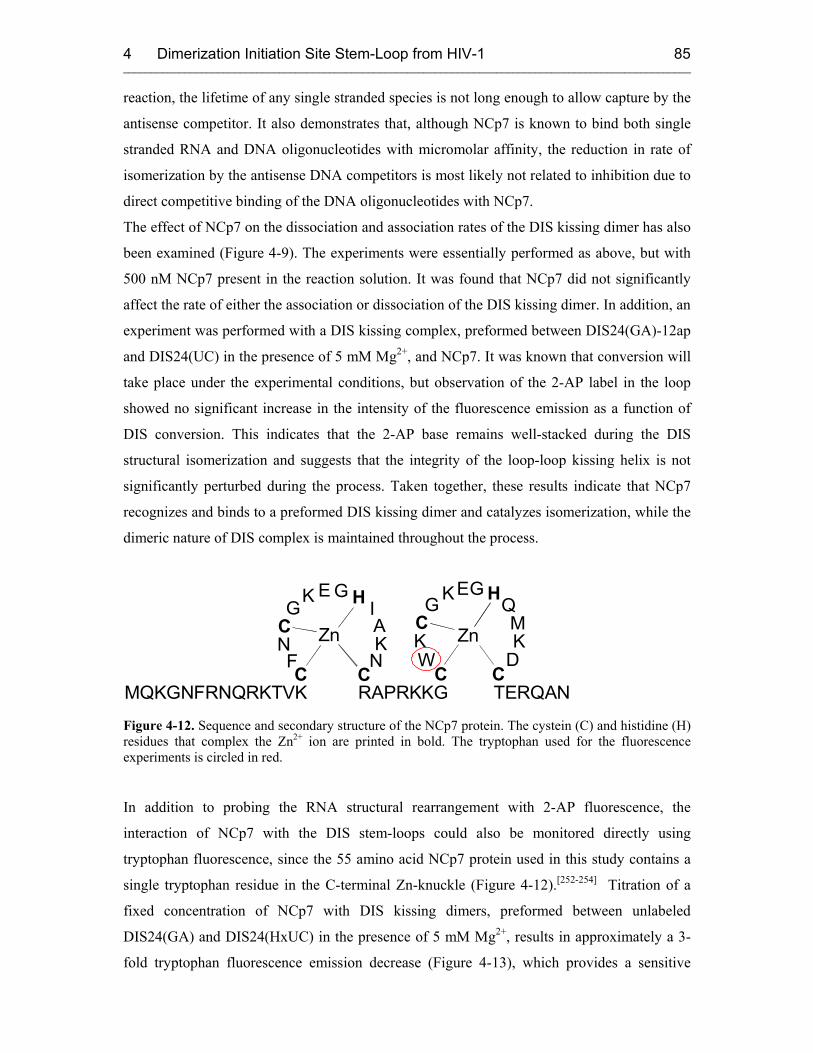
4 Dimerization Initiation Site Stem-Loop from HIV-1 ______________________________________________________________________________________________________
85
reaction, the lifetime of any single stranded species is not long enough to allow capture by the
antisense competitor. It also demonstrates that, although NCp7 is known to bind both single
stranded RNA and DNA oligonucleotides with micromolar affinity, the reduction in rate of
isomerization by the antisense DNA competitors is most likely not related to inhibition due to
direct competitive binding of the DNA oligonucleotides with NCp7.
The effect of NCp7 on the dissociation and association rates of the DIS kissing dimer has also
been examined (Figure 4-9). The experiments were essentially performed as above, but with
500 nM NCp7 present in the reaction solution. It was found that NCp7 did not significantly
affect the rate of either the association or dissociation of the DIS kissing dimer. In addition, an
experiment was performed with a DIS kissing complex, preformed between DIS24(GA)-12ap
and DIS24(UC) in the presence of 5 mM Mg2+, and NCp7. It was known that conversion will
take place under the experimental conditions, but observation of the 2-AP label in the loop
showed no significant increase in the intensity of the fluorescence emission as a function of
DIS conversion. This indicates that the 2-AP base remains well-stacked during the DIS
structural isomerization and suggests that the integrity of the loop-loop kissing helix is not
significantly perturbed during the process. Taken together, these results indicate that NCp7
recognizes and binds to a preformed DIS kissing dimer and catalyzes isomerization, while the
dimeric nature of DIS complex is maintained throughout the process.
MQKGNFRNQRKTVK RAPRKKG TERQANC
FNCG
K E G H IAK
NC C
WKCG KEG HQ
MK
DC
Zn Zn
Figure 4-12. Sequence and secondary structure of the NCp7 protein. The cystein (C) and histidine (H) residues that complex the Zn2+ ion are printed in bold. The tryptophan used for the fluorescence experiments is circled in red.
In addition to probing the RNA structural rearrangement with 2-AP fluorescence, the
interaction of NCp7 with the DIS stem-loops could also be monitored directly using
tryptophan fluorescence, since the 55 amino acid NCp7 protein used in this study contains a
single tryptophan residue in the C-terminal Zn-knuckle (Figure 4-12).[252-254] Titration of a
fixed concentration of NCp7 with DIS kissing dimers, preformed between unlabeled
DIS24(GA) and DIS24(HxUC) in the presence of 5 mM Mg2+, results in approximately a 3-
fold tryptophan fluorescence emission decrease (Figure 4-13), which provides a sensitive
4 Dimerization Initiation Site Stem-Loop from HIV-1 ______________________________________________________________________________________________________
86
measure for the binding reaction. Using tryptophan fluorescence quenching, NCp7 is
observed to bind the DIS stem-loop kissing dimer with high affinity (KD = 61 ± 12 nM) and in
a saturated fashion (Figure 4-13). An approximate stoichiometry of two NCp7s per one RNA
dimer can also be estimated from the fluorescence binding curves, which is consistent with
the C2-symmetry of the DIS dimer. While tryptophan fluorescence clearly monitors one high-
affinity class of NCp7 interaction with the DIS kissing dimer, this does not exclude the
possibility that additional NCp7 binding event(s) might be undetected when using tryptophan
as a reporter. This could be a potential reason for why a second lower affinity ‘catalytic’
NCp7 binding class, which is implied by the NCp7 catalyzed DIS isomerization experiments
described below, may not be detected by the tryptophan fluorescence measurements.
NCp7 tryptophan fluorescence intensity could also be monitored as a function of DIS
conversion. In this experiment, where a DIS kissing complex, preformed between unlabeled
DIS24(GA) and DIS24(UC) in the presence of 5 mM Mg2+, was added to 500 nM NCp7, the
tryptophan fluorescence was observed to remain highly quenched during the entire course of
the DIS structural isomerization, suggesting that the high-affinity sites for NCp7 binding to
the DIS kissing dimer remain occupied during the course of the structural conversion and
even in the mature extended duplex form.
To further examine the ability of NCp7 to act catalytically in the DIS structural isomerization
reaction, conversion rates were monitored using 2-AP fluorescence as a function of NCp7
concentration. Under the conditions used in this experiment, DIS conversion was not
observed in the absence of NCp7. Figure 4-13 shows fits for the rates of conversion of
100 nM DIS24(GA)-4ap•DIS24(UC) kissing dimer as a function of increasing NCp7
concentrations over a range of 75 to 500 nM. In all cases where NCp7 is added, the structural
isomerization is observed to go to completion as evidenced by the common plateau of final
fluorescence emission intensity. However, two distinct ranges of conversion rates are
observed which correspond to ratios of NCp7 to DIS kissing dimer that are either above or
below the estimated 2:1 NCp7:DIS stoichiometry of binding. An apparently maximal rate of
conversion is observed when the NCp7 concentration is above the 2:1 NCp7:DIS
stoichiometry for high-affinity binding, while a slower average rate is observed at
substoichiometric ratios of protein to DIS kissing dimer.
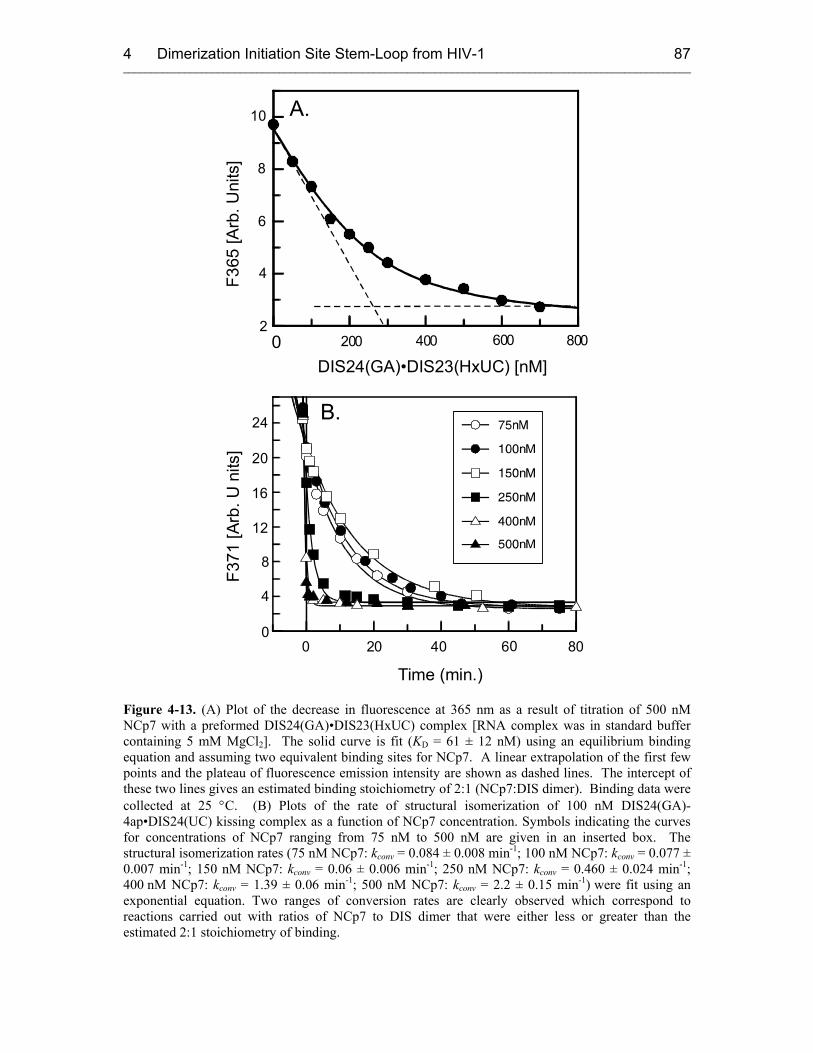
4 Dimerization Initiation Site Stem-Loop from HIV-1 ______________________________________________________________________________________________________
87
F365
[Arb
.Uni
ts]
0 200 400 600 8002
4
6
8
DIS24(GA) DIS23(HxUC) [nM]•
10 A.
F371
[Arb
. U n
its]
B.
Time (min.)
20
24
16
12
8
4
00 002 40 6 80
Figure 4-13. (A) Plot of the decrease in fluorescence at 365 nm as a result of titration of 500 nM NCp7 with a preformed DIS24(GA)•DIS23(HxUC) complex [RNA complex was in standard buffer containing 5 mM MgCl2]. The solid curve is fit (KD = 61 ± 12 nM) using an equilibrium binding equation and assuming two equivalent binding sites for NCp7. A linear extrapolation of the first few points and the plateau of fluorescence emission intensity are shown as dashed lines. The intercept of these two lines gives an estimated binding stoichiometry of 2:1 (NCp7:DIS dimer). Binding data were collected at 25 °C. (B) Plots of the rate of structural isomerization of 100 nM DIS24(GA)-4ap•DIS24(UC) kissing complex as a function of NCp7 concentration. Symbols indicating the curves for concentrations of NCp7 ranging from 75 nM to 500 nM are given in an inserted box. The structural isomerization rates (75 nM NCp7: kconv = 0.084 ± 0.008 min-1; 100 nM NCp7: kconv = 0.077 ± 0.007 min-1; 150 nM NCp7: kconv = 0.06 ± 0.006 min-1; 250 nM NCp7: kconv = 0.460 ± 0.024 min-1; 400 nM NCp7: kconv = 1.39 ± 0.06 min-1; 500 nM NCp7: kconv = 2.2 ± 0.15 min-1) were fit using an exponential equation. Two ranges of conversion rates are clearly observed which correspond to reactions carried out with ratios of NCp7 to DIS dimer that were either less or greater than the estimated 2:1 stoichiometry of binding.
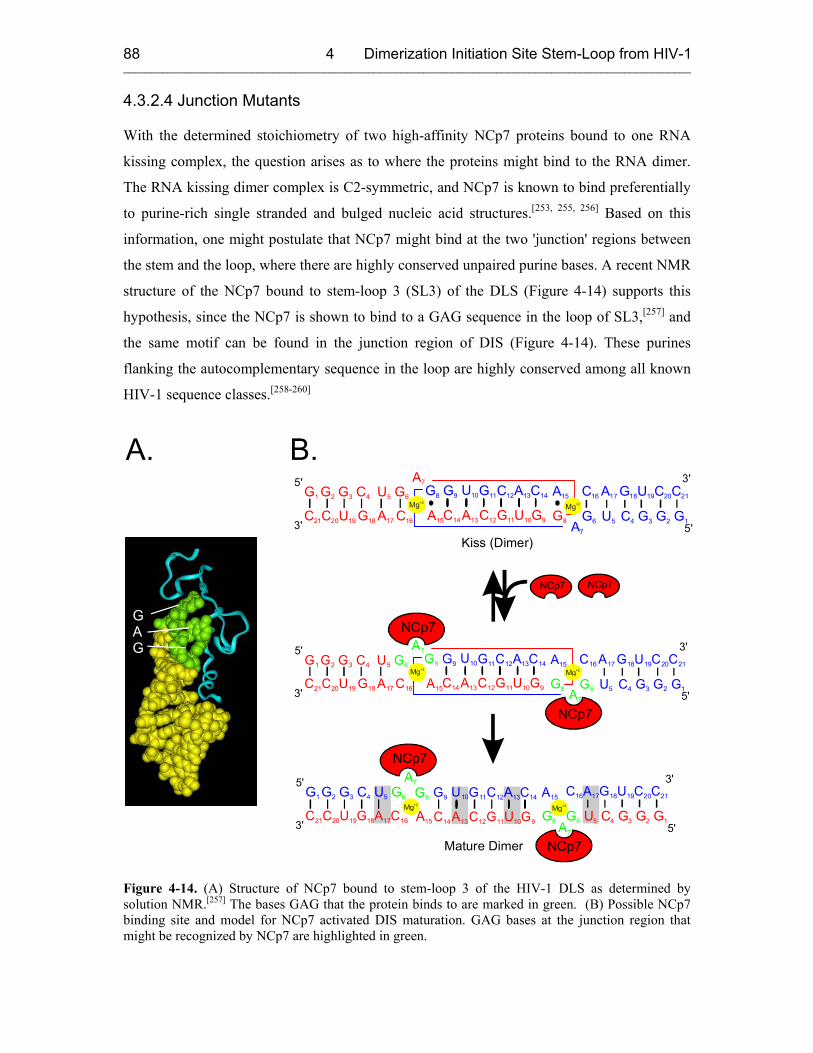
4 Dimerization Initiation Site Stem-Loop from HIV-1 ______________________________________________________________________________________________________
88
4.3.2.4 Junction Mutants
With the determined stoichiometry of two high-affinity NCp7 proteins bound to one RNA
kissing complex, the question arises as to where the proteins might bind to the RNA dimer.
The RNA kissing dimer complex is C2-symmetric, and NCp7 is known to bind preferentially
to purine-rich single stranded and bulged nucleic acid structures.[253, 255, 256] Based on this
information, one might postulate that NCp7 might bind at the two 'junction' regions between
the stem and the loop, where there are highly conserved unpaired purine bases. A recent NMR
structure of the NCp7 bound to stem-loop 3 (SL3) of the DLS (Figure 4-14) supports this
hypothesis, since the NCp7 is shown to bind to a GAG sequence in the loop of SL3,[257] and
the same motif can be found in the junction region of DIS (Figure 4-14). These purines
flanking the autocomplementary sequence in the loop are highly conserved among all known
HIV-1 sequence classes.[258-260]
NCp7 NCp7
Kiss (Dimer)
G9
A7
A15 C12C14 G U C G G G6 5 4 3 2 1
C A G U C C16 17 18 19 20 21
5'
3'
G11A13
G9 C12 C14G11 A13
A7
A15G8
U10
U10
G8
G G G C U G1 2 3 4 5 6
C C U G A C21 20 19 18 17 16
5'
3'
Mg+2Mg+2
NCp7
NCp7
G9
A7
A15 C12C14 G6 5 4 3 2 1U C G G G
C A G U C C16 17 18 19 20 21
5'
3'
G11A13
C12 C14G11 A13
A7
A15G8
U10
U10
G8
G G G C U1 2 3 4 5 G6
C C U G A C21 20 19 18 17 16
5'
3'
Mg+2Mg+2Mg+2
Mature Dimer NCp7
NCp7
G G G C U1 2 3 4 5 G6
C C U G A C21 20 19 18 17 16 G9
A7
A15 C12C14
5'
3'G6 5 4 3 2 1U C G G G
C A G U C C16 17 18 19 20 21
5'
3'
G11A13
G9 C12 C14G11 A13
A7
A15
G8U10
U10G8Mg+2 Mg+2
A. B.
GAG
Figure 4-14. (A) Structure of NCp7 bound to stem-loop 3 of the HIV-1 DLS as determined by solution NMR.[257] The bases GAG that the protein binds to are marked in green. (B) Possible NCp7 binding site and model for NCp7 activated DIS maturation. GAG bases at the junction region that might be recognized by NCp7 are highlighted in green.

4 Dimerization Initiation Site Stem-Loop from HIV-1 ______________________________________________________________________________________________________
89
To investigate the potential role of the conserved purines in NCp7 binding, DIS kissing
complex stability and structural conversion, point mutations were made at these base
positions in the model DIS hairpins. The resulting so called ‘junction mutant’ DIS RNA
oligonucleotide samples are only slightly modified as compared to the previously described
samples, where the two mutations in the hexanucleotide sequence and the single nucleotide
stem bulge were maintained, and the nucleotides 1, 2 and 9 in the loop were systematically
mutated one by one or in pairs, while at the same time not introducing the possibility for any
new base pairs in the mutant sequences that would extend either the stem or loop helix.
(Figure 4-15).
Figure 4-15. RNA sequences and secondary structures of the DIS ‘junction mutant’ stem-loop constructs designed to form heterodimer complexes. Point mutations in the loop sequence in addition to the GA and UC are bolded in blue, positions substituted with 2-AP are circled in red.
4 Dimerization Initiation Site Stem-Loop from HIV-1 ______________________________________________________________________________________________________
90
Using the junction mutant samples, it was first tested if the kinetics of the kiss formation were
affected. Titration of unlabeled complement (DIS24(A1C)UC or DIS24 (G2C)UC) to a fixed
concentration of 2-AP loop-labeled hairpin (DIS24GA (A1C)-12ap or DIS24GA (G2C)-12ap)
in the presence of Mg2+, and fitting of the data to equation 9.6, yielded equilibrium binding
constants of KDaverage = 1.6 nM that were not significantly different from the previous results.
Thus, it was concluded that the kissing dimer stability is not affected by the mutations. In
contrast to what was expected based on a model of NCp7 binding to the junction, the apparent
binding affinity of NCp7 to DIS kisses formed with junction mutants did not change
dramatically. Titration of a fixed concentration of NCp7 with a kissing complex preformed
between unlabeled DIS24GA and DIS24(A1C)UC or DIS24(G2C)UC in the presence of
5 mM Mg2+ yielded binding constants of ~50 nM. NCp7 binding was therefore not affected
by the mutations, which means either that NCp7 does not bind in the junction region as
predicted, or that it does not recognize a specific sequence but rather the tertiary structure at
the junctions of the kissing complex.
The effect of the junction mutations on the rates of conversion of the DIS hairpins from
kissing to mature duplex was investigated. In these experiments, the kissing complexes were
preformed in the presence of 5 mM Mg2+, before adding NCp7 to promote conversion at
20 °C. It seemed that kissing complexes that contained one or two (G2C) mutants converted
faster than GA•UC kisses, and that (A1C) mutants showed slower isomerization rates (Figure
4-16), whereas the (G2A/A9C) and (G2A) mutants were not significantly different from the
GA•UC kisses.
Surprisingly, the double mutant samples, DIS24(G2C/A9C)UC and DIS24(A1G)UC showed
a spontaneous pronounced decrease in fluorescence emission intensity of the DIS24(GA)-4ap
sample upon addition of only Mg2+. These results suggested that the double junction mutant
DIS samples can convert to duplex with divalent cations as maturation agents. Since
spontaneous conversion is apparently occurring for these mutant samples, the conversion rates
with NCp7 were not determined.
In summary, the results obtained from the junction mutant experiments suggest a possible role
for the conserved purine nucleotides (especially adenosine at position 1 of the loop) in the
conversion potential of the DIS kissing dimer, more experiments clearly need to be performed
to confirm the results on the Mg2+-dependent conversion and to find out the specific role of
each of the three mutated nucleotides.
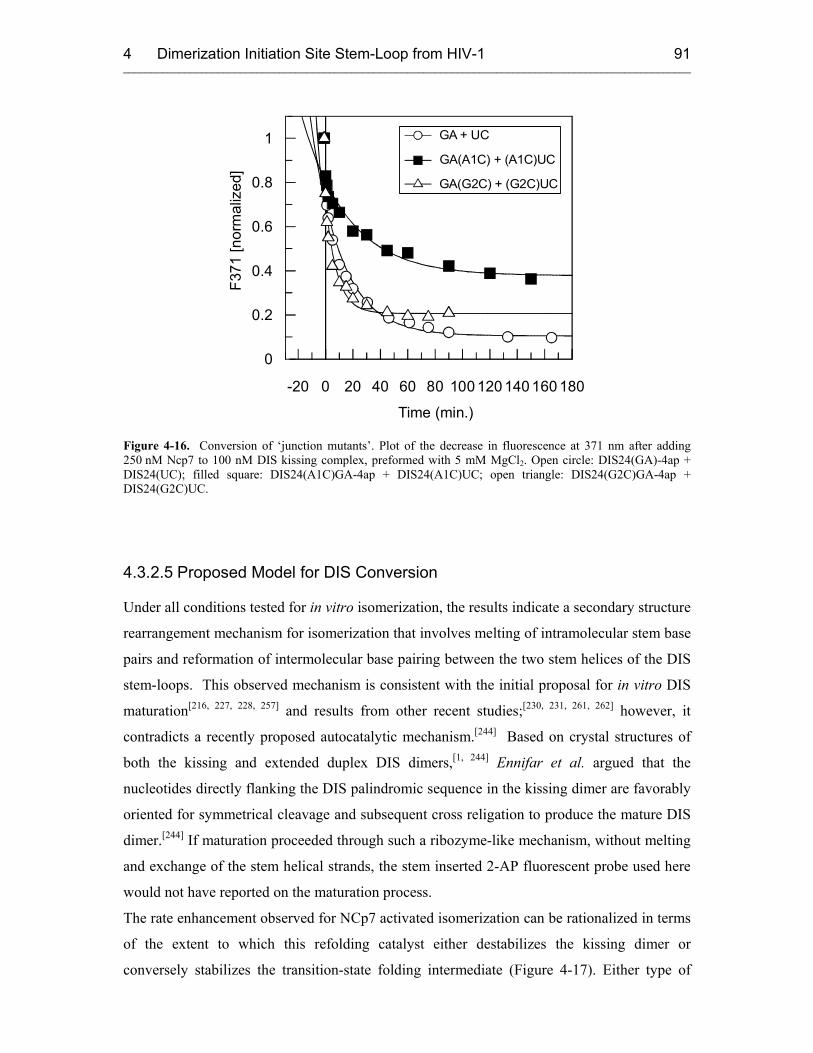
4 Dimerization Initiation Site Stem-Loop from HIV-1 ______________________________________________________________________________________________________
91
-20 0 20 40 60 80 100 120 140 160 180
0
Time (min.)
0.2
0.4
0.6
0.8
1
F371
[nor
mal
ized
]
GA + UC
GA(A1C) + (A1C)UC
GA(G2C) + (G2C)UC
Figure 4-16. Conversion of ‘junction mutants’. Plot of the decrease in fluorescence at 371 nm after adding 250 nM Ncp7 to 100 nM DIS kissing complex, preformed with 5 mM MgCl2. Open circle: DIS24(GA)-4ap + DIS24(UC); filled square: DIS24(A1C)GA-4ap + DIS24(A1C)UC; open triangle: DIS24(G2C)GA-4ap + DIS24(G2C)UC.
4.3.2.5 Proposed Model for DIS Conversion
Under all conditions tested for in vitro isomerization, the results indicate a secondary structure
rearrangement mechanism for isomerization that involves melting of intramolecular stem base
pairs and reformation of intermolecular base pairing between the two stem helices of the DIS
stem-loops. This observed mechanism is consistent with the initial proposal for in vitro DIS
maturation[216, 227, 228, 257] and results from other recent studies;[230, 231, 261, 262] however, it
contradicts a recently proposed autocatalytic mechanism.[244] Based on crystal structures of
both the kissing and extended duplex DIS dimers,[1, 244] Ennifar et al. argued that the
nucleotides directly flanking the DIS palindromic sequence in the kissing dimer are favorably
oriented for symmetrical cleavage and subsequent cross religation to produce the mature DIS
dimer.[244] If maturation proceeded through such a ribozyme-like mechanism, without melting
and exchange of the stem helical strands, the stem inserted 2-AP fluorescent probe used here
would not have reported on the maturation process.
The rate enhancement observed for NCp7 activated isomerization can be rationalized in terms
of the extent to which this refolding catalyst either destabilizes the kissing dimer or
conversely stabilizes the transition-state folding intermediate (Figure 4-17). Either type of
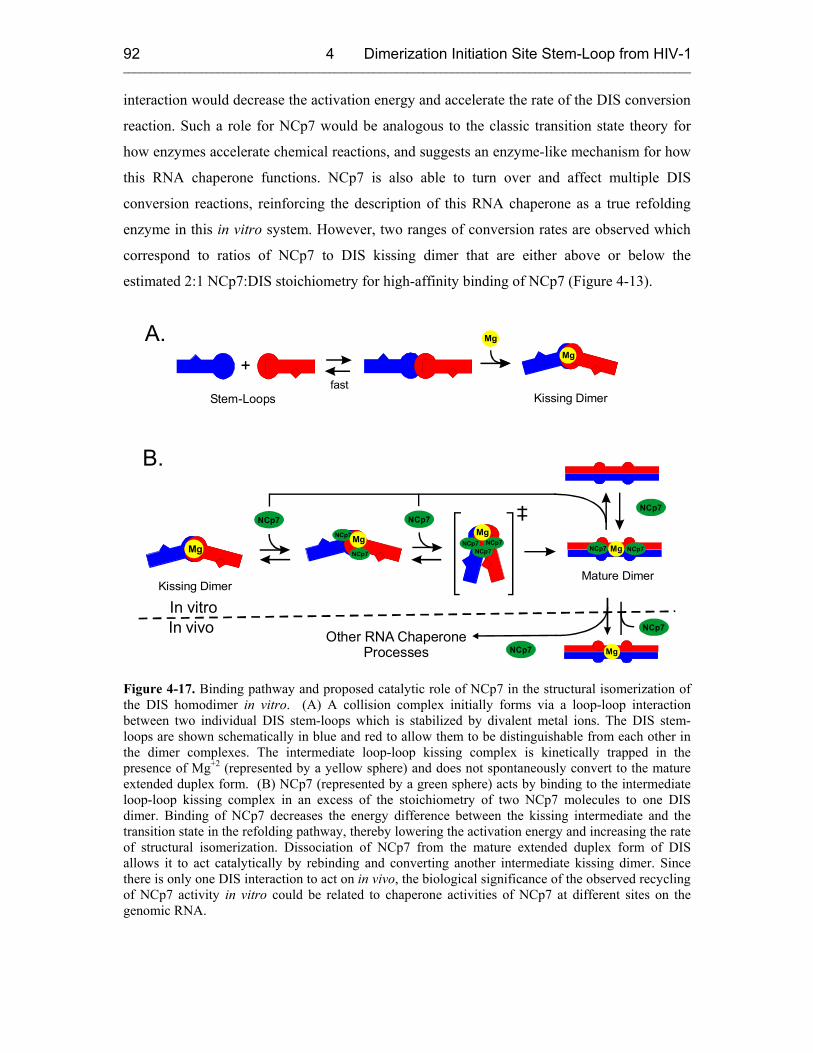
4 Dimerization Initiation Site Stem-Loop from HIV-1 ______________________________________________________________________________________________________
92
interaction would decrease the activation energy and accelerate the rate of the DIS conversion
reaction. Such a role for NCp7 would be analogous to the classic transition state theory for
how enzymes accelerate chemical reactions, and suggests an enzyme-like mechanism for how
this RNA chaperone functions. NCp7 is also able to turn over and affect multiple DIS
conversion reactions, reinforcing the description of this RNA chaperone as a true refolding
enzyme in this in vitro system. However, two ranges of conversion rates are observed which
correspond to ratios of NCp7 to DIS kissing dimer that are either above or below the
estimated 2:1 NCp7:DIS stoichiometry for high-affinity binding of NCp7 (Figure 4-13).
Stem-Loops
+
Kissing Dimer
A. Mg
Mg
fast
NCp7 NCp7NCp7
NCp7
NCp7
NCp7 NCp7
NCp7 NCp7
NCp7
Mg
Kissing Dimer
B.
Mg
Mature Dimer
Mg
MgNCp7 NCp7Mg
Other RNA ChaperoneProcesses
In vitroIn vivo
Mg
Figure 4-17. Binding pathway and proposed catalytic role of NCp7 in the structural isomerization of the DIS homodimer in vitro. (A) A collision complex initially forms via a loop-loop interaction between two individual DIS stem-loops which is stabilized by divalent metal ions. The DIS stem-loops are shown schematically in blue and red to allow them to be distinguishable from each other in the dimer complexes. The intermediate loop-loop kissing complex is kinetically trapped in the presence of Mg+2 (represented by a yellow sphere) and does not spontaneously convert to the mature extended duplex form. (B) NCp7 (represented by a green sphere) acts by binding to the intermediate loop-loop kissing complex in an excess of the stoichiometry of two NCp7 molecules to one DIS dimer. Binding of NCp7 decreases the energy difference between the kissing intermediate and the transition state in the refolding pathway, thereby lowering the activation energy and increasing the rate of structural isomerization. Dissociation of NCp7 from the mature extended duplex form of DIS allows it to act catalytically by rebinding and converting another intermediate kissing dimer. Since there is only one DIS interaction to act on in vivo, the biological significance of the observed recycling of NCp7 activity in vitro could be related to chaperone activities of NCp7 at different sites on the genomic RNA.
4 Dimerization Initiation Site Stem-Loop from HIV-1 ______________________________________________________________________________________________________
93
Furthermore, the apparent maximal rate for DIS isomerization is only observed when the
NCp7 concentration is above the estimated 2:1 NCp7:DIS stoichiometry. These results
suggest that the high-affinity sites for NCp7 binding must first be saturated before the full
catalytic effect of NCp7 is observed and implies the two NCp7 molecules that occupy the
high-affinity sites on DIS may be inactive in catalyzing the refolding reaction. Instead, excess
‘free’ NCp7 may act either independently or together with the high-affinity bound NCp7
molecules in capturing and stabilizing the transition state and thereby producing the catalytic
effect. Accordingly, the rate of conversion would be limited by the concentration of the ‘free’
NCp7, which would depend on the off-rate of the NCp7 protein from the DIS dimers at
concentrations of NCp7 that are less than the 2:1 NCp7:DIS stoichiometry of the high-affinity
binding class. The off-rate of NCp7 for the DIS dimers has not been explicitly determined
here, however, it can be inferred to be relatively fast from the conversion rates observed at
substoichiometric ratios of NCp7 to DIS ‘kissing dimer.
The two apparent classes of interactions of NCp7 represented by the binding and kinetic data
may indicate two unique functional roles for how NCp7 interacts with the DIS kissing dimer.
NCp7’s first role could involve a high-affinity interaction with the DIS kissing dimer which
results in the formation of a specific RNA-protein complex that may both facilitate DIS
maturation, as well as packaging of the genomic RNA. The second role for NCp7 would
involve a transient chaperone-type interaction with the DIS kissing dimer resulting in the
destabilization of the DIS stem helices and the promotion of stem strand exchange. The
description of two classes of NCp7 interaction with DIS is in some ways consistent with
previous observations that a threshold binding ratio of approximately one NCp7 molecule per
seven nucleotides of RNA is required for NCp7 to exhibit chaperone activity.[228, 240, 263] This
has been shown to be the approximate ratio at which nucleic acids become saturated with
NCp7.[256, 264, 265] The requirement of a threshold concentration for the observation of a
demonstrable NCp7 nucleic acid chaperone activity suggests that there may be no turn over in
the NCp7 catalysis of conformation changes. The need for threshold concentrations of NCp7
might also indicate that interactions between NCp7 molecules bound to RNA play a role in
the chaperone effect.[266]
Similarly, the results of the present study also indicate a threshold concentration requirement
for the most rapid NCp7 catalytic activity and correlate this threshold concentration to the
need to first fully occupy two high-affinity NCp7 structural binding sites on the DIS kissing
dimer. Only after these binding sites are saturated is full catalytic chaperone activity observed
for the excess ‘free’ NCp7 protein, as is also suggested by previous studies.[228, 240, 263, 267] The
4 Dimerization Initiation Site Stem-Loop from HIV-1 ______________________________________________________________________________________________________
94
ability of NCp7 to turn over in the DIS conversion reaction may simply reflect the availability
of only two high-affinity NCp7 structural binding sites on the DIS dimer, with moderate off-
rate rates, in this minimal system. In contrast with the isolated DIS kissing dimer, NCp7 may
be continually trapped in multiple binding sites of moderate to high-affinity in the larger RNA
systems and thereby be significantly inhibited from binding and functioning in its role as a
chaperone. The interpretation that the catalytic interaction(s) of NCp7 with DIS may involve a
lower-affinity, transiently bound class of molecules is also consistent with previous
observations that the chaperone activity of NCp7 is non-sequence specific and driven
primarily through non-specific electrostatic and intercalative interactions. It is also consistent
with the absence of a measurable tryptophan fluorescence change for this class of NCp7
interaction.
Observation of NCp7 turnover in the in vitro refolding reaction (Figure 4-17) may not have
specific relevance to the in vivo genome maturation process, where only a single RNA dimer
exists on which NCp7 could act. Instead, the observed recycling ability of the catalytic NCp7
may function in vivo by promoting other nucleic acid structural rearrangements or transient
structural binding events at other locations on the RNA strand within the budded viral
particle. Alternatively, the observed turnover of NCp7 could be related to chaperone functions
it may carry out as a domain within the intact gag protein. Since gag is abundant in HIV-1
infected cells and has been shown to potentate similar chaperone activities as the isolated
NCp7 in vitro,[268, 269] the observed recycling could possibly be related to an in vivo nucleic
acid chaperone function of gag that either requires or is made more effective by multiple
turnovers in activity.
Since DIS structural isomerization can occur under different experimental conditions and
requires preformation of the DIS kissing dimer, the conversion process is clearly related to the
structure and dynamics of the DIS kissing dimer and is likely to involve a common transient-
state RNA folding intermediate (Figure 4-17). Furthermore, the structure of the Mg2+-
stabilized DIS kissing dimer may be pre-organized to facilitate NCp7 binding and fast
conversion rates. In its specific catalytic role, NCp7 accelerates the rate of strand exchange
between the two hairpin stem helices, without destabilization of the loop-loop helix. Under
these structural constraints, NCp7 might act to facilitate the exchange of stem helices by
distorting or stressing the DIS kissing conformation. One possible mode of structural
distortion would be through helical bending centered on the loop-loop kissing helix, which
could bring the two stem helices into close proximity and proper alignment to facilitate the
isomerization process. Although not observed in the crystal structures,[1, 244] such a helical

4 Dimerization Initiation Site Stem-Loop from HIV-1 ______________________________________________________________________________________________________
95
distortion of a kissing complex structure has precedent from previous structural studies in
solution[190, 191, 196] and in this instance might uniquely involve the highly conserved purine
nucleotides that flank the palindromic DIS loop sequence. These nucleotides may assume a
unique conformation in the transient-state folding intermediate that both distort the DIS
kissing dimer conformation and concomitantly destabilize the stem helices. In this model for
DIS conformational isomerization, the observed spontaneous conversion of the metastable
DIS kissing dimers could be the result of the inherent structural plasticity in these dimers.
Unlike the divalent metal ion stabilized kissing dimer, the metastable kissing dimers might be
sufficiently close in energy to the transition-state conformation such that this intermediate
state is accessible through simple thermal fluctuations and consequently spontaneous
structural isomerization is possible.
4.4 Summary
In this study the highly fluorescent adenosine base analog 2-AP has been selectively
incorporated into RNA constructs derived from the HIV-1 DISMal sequence to provide
unambiguous and unique probes for in vitro formation of the two isoforms of the DISMal
dimer. Using 2-AP fluorescence detected methods, equilibrium and kinetic binding constants
for the DIS kissing dimer interaction have been determined. In addition, real-time 2-AP
fluorescence measurements have been employed to gain a detailed kinetic view of the process
of DIS isomerization. The 2-AP fluorescence detected equilibrium binding experiments
demonstrate that the truncated DIS stem-loops used in this study, which lack the wild-type
stem bulge and have been altered in the loop palindromic sequence, associate under a number
of experimental conditions to form kissing dimers with wild-type affinities. The formation of
a kinetically stable intermediate DIS kissing dimer, however, requires the addition of divalent
metal ions. Thus, two different classes of the DIS kissing dimer, with distinct isomerization
potentials, could be distinguished using the 2-AP fluorescence methods. The divalent metal
ion stabilized DIS kissing dimer class, which is kinetically stable, required the addition of
NCp7 to activate fast-rates structural isomerization; while the metastable DIS kissing dimer
class, which forms with monovalent cations or at higher concentration (> µM), converted
spontaneously to the mature duplex form at an appreciable, but 10-20 fold slower rate than
observed for NCp7.
The data also clearly demonstrate a secondary structure rearrangement model for in vitro DIS
stem-loop isomerization and provide insight into the role of NCp7 in catalyzing this process.

4 Dimerization Initiation Site Stem-Loop from HIV-1 ______________________________________________________________________________________________________
96
How DIS structural isomerization could similarly be accomplished in vivo and how it relates
to retroviral maturation and packaging still remain open questions. An isomerization
mechanism involving DIS stem strand exchange, as described here for the isolated DIS
hairpins, would potentially involve large-scale movements of the entire 5’-ends of the two
copies of the HIV-1 RNA genome relative to each other, within the budded viral particle.
Determining if and how this associated structural rearrangement could be achieved will
require further studies into the molecular basis underlying the in vivo process.
5 Excimer Formation in DNA ______________________________________________________________________________________________________
97
5 Excimer Formation in DNA Studied with 2-AP Fluorescent Markers
5.1 Introduction
In the previous two chapters of this thesis, the quenching of 2-AP fluorescence upon a change
in its environment was exploited to study RNA-RNA and RNA-protein interactions. But, in
fact, it is unclear if the 2-AP fluorescence only comprises the 2-aminopurine base itself or if
adjacent bases are also affected by the energy absorbed during the fluorescence experiments.
It is a key question which is crucial for the mechanism of various photoreactions in DNA,
whether excited singlet states of DNA bases are localized or extended over several
neighboring bases. As already discussed in section 2.4.1, evidence for excimer emission
between nucleosides at low temperature was given by Eisinger et al. in 1966,[96, 97] but
experimental obstacles like overlapping spectra of natural DNA bases hampered
spectroscopic studies at room temperature. In this work, a novel experimental approach to
study excitonic coupling, excitation energy transfer, and excimer formation in DNA with
optical spectroscopic methods at room temperature is presented using the distinct
photophysical properties of 2-AP.
5.2 Sample Design and Control Experiments
Figure 5-1 shows the sequences of the two DNA assemblies A1 and A2 used in this study.
The design of the sequences was based on the following considerations: At least two 2-AP
units next to each other are needed to be able to observe potential excimer formation. It is
assumed that the signal intensity of the recorded spectra will improve significantly when
several 2-AP dimers are present in the duplex. At the same time it is important that the
excimers experience the same environment. These considerations led to the design of the
palindromic sequence of the “excimer strand” A1. The two G-C base pairs on either end are
required to prevent higher order aggregates of the regular (Ap-Ap-T-T)n sequence. The
reference strand A2 was designed to resemble the excimer sequence A1 as closely as possible
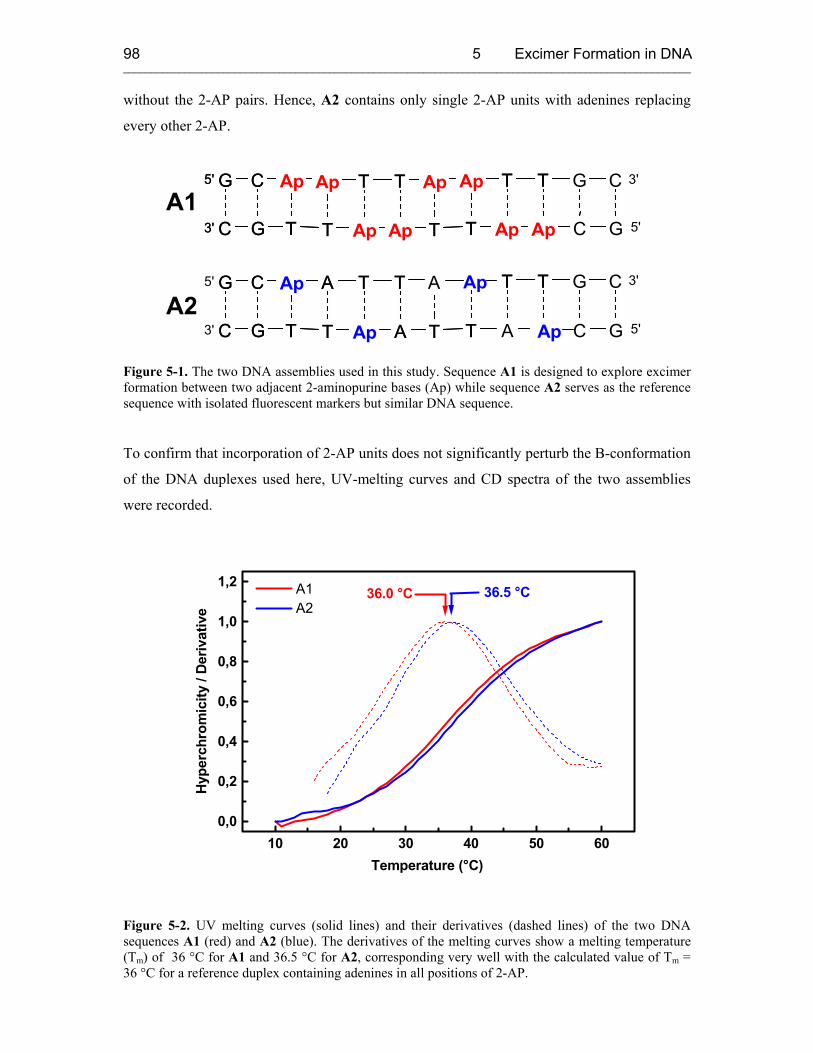
5 Excimer Formation in DNA ______________________________________________________________________________________________________
98
without the 2-AP pairs. Hence, A2 contains only single 2-AP units with adenines replacing
every other 2-AP.
5'
3' 5'
3' G T T
C ApAp
T
ApAp
T
T T
Ap Ap
C G T T
G C A p Ap C
G
G T T
C Ap A
T
A Ap
T
T T
A Ap
C G T T
G C A p A C
G
3'
5'
5'
3'
T T T T
T T C G T T
G C
T T T
A
T
T T C G T T
G C A
3'
5'
A1
A2
Figure 5-1. The two DNA assemblies used in this study. Sequence A1 is designed to explore excimer formation between two adjacent 2-aminopurine bases (Ap) while sequence A2 serves as the reference sequence with isolated fluorescent markers but similar DNA sequence.
To confirm that incorporation of 2-AP units does not significantly perturb the B-conformation
of the DNA duplexes used here, UV-melting curves and CD spectra of the two assemblies
were recorded.
10 20 30 40 50 600,0
0,2
0,4
0,6
0,8
1,0
1,236.5 °C36.0 °C
A1 A2
Hyp
erch
rom
icity
/ D
eriv
ativ
e
Temperature (°C)
Figure 5-2. UV melting curves (solid lines) and their derivatives (dashed lines) of the two DNA sequences A1 (red) and A2 (blue). The derivatives of the melting curves show a melting temperature (Tm) of 36 °C for A1 and 36.5 °C for A2, corresponding very well with the calculated value of Tm = 36 °C for a reference duplex containing adenines in all positions of 2-AP.
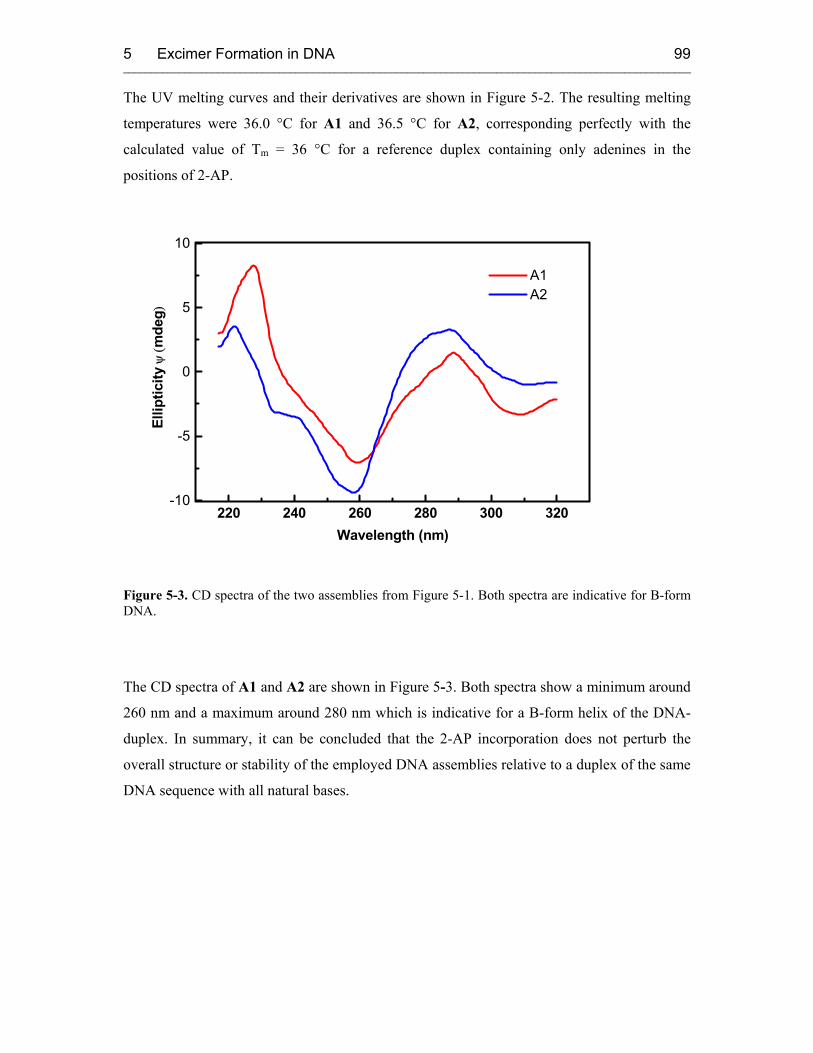
5 Excimer Formation in DNA ______________________________________________________________________________________________________
99
The UV melting curves and their derivatives are shown in Figure 5-2. The resulting melting
temperatures were 36.0 °C for A1 and 36.5 °C for A2, corresponding perfectly with the
calculated value of Tm = 36 °C for a reference duplex containing only adenines in the
positions of 2-AP.
220 240 260 280 300 320-10
-5
0
5
10
A1 A2
Ellip
ticity
ψ (m
deg)
Wavelength (nm)
Figure 5-3. CD spectra of the two assemblies from Figure 5-1. Both spectra are indicative for B-form DNA.
The CD spectra of A1 and A2 are shown in Figure 5-3. Both spectra show a minimum around
260 nm and a maximum around 280 nm which is indicative for a B-form helix of the DNA-
duplex. In summary, it can be concluded that the 2-AP incorporation does not perturb the
overall structure or stability of the employed DNA assemblies relative to a duplex of the same
DNA sequence with all natural bases.
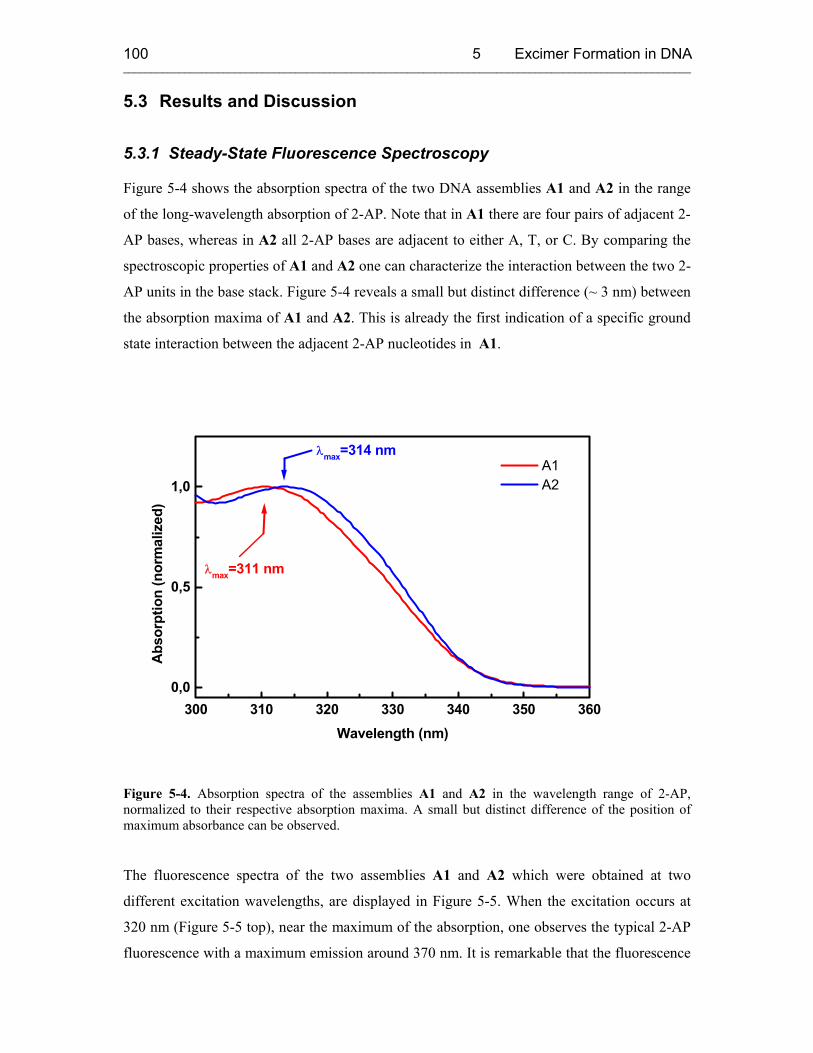
5 Excimer Formation in DNA ______________________________________________________________________________________________________
100
5.3 Results and Discussion
5.3.1 Steady-State Fluorescence Spectroscopy
Figure 5-4 shows the absorption spectra of the two DNA assemblies A1 and A2 in the range
of the long-wavelength absorption of 2-AP. Note that in A1 there are four pairs of adjacent 2-
AP bases, whereas in A2 all 2-AP bases are adjacent to either A, T, or C. By comparing the
spectroscopic properties of A1 and A2 one can characterize the interaction between the two 2-
AP units in the base stack. Figure 5-4 reveals a small but distinct difference (~ 3 nm) between
the absorption maxima of A1 and A2. This is already the first indication of a specific ground
state interaction between the adjacent 2-AP nucleotides in A1.
300 310 320 330 340 350 3600,0
0,5
1,0
λmax=311 nm
λmax=314 nm A1 A2
Abs
orpt
ion
(nor
mal
ized
)
Wavelength (nm)
Figure 5-4. Absorption spectra of the assemblies A1 and A2 in the wavelength range of 2-AP, normalized to their respective absorption maxima. A small but distinct difference of the position of maximum absorbance can be observed.
The fluorescence spectra of the two assemblies A1 and A2 which were obtained at two
different excitation wavelengths, are displayed in Figure 5-5. When the excitation occurs at
320 nm (Figure 5-5 top), near the maximum of the absorption, one observes the typical 2-AP
fluorescence with a maximum emission around 370 nm. It is remarkable that the fluorescence
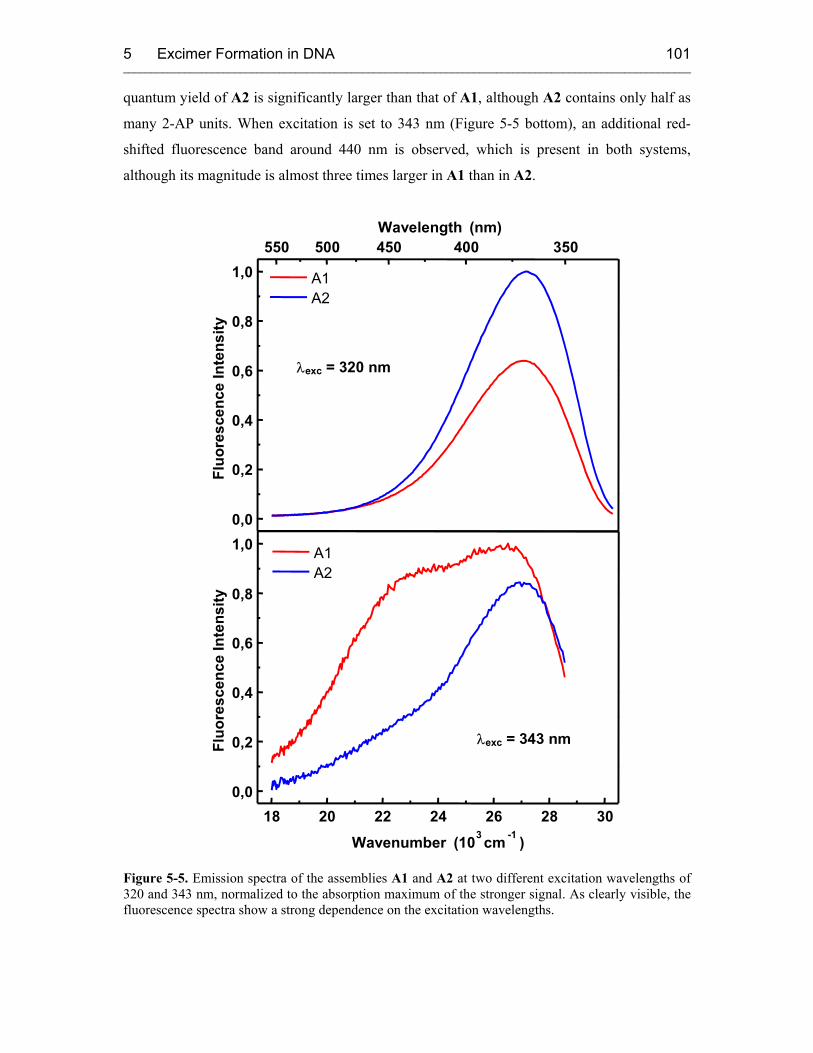
5 Excimer Formation in DNA ______________________________________________________________________________________________________
101
quantum yield of A2 is significantly larger than that of A1, although A2 contains only half as
many 2-AP units. When excitation is set to 343 nm (Figure 5-5 bottom), an additional red-
shifted fluorescence band around 440 nm is observed, which is present in both systems,
although its magnitude is almost three times larger in A1 than in A2.
0,0
0,2
0,4
0,6
0,8
1,0
Fluo
resc
ence
Inte
nsity
A1 A2
550 500 450 400 350 Wavelength (nm)
18 20 22 24 26 28 30 0,0
0,2
0,4
0,6
0,8
1,0
Fluo
resc
ence
Inte
nsity
Wavenumber (10 3 cm -1 )
A1 A2
λexc = 320 nm
λexc = 343 nm
Figure 5-5. Emission spectra of the assemblies A1 and A2 at two different excitation wavelengths of 320 and 343 nm, normalized to the absorption maximum of the stronger signal. As clearly visible, the fluorescence spectra show a strong dependence on the excitation wavelengths.
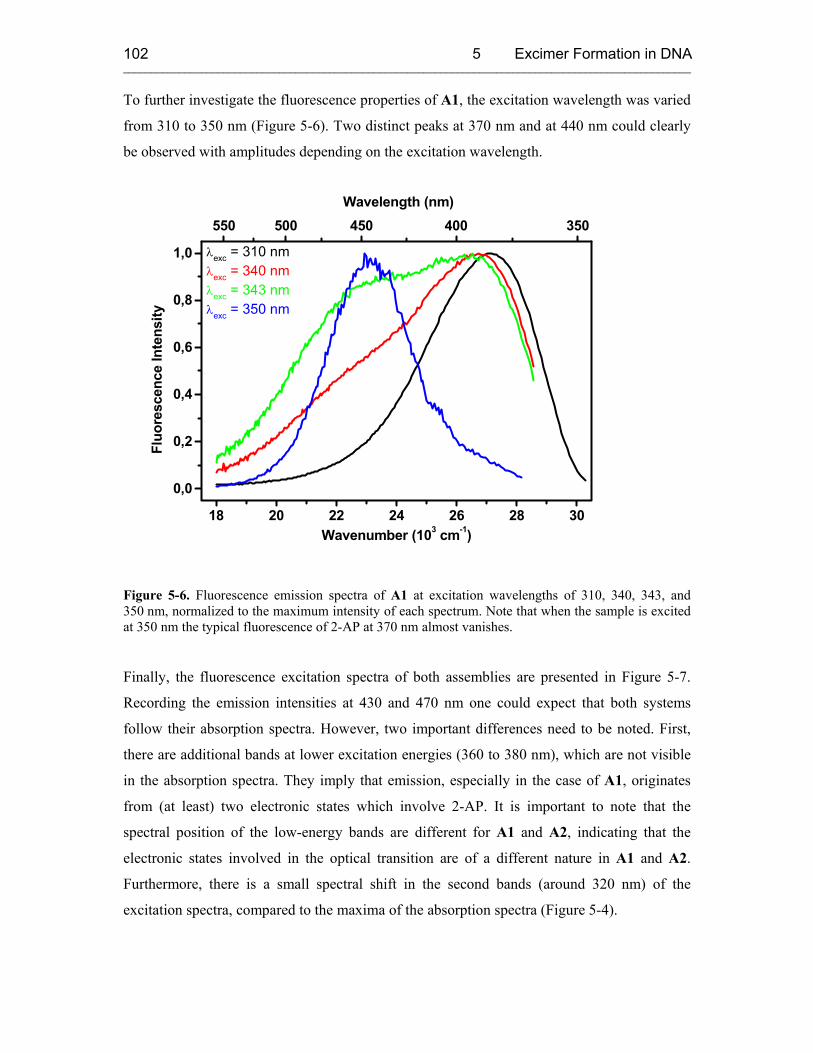
5 Excimer Formation in DNA ______________________________________________________________________________________________________
102
To further investigate the fluorescence properties of A1, the excitation wavelength was varied
from 310 to 350 nm (Figure 5-6). Two distinct peaks at 370 nm and at 440 nm could clearly
be observed with amplitudes depending on the excitation wavelength.
18 20 22 24 26 28 30
0,0
0,2
0,4
0,6
0,8
1,0
λexc = 310 nm λexc = 340 nm λexc = 343 nm λexc = 350 nm
Fluo
resc
ence
Inte
nsity
Wavenumber (103 cm-1)
550 500 450 400 350 Wavelength (nm)
Figure 5-6. Fluorescence emission spectra of A1 at excitation wavelengths of 310, 340, 343, and 350 nm, normalized to the maximum intensity of each spectrum. Note that when the sample is excited at 350 nm the typical fluorescence of 2-AP at 370 nm almost vanishes.
Finally, the fluorescence excitation spectra of both assemblies are presented in Figure 5-7.
Recording the emission intensities at 430 and 470 nm one could expect that both systems
follow their absorption spectra. However, two important differences need to be noted. First,
there are additional bands at lower excitation energies (360 to 380 nm), which are not visible
in the absorption spectra. They imply that emission, especially in the case of A1, originates
from (at least) two electronic states which involve 2-AP. It is important to note that the
spectral position of the low-energy bands are different for A1 and A2, indicating that the
electronic states involved in the optical transition are of a different nature in A1 and A2.
Furthermore, there is a small spectral shift in the second bands (around 320 nm) of the
excitation spectra, compared to the maxima of the absorption spectra (Figure 5-4).
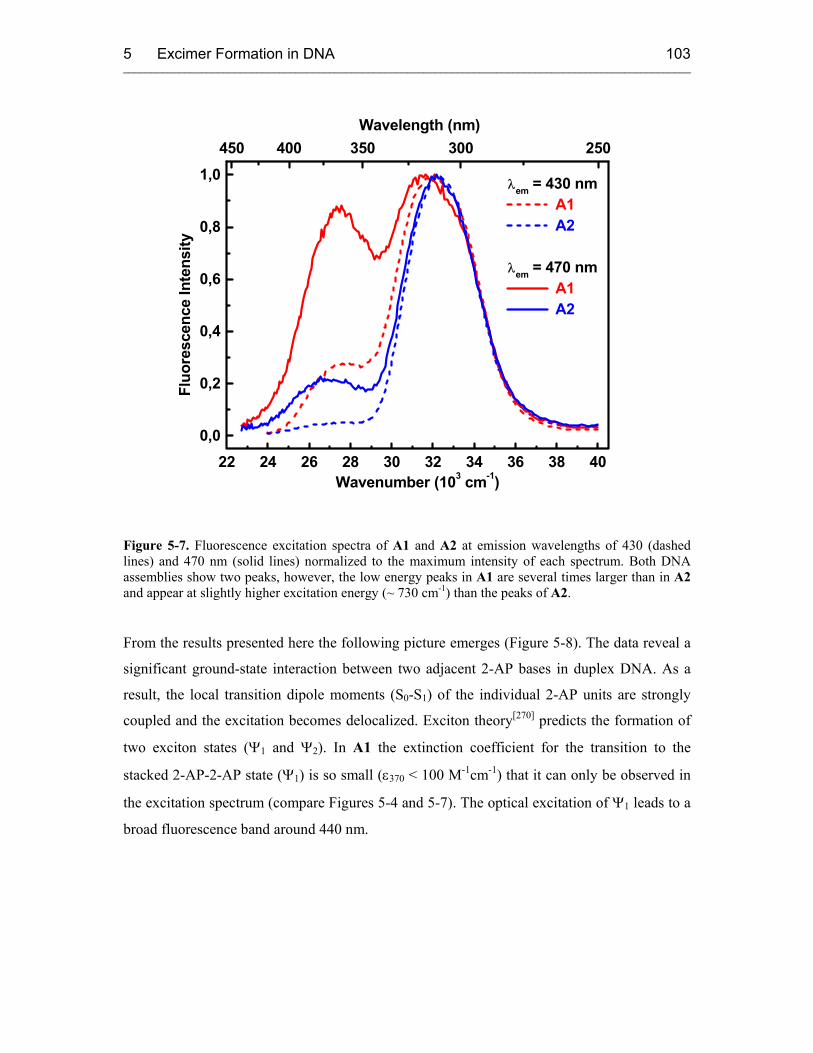
5 Excimer Formation in DNA ______________________________________________________________________________________________________
103
22 24 26 28 30 32 34 36 38 400,0
0,2
0,4
0,6
0,8
1,0
Fluo
resc
ence
Inte
nsity
Wavenumber (103 cm-1)
λem = 430 nm A1 A2
λem = 470 nm A1 A2
450 400 350 300 250 Wavelength (nm)
Figure 5-7. Fluorescence excitation spectra of A1 and A2 at emission wavelengths of 430 (dashed lines) and 470 nm (solid lines) normalized to the maximum intensity of each spectrum. Both DNA assemblies show two peaks, however, the low energy peaks in A1 are several times larger than in A2 and appear at slightly higher excitation energy (~ 730 cm-1) than the peaks of A2.
From the results presented here the following picture emerges (Figure 5-8). The data reveal a
significant ground-state interaction between two adjacent 2-AP bases in duplex DNA. As a
result, the local transition dipole moments (S0-S1) of the individual 2-AP units are strongly
coupled and the excitation becomes delocalized. Exciton theory[270] predicts the formation of
two exciton states (Ψ1 and Ψ2). In A1 the extinction coefficient for the transition to the
stacked 2-AP-2-AP state (Ψ1) is so small (ε370 < 100 M-1cm-1) that it can only be observed in
the excitation spectrum (compare Figures 5-4 and 5-7). The optical excitation of Ψ1 leads to a
broad fluorescence band around 440 nm.

5 Excimer Formation in DNA ______________________________________________________________________________________________________
104
**
Excimer
Exciton
No Stacking Stacking
320 nm 365 nm 370 nm 440 nm
Figure 5-8. Model for the excited-state base alignment. Non-stacked bases are shown on the left with an absorption at 320 nm and fluorescence emission at 365 nm. The corresponding wavelengths for the stacked bases are 370 and 440 nm, respectively. For a subensemble of molecules, a single non-stacked and therefore uncoupled 2-AP base is excited which transfers its energy to its adjacent neighbor as soon as the coupling is established again.
The discrepancies between excitation and absorption spectra above 340 nm can be
rationalized by taking into account that the DNA assemblies are characterized by a certain
degree of structural inhomogeneity. Thus there will be a subensemble of molecules where a
single ("uncoupled") 2-AP base is excited and can subsequently transfer energy to its adjacent
neighbor (excimer formation). Note that in this case the ground-state interaction between
adjacent 2-AP bases (left side in Figure 5-8) is very weak or completely absent. Therefore the
red-shifted emission of A1 (especially at 470 nm) may originate from both statically excited
exciton states and dynamically formed excimers (right side in Figure 5-8).
The spectroscopic properties of A2 indicate that 2-AP also interacts with other adjacent DNA
bases. This follows from the shoulder in the fluorescence spectrum (Figure 5-5) and from the
weak band in the excitation spectrum around 375 nm (Figure 5-7). Hence, it can be concluded
that excitonic interaction leads to exciplex-type emission in A2. Such interaction between 2-
AP and other bases includes additional charge transfer contributions which have been
reported in previous work on 2-AP-containing DNA assemblies.[46] However, the
5 Excimer Formation in DNA ______________________________________________________________________________________________________
105
delocalization of excitation energy is enhanced by resonance interaction and should be more
pronounced for identical bases. It should be noted, however, that despite the formal inversion
symmetry of the sequences A1 and A2 there is no geometrical symmetry in the base stack and
hence, no symmetrical exciton level splitting should be expected.
Further evidence for exciton coupling arises from the fact that the fluorescence quantum yield
of A1 is significantly smaller than the one of A2 when excited at 320 nm (Figure 5-5), which
suggests the presence of additional nonradiative channels from the exciton state Ψ2.
The results presented here may also be relevant for the ongoing discussion about the short
excited state lifetimes of the DNA bases.[62, 271-273] Georghiou et al.[100] proposed that the
formation of excimers (or exciplexes) between adjacent bases are responsible for ultrafast
quenching of DNA base singlet states. However, these authors exclude ground state
interaction between bases. The results from this study, especially the fluorescence excitation
spectra, demonstrate that there are indeed ground-state interactions which lead to partially
delocalized excitations. Note that this information is profound regarding the base-to-base
coupling in DNA and its dependence on structural fluctuations, expecially at room
temperature.[274]
5.3.2 Time-Resolved Transient Absorption Spectroscopy
Femtosecond time-resolved pump-probe spectroscopy investigations addressing the dynamics
for electronic energy migration in DNA were performed in collaboration with the group of
Dr. T. Fiebig at the Institute for Physical Chemistry at the Technical University of Munich.
The time-resolved transient absorption spectra of A2 in Figure 5-9 show a peak around 550
nm representing the excited state of 2-AP (Ap*), which decreases over the time course of the
experiment (20 ps). In other words, Ap* is formed immediately upon excitation (within the
time-resolution of this experiment of 150 fs) and decays exponentially over 20 ps. The spectra
of A1 show the same peak at 550 nm at the beginning of the measurement. However, this
signal does not only decay within the experiment time, but also undergoes a dynamic spectral
shift from 550 to 510 nm which cannot be found in A2. This shift is attributed to the 2-AP
excimer formation. Additionally, one observes the rise of an absorption band at 360 nm,
which cannot be found in the reference system A2, and which is assigned to the wavelength
range of the exciton ground state of the 2-AP dimer (Figure 5-9).

5 Excimer Formation in DNA ______________________________________________________________________________________________________
106
360 400 440 480 520 560 600 640 680
1
2
3
4
5
20 ps
0 ps A2
chan
ge o
f opt
ical
den
sity
wavelength (nm)
360 400 440 480 520 560 600 640 6800
1
2
3
4
5 exciton absorption
20 ps
0 ps A1
Cha
nge
of o
ptic
al d
ensi
ty
Wavelength (nm)
Figure 5-9. Time-resolved transient absorption spectra of A2 and A1. Spectra with probe-pulse delays varying between close to 0 and 20 ps were recorded. In A2 a distinct maximum at 550 nm representing the excited state of 2-AP can be observed that decays over time. The same distinct maximum at 550 nm can be observed for A1, but in addition to the decay, a shift to about 510 nm at 20 ps is observed, which represents excimer formation. The strongly increasing signal at 360 nm wavelength can be attributed to exciton formation.
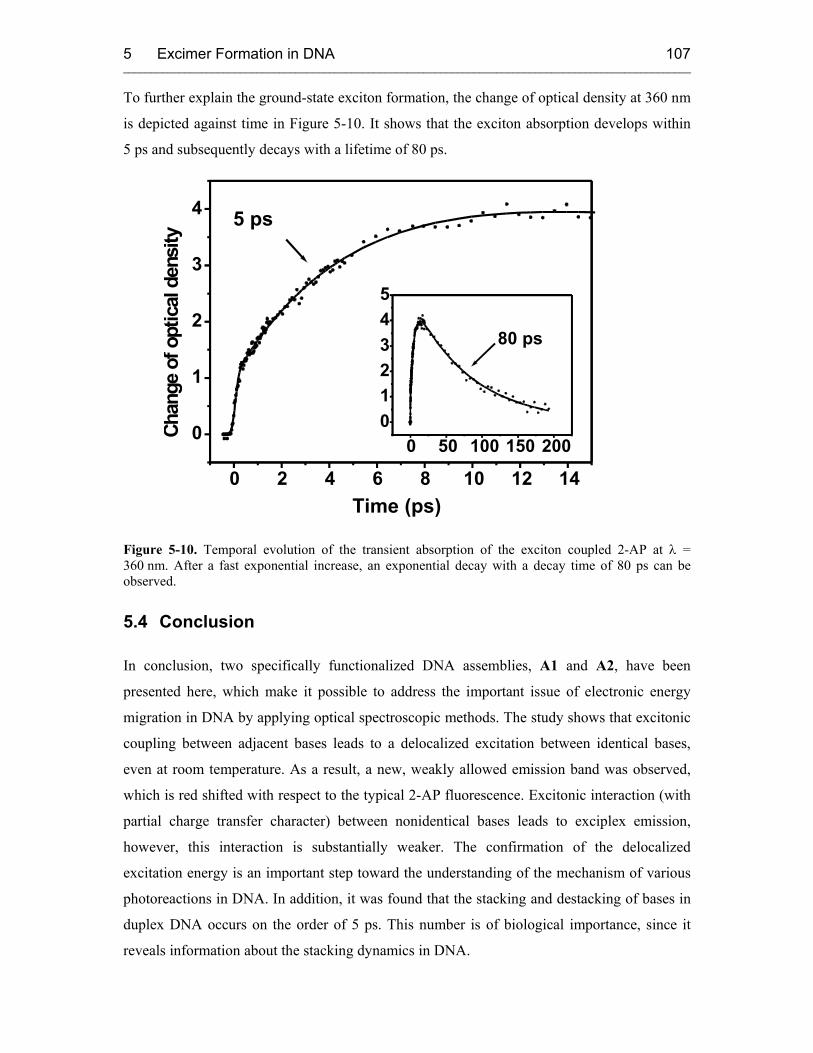
5 Excimer Formation in DNA ______________________________________________________________________________________________________
107
To further explain the ground-state exciton formation, the change of optical density at 360 nm
is depicted against time in Figure 5-10. It shows that the exciton absorption develops within
5 ps and subsequently decays with a lifetime of 80 ps.
0 50 100 150 200
0
1
2
3
4
5
0 2 4 6 8 10 12 14
0
1
2
3
4
80 ps
5 ps
C h a
n g e
o f o
p t i c
a l d
e n s i
t y
Time (ps)
Figure 5-10. Temporal evolution of the transient absorption of the exciton coupled 2-AP at λ = 360 nm. After a fast exponential increase, an exponential decay with a decay time of 80 ps can be observed.
5.4 Conclusion
In conclusion, two specifically functionalized DNA assemblies, A1 and A2, have been
presented here, which make it possible to address the important issue of electronic energy
migration in DNA by applying optical spectroscopic methods. The study shows that excitonic
coupling between adjacent bases leads to a delocalized excitation between identical bases,
even at room temperature. As a result, a new, weakly allowed emission band was observed,
which is red shifted with respect to the typical 2-AP fluorescence. Excitonic interaction (with
partial charge transfer character) between nonidentical bases leads to exciplex emission,
however, this interaction is substantially weaker. The confirmation of the delocalized
excitation energy is an important step toward the understanding of the mechanism of various
photoreactions in DNA. In addition, it was found that the stacking and destacking of bases in
duplex DNA occurs on the order of 5 ps. This number is of biological importance, since it
reveals information about the stacking dynamics in DNA.
6 Charge Transfer in 2-Aminopurine Containing Dinucleotides ______________________________________________________________________________________________________
108
6 Studies of Charge Transfer in 2-Aminopurine Containing Dinucleotides
6.1 Introduction
The fluorescent nucleotide base analog 2-AP has been used in many studies to investigate
macromolecular interactions and nucleic acid structure and dynamics[40, 74, 76, 200, 275, 276] as
well as in chapters 3 and 4 of this work. It serves as a sensitive fluorescent probe by changing
its spectral features depending on the environment. These features are usually interpreted
phenomenologically without considering the electronic context dependence of the 2-AP
fluorescence. On the other hand, it has been shown that 2-AP can undergo charge transfer
reactions that can be exploited to investigate different aspects, such as the mechanism of
DNA-mediated charge transfer. Kelley and Barton, for instance, used 2-AP to measure the
distance dependence of charge transfer and the influence of stacking.[148] Zewail and co-
workers tried to determine distance and sequence dependence of the 2-AP induced charge
transfer.[46] It was again the group of Barton who first realized that 2-AP can act as a dual
reporter probing both structural dynamics and charge transfer processes in the same nucleic
acid assemblies. It was concluded that the efficiency of charge transfer depends on the
structural dynamics.[48, 277]
Thus it seemed promising to look at how the base sequence influences the efficiency and the
rate of 2-AP fluorescence quenching due to charge transfer. Dinucleotides represent the
smallest possible units of nucleic acids for the investigation of interactions between two
nucleobases. Therefore, in this study it was investigated how each of the natural DNA bases
and inosine influence the fluorescence of 2-AP.
6.2 Sample Design and Control Experiments
Five dinucleotides containing 2-AP (Figure 6-1) were synthesized using standard
phosphoramidite chemistry.
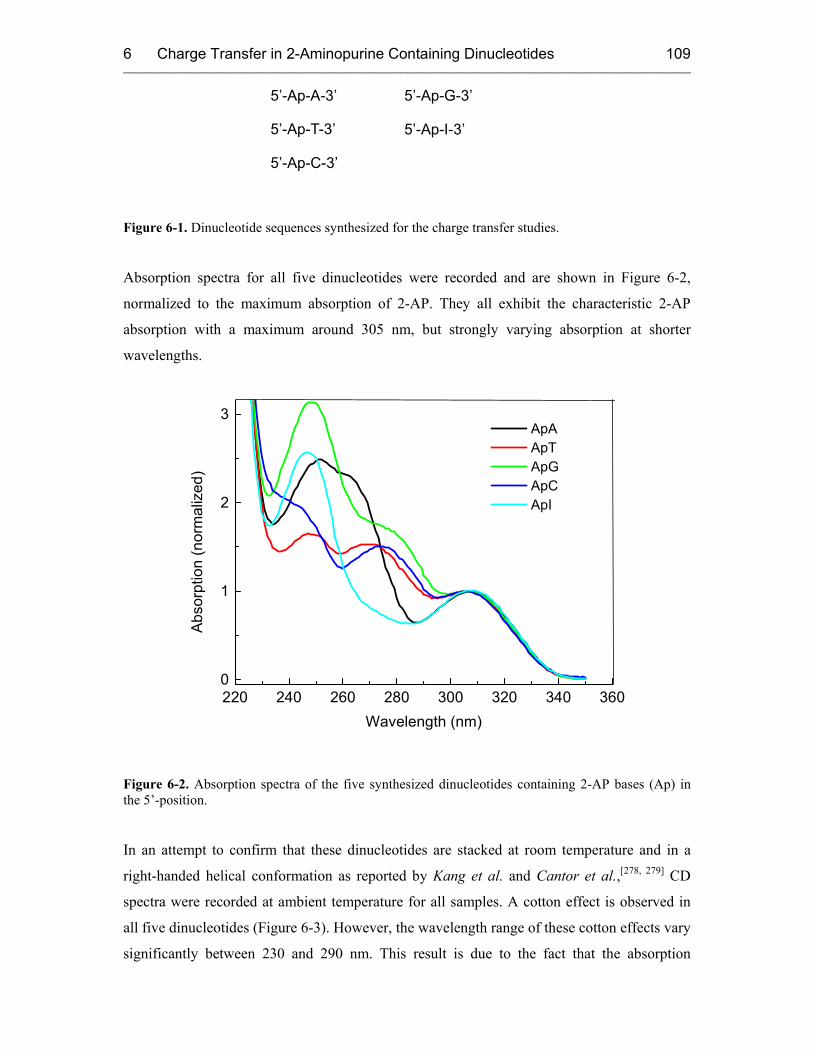
6 Charge Transfer in 2-Aminopurine Containing Dinucleotides ______________________________________________________________________________________________________
109
5’-Ap-A-3’
5’-Ap-T-3’
5’-Ap-C-3’
5’-Ap-G-3’
5’-Ap-I-3’
Figure 6-1. Dinucleotide sequences synthesized for the charge transfer studies.
Absorption spectra for all five dinucleotides were recorded and are shown in Figure 6-2,
normalized to the maximum absorption of 2-AP. They all exhibit the characteristic 2-AP
absorption with a maximum around 305 nm, but strongly varying absorption at shorter
wavelengths.
220 240 260 280 300 320 340 3600
1
2
3
Abs
orpt
ion
(nor
mal
ized
)
Wavelength (nm)
ApA ApT ApG ApC ApI
Figure 6-2. Absorption spectra of the five synthesized dinucleotides containing 2-AP bases (Ap) in the 5’-position.
In an attempt to confirm that these dinucleotides are stacked at room temperature and in a
right-handed helical conformation as reported by Kang et al. and Cantor et al.,[278, 279] CD
spectra were recorded at ambient temperature for all samples. A cotton effect is observed in
all five dinucleotides (Figure 6-3). However, the wavelength range of these cotton effects vary
significantly between 230 and 290 nm. This result is due to the fact that the absorption
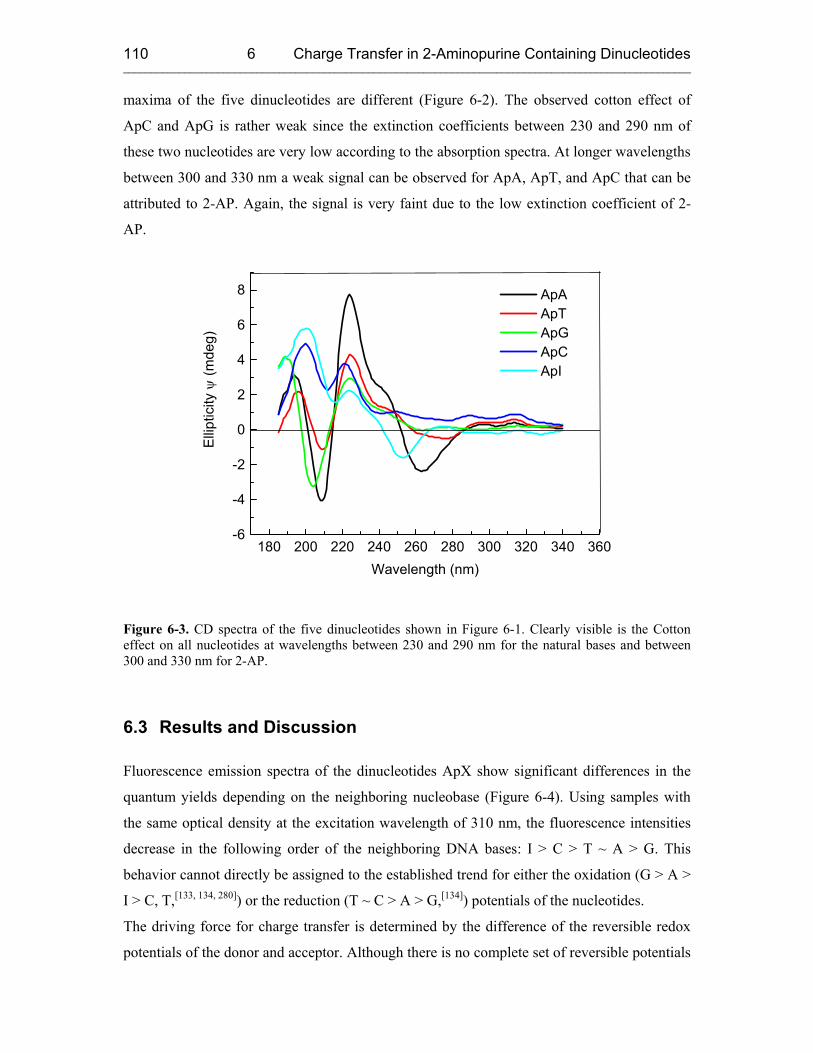
6 Charge Transfer in 2-Aminopurine Containing Dinucleotides ______________________________________________________________________________________________________
110
maxima of the five dinucleotides are different (Figure 6-2). The observed cotton effect of
ApC and ApG is rather weak since the extinction coefficients between 230 and 290 nm of
these two nucleotides are very low according to the absorption spectra. At longer wavelengths
between 300 and 330 nm a weak signal can be observed for ApA, ApT, and ApC that can be
attributed to 2-AP. Again, the signal is very faint due to the low extinction coefficient of 2-
AP.
180 200 220 240 260 280 300 320 340 360-6
-4
-2
0
2
4
6
8
Ellip
ticity
ψ (m
deg)
Wavelength (nm)
ApA ApT ApG ApC ApI
Figure 6-3. CD spectra of the five dinucleotides shown in Figure 6-1. Clearly visible is the Cotton effect on all nucleotides at wavelengths between 230 and 290 nm for the natural bases and between 300 and 330 nm for 2-AP.
6.3 Results and Discussion
Fluorescence emission spectra of the dinucleotides ApX show significant differences in the
quantum yields depending on the neighboring nucleobase (Figure 6-4). Using samples with
the same optical density at the excitation wavelength of 310 nm, the fluorescence intensities
decrease in the following order of the neighboring DNA bases: I > C > T ~ A > G. This
behavior cannot directly be assigned to the established trend for either the oxidation (G > A >
I > C, T,[133, 134, 280]) or the reduction (T ~ C > A > G,[134]) potentials of the nucleotides.
The driving force for charge transfer is determined by the difference of the reversible redox
potentials of the donor and acceptor. Although there is no complete set of reversible potentials
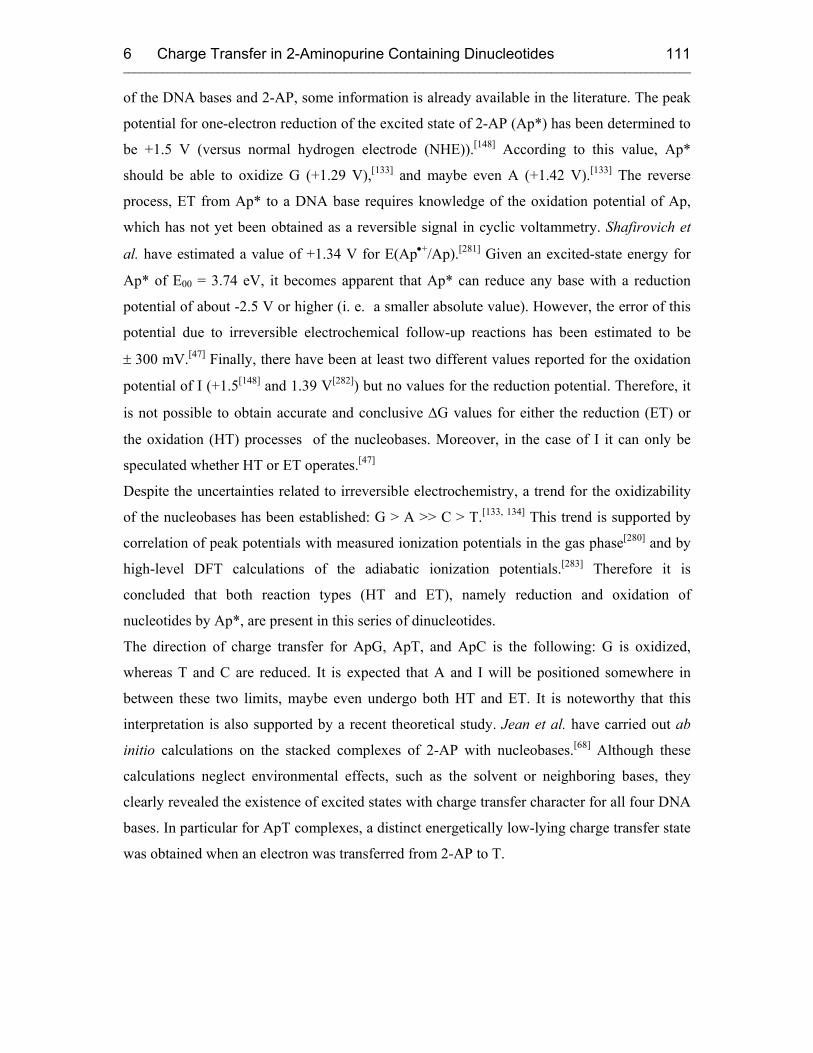
6 Charge Transfer in 2-Aminopurine Containing Dinucleotides ______________________________________________________________________________________________________
111
of the DNA bases and 2-AP, some information is already available in the literature. The peak
potential for one-electron reduction of the excited state of 2-AP (Ap*) has been determined to
be +1.5 V (versus normal hydrogen electrode (NHE)).[148] According to this value, Ap*
should be able to oxidize G (+1.29 V),[133] and maybe even A (+1.42 V).[133] The reverse
process, ET from Ap* to a DNA base requires knowledge of the oxidation potential of Ap,
which has not yet been obtained as a reversible signal in cyclic voltammetry. Shafirovich et
al. have estimated a value of +1.34 V for E(Ap•+/Ap).[281] Given an excited-state energy for
Ap* of E00 = 3.74 eV, it becomes apparent that Ap* can reduce any base with a reduction
potential of about -2.5 V or higher (i. e. a smaller absolute value). However, the error of this
potential due to irreversible electrochemical follow-up reactions has been estimated to be
± 300 mV.[47] Finally, there have been at least two different values reported for the oxidation
potential of I (+1.5[148] and 1.39 V[282]) but no values for the reduction potential. Therefore, it
is not possible to obtain accurate and conclusive ∆G values for either the reduction (ET) or
the oxidation (HT) processes of the nucleobases. Moreover, in the case of I it can only be
speculated whether HT or ET operates.[47]
Despite the uncertainties related to irreversible electrochemistry, a trend for the oxidizability
of the nucleobases has been established: G > A >> C > T.[133, 134] This trend is supported by
correlation of peak potentials with measured ionization potentials in the gas phase[280] and by
high-level DFT calculations of the adiabatic ionization potentials.[283] Therefore it is
concluded that both reaction types (HT and ET), namely reduction and oxidation of
nucleotides by Ap*, are present in this series of dinucleotides.
The direction of charge transfer for ApG, ApT, and ApC is the following: G is oxidized,
whereas T and C are reduced. It is expected that A and I will be positioned somewhere in
between these two limits, maybe even undergo both HT and ET. It is noteworthy that this
interpretation is also supported by a recent theoretical study. Jean et al. have carried out ab
initio calculations on the stacked complexes of 2-AP with nucleobases.[68] Although these
calculations neglect environmental effects, such as the solvent or neighboring bases, they
clearly revealed the existence of excited states with charge transfer character for all four DNA
bases. In particular for ApT complexes, a distinct energetically low-lying charge transfer state
was obtained when an electron was transferred from 2-AP to T.
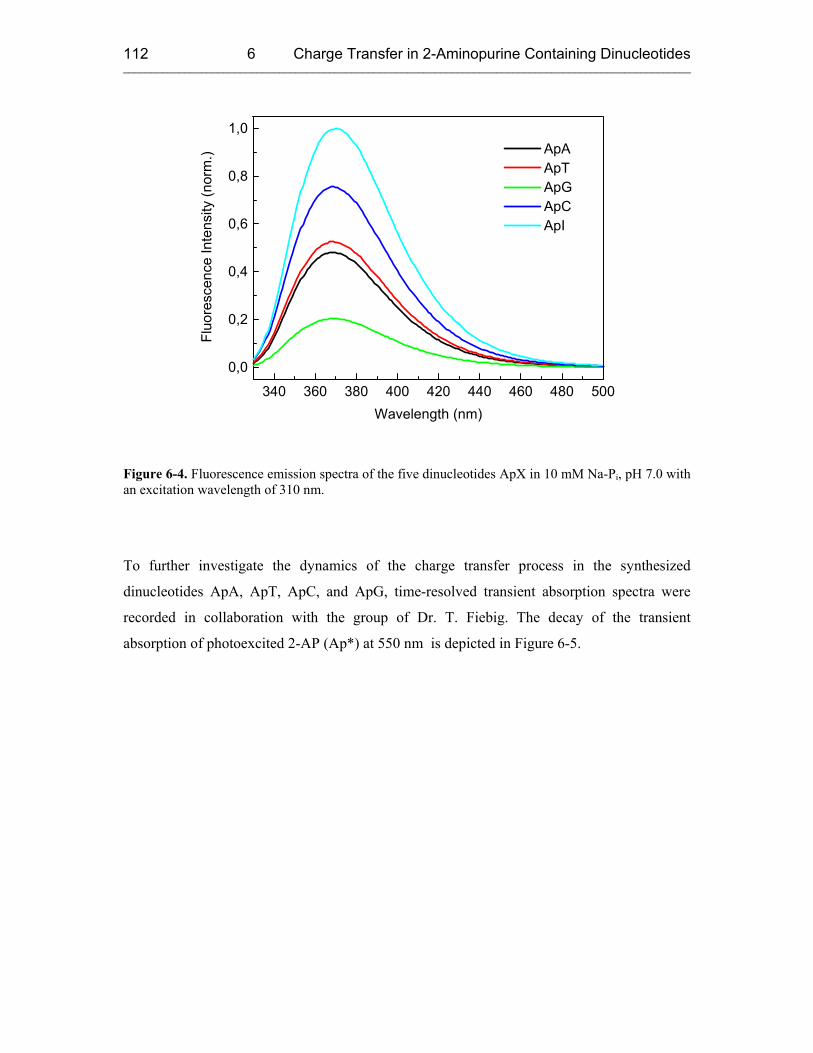
6 Charge Transfer in 2-Aminopurine Containing Dinucleotides ______________________________________________________________________________________________________
112
340 360 380 400 420 440 460 480 500
0,0
0,2
0,4
0,6
0,8
1,0
Fluo
resc
ence
Inte
nsity
(nor
m.)
Wavelength (nm)
ApA ApT ApG ApC ApI
Figure 6-4. Fluorescence emission spectra of the five dinucleotides ApX in 10 mM Na-Pi, pH 7.0 with an excitation wavelength of 310 nm.
To further investigate the dynamics of the charge transfer process in the synthesized
dinucleotides ApA, ApT, ApC, and ApG, time-resolved transient absorption spectra were
recorded in collaboration with the group of Dr. T. Fiebig. The decay of the transient
absorption of photoexcited 2-AP (Ap*) at 550 nm is depicted in Figure 6-5.
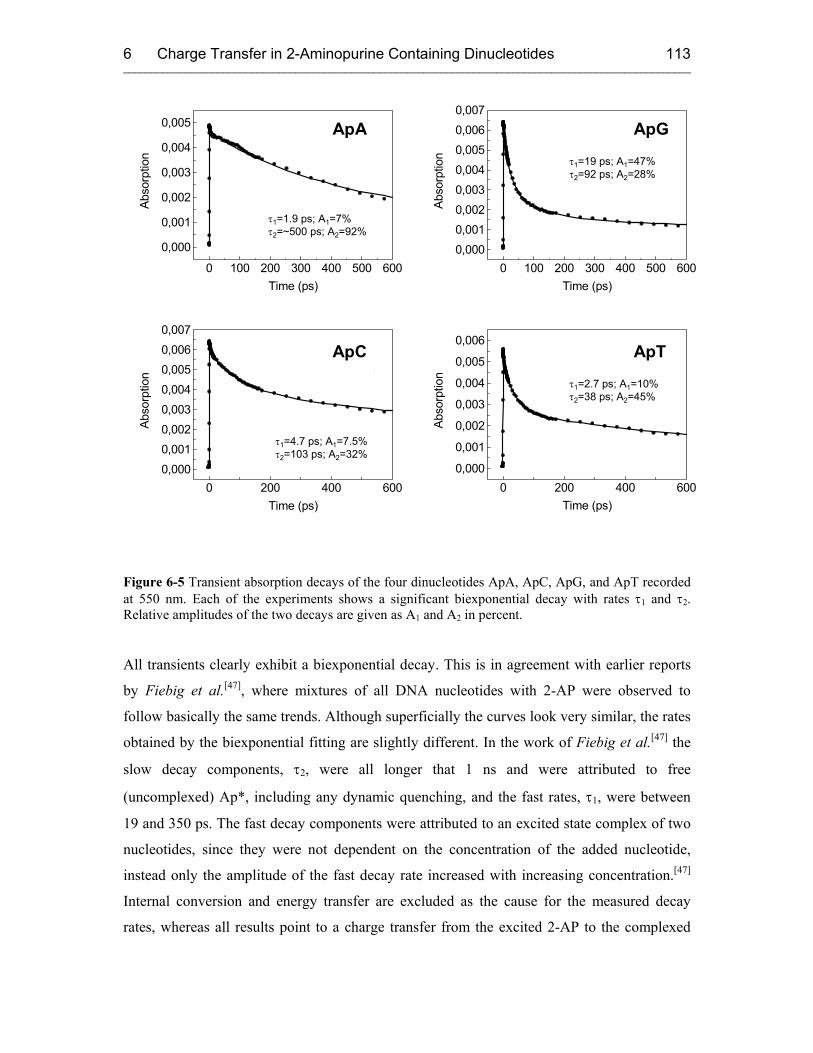
6 Charge Transfer in 2-Aminopurine Containing Dinucleotides ______________________________________________________________________________________________________
113
0 100 200 300 400 500 600
0,000
0,001
0,002
0,003
0,004
0,005 1.9 ps (7%)~500 ps (92%)
Abso
rptio
n
Time (ps)
0 200 400 6000,0000,0010,0020,0030,0040,0050,0060,007
4.7 (7.5%)103 ps (32%)
Abso
rptio
n
Time (ps)
0 100 200 300 400 500 6000,0000,0010,0020,0030,0040,0050,0060,007
19 ps (47%)92 ps (28%)
Abso
rptio
n
Time (ps)
0 200 400 6000,000
0,001
0,002
0,003
0,004
0,005
0,0062.7 ps (10%)38 ps (45%)
Abso
rptio
n
Time (ps)
τ1=1.9 ps; A1=7%τ2=~500 ps; A2=92%
τ1=19 ps; A1=47%τ2=92 ps; A2=28%
τ1=4.7 ps; A1=7.5%τ2=103 ps; A2=32%
τ1=2.7 ps; A1=10%τ2=38 ps; A2=45%
ApC
ApA ApG
ApT
Figure 6-5 Transient absorption decays of the four dinucleotides ApA, ApC, ApG, and ApT recorded at 550 nm. Each of the experiments shows a significant biexponential decay with rates τ1 and τ2. Relative amplitudes of the two decays are given as A1 and A2 in percent.
All transients clearly exhibit a biexponential decay. This is in agreement with earlier reports
by Fiebig et al.[47], where mixtures of all DNA nucleotides with 2-AP were observed to
follow basically the same trends. Although superficially the curves look very similar, the rates
obtained by the biexponential fitting are slightly different. In the work of Fiebig et al.[47] the
slow decay components, τ2, were all longer that 1 ns and were attributed to free
(uncomplexed) Ap*, including any dynamic quenching, and the fast rates, τ1, were between
19 and 350 ps. The fast decay components were attributed to an excited state complex of two
nucleotides, since they were not dependent on the concentration of the added nucleotide,
instead only the amplitude of the fast decay rate increased with increasing concentration.[47]
Internal conversion and energy transfer are excluded as the cause for the measured decay
rates, whereas all results point to a charge transfer from the excited 2-AP to the complexed

6 Charge Transfer in 2-Aminopurine Containing Dinucleotides ______________________________________________________________________________________________________
114
nucleotide, where a hole transfer takes place to G and A, and electron transfer takes place to T
and C.[47]
In the present work, no nanosecond component could be observed, since the two nucleotides
here are covalently linked and there is no uncomplexed 2-AP. The slow decay components
range here from 38 ps (ApT) to ~ 500 ps (ApA), and the fast rates are between 1.9 and 19 ps,
which are - except for ApG - much faster than reported by Fiebig et al.[47]
If one calculates an average decay rate ⟨τ⟩ according to the equation
⟨τ⟩ = A1*τ1 + A2*τ2,
where A1 and A2 are the amplitudes of the fast and slow decay components, respectively, the
data correspond fairly well with the fast rates from Fiebig et al.[47] (Table 6-1).
A comparison of the fast rates τ1 obtained by Fiebig et al. and the fast rates τ1 and average
decay rates ⟨τ⟩ from this study is summarized in Table 6-1.
Table 6-1. Comparison of the fast components of biexponential decay of nucleoside mixtures Ap + X of Fiebig et al.[47] and dinucleotides ApX investigated in this study.
X τ1 of nucleoside mixture
(ps)[47]
τ1 of dinucleotide ApX
(ps)
⟨τ⟩ of dinucleotide ApX
(ps)
A 350 1.9 460
G 19 19 34.7
C 47 4.7 33
T 20 2.7 17.4
Comparing the amplitudes of the transients of the dinucleotides with the degree of quenching
in the steady-state fluorescence data shows that the larger the sum of amplitudes of fast and
slow components the stronger the quenching of 2-AP fluorescence in the steady-state
experiments. The exception is ApA, where one would have to look at the amplitude of the fast
decay rate only to fit to the model. Preliminary results by time-resolved fluorescence
measurements indicate an excitation energy transfer in ApA.

6 Charge Transfer in 2-Aminopurine Containing Dinucleotides ______________________________________________________________________________________________________
115
In summary, one can say that a G next to 2-AP quenches the fluorescence the most, so there
must be a strong interaction between the two bases, and since G is the base with the lowest
oxidation potential of the nucleobases, the quenching is probably caused by a HT from 2-AP
to G. Inosine, however, is the base which quenches the 2-AP fluorescence the least. Hence,
the oxidation and reduction potential of inosine must lie in a range so that the excited 2-AP
can neither oxidize nor reduce the neighboring inosine. The bases C and T show intermediate
effects on 2-AP. They are able to quench the fluorescence emission of 2-AP more than A, but
not as efficiently as G. ApA seems to be a special dinucleotide in a sense that it shows
stacking in the CD spectra, but 2-AP emission is hardly quenched in the steady-state
fluorescence experiments, and the transient absorption spectroscopy shows a very fast and a
very slow decay of the excited state of 2-AP that cannot be explained at this stage. Since the
results from neither the steady-state fluorescence nor the time-resolved transient absorption
experiments follow the established trends for the oxidizability or the reducibility of DNA
bases, this study proves the conclusion by Fiebig et al.[47], that 2-AP can oxidize and reduce
neighboring bases.

7 Reductive Electron Transfer Studied with Py-≡-dU ______________________________________________________________________________________________________
116
7 Reductive Electron Transfer Studied with 5-(1-
pyrenylethynyl)-2' deoxyuridine (Py-≡-dU)
7.1 Introduction
Oxidative hole transfer has been studied intensely in the past 20 years using a variety of
methods and model systems, but not many studies have been published yet on reductive
electron transfer using spectroscopic methods. It was intended with this work to contribute to
the knowledge on the mechanism of reductive electron transfer in DNA. As shown in the
previous chapter, 2-AP is suitable to photoinitiate charge transfer in DNA, but it can both
oxidize and reduce neighboring bases. Therefore it does not seem to be particularly useful for
systematic investigations of pure reductive ET. A more suitable candidate for an electron
donor is pyrene when it is covalently attached to a deoxyuracil in DNA as shown by Amann et
al.[2, 172, 174]
5-(Pyren-1-yl)-2'-deoxyuridine (Py-dU) and 5-(Pyren-1-yl)-2'-deoxycytidine (Py-dC) were
synthesized and used for charge transfer studies by Amann et al.[2, 172, 174] In Py-dU, the
deoxyuracil is attached to the pyrene group via a single C-C bond. Therefore, it cannot be
excluded that the pyrene moiety directly interacts with bases in the DNA duplex adjacent to
the Py-dU group. As a result, the CT process could follow this shortcut, which implies that
experimental results might not be unambiguous. In an attempt to reduce these structural
concerns, the aim of this study was to prepare DNA duplexes containing the nucleoside base
analog 5-(1-pyrenylethynyl)-2'-deoxyuridine (Py-≡-dU) (Figure 2-6), which has been reported
to be a promising new base analog that is sensitive to its environment,[83, 284] while the greater
distance of pyrene from the base stack should allow fully controllable electron injection into
DNA. Additionally, a new synthetic approach has the advantage that the preparation of
pyrenylethynyl-modified oligonucleotides is not limited by the "bottleneck" of a
phosphoramidite synthesis. Instead, a modified protocol from Khan and Grinstaff[285] was
followed.
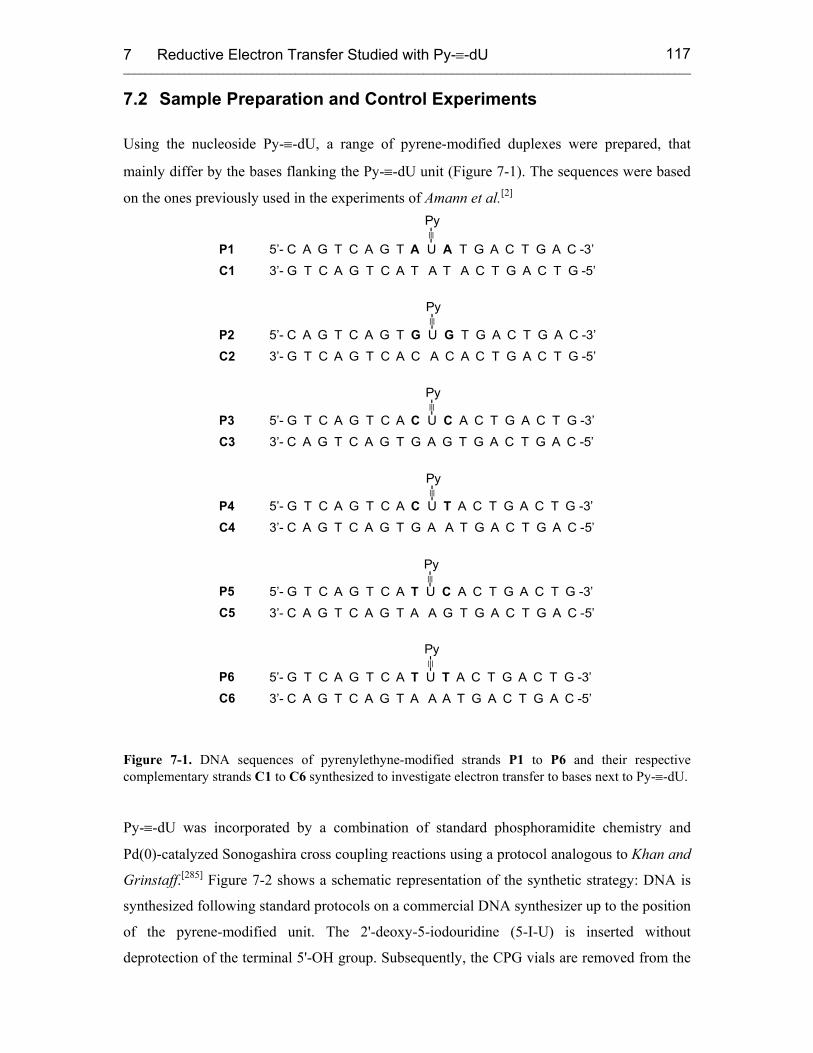
7 Reductive Electron Transfer Studied with Py-≡-dU ______________________________________________________________________________________________________
117
7.2 Sample Preparation and Control Experiments
Using the nucleoside Py-≡-dU, a range of pyrene-modified duplexes were prepared, that
mainly differ by the bases flanking the Py-≡-dU unit (Figure 7-1). The sequences were based
on the ones previously used in the experiments of Amann et al.[2]
5’- C A G T C A G T U T G A C T G A C -3’
3’- G T C A G T C A T A T A C T G A C T G -5’
3’- G T C A G T C A C A C A C T G A C T G -5’
5’- G T C A G T C A U A C T G A C T G -3’
3’- C A G T C A G T G A G T G A C T G A C -5’
3’- C A G T C A G T G A A T G A C T G A C -5’
3’- C A G T C A G T A A G T G A C T G A C -5’
3’- C A G T C A G T A A A T G A C T G A C -5’
A A
C C
5’- C A G T C A G T U T G A C T G A C -3’
5’- G T C A G T C A U A C T G A C T G -3’
5’- G T C A G T C A U A C T G A C T G -3’
5’- G T C A G T C A U A C T G A C T G -3’
G G
C T
T C
T T
Py
--≡
Py
--≡
Py
--≡
Py
--≡
Py
--≡
Py
--≡
P1C1
P2C2
P3C3
P4C4
P5C5
P6C6
Figure 7-1. DNA sequences of pyrenylethyne-modified strands P1 to P6 and their respective complementary strands C1 to C6 synthesized to investigate electron transfer to bases next to Py-≡-dU.
Py-≡-dU was incorporated by a combination of standard phosphoramidite chemistry and
Pd(0)-catalyzed Sonogashira cross coupling reactions using a protocol analogous to Khan and
Grinstaff.[285] Figure 7-2 shows a schematic representation of the synthetic strategy: DNA is
synthesized following standard protocols on a commercial DNA synthesizer up to the position
of the pyrene-modified unit. The 2'-deoxy-5-iodouridine (5-I-U) is inserted without
deprotection of the terminal 5'-OH group. Subsequently, the CPG vials are removed from the
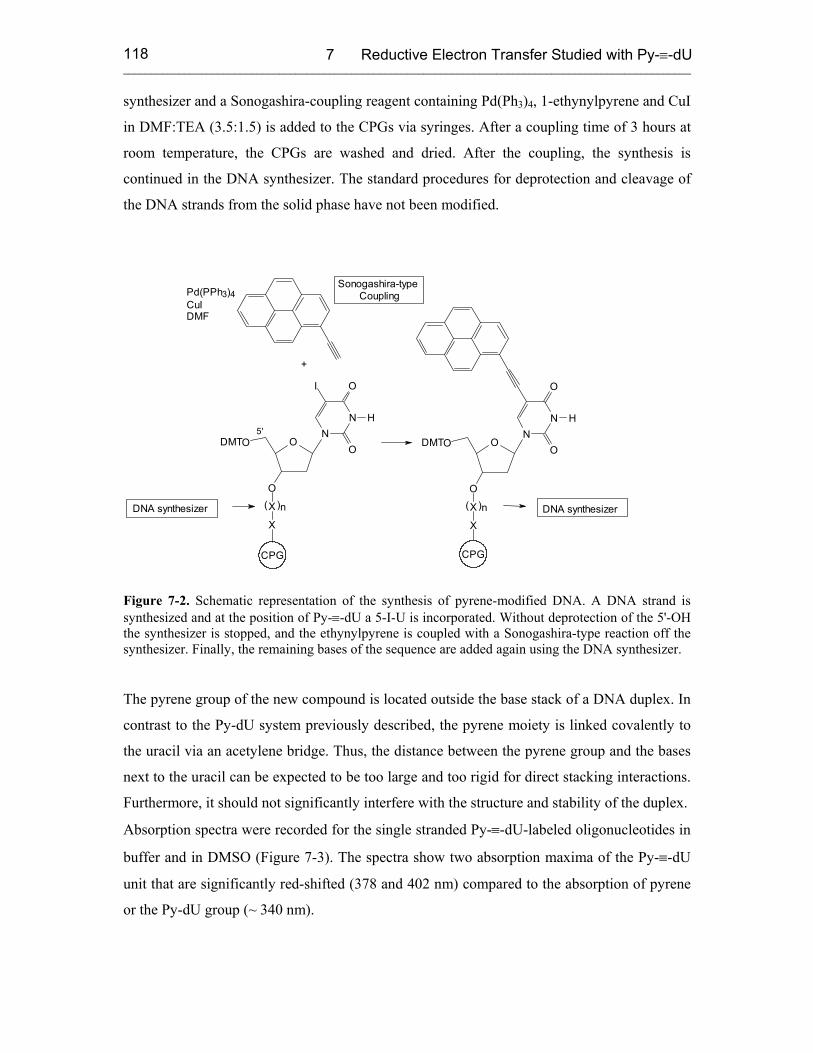
7 Reductive Electron Transfer Studied with Py-≡-dU ______________________________________________________________________________________________________
118
synthesizer and a Sonogashira-coupling reagent containing Pd(Ph3)4, 1-ethynylpyrene and CuI
in DMF:TEA (3.5:1.5) is added to the CPGs via syringes. After a coupling time of 3 hours at
room temperature, the CPGs are washed and dried. After the coupling, the synthesis is
continued in the DNA synthesizer. The standard procedures for deprotection and cleavage of
the DNA strands from the solid phase have not been modified.
H
O
O
NN
O
O
O
X
X
DMT
DNA synthesizer
CPG
DNA synthesizer
CPG
DMT
H
O
O
NN
O
O
O
I
X
X
Sonogashira-typeCoupling
+
5'
( )n ( )n
Pd(PPh3)4CuIDMF
Figure 7-2. Schematic representation of the synthesis of pyrene-modified DNA. A DNA strand is synthesized and at the position of Py-≡-dU a 5-I-U is incorporated. Without deprotection of the 5'-OH the synthesizer is stopped, and the ethynylpyrene is coupled with a Sonogashira-type reaction off the synthesizer. Finally, the remaining bases of the sequence are added again using the DNA synthesizer.
The pyrene group of the new compound is located outside the base stack of a DNA duplex. In
contrast to the Py-dU system previously described, the pyrene moiety is linked covalently to
the uracil via an acetylene bridge. Thus, the distance between the pyrene group and the bases
next to the uracil can be expected to be too large and too rigid for direct stacking interactions.
Furthermore, it should not significantly interfere with the structure and stability of the duplex.
Absorption spectra were recorded for the single stranded Py-≡-dU-labeled oligonucleotides in
buffer and in DMSO (Figure 7-3). The spectra show two absorption maxima of the Py-≡-dU
unit that are significantly red-shifted (378 and 402 nm) compared to the absorption of pyrene
or the Py-dU group (~ 340 nm).
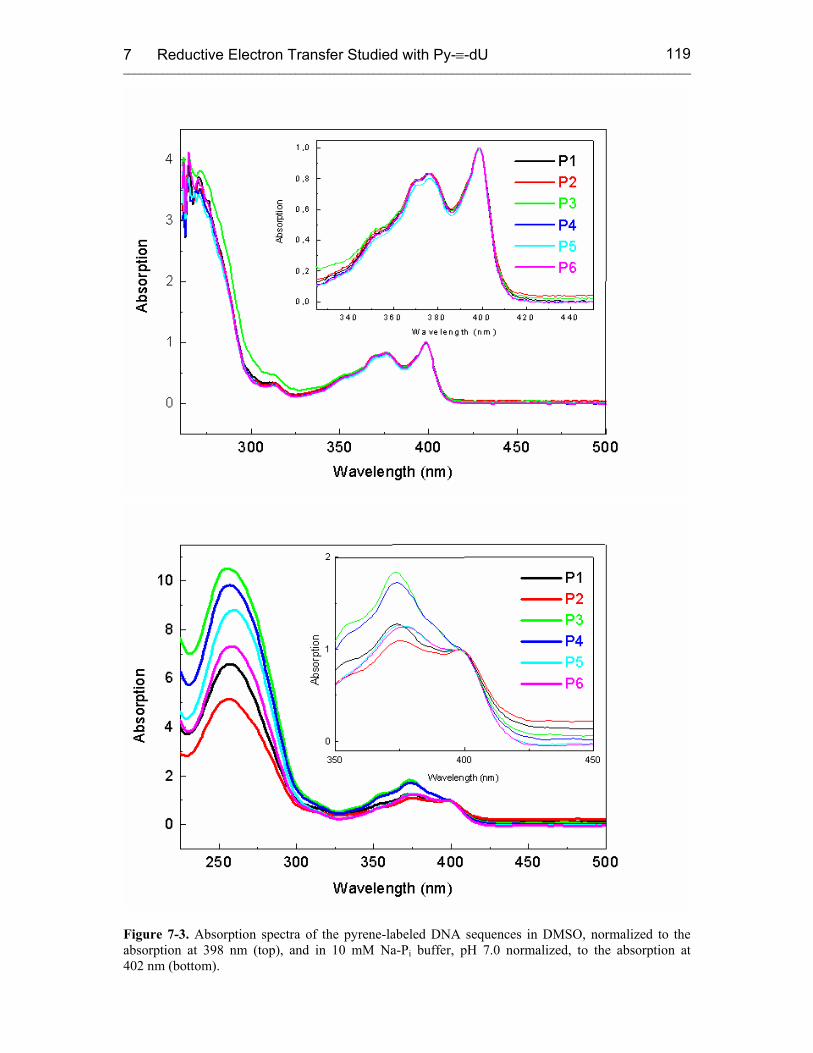
7 Reductive Electron Transfer Studied with Py-≡-dU ______________________________________________________________________________________________________
119
Figure 7-3. Absorption spectra of the pyrene-labeled DNA sequences in DMSO, normalized to the absorption at 398 nm (top), and in 10 mM Na-Pi buffer, pH 7.0 normalized, to the absorption at 402 nm (bottom).

7 Reductive Electron Transfer Studied with Py-≡-dU ______________________________________________________________________________________________________
120
DMSO is known to disrupt the secondary structure of nucleic acids.[286] Therefore UV/Vis
spectra in DMSO were recorded to test the influence of base stacking on the Py-≡-dU
absorption and to get an estimation of the extinction coefficient of Py-≡-dU at 260 nm to
enable determination of DNA oligonucleotide concentration by measuring absorption at
260 nm.[287] Remarkably, in DMSO the absorption spectra of all six oligodeoxynucleotides
exhibit the same shape and the same absorption maxima (374 and 398 nm, Figure 7-3). This
provides evidence that in DMSO base-stacking interactions between the Py-≡-dU group and
the adjacent bases are indeed interrupted, since in aqueous buffer the spectra are significantly
different (Figure 7-3).
To find out if incorporation of the Py-≡-dU group perturbs DNA duplex structure, UV melts
and CD spectra of the duplexes were measured. Determined melting temperatures are reported
in Table 7-1 and compared with calculated Tm for duplexes containing T instead of the Py-≡-
dU group as a reference. In general, melting temperatures of the Py-≡-dU containing duplexes
are slightly higher than calculated Tm of reference duplexes. This slight increase of 2 to 3 °C
can be attributed to the stabilization of DNA by the acetylene group.[84, 85]
Table 7-1. Comparison of measured melting temperatures of DNA duplexes containing Py-≡-dU versus calculated Tms of reference duplexes.
DNA duplex Tm exp [°C] Tm calc [°C]
P1/C1 52.2 50.6
P2/C2 52.3 54.9
P3/C3 56.4 54.9
P4/C4 55.1 52.7
P5/C5 56.1 52.7
P6/C6 53.0 50.6
CD spectra recorded for all six duplexes confirmed B-form DNA structure. No Cotton effect
was observed in the absorption range of the Py-≡-dU unit (330 to 420 nm) (Figure 7-4),
providing evidence that the pyrene moiety is not stacked within the duplex.
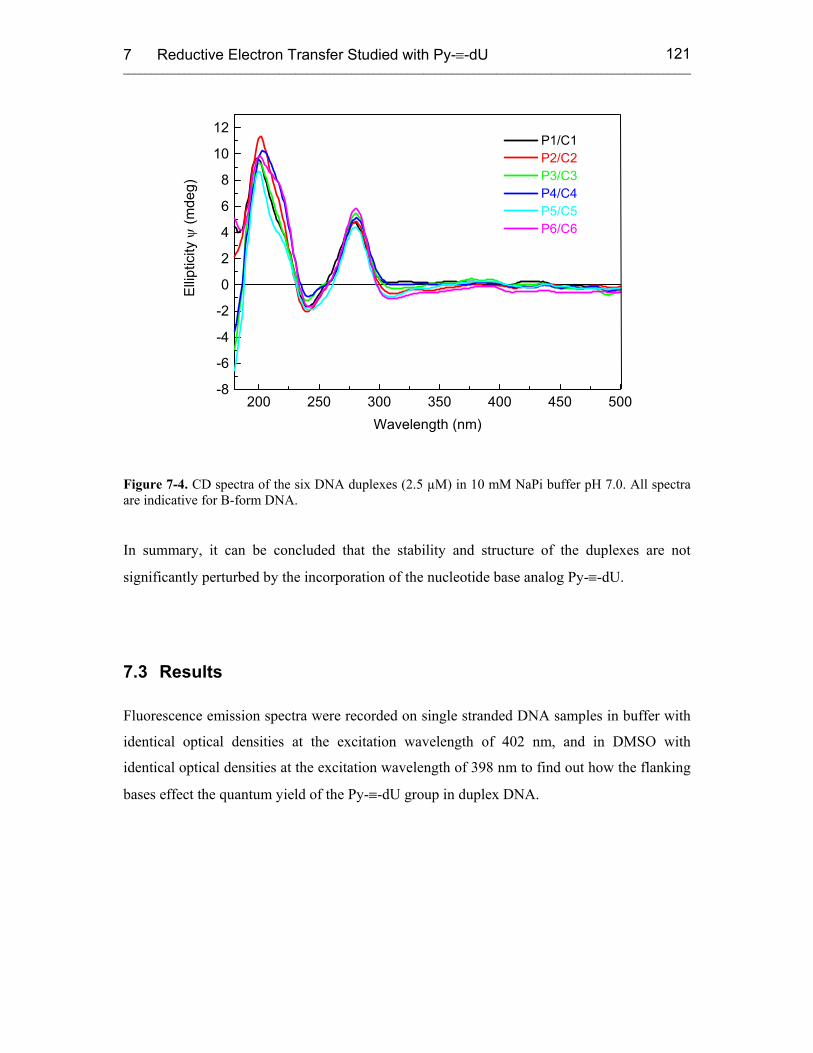
7 Reductive Electron Transfer Studied with Py-≡-dU ______________________________________________________________________________________________________
121
200 250 300 350 400 450 500-8
-6
-4
-2
0
2
4
6
8
10
12
Elli
ptic
ity ψ
(mde
g)
Wavelength (nm)
P1/C1 P2/C2 P3/C3 P4/C4 P5/C5 P6/C6
Figure 7-4. CD spectra of the six DNA duplexes (2.5 µM) in 10 mM NaPi buffer pH 7.0. All spectra are indicative for B-form DNA.
In summary, it can be concluded that the stability and structure of the duplexes are not
significantly perturbed by the incorporation of the nucleotide base analog Py-≡-dU.
7.3 Results
Fluorescence emission spectra were recorded on single stranded DNA samples in buffer with
identical optical densities at the excitation wavelength of 402 nm, and in DMSO with
identical optical densities at the excitation wavelength of 398 nm to find out how the flanking
bases effect the quantum yield of the Py-≡-dU group in duplex DNA.
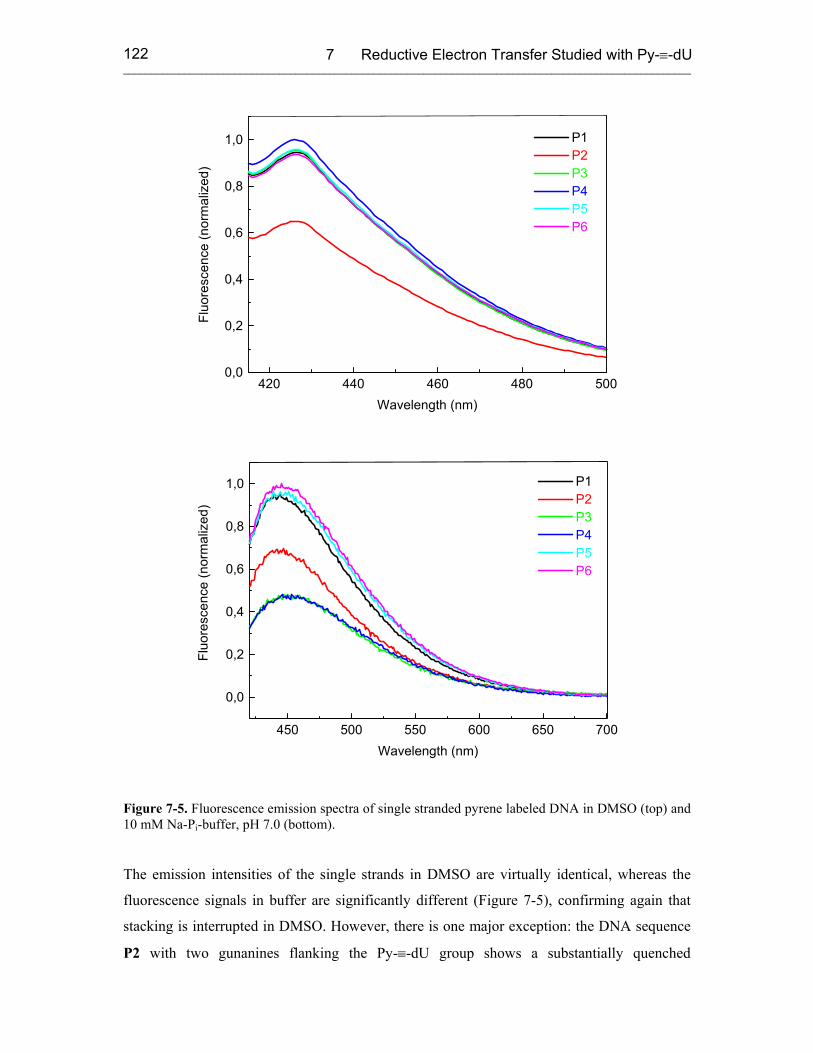
7 Reductive Electron Transfer Studied with Py-≡-dU ______________________________________________________________________________________________________
122
420 440 460 480 5000,0
0,2
0,4
0,6
0,8
1,0
Fluo
resc
ence
(nor
mal
ized
)
Wavelength (nm)
P1 P2 P3 P4 P5 P6
450 500 550 600 650 700
0,0
0,2
0,4
0,6
0,8
1,0
Fluo
resc
ence
(nor
mal
ized
)
Wavelength (nm)
P1 P2 P3 P4 P5 P6
Figure 7-5. Fluorescence emission spectra of single stranded pyrene labeled DNA in DMSO (top) and 10 mM Na-Pi-buffer, pH 7.0 (bottom).
The emission intensities of the single strands in DMSO are virtually identical, whereas the
fluorescence signals in buffer are significantly different (Figure 7-5), confirming again that
stacking is interrupted in DMSO. However, there is one major exception: the DNA sequence
P2 with two gunanines flanking the Py-≡-dU group shows a substantially quenched
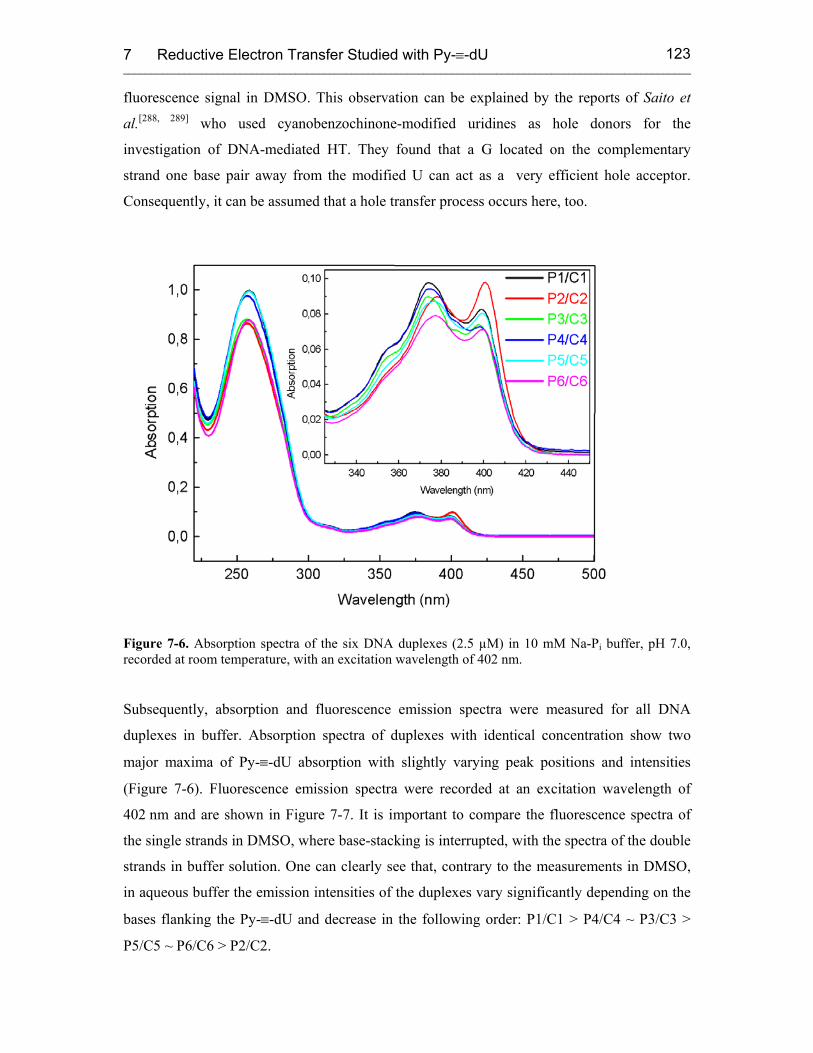
7 Reductive Electron Transfer Studied with Py-≡-dU ______________________________________________________________________________________________________
123
fluorescence signal in DMSO. This observation can be explained by the reports of Saito et
al.[288, 289] who used cyanobenzochinone-modified uridines as hole donors for the
investigation of DNA-mediated HT. They found that a G located on the complementary
strand one base pair away from the modified U can act as a very efficient hole acceptor.
Consequently, it can be assumed that a hole transfer process occurs here, too.
Figure 7-6. Absorption spectra of the six DNA duplexes (2.5 µM) in 10 mM Na-Pi buffer, pH 7.0, recorded at room temperature, with an excitation wavelength of 402 nm.
Subsequently, absorption and fluorescence emission spectra were measured for all DNA
duplexes in buffer. Absorption spectra of duplexes with identical concentration show two
major maxima of Py-≡-dU absorption with slightly varying peak positions and intensities
(Figure 7-6). Fluorescence emission spectra were recorded at an excitation wavelength of
402 nm and are shown in Figure 7-7. It is important to compare the fluorescence spectra of
the single strands in DMSO, where base-stacking is interrupted, with the spectra of the double
strands in buffer solution. One can clearly see that, contrary to the measurements in DMSO,
in aqueous buffer the emission intensities of the duplexes vary significantly depending on the
bases flanking the Py-≡-dU and decrease in the following order: P1/C1 > P4/C4 ~ P3/C3 >
P5/C5 ~ P6/C6 > P2/C2.
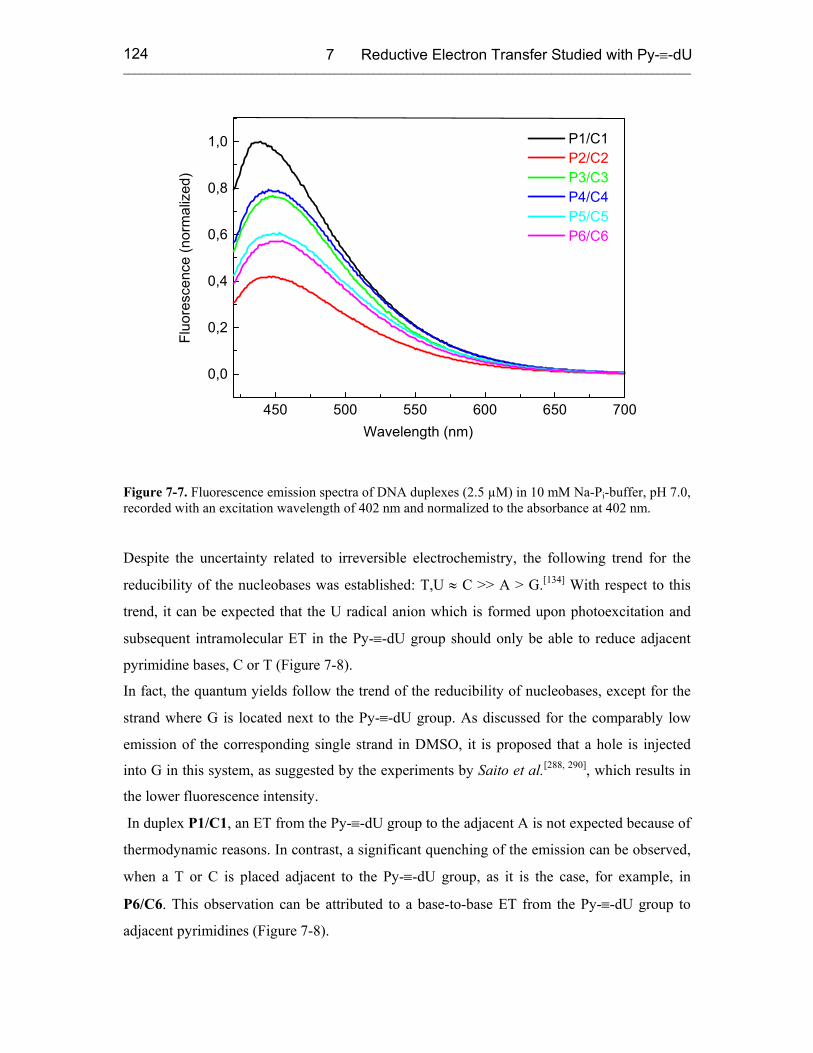
7 Reductive Electron Transfer Studied with Py-≡-dU ______________________________________________________________________________________________________
124
450 500 550 600 650 700
0,0
0,2
0,4
0,6
0,8
1,0
Fluo
resc
ence
(nor
mal
ized
)
Wavelength (nm)
P1/C1 P2/C2 P3/C3 P4/C4 P5/C5 P6/C6
Figure 7-7. Fluorescence emission spectra of DNA duplexes (2.5 µM) in 10 mM Na-Pi-buffer, pH 7.0, recorded with an excitation wavelength of 402 nm and normalized to the absorbance at 402 nm.
Despite the uncertainty related to irreversible electrochemistry, the following trend for the
reducibility of the nucleobases was established: T,U ≈ C >> A > G.[134] With respect to this
trend, it can be expected that the U radical anion which is formed upon photoexcitation and
subsequent intramolecular ET in the Py-≡-dU group should only be able to reduce adjacent
pyrimidine bases, C or T (Figure 7-8).
In fact, the quantum yields follow the trend of the reducibility of nucleobases, except for the
strand where G is located next to the Py-≡-dU group. As discussed for the comparably low
emission of the corresponding single strand in DMSO, it is proposed that a hole is injected
into G in this system, as suggested by the experiments by Saito et al.[288, 290], which results in
the lower fluorescence intensity.
In duplex P1/C1, an ET from the Py-≡-dU group to the adjacent A is not expected because of
thermodynamic reasons. In contrast, a significant quenching of the emission can be observed,
when a T or C is placed adjacent to the Py-≡-dU group, as it is the case, for example, in
P6/C6. This observation can be attributed to a base-to-base ET from the Py-≡-dU group to
adjacent pyrimidines (Figure 7-8).
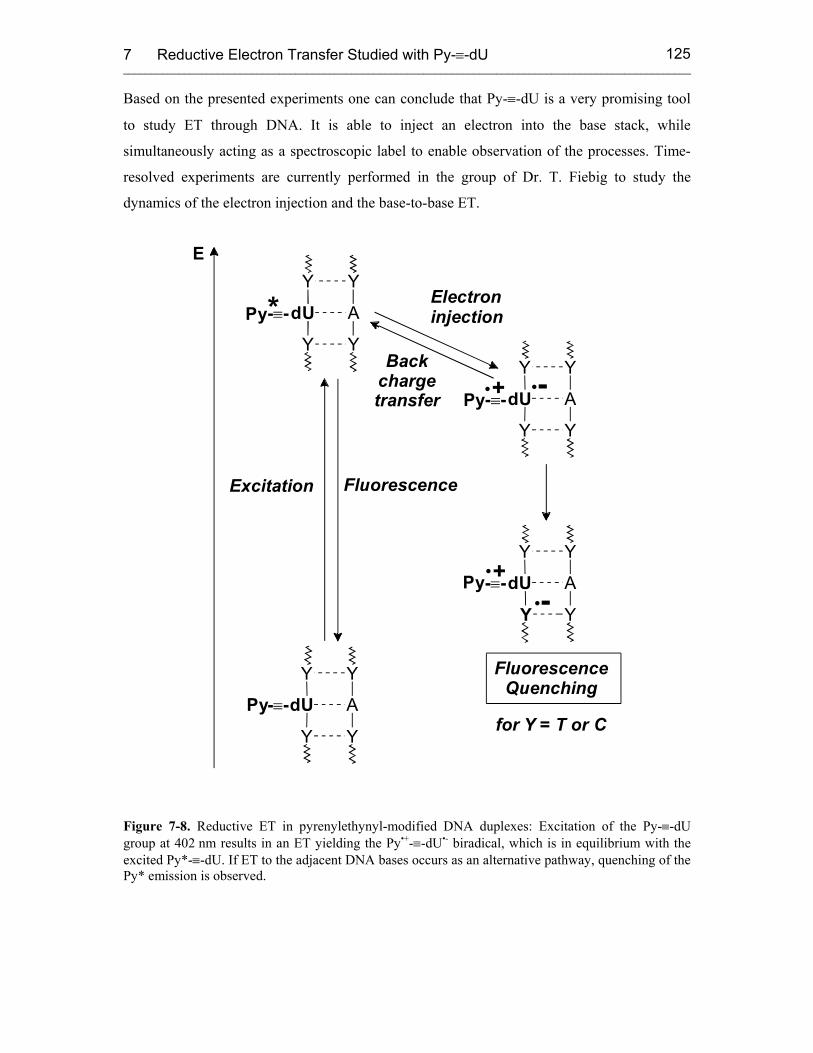
7 Reductive Electron Transfer Studied with Py-≡-dU ______________________________________________________________________________________________________
125
Based on the presented experiments one can conclude that Py-≡-dU is a very promising tool
to study ET through DNA. It is able to inject an electron into the base stack, while
simultaneously acting as a spectroscopic label to enable observation of the processes. Time-
resolved experiments are currently performed in the group of Dr. T. Fiebig to study the
dynamics of the electron injection and the base-to-base ET.
-
E
+Y
dU A
Y
Y Y
Py
Y
dU A
Y
Y Y
Py
Electron
Back charge transfer
injection
Excitation
•
Y
dU A
Y
Y Y
Py
•
•+•-
for Y = T or C
Fluorescence
*Y
dU A
Y
Y Y
Py
FluorescenceQuenching
- -≡
- -≡
- -≡
- -≡
Figure 7-8. Reductive ET in pyrenylethynyl-modified DNA duplexes: Excitation of the Py-≡-dU group at 402 nm results in an ET yielding the Py•+-≡-dU•- biradical, which is in equilibrium with the excited Py*-≡-dU. If ET to the adjacent DNA bases occurs as an alternative pathway, quenching of the Py* emission is observed.

8 Summary ______________________________________________________________________________________________________
126
8 Summary
In the presented thesis the fluorescent nucleoside base analogs 2-aminopurine and 5-(1-
pyrenylethynyl)-2'-deoxyuridine were used to study the structure and dynamics of nucleic
acids, their interactions and electronic properties.
The method of studying RNA loop-loop kissing interactions using fluorescence spectroscopy
was validated by incorporating 2-AP into the loops of RNA hairpins taken from the intensely
investigated ColE1 plasmid replication system. By observing changes in the 2-AP
fluorescence it was possible to determine equilibrium binding constants as well as on- and
off-rates for kissing complex formation and a binding constant for the auxiliary protein Rom
binding to the kissing complex. These results are in agreement with previous studies using
other methods, hence, the fluorescence assay is validated. An advantage of the fluorescence
spectroscopy in comparison to other applied methods, like native gel electrophoresis and filter
binding assays, is the real-time kinetic resolution and the native like solution conditions.
Thus, it was possible to derive a two-step binding model for the RNA loop-loop complex
formation of R1 and R2 from the results of the kinetic studies. Additionally, the stringent
divalent metal ion requirement for RNA loop-loop kissing complex formation could be
studied in detail and apparent binding constants for the metal ions to the complex could be
determined. The observed correlation of apparent metal ion binding constants with ionic
radius and Lewis acidity lead to the conclusion that in the RNA complex there must be a
structurally limited though somewhat flexible binding pocket for the divalent metal ions,
since larger, more basic cations showed a weaker apparent binding constant than smaller,
more acidic metals.
Transferring the experience with the now validated method to a new framework, a new RNA
antisense system was investigated, namely the dimerization initiation site of HIV-1. With
specifically designed heterodimeric samples the equilibrium binding constants, on- and off-
rates of the kissing complex and the conversion to the extended mature duplex with the aid of
the nucleocapsid protein could be investigated. In contrast to the bacterial system, the DIS
hairpins were able to form a loop-loop kissing complex in the presence of divalent and
monovalent cations or at millimolar concentrations, whereby the latter complexes have been
found to be metastable and capable of spontaneously converting to the mature duplex form at
an appreciable rate over time. Most importantly, based on these results the pathway of
extended duplex formation was unequivocally confirmed, which proceeds from kissing
8 Summary ______________________________________________________________________________________________________
127
complex to mature duplex via a strand exchange, and the role of NCp7 in this structural
isomerization was proposed to be the temporal control of the process.
After using changes in 2-AP fluorescence for the study of macromolecular interactions, it was
reasonable to investigate the processes in more detail that can cause the observed fluorescence
changes. Thus, the focus was shifted to the investigation of the electronic properties of 2-AP
in DNA. Initially, the fate of the excitation energy of 2-AP was studied, and it was found that
2-AP can form excimers and exciplexes. A significant ground-state interaction of 2-AP and its
neighboring bases was detected. This result can also be transferred to the stacking interactions
of natural nucleic acid bases. Dynamic investigations revealed that stacking and destacking in
DNA duplexes occur on the order of 5 ps.
Subsequently, the influence of neighboring bases on the fluorescence quenching by charge
transfer was studied using dinucleotides composed of all natural DNA bases and inosine next
to 2-AP. It was found that fluorescence intensities of these dinucleotides follow neither the
trend for oxidizability nor reducibility of nucleobases and thus, photoexcited 2-AP is able to
undergo both hole and electron transfer. It can be concluded that such charge transfer
processes cause the quenching of the excited 2-AP within DNA or RNA.
Oxidative hole transfer has been studied extensively in the past decades, but very little is
known about the mechanism of reductive electron transfer in DNA. Since 2-AP shows a
behavior too complex to utilize for systematic studies, the reductive electron transfer
properties were investigated in model DNA duplexes using a new fluorescent nucleside
analog, Py-≡-dU. A new and improved synthetic method combining standard automated DNA
synthesis and a Sonogashira-type cross coupling reaction on the solid phase was developed
for the modification of DNA with the Py-≡-dU unit. Py-≡-dU was found to be a very
promising electron injector, and it is proposed that charge can be transferred to adjacent C and
T bases.
In summary, these results impressively demonstrate the wide range of questions that can be
addressed using fluorescence spectroscopy.
9 Materials and Methods ______________________________________________________________________________________________________
128
9 Materials and Methods
9.1 Materials
Unless otherwise noted, all chemicals and reagents were purchased from Sigma, J. T. Baker,
Life Technologies, ICN or Fluka, as ultra pure or ACS reagents. Distilled and deionized water
(ddH2O) was taken from a millipore unit, and if used for solutions of pure RNA it was either
sterilized by autoclaving or treated with 0.01 % DEPC.
9.2 Frequently Used Buffers
1xTBM: 90 mM Tris, 90 mM boric acid, 1 mM MgCl2
1xTBCa: 90 mM Tris, 90 mM boric acid, 1 mM CaCl
1/2xTBE: 45 mM Tris, 45 mM boric acid, 1 mM EDTA
standard buffer for RNA: 1 mM cacodylic acid, pH 6.5, 25 mM NaCl
standard buffer for DNA: 10 mM sodium phosphate (Na-Pi), pH 7.0
9.3 General Work Procedures
9.3.1 Denaturing Polyacrylamide Gel Electrophoresis (PAGE)
For denaturing minigels approximately 15 ml 20 % acrylamide (19:1 acrylamide:
bisacrylamide) with 8 M urea and 1/2xTBE was mixed with 15 µl TEMED and 150 µl 10 %
(w/v) APS to induce polymerization. After polymerization, gels were prerun in 1/2xTBE at
room temperature (R.T.) at 10 W in a Hoefer Minigel apparatus. Samples were prepared with
equal volumes of RNA or DNA solution and formamide and 1 µl of 1% (w/v) bromophenol
blue solution, and heated to 90 °C for 1 min before loading samples on the gel. Gels were run
at 10 W for approximately 45 min, and nucleic acids were visualized by ethidium bromide
staining.
For preparative scale denaturing PAGE, 100 ml 20 % acrylamide (19:1) with 8 M urea and
1/2x TBE was mixed with 80 µl TEMED and 800 µl 10 % (w/v) APS to induce
polymerization. After polymerization, gels were prerun in 1/2xTBE at R.T. at 40 W for about
15 to 30 min. Then wells were cleared from excess acrylamide and urea and samples from a
9 Materials and Methods ______________________________________________________________________________________________________
129
10 ml transcription reaction or a 1 µmole chemical synthesis was mixed with an equal volume
of formamide and 1 µl of 10 % (w/v) bromophenol blue, denatured by heating to 90 °C for
1 min, loaded on the gel and run at 45 W for several hours. Nucleic acids were visualized by
UV shadowing, and appropriate bands were cut out of the gel and stored at -20 °C until
further treatment.
9.3.2 Native Polyacrylamide Gel Electrophoresis
• on RNA:
For native PAGE on RNA samples, per gel 15 ml of a 15 % acrylamide (75:1
acrylamide:bisacrylamide) solution containing either 1xTBM or 1/2xTBE were mixed with
15 µl TEMED and 150 µl 10 % (w/v) APS to cast the gels. Polymerized gels were
preequilibrated for 30 min in the respective running buffer (1xTBM or 1/2xTBE) at 4 °C at
10 V/cm using a submarine minigel apparatus (BioRad). Then samples were loaded and run at
4 °C at 10 V/cm until the bromophenol blue reached the bottom of the gel. RNA was
visualized by ethidium bromide staining.
In general, samples were prepared with 10 µM RNA hairpin or kissing complex in the
respective running buffer, and 5 to 10 % loading dye (15 % glycerol, 1 mg/ml bromophenol
blue in ddH2O) was added before loading. Usually, 10 to 20 µl of the samples were loaded on
the gels. To assay formation of complexes by R1inv and R2inv hairpins containing 2-
aminopurine, and binding of these complexes by Rom, equal amounts (10 µM final
concentration) of the complementary hairpins were mixed and incubated in 1xTBM for 5 to
10 min either with or without Rom in 5-fold excess. Before loading the samples on the gel, 5
to 10 % of loading dye was added, and 50 µL of samples were loaded. Samples were
visualized by ethidium bromide staining.
• on DNA:
For native PAGE on DNA, 15 ml of a 15 % acrylamide (75:1 acrylamide:bisacrylamide)
solution containing either 1xTBCa or 1/2xTBE were mixed with 15 µl TEMED and 150 µl
10 % (w/v) APS to cast the gels. The polymerized gels were preequilibrated for 15 to 30 min
and run at room temperature at 10 V/cm in a Hoefer mini vertical electrophoresis unit.
Samples were prepared essentially as with RNA, but at higher concentrations of DNA
(23 µM). Samples were visualized by ethidium bromide staining or Py-≡-dU fluorescence.
9 Materials and Methods ______________________________________________________________________________________________________
130
9.3.3 High-Performance Liquid Chromatography (HPLC)
Synthesized DNA was purified by reverse-phase high-performance liquid chromatography
(RP-HPLC) on a Waters 1525 HPLC system using a 25 cm x 10 mm Supelcosil LC-318
column (Supelco), preequilibrated with 100 % A (50 mM ammonium acetate buffer, pH 6.5).
Usually DNA from a 1 µmole synthesis, dissolved in 300 µl ddH2O was injected into the
column and eluted with a gradient 0-15 % or 0-30 % B (acetonitrile) over 45 min.
9.3.4 Lyophilization
Aqueous solutions were frozen in dry ice or liquid nitrogen and lyophilized on a Christ
Alpha-2-4 lyophilizer.
9.3.5 Annealing of RNA or DNA Duplexes
RNA or DNA duplexes were annealed by heating a solution of a 1:1 mixture of the single
stranded complementary oligonucleotides to 85 to 90 °C for 5 min and cooling slowly to R. T.
over a period of two to three hours.
9.3.6 Snap Cooling
Solutions of DIS RNA oligonucleotides were heated to 90 °C for 1min and quickly cooled on
dry ice for 20 to 30 sec to force possibly aggregated RNA into monomeric hairpins.
9.3.7 MALDI-TOF Mass Spectroscopy
High-resolution MALDI-TOF mass spectra of DNA oligonucleotides were measured on a
Bruker Biflex III spectrometer in a matrix containing 9 parts 50 mg/ml 3-hydroxypicolinic
acid in ddH2O:acetonitrile (50:50) and 1 part 50 mg/ml diammonium citrate in ddH2O at a
DNA concentration of 10 to 50 µM in linear negative mode.
9.3.8 UV/Vis Spectroscopy
Absorption spectra of RNA and DNA samples were measured on a Cary 50, Cary 100 or
Cary 300 spectrophotometer (Varian Instruments, Palo Alto, CA) in ddH2O, buffer or DMSO
in 1 cm path length quartz cuvettes.
9 Materials and Methods ______________________________________________________________________________________________________
131
9.3.9 UV Melts
• on RNA:
Optical absorbance melting curves for RNA samples were measured on a Cary 300
spectrophotometer (Varian Instruments, Palo Alto, CA). Samples were prepared in melting
buffer (10 mM sodium cacodylate, pH 6.5, 50 mM NaCl, 0.1 mM EDTA, with or without
5 mM MgCl2, degassed by autoclaving or sparging with nitrogen for 15 min), so that the
initial optical density at 260 nm was approximately 0.55-0.65 in quartz cuvettes with 1 cm
path length. Temperature was controlled by a Cary temperature control unit, and was
increased from 10 to 90 °C at a rate of 0.25 °C/min, and absorption at 260 nm was observed
recording data every 1 °C. At temperatures below room temperature, the sample chamber was
flushed with nitrogen.
Melting temperatures were determined by calculating the first derivatives of the melting
curves and assuming the maximum in the derivative to be the melting temperature.
• on DNA:
Optical absorbance melting curves were measured on a Cary 100 (Varian). Samples were
prepared in 10 mM sodium phosphate buffer, pH 7.0 with or without 250 mM NaCl, degassed
by sparging with nitrogen for 15 min, with sample concentrations of 2.5 µM in 1 cm path
length quartz cuvettes. Temperature was controlled by a Cary temperature control unit, and
was increased from 10 to 60 or 90 °C at a heating rate of 0.25 or 1 °C/min for Py-≡-dU or
excimer duplexes, respectively, recording absorption at 260 nm every 1 °C. At temperatures
below room temperature, the sample chamber was flushed with nitrogen.
Melting temperatures were determined by calculating the first derivatives of the melting
curves and assuming the maximum in the derivative to be the melting temperature.
9.3.10 Circular Dichroism Spectroscopy (CD)
CD spectra of DNA samples were recorded on a Jasco J-15 spectropolarimeter with a Jasco
PTC-150J temperature control unit in a 1cm path length quartz glass cuvette. Samples were
prepared in 10 mM Na-Pi, pH 7.0 with or without 250 mM NaCl in a total volume of 1 ml.
Experiments were measured with a step resolution of 0.5 or 1 nm, scan speed of 500 or
1000 nm/min, and 2 nm bandwidth. Usually five spectra were averaged, and buffer blank
spectra recorded with the same parameters were subtracted. Sample concentrations were
10 µM for the dinucleotides and 2.5 µM for all DNA duplexes. For dinucleotides, spectra
9 Materials and Methods ______________________________________________________________________________________________________
132
were recorded from 340 to 185 nm, for excimer samples, from 320 to 185 nm, for Py-≡-dU
containing samples, the wavelength range was 450 to 200 nm.
9.4 Protein Preparations
9.4.1 T7 Polymerase
Affinity-tagged T7 polymerase was expressed and purified following a protocol elaborated by
T.E. Shrader. Escherichia coli (E. coli) strain BL21 containing the plasmid pT7-911Q were
plated on Luria agar containing 100 µg/ml ampicillin. 5 ml Luria agar base with 100 µg/ml
ampicillin were inoculated with a single colony from the plate and incubated at 37 °C
overnight. Of this starter culture 2 ml were used to inoculate 2 l LB broth with 100 µg/ml
ampicillin. Cultures were shaken at 37 °C until the absorbance at 600 nm reached 0.4 - 0.6.
Then cultures were induced for overexpression with 100 µM IPTG (GOLD Biotechnology,
Inc) and shaken for 3 more hours at 37 °C. Cells were harvested by centrifugation at
7000 rpm for 15 min, and cell pellets were stored at -75 °C. The cell pellets were thawed at
room temperature and resuspended in 25 ml lysis buffer (50 mM Tris, pH 8.0, 100 mM NaCl,
5 mM BME, 5 % glycerol) containing 1 mM imidazole. Cells were lysed by French pressing
2 - 3 times at 800 psi. Cell debris was removed from the lysate by centrifugation at 18000xg
for 30 min. The cleared lysate (25 ml) was bound to 5 ml of Ni-NTA agarose resin (Qiagen)
(10 ml resin + buffer) by gentle rocking for 30 min at 4 °C. After gently pelleting the resin in
a clinical centrifuge, and discarding the supernatant, the resin was washed four times with
35 ml lysis buffer containing 1 mM imidazole, and four times with 35 ml lysis buffer
containing 10 mM imidazole using batch method. T7 polymerase was eluted by washing the
resin twice with 10 ml of lysis buffer containing 100 mM imidazole for 5 min at 4 °C. The
eluted protein was concentrated in a Centriprep 30 concentrator (Millipore) to a concentration
of approximately 6 mg/ml. Glycerol was added to a final concentration of 25 % and aliquots
were stored at -20 °C (-75 °C for long term storage). Concentration was determined by
measuring the absorption at 280 nm using the following relationship:
Abs 0.1 % (=1 g/l) at 280 nm = 1.344 (assuming all Cysteine residues to be single Cysteins)
9.4.2 Nucleocapsid Protein (NCp7)
Nucleocapsid protein (NCp7) from HIV-1 was expressed and purified in principle as
described by Lee et al.[291] E. coli strain BL21(DE3) pLysE containing plasmid pRD2 were

9 Materials and Methods ______________________________________________________________________________________________________
133
plated on ZB[292] + agar (2 g Bacto Tryptone (Difco), 1 g NaCl, 3 g Bacto Agar (Difco) in
200 ml ddH2O) with 100 µg/ml ampicillin and 34 µg/ml chloramphenicol and incubated
overnight at 37 °C. 20 ml ZB broth[292] (2 g Bacto Tryptone, 1 g NaCl in 200 ml ddH2O)
containing 100 µg/ml ampicillin and 34 µg/ml chloramphenicol were inoculated with a single
colony from the plate and incubated overnight in a shaker at 37 °C. 20 ml of this starter
culture was used to inoculate 2 l M9ZB broth (20 g Bacto Tryptone, 10 g NaCl in 1.8 l ddH2O
+ 200 ml M9salts: 2 g NH4Cl, 6 g KH2PO4, 12 g Na2HPO4x7H2O, 200 ml ddH2O + 2 ml 1 M
MgSO4 + 40 ml 20 % glucose + 1 ml 0.2 M ZnCl2) containing 100 µg/ml ampicillin and
34 µg/ml chloramphenicol, which was grown to an absorbance at 600 nm of 0.5 - 0.6, before
it was induced with 1 mM IPTG. After three hours cells were harvested by centrifugation at
8000 rpm for 15 min. Cell pellet was resuspended in 30 ml lysis buffer (50 mM Tris, pH 8.0,
10 % (v/v) glycerol, 0.1 M NaCl, 0.1 mM ZnCl2, 5 mM DTT, 2 mM EDTA) and stored at
–70 °C. For lysis cells were thawed in ice-water, and 172 µl of 10 mM PMSF, 30 µl of
1 mg/ml pepstatin A, and 2.1 ml of 1 % (w/v) sodium deoxycholate were added, and cells
were sonicated with 5 bursts of 20 seconds to reduce viscosity. Nucleic acids were
precipitated by adding 4 % PEI, pH 7.9 dropwise to a final concentration of 0.4 %, and stirred
for 15 min. The precipitate was pelleted by centrifugation at 23000xg for 30 min at 4 °C. The
supernatant was collected, filtered (0.45 µm) and loaded at 1 ml/min onto a 20 ml Q-
Sepharose and a 20 ml SP-Sepharose column connected in series and previously equilibrated
with 200 ml of buffer A (50 mM Tris, pH 8.0, 10 % glycerol, 0.1 M NaCl, 0.1 mM ZnCl2,
10 mM BME). The columns were washed with 60 ml buffer A, then the Q-Sepharose column
was detached, and the SP-Sepharose column was washed with another 1.5 column volumes of
buffer A. The protein was eluted with a ten column volume linear gradient from 40 % to 50 %
buffer B (50 mM Tris, pH 8.0, 10 % glycerol, 1 M NaCl, 0.1 mM ZnCl2, 10 mM BME). Then
the protein was loaded (2 ml at a time, 11 shots) at a flow rate of 6 ml/min on a 60 cm x
21.5 mm TSK-GEL sizing column (Toso Haas), previously preequilibrated with two column
volumes of buffer C (50 mM Tris, pH 7.0, 10 % glycerol, 0.1 M NaCl, 0.1 mM ZnCl2, 10 mM
BME). Collected protein fractions (about 160 ml) were concentrated using the SP-Sepharose
column: the protein was loaded at 1 ml/min onto the column, which had previously been
equilibrated with buffer C, and eluted with 50 % buffer B. The eluted protein (about 35 ml)
was further concentrated down to 2-3 ml using centriprep 3 concentrators (Amicon), and was
then dialyzed with a microdialysis chamber (Pierce Microsystems, Rockford, IL) into the
storage buffer (25 mM sodium acetate, pH 6.5, 25 mM NaCl, 0.1 mM ZnCl2, 0.1 mM BME,
deoxygenated by sparging with nitrogen for 15 min), and stored at 4 °C. Concentration was
9 Materials and Methods ______________________________________________________________________________________________________
134
determined by measuring absorption using an extinction coefficient of 6.41 mM-1cm-1 at
280 nm.
9.5 Oligonucleotide Preparations
9.5.1 RNA Transcription and Purification
All unlabeled RNA hairpins (except DIS junction mutants) were synthesized by in vitro T7
polymerase run-off transcription using synthetic DNA oligonucleotide templates according to
the method of Milligan and Uhlenbeck,[192, 293] after optimizing the reaction conditions,
especially Mg2+ concentrations, in mini test reactions. DNA templates for R1inv and R2inv
were purchased from Integrated DNA Technologies (Coralville, IA). All other DNA
templates and primers were synthesized chemically on an Applied Biosystems 390
synthesizer (Perkin-Elmer, Forest City, CA) using standard phosphoramidite chemistry, and
purified by preparative-scale denaturing PAGE. Nucleoside phophoramidites and controlled
pore glass (CPG) columns were purchased from Glen Research (Sterling, VA).
In short, usually 10 ml transcription reactions were performed with reaction conditions as
follows: 40 mM Tris, pH 8.3, 5 mM DTT, 0.01 % Triton X-100, 1 mM spermidine, 5 % (w/v)
PEG-8000, 25 - 35 mM MgCl2 (optimized for each template), 200 nM annealed template
(primer and bottom strand), 4 mM each NTP (Pharmacia), 0.1 mg/ml T7 polymerase. The
reaction mixture was incubated at 37 °C for at least 8 h or overnight. The reaction was
stopped by adding the same concentration of EDTA, pH 8.0 as was Mg2+ in the reaction.
RNA was precipitated with 1/10 volume 3 M sodium acetate, pH 5.5 and 3 volumes ethanol
(200 proof) at -20 °C for at least 8 h or overnight. Precipitate was pelleted by centrifugation
and supernatant discarded. Pellet was dried in vacuo, resuspended in ddH2O and desalted by
dialysis.
2-aminopurine 2’-O-methyl riboside containing RNA oligonucleotides (R1inv-9ap, R2inv-
8ap, R2inv-3ap, DIS24GA-12ap, DIS24GA-4ap, DIS24GA(A9C)-12ap, DIS24GA(A9C)-
4ap, DIS24GA(G10C)-12ap, DIS24GA(G10C)-4ap) and unlabeled DIS junction mutants
were synthesized on an Applied Biosystems 390 synthesizer (Perkin-Elmer, Forest City, CA)
using standard phosphoramidite chemistry.[294, 295] Nucleoside phosphoramidites and CPG
columns were purchased from Glen Research (Sterling, VA). Post-synthesis base
deprotection of the RNA oligonucleotides was carried out for 3 hours at 55 °C using a 3:1
mixture (v/v) of ammonia:methanol. The RNA oligonucleotides were then dried under
9 Materials and Methods ______________________________________________________________________________________________________
135
nitrogen, resuspended in 1 M solution TBAF in THF and stirred for 24 hours at room
temperature for desilylation. Then, THF was evaporated under nitrogen, and the remaining
solution desalted by dialysis.
All RNA oligonucleotides were purified using preparative-scale denaturing PAGE and
recovered by electrophoretic elution using an electrophoresis chamber from Schleicher and
Schuell. Eluted RNA was lyophilized to dryness, resuspended in 200 µl DEPC treated ddH2O
and desalted and exchanged into standard buffer (1 mM cacodylate [pH=6.5], 25 mM NaCl)
by dialysis using a microdialysis system (Pierce Instruments, Rockford, IL). RNA
concentrations were determined by measuring the absorption at 260 nm using extinction
coefficients calculated by the biopolymer calculator of the Schepartz Laboratory at Yale
University (URL: http://paris.chem.yale.edu/extinct.html).
9.5.2 DNA Synthesis and Purification
Unlabeled and 2-AP containing DNA oligonucleotides were synthesized on an Applied
Biosystems Expedite 8909 synthesizer using standard solid phase protocols and deprotecting
the 5'-OH. Phosphoramidites and CPG columns (1 µmol, 500 or 1000 Å) were purchased
from ABI or Glen Research, synthesizer chemicals and reagents from ABI. CPG beads were
transfered to eppendorff caps, and oligonucleotides were deprotected and cleaved off the CPG
by treatment with 700 µl 25 % NH3 at 60 °C for 10 h. DNA was dried, resuspended in 300 µl
ddH2O and purified by RP-HPLC using a gradient of 0-15 % acetonitrile over 45 min. Eluted
DNA was lyophilized to dryness and resuspended in 100 µl ddH2O.
Concentration of oligodeoxynucleotides was determined by measuring their absorption at
260 nm for unlabeled oligonucleotides, A1 and A2 and at 305 nm for 2-AP containing
dinucleotides using extinction coefficients as follows:
A1: ε260 = 119.86 mM-1cm-1
A2: ε260 = 119.86 mM-1cm-1
C1: ε260 = 185.2 mM-1cm-1
C2: ε260 = 182.5 mM-1cm-1
C3: ε260 = 190.4 mM-1cm-1
C4: ε260 = 193.8 mM-1cm-1
C5: ε260 = 193.8 mM-1cm-1
C6: ε260 = 197.1 mM-1cm-1
9 Materials and Methods ______________________________________________________________________________________________________
136
dinucleotides ApX (with X = A, T, C, G, or I): ε305 = 7.2 mM-1cm-1[45]. Extinction coefficients
for A1, A2, and C1 through C6 were calculated using pairwise extinction coefficients as
described in Puglisi and Tinoco.[296]
9.5.3 5-(1-pyrenylethynyl)-2'-deoxyuridine Containing DNA: Synthesis and Purification
DNA oligonucleotides containing 5-(1-pyrenylethynyl)-2'-deoxyuridine (Py-≡-dU) were
synthesized analogous to the protocol of Khan and Grinstaff,[285] where the ethynylpyrene
moiety is attached off the synthesizer to a 2'-deoxy-5-iodouridine (5-I-dU), incorporated into
a chemically synthesized DNA oligonucleotide, by a Pd(0) Sonogashira cross-coupling
reaction.
All solid-phase syntheses were performed on a commercial ABI Expedite 8909 synthesizer
using standard automated DNA synthesis protocols (1 µmol). Phosphoramidites and CPGs
were purchased from Glen Research, all other synthesizer chemicals from ABI. In detail,
solid-phase synthesis was performed in such a manner that the sequence was stopped after the
incorporation of 5'-DMT-3'-cyanoethyl-N,N'-diisopropyl phosphoramidite-2'-deoxy-5-
iodouridine (5-I-dU), without deprotecting the 5'-hydroxyl or cleaving the oligonucleotide
from the resin. The column was subsequently removed from the synthesizer and dried in
vacuo. Then the column was attached to a syringe and the reaction solution consisting of
60 µmol ethynylpyrene, 30 µmol Pd(Ph3P)4 and 30 µmol CuI in 0.5 ml dry DMF:TEA
(3.5:1.5) was injected into the column and into another syringe, attached to the other end of
the column. The reaction solution was moved back and forth between the two syringes
through the column several times to ensure even distribution of reaction solution. After a
coupling time of three hours at R. T., the reaction solution was discarded, the column washed
with 10 ml DMF:TEA (9:1) and 40 ml dry acetonitrile, dried in vacuo, and reinstalled on the
synthesizer. Solid-phase synthesis was resumed, and additional DNA bases were added.
Deprotection, cleavage from resin and purification by HPLC was performed as described
above, but the gradient for HPLC purification was run from 0-30 % acetonitrile in 45 min.
Concentrations of oligodeoxynucleotides containing Py-≡-dU were determined by measuring
their absorption at 260 nm using the following extinction coefficients:
P1: ε260 = 219.3 mM-1cm-1
P2: ε260 = 212.6 mM-1cm-1
P3: ε260 = 204.7 mM-1cm-1
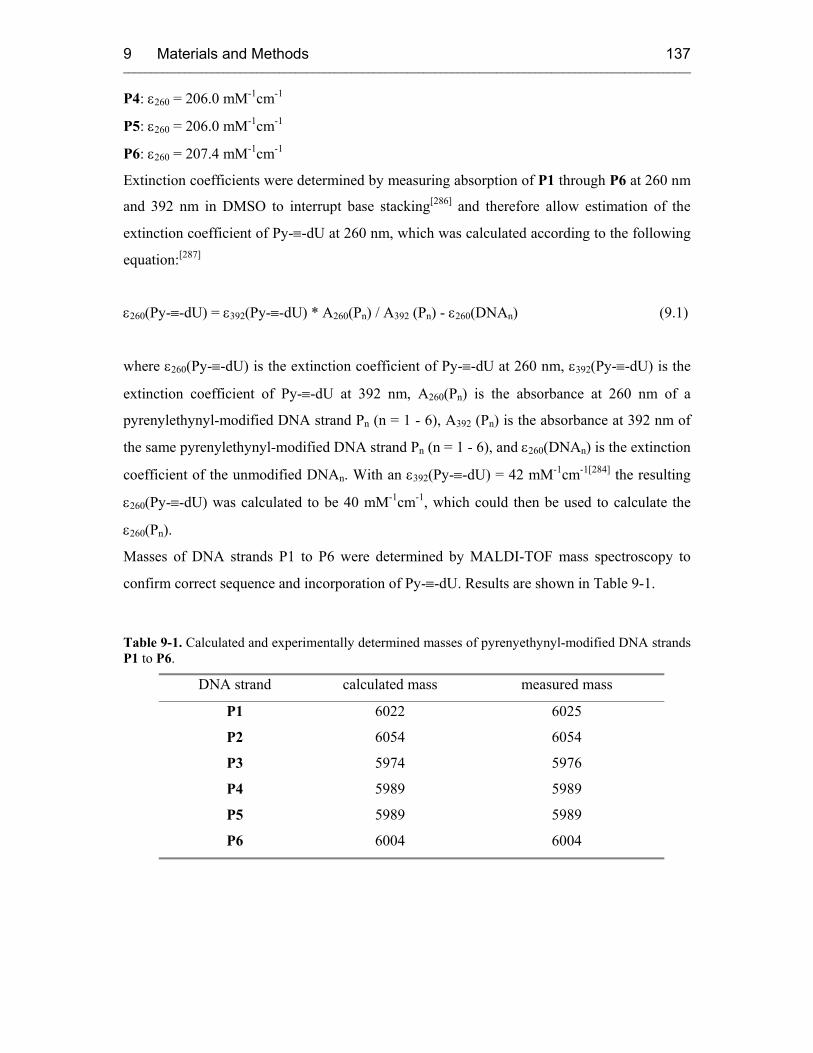
9 Materials and Methods ______________________________________________________________________________________________________
137
P4: ε260 = 206.0 mM-1cm-1
P5: ε260 = 206.0 mM-1cm-1
P6: ε260 = 207.4 mM-1cm-1
Extinction coefficients were determined by measuring absorption of P1 through P6 at 260 nm
and 392 nm in DMSO to interrupt base stacking[286] and therefore allow estimation of the
extinction coefficient of Py-≡-dU at 260 nm, which was calculated according to the following
equation:[287]
ε260(Py-≡-dU) = ε392(Py-≡-dU) * A260(Pn) / A392 (Pn) - ε260(DNAn) (9.1)
where ε260(Py-≡-dU) is the extinction coefficient of Py-≡-dU at 260 nm, ε392(Py-≡-dU) is the
extinction coefficient of Py-≡-dU at 392 nm, A260(Pn) is the absorbance at 260 nm of a
pyrenylethynyl-modified DNA strand Pn (n = 1 - 6), A392 (Pn) is the absorbance at 392 nm of
the same pyrenylethynyl-modified DNA strand Pn (n = 1 - 6), and ε260(DNAn) is the extinction
coefficient of the unmodified DNAn. With an ε392(Py-≡-dU) = 42 mM-1cm-1[284] the resulting
ε260(Py-≡-dU) was calculated to be 40 mM-1cm-1, which could then be used to calculate the
ε260(Pn).
Masses of DNA strands P1 to P6 were determined by MALDI-TOF mass spectroscopy to
confirm correct sequence and incorporation of Py-≡-dU. Results are shown in Table 9-1.
Table 9-1. Calculated and experimentally determined masses of pyrenyethynyl-modified DNA strands P1 to P6.
DNA strand calculated mass measured mass
P1 6022 6025
P2 6054 6054
P3 5974 5976
P4 5989 5989
P5 5989 5989
P6 6004 6004

9 Materials and Methods ______________________________________________________________________________________________________
138
9.6 Fluorescence Experiments
9.6.1 Fluorescence Experiments on RNA
• ColE1 samples R1inv and R2inv
Steady State Fluorescence Measurements of RNA Loop-Loop Complex Formation and Rom
Binding. The fluorescence of RNA oligonucleotide samples selectively labeled with 2-
aminopurine was measured at 25 °C on a SPEX Fluoromax-2 spectrofluorometer (Instruments
SA, Edison, NJ) using a 0.3 cm square cuvette in 150 µl of standard buffer solution (25 mM
NaCl and 1 mM cacodylate [pH 6.5]) with 5 mM MgCl2 added. Emission spectra were
recorded over the wavelength range of 330 to 450 nm with an excitation wavelength of
310 nm. The spectral band pass was 5 nm for spectra collected at 100 nM RNA
concentrations and 7 nm for spectra collected at 25 nM RNA concentration.
The equilibrium dissociation constant for RNA loop-loop kissing formation was determined
by following the decrease in fluorescence (F) at 371 nm as a fixed concentration (25 or
100 nM) of the fluorescent RNA hairpin was titrated with increasing amounts of its unlabeled
complement. Approximately 10 points were recorded for every titration experiment in a range
from zero to twice the starting concentration of the labeled hairpin. The RNA-RNA binding in
each case was fitted using a single site equilibrium binding equation:
(9.2) F } )ap]-[R4[R](b-}{bap]-[R * }/2F{{FF 0tottot2
totf0 +−−−=
b = Kd + [R]tot + [R-ap]tot
where Fo and Ff are the initial and final fluorescence intensities, respectively, [R-ap]tot is the
total concentration of the 2-AP labeled RNA hairpin, and [R]tot is the total concentration of
the unlabeled complementary RNA hairpin.
To determine apparent binding constants for divalent metal ions binding to the RNA inverted
loop-loop complex the decrease in fluorescence at 371 nm was monitored as a fixed
concentration of R1inv-9ap and R2inv, mixed in 1:1 stoichiometry in standard buffer, was
titrated with increasing amounts of the divalent metal ion. Metal binding, which induces RNA
complex formation, was monitored indirectly by measuring 2-AP quenching associated with
RNA loop-loop complex formation and fit using equation 9.3, which describes a single class
of metal binding site(s).
9 Materials and Methods ______________________________________________________________________________________________________
139
(9.3) F } )9ap]-[R1inv]4[M(b-}{b9ap]-[R1inv*}/2F{F{F 0tottot22
totf0 +−−−= +
b = Kapp + [M2+]tot + [R1inv-9ap]tot
where Fo and Ff are the initial and final fluorescence intensities, respectively, [R1inv-9ap]tot is
the total R1inv-9ap concentration, which represents the total RNA complex concentration,
and [M2+]tot is the total concentration of divalent metal ion.
The dissociation of the loop-loop complex was measured at 25 and 35 °C by following the
increase in 2-AP fluorescence of either R2inv-8ap • R1inv or R1inv-9ap• R2inv as the RNA
complex dissociates. The reaction was carried out in standard buffer solution with 5 mM
MgCl2 and made irreversible by trapping either the free R1inv or R2inv, respectively, with a
20-fold excess of unlabeled complementary RNA hairpin added manually, thereby preventing
rebinding of the dissociated hairpin to the 2-AP labeled complement. The time course was
fitted using first order rate, Ft = F1[1-exp(–k1 t)] + C, where k1 is the observed off-rate for the
complex.
The equilibrium dissociation constant KD for Rom binding to the R1inv•R2inv loop-loop
complex was determined by following the decrease in fluorescence at 371 nm as a fixed
concentration of R1inv-9ap and R2inv, mixed in 1:1 stoichiometry in standard buffer
containing 30 mM SrCl2, was titrated with Rom. At this concentration of SrCl2, 100 % RNA
loop-loop complex was observed so that the binding data could be fitted using a single-site
binding mode for Rom according to equation 9.4:
(9.4) F } )9ap]-R1[R24[Rom](b-}{b9ap]-R1[R2*}/2F{F{F 0tottot2
totf0 +•−•−−=
b = Kd + [Rom]tot + [R2• R1-9ap]tot
where Fo and Ff are the initial and final fluorescence intensities, respectively, [R2• R1-9ap]tot
is the total R2inv• R1inv-9ap concentration, and [Rom]tot is the total concentration of Rom
protein.
Rom contains no tryptophan residues, therefore no correction had to be applied to remove a
fluorescence contribution from the protein.
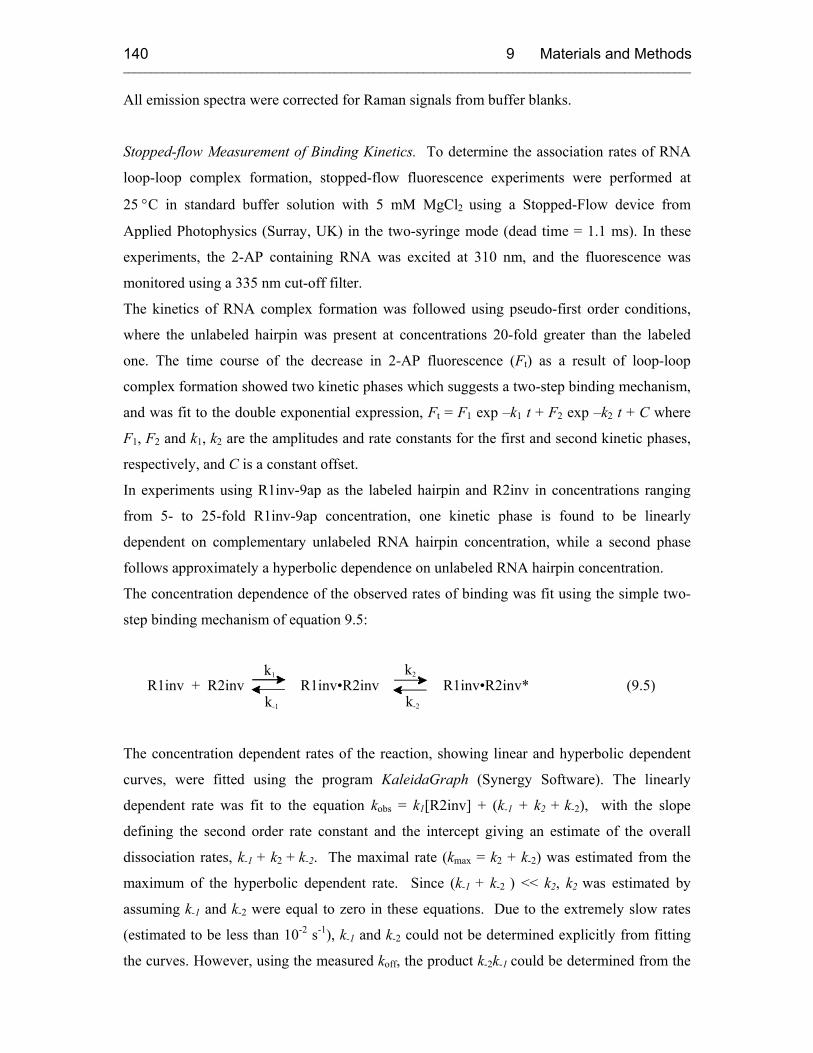
9 Materials and Methods ______________________________________________________________________________________________________
140
All emission spectra were corrected for Raman signals from buffer blanks.
Stopped-flow Measurement of Binding Kinetics. To determine the association rates of RNA
loop-loop complex formation, stopped-flow fluorescence experiments were performed at
25 °C in standard buffer solution with 5 mM MgCl2 using a Stopped-Flow device from
Applied Photophysics (Surray, UK) in the two-syringe mode (dead time = 1.1 ms). In these
experiments, the 2-AP containing RNA was excited at 310 nm, and the fluorescence was
monitored using a 335 nm cut-off filter.
The kinetics of RNA complex formation was followed using pseudo-first order conditions,
where the unlabeled hairpin was present at concentrations 20-fold greater than the labeled
one. The time course of the decrease in 2-AP fluorescence (Ft) as a result of loop-loop
complex formation showed two kinetic phases which suggests a two-step binding mechanism,
and was fit to the double exponential expression, Ft = F1 exp –k1 t + F2 exp –k2 t + C where
F1, F2 and k1, k2 are the amplitudes and rate constants for the first and second kinetic phases,
respectively, and C is a constant offset.
In experiments using R1inv-9ap as the labeled hairpin and R2inv in concentrations ranging
from 5- to 25-fold R1inv-9ap concentration, one kinetic phase is found to be linearly
dependent on complementary unlabeled RNA hairpin concentration, while a second phase
follows approximately a hyperbolic dependence on unlabeled RNA hairpin concentration.
The concentration dependence of the observed rates of binding was fit using the simple two-
step binding mechanism of equation 9.5:
R1inv + R2inv R1inv•R2inv R1inv•R2inv* (9.5)
k 1
k -1
k2
k-2
The concentration dependent rates of the reaction, showing linear and hyperbolic dependent
curves, were fitted using the program KaleidaGraph (Synergy Software). The linearly
dependent rate was fit to the equation kobs = k1[R2inv] + (k-1 + k2 + k-2), with the slope
defining the second order rate constant and the intercept giving an estimate of the overall
dissociation rates, k-1 + k2 + k-2. The maximal rate (kmax = k2 + k-2) was estimated from the
maximum of the hyperbolic dependent rate. Since (k-1 + k-2 ) << k2, k2 was estimated by
assuming k-1 and k-2 were equal to zero in these equations. Due to the extremely slow rates
(estimated to be less than 10-2 s-1), k-1 and k-2 could not be determined explicitly from fitting
the curves. However, using the measured koff, the product k-2k-1 could be determined from the
9 Materials and Methods ______________________________________________________________________________________________________
141
simplified equation (k-2k-1)/k2 and the equilibrium constant KDcalc was calculated using k2, k1
and k-2k-1.
• HIV-1 DIS samples
Steady State Fluorescence Measurements of DIS Kissing Dimer Formation and Binding by
NCp7. The fluorescence emission spectra of RNA oligonucleotide samples (100 nM)
selectively labeled with 2-AP were measured at 25 °C on a SPEX Fluoromax-2
spectrofluorometer (Instruments SA, Edison, NJ) using a 0.3 cm square cuvette in 150 µl of
standard buffer solution with 5 mM MgCl2. Emission spectra were recorded over the
wavelength range of 330 to 450 nm with an excitation wavelength of 310 nm and a spectral
band pass of 5 nm.
The equilibrium binding constant (KD) for DIS loop-loop kissing dimer formation was
determined by following the decrease in fluorescence at 371 nm as a fixed concentration of
the fluorescent DIS24(GA)-12ap was titrated with increasing amounts of either the
DIS24(UC) or DIS23(HxUC) complement. The RNA-RNA binding in each case was fit using
the single site equilibrium binding equation.
0tottot2
totf0 F } )[DIS(GA)]4[DIS(UC)](b-}{b[DIS(GA)]*}/2F{{FF +−−−= (9.6)
b = Kd + [ DIS(UC)]tot + [ DIS(GA)]tot
where Fo and Ff are the initial and final fluorescence intensities, respectively, [DIS(GA)]tot is
the total DIS24(GA)-12ap concentration, and [DIS(UC)]tot is the total concentration of
DIS24(UC) or DIS24(HxUC).
The KDs of the junction mutant samples (Figure 4-15) were measured and fit accordingly.
The dissociation kinetics of the DIS loop-loop kissing dimer was measured by following the
increase in 2-AP fluorescence of DIS24(GA)-12ap as the DIS24(GA)-12ap•DIS23(HxUC)
complex dissociates. The reaction was carried out at 35 °C using a DIS kissing dimer
concentration of 100 nM, in standard buffer solution with 5 mM MgCl2 and made irreversible
by trapping the free DIS23(HxUC) with a 20-fold excess of unlabeled DIS24(GA) stem-loop
added manually. For dissociation experiments carried out in the presence of NCp7, the
DIS24(GA)-12ap•DIS23(HxUC) kissing dimer was preincubated with 500 nM protein. The
time course of the dissociation of the DIS kissing dimer was fit using first order rate, Ft =
F1[1-exp(–k1 t)] + C, where F1 and k1 is the observed amplitude and off-rate, respectively, for
the complex, and C is a constant offset.
9 Materials and Methods ______________________________________________________________________________________________________
142
The kinetics of RNA-RNA association was followed at 25 °C in standard buffer solution with
5 mM MgCl2 using pseudo-first order conditions, where DIS23(HxUC) was present at
concentrations of 20-fold greater than the DIS24(GA)-12ap. A DIS24(GA)-12ap
concentration of 100 nM was used. For association experiments carried out in the presence of
NCp7, the DIS23(HxUC) was preincubated with 500 nM protein and the two macromolecules
were mixed simultaneously with DIS24(GA)-12ap. The time course of the decrease in 2-AP
fluorescence (Ft) as a result of loop-loop complex formation was fit using an exponential
expression, Ft = F1 exp(–k1 t) + C where F1 and k1 are the amplitude and apparent on-rate,
respectively, for the complex and C is a constant offset.
To determine apparent binding constants for several mono- and divalent metal ions binding to
the RNA inverted loop-loop complex the decrease in fluorescence at 371 nm was monitored
as a fixed concentration of DIS24GA-12ap and DIS23HxUC, mixed in 1:1 stoichiometry in
standard buffer, was titrated with increasing amounts of the mono- or divalent metal ions.
Metal binding, which induces RNA complex formation, was monitored indirectly by
measuring 2-AP quenching associated with RNA loop-loop complex formation and fit using
equation 9.7, which describes a single class of metal binding site(s).
(9.7) F } )12ap]-[DIS244[Me](b-}{b12ap]-[DISGA*}/2F{F{F 0tottot2
totf0 +−−−=
b = Kapp + [Me]tot + [DIS24-12ap]tot
where Fo and Ff are the initial and final fluorescence intensities, respectively, [DIS24-12ap]tot
is the total DIS24GA-12ap concentration, which represents the total RNA complex
concentration, and [Me]tot is the total concentration of mono- or divalent metal ion.
Binding of NCp7 to the DIS kissing dimer was followed by monitoring the quenching of
tryptophan (Trp) fluorescence emission as a fixed concentration (250 or 500 nM) of NCp7
was titrated with increasing amounts of DIS kissing dimers, preformed in standard buffer with
5 mM MgCl2. Trp fluorescence was measured at 25 °C on the SPEX Fluromax-2 using a
0.3 cm square cuvette in 150 µl standard buffer with 5 mM MgCl2 and 0.4 % (w/v) freshly
prepared PEG-20,000 added. Emission spectra were recorded over the wavelength range of
310 to 450 nm with an excitation wavelength of 295 nm and a spectral band pass of 5 nm.
NCp7 binding was fit using equation 9.8, assuming two equivalent sites for NCp7 on the DIS
kissing dimer as follows:
9 Materials and Methods ______________________________________________________________________________________________________
143
(9.8) F } )Kiss] DIS*[2] 4[NCp7(b-}{bKiss] DIS*[2*}/2F{F{F 0tottot2
totf0 +−−−=
b = Kd + [NCp7]tot + [2* Kiss) DIS ]tot
where Fo and Ff are the initial and final fluorescence intensities, respectively, [DIS Kiss]tot is
the total DIS(AG)•DIS(UC) complex concentration, and [NCp7]tot is the total concentration of
NCp7 protein.
All emission spectra were corrected for Raman signals from buffer blanks.
Kinetic Measurement of NCp7 Catalyzed Structural Isomerization of the DIS dimer.
Structural isomerization of DIS dimers was measured at 25 or 35 °C using the SPEX
Fluoromax-2 spectrofluorometer by following the decrease in 2-AP fluorescence emission as
a 1:1 mixture of DIS24(GA)-4ap and DIS24(UC) in standard buffer or a preformed
DIS24(GA)-4ap•DIS24(UC) kissing complex in standard buffer containing 5 mM MgCl2 is
converted to the extended duplex by adding different concentrations of NCp7 or other
'conversion agents' like NaCl, denatured NCp7, or Rev peptide. To measure the conversion
rates in the presence of short antisense oligodeoxynucleotides, 100 nM DIS24(GA)-4ap were
mixed with 1 µM DNA oligo nucleotide in standard buffer with 5 mM MgCl2. After adding a
mixture of 100 nM DIS24(UC) and 250 nM NCp7 in standard buffer with 5 mM MgCl2, the
decrease in fluorescence was monitored. Conversion of junction mutants was measured by
adding 250 nM NCp7 to a preformed kissing complex between a stem-labeled RNA hairpin
with either the (A1C) or (G2C) mutation and complemenraty unlabeled hairpins with the
corresponding mutations. The time course of the fluorescence decrease (Ft) as a result of
extended duplex formation was fit using an exponential expression, Ft = F1 exp(–k1 t) + C
where F1 and k1 are the amplitude and conversion rate, respectively, for the complex and C is
a constant offset.
All emission spectra were corrected for Raman signals from buffer blanks.
Error Analysis. The reported errors are the standard uncertainties of the data from the best-fit
theoretical curves. This method assumes that the standard uncertainty of the measurement is
approximated by the standard deviation of the points from the fitted curve.[297]
9 Materials and Methods ______________________________________________________________________________________________________
144
9.6.2 Fluorescence Experiments on DNA
The fluorescence of DNA oligonucleotide samples was measured at 25 °C on a SPEX
Fluoromax-3 spectrofluorometer (Instruments SA, Edison, NJ) using a 1 cm path length
quartz cuvette in 1 or 2 ml of standard buffer solution (10 mM Na-Pi, pH 7.0) with or without
250 mM NaCl added.
Emission spectra of excimer samples labeled with 2-AP were measured in 1 ml standard
buffer at a duplex concentration of 12.5 µM with excitation wavelengths varying from 310 to
350 nm recording emission over wavelength ranges varying from 330 to 600 nm to 360 to
600 nm accordingly. The spectral band pass was 2 nm. Excitation spectra were recorded on
the same samples with emission wavelengths varying from 330 to 470 nm and excitation
wavelength ranges varying from 250 to 320 nm to 250 to 440 nm, accordingly.
For dinucleotide samples containing 2-AP emission spectra were recorded in 2 ml standard
buffer at a DNA concentration of 10 µM over the wavelength range of 330 to 500 nm with an
excitation wavelength of 310 or 320 nm with a spectral bandpass of 2 nm. Excitation spectra
on the same samples were recorded with an emission wavelength of 370 nm and an excitation
wavelength range of 220 to 350 nm.
The fluorescence of single stranded DNA oligonucleotide samples containing Py-≡-dU was
measured on the Fluoromax-3 spectrofluorometer in standard buffer using samples with the
same optical density of approximately 0.02 at the excitation wavelength 402 nm, recording
emission from 420 to 700 nm, and in DMSO using samples with the same optical density of
0.04 at the excitation wavelength of 398 nm, recording emission from 415 to 500 nm. The
spectral bandpass in all experiments was 2 nm. Fluorescence of 2.5 µM duplex DNA was
measured in 10 mM Na-Pi, pH 7.0 with an excitation wavelength of 378 or 402 nm and an
emission wavelength range of 400 to 700 nm or 420 to 700 nm, respectively, with a spectral
band pass of 2 nm.
All excitation spectra were corrected for the excitation correction file included in the
instrument software to correct for lamp fluctuations.
All emission spectra were corrected for Raman signals of buffer blanks.
10 Literature ______________________________________________________________________________________________________
145
10 Literature
[1] E. Ennifar, M. Yusupov, P. Walter, R. Marquet, B. Ehresmann, C. Ehresmann, P.
Dumas, Structure with Folding & Design 1999, 7, 1439.
[2] N. Amann, E. Pandurski, T. Fiebig, H. A. Wagenknecht, Chemistry-a European
Journal 2002, 8, 4877.
[3] J. R. Lakowicz, Principles of Fluorescence Spectroscopy, Kluwer Academic/Plenum,
New York, 1999.
[4] A. Sharma, R. G. Shulman, Introduction to Fluorescence Spectroscopy, John Wiley
and Sons, Inc., New York, NY, 1999.
[5] G. J. Kavarnos, Fundamentals of Photoinduced Electron Transfer, VCH, New York,
NY, 1993.
[6] IUPAC Comission on Photochemistry, Pure and Applied Chemistry 1996, 68,
2223/2286.
[7] G. G. Stokes, Philosophical Transactions of the Royal Society of London 1852, 142,
463.
[8] M. Kasha, Discussions of the Faraday Society 1950, 9, 14.
[9] R. I. Cukier, D. G. Nocera, Annual Review of Physical Chemistry 1998, 49, 337.
[10] C. Tommos, G. T. Babcock, Accounts of Chemical Research 1998, 31, 18.
[11] M. Y. Okamura, G. Feher, Anoxygenic Photosynthetic Bacteria, Kluver, Dordrecht,
1995.
[12] S. Ferguson-Miller, G. T. Babcock, Chemical Reviews 1996, 96, 2889.
[13] V. Y. Shafirovich, S. H. Courtney, N. Q. Ya, N. E. Geacintov, Journal of the
American Chemical Society 1995, 117, 4920.
[14] M. J. Rist, J. P. Marino, Current Organic Chemistry 2002, 6, 775.
[15] T. Förster, Ann. Phys. (Leipzig) 1948, 55.
[16] L. Stryer, Annu. Rev. Biochem. 1978, 47, 819.
[17] P. Vigny, Comptes Rendus Hebdomadaires Des Seances De L Academie Des Sciences
Serie D 1971, 272, 3206.
[18] D. Voet, W. B. Gratzer, R. A. Cox, P. Doty, Biopolymers 1963, 1, 193.
[19] D. N. Nikogosyan, D. Angelov, B. Soep, L. Lindqvist, Chemical Physics Letters 1996,
252, 322.
10 Literature ______________________________________________________________________________________________________
146
[20] T. Haupl, C. Windolph, T. Jochum, O. Brede, R. Hermann, Chemical Physics Letters
1997, 280, 520.
[21] L. Alaverdian, S. Alaverdian, O. Bilenko, I. Bogdanov, E. Filippova, D. Gavrilov, B.
Gorbovitski, M. Gouzman, G. Gudkov, S. Domratchev, O. Kosobokova, N. Lifshitz,
S. Luryi, V. Ruskovoloshin, A. Stepoukhovitch, M. Tcherevishnick, G. Tyshko, V.
Gorfinkel, Electrophoresis 2002, 23, 2804.
[22] G. Xue, E. S. Yeung, Electrophoresis 2002, 23, 1490.
[23] C. Lee, E. Lemyre, P. M. Miron, C. C. Morton, Current Opinion in Pediatrics 2001,
13, 550.
[24] C. Fauth, M. R. Speicher, Cytogenetics and Cell Genetics 2001, 93, 1.
[25] R. Amann, B. M. Fuchs, S. Behrens, Curr. Opin. Biotech. 2001, 12, 231.
[26] J. Pernthaler, F. O. Glockner, W. Schonhuber, R. Amann, Methods in Microbiology
2001, 30, 207.
[27] E. A. Mothershed, P. K. Cassiday, K. Pierson, L. W. Mayer, T. Popovic, Journal of
Clinical Microbiology 2002, 40, 4713.
[28] N. Li, W. G. Tan, R. Y. Tsang, D. L. J. Tyrrell, N. J. Dovichi, Analytical and
Bioanalytical Chemistry 2002, 374, 269.
[29] A. E. Remmers, R. R. Neubig, Journal of Biological Chemistry 1996, 271, 4791.
[30] Y. P. Jia, S. S. Patel, Journal of Biological Chemistry 1997, 272, 30147.
[31] M. R. Otto, L. B. Bloom, M. F. Goodman, J. M. Beechem, Biochemistry 1998, 37,
10156.
[32] R. P. Bandwar, S. S. Patel, Journal of Biological Chemistry 2001, 276, 14075.
[33] J. T. Stivers, K. W. Pankiewicz, K. A. Watanabe, Biochemistry 1999, 38, 952.
[34] B. W. Allan, J. M. Beechem, W. M. Lindstrom, N. O. Reich, Journal of Biological
Chemistry 1998, 273, 2368.
[35] B. W. Allan, N. O. Reich, J. M. Beechem, Biochemistry 1999, 38, 5308.
[36] J. J. Sullivan, K. P. Bjornson, L. C. Sowers, P. L. deHaseth, Biochemistry 1997, 36,
8005.
[37] Y. P. Jia, A. Kumar, S. S. Patel, Journal of Biological Chemistry 1996, 271, 30451.
[38] K. P. Bjornson, K. J. M. Moore, T. M. Lohman, Biochemistry 1996, 35, 2268.
[39] D. Klostermeier, D. P. Millar, Methods 2001, 23, 240.
[40] S. R. Kirk, N. W. Luedtke, Y. Tor, Bioorganic & Medicinal Chemistry 2001, 9, 2295.
[41] F. Walter, A. I. H. Murchie, J. B. Thomson, D. M. J. Lilley, Biochemistry 1998, 37,
14195.
10 Literature ______________________________________________________________________________________________________
147
[42] P. Z. F. Qin, A. M. Pyle, Biochemistry 1997, 36, 4718.
[43] G. S. Bassi, N. E. Mollegaard, A. I. H. Murchie, D. M. J. Lilley, Biochemistry 1999,
38, 3345.
[44] D. G. Xu, T. M. Nordlund, Biophysical Journal 2000, 78, 1042.
[45] M. Kawai, M. J. Lee, K. O. Evans, T. M. Nordlund, Journal of Fluorescence 2001, 11,
23.
[46] C. Z. Wan, T. Fiebig, O. Schiemann, J. K. Barton, A. H. Zewail, Proceedings of the
National Academy of Sciences of the United States of America 2000, 97, 14052.
[47] T. Fiebig, C. Z. Wan, A. H. Zewail, Chemphyschem 2002, 3, 781.
[48] M. A. O'Neill, J. K. Barton, Journal of the American Chemical Society 2002, 124,
13053.
[49] D. C. Ward, E. Reich, L. Stryer, J. Biol. Chem. 1969, 244, 1228.
[50] J. A. Secrist, e. al., Biochemistry 1972, 11, 3499.
[51] J. A. Secrist, J. R. Barrio, N. J. Leonard, Science 1972, 175, 646.
[52] M. E. Hawkins, W. Pfleiderer, F. M. Balis, D. Porter, J. R. Knutson, Analytical
Biochemistry 1997, 244, 86.
[53] M. E. Hawkins, W. Pfleiderer, O. Jungmann, F. M. Balis, Anal. Biochem. 2001, 298,
231.
[54] M. E. Hawkins, W. Pfleiderer, A. Mazumder, Y. G. Pommier, F. M. Falls, Nucleic
Acids Research 1995, 23, 2872.
[55] R. X. F. Ren, N. C. Chaudhuri, P. L. Paris, S. Rumney, E. T. Kool, Journal of the
American Chemical Society 1996, 118, 7671.
[56] C. Strassler, N. E. Davis, E. T. Kool, Helv. Chim. Act. 1999, 82, 2160.
[57] F. Godde, J. J. Toulme, S. Moreau, Biochemistry 1998, 37, 13765.
[58] F. Godde, Antisense & Nucleic Acid Drug Development 1998, 8, 469.
[59] F. Godde, J. J. Toulme, S. Moreau, Nucl. Acids Res. 2000, 28, 2977.
[60] L. M. Wilhelmsson, A. Holmen, P. Lincoln, P. E. Nielson, B. Norden, Journal of the
American Chemical Society 2001, 123, 2434.
[61] P. Rao, S. A. Benner, J. Org. Chem. 2001, 66, 5012.
[62] A. Broo, Journal of Physical Chemistry A 1998, 102, 526.
[63] D. P. Millar, Current Opinion in Structural Biology 1996, 6, 322.
[64] L. C. Sowers, G. V. Fazakerley, R. Eritja, B. E. Kaplan, M. F. Goodman, Proc. Natl.
Acad. Sci. USA 1986, 83, 5434.
10 Literature ______________________________________________________________________________________________________
148
[65] L. C. Sowers, B. R. Shaw, M. L. Veigl, W. D. Sedwick, Mutation Research 1987, 177,
201.
[66] L. C. Sowers, Y. Boulard, G. V. Fazakerley, Biochemistry 2000, 39, 7613.
[67] T. M. Nordlund, M. Kawai, M. J. Lee, K. O. Evans, Biophys. J. 2000, 78, 1822Pos.
[68] J. M. Jean, K. B. Hall, Proceedings of the National Academy of Sciences of the United
States of America 2001, 98, 37.
[69] E. L. Rachofsky, R. Osman, J. B. A. Ross, Biochemistry 2001, 40, 946.
[70] E. L. Rachofsky, J. B. A. Ross, M. Krauss, R. Osman, Journal of Physical Chemistry
A 2001, 105, 190.
[71] S. S. Sastry, B. M. Ross, Biochemistry 1996, 35, 15715.
[72] M. Menger, T. Tuschl, F. Eckstein, D. Porschke, Biochemistry 1996, 35, 14710.
[73] A. Ujvari, C. T. Martin, Biochemistry 1996, 35, 14574.
[74] J. T. Stivers, Nucleic Acids Research 1998, 26, 3837.
[75] M. J. Rist, J. P. Marino, Nucleic Acids Research 2001, 29, 2401.
[76] K. A. Lacourciere, J. T. Stivers, J. P. Marino, Biochemistry 2000, 39, 5630.
[77] J. M. Beechem, M. R. Otto, L. B. Bloom, R. Eritja, L. J. Reha-Krantz, M. F.
Goodman, Biochemistry 1998, 37, 10144.
[78] Y. V. R. Reddy, D. N. Rao, Journal of Molecular Biology 2000, 298, 597.
[79] B. Mennucci, A. Toniolo, J. Tomasi, Journal of Physical Chemistry A 2001, 105,
4749.
[80] J. M. Jean, K. B. Hall, Journal of Physical Chemistry A 2000, 104, 1930.
[81] A. Holmen, B. Norden, B. Albinsson, Journal of the American Chemical Society 1997,
119, 3114.
[82] A. Holmen, A. Broo, B. Albinsson, B. Norden, Journal of the American Chemical
Society 1997, 119, 12240.
[83] A. D. Malakhov, E. V. Malakhova, S. V. Kuznitsova, I. V. Grechishnikova, I. A.
Prokhorenko, M. V. Skorobogatyi, V. A. Korshun, Y. A. Berlin, Bioorganicheskaya
Khimiya 2000, 26, 39.
[84] A. Demesmaeker, R. Haner, P. Martin, H. E. Moser, Accounts of Chemical Research
1995, 28, 366.
[85] S. M. Freier, K. H. Altmann, Nucleic Acids Research 1997, 25, 4429.
[86] D. P. Weicherding, Dissertation thesis, (München), 2000.
[87] H. M. Weintraub, Scientific American 1990, 262, 40.
[88] P. J. Green, O. Pines, M. Inouye, Annual Review of Biochemistry 1986, 55, 569.
10 Literature ______________________________________________________________________________________________________
149
[89] K. Nordstrom, S. Molin, J. Light, Plasmid 1984, 12, 71.
[90] K. Nordstrom, E. G. H. Wagner, Trends in Biochemical Sciences 1994, 19, 294.
[91] C. Hélène, J. J. Toulme, Oligodeoxynucleotides: Antisense Inhibitors of Gene
Expression, McMillan Press, London, 1989.
[92] P. O'neill, E. M. Fielden, Advances in Radiation Biology, Vol 17 1993, 17, 53.
[93] D. Wang, D. A. Kreutzer, J. M. Essigmann, Mutation Research-Fundamental and
Molecular Mechanisms of Mutagenesis 1998, 400, 99.
[94] J. H. J. Hoeijmakers, Nature 2001, 411, 366.
[95] M. W. Grinstaff, Angewandte Chemie-International Edition 1999, 38, 3629.
[96] M. Gueron, R. G. Shulman, J. Eisinger, Proceedings of the National Academy of
Sciences of the United States of America 1966, 56, 814.
[97] J. Eisinger, M. Gueron, R. G. Shulman, T. Yamane, Proceedings of the National
Academy of Sciences of the United States of America 1966, 55, 1015.
[98] T. M. Garestie, C. Helene, Michelso.Am, Biochimica Et Biophysica Acta 1969, 182,
342.
[99] J. P. Morgan, M. Daniels, Photochemistry and Photobiology 1980, 31, 207.
[100] S. Georghiou, S. Zhu, R. Weidner, C. R. Huang, G. Ge, Journal of Biomolecular
Structure & Dynamics 1990, 8, 657.
[101] S. Georghiou, S. M. Kubala, C. C. Large, Photochemistry and Photobiology 1998, 67,
526.
[102] P. T. Henderson, E. Boone, G. B. Schuster, Helvetica Chimica Acta 2002, 85, 135.
[103] B. Bouvier, T. Gustavsson, D. Markovitsi, P. Millie, Chemical Physics 2002, 275, 75.
[104] J. M. L. Pecourt, J. Peon, B. Kohler, Journal of the American Chemical Society 2001,
123, 5166.
[105] J. M. Pecourt, B. Kohler, Abstracts of Papers of the American Chemical Society 2000,
220, 148.
[106] J. M. L. Pecourt, J. Peon, B. Kohler, Journal of the American Chemical Society 2000,
122, 9348.
[107] A. Reuther, H. Iglev, R. Laenen, A. Laubereau, Chemical Physics Letters 2000, 325,
360.
[108] J. D. Watson, F. H. C. Crick, Nature 1953, 171, 737.
[109] D. D. Eley, D. I. Spivey, Transactions of the Faraday Society 1962, 58, 411.
[110] Y. A. Berlin, A. L. Burin, M. A. Ratner, Superlattices and Microstructures 2000, 28,
241.
10 Literature ______________________________________________________________________________________________________
150
[111] S. Priyadarshy, S. M. Risser, D. N. Beratan, Journal of Physical Chemistry 1996, 100,
17678.
[112] B. Armitage, Chemical Reviews 1998, 98, 1171.
[113] S. O. Kelley, J. K. Barton, Metal Ions in Biological Systems, Vol 36 1999, 36, 211.
[114] C. J. Burrows, J. G. Muller, Chemical Reviews 1998, 98, 1109.
[115] E. M. Boon, J. E. Salas, J. K. Barton, Nature Biotechnology 2002, 20, 282.
[116] G. Hartwich, D. J. Caruana, T. de Lumley-Woodyear, Y. B. Wu, C. N. Campbell, A.
Heller, Journal of the American Chemical Society 1999, 121, 10803.
[117] N. M. Jackson, M. G. Hill, Current Opinion in Chemical Biology 2001, 5, 209.
[118] A. R. Pike, L. H. Lie, R. A. Eagling, L. C. Ryder, S. N. Patole, B. A. Connolly, B. R.
Horrocks, A. Houlton, Angewandte Chemie-International Edition 2002, 41, 615.
[119] F. Patolsky, Y. Weizmann, I. Willner, Journal of the American Chemical Society
2002, 124, 770.
[120] C. D. Mao, W. Q. Sun, Z. Y. Shen, N. C. Seeman, Nature 1999, 397, 144.
[121] H. W. Fink, C. Schonenberger, Nature 1999, 398, 407.
[122] C. M. Niemeyer, Angewandte Chemie-International Edition 2001, 40, 4128.
[123] D. Porath, A. Bezryadin, S. de Vries, C. Dekker, Nature 2000, 403, 635.
[124] M. Ratner, Nature 1999, 397, 480.
[125] E. K. Wilson, Chemical & Engineering News 1998, 76, 51.
[126] R. E. Holmlin, P. J. Dandliker, J. K. Barton, Angewandte Chemie-International
Edition 1997, 36, 2715.
[127] D. B. Hall, S. O. Kelley, J. K. Barton, Biochemistry 1998, 37, 15933.
[128] R. A. Marcus, N. Sutin, Biochimica Et Biophysica Acta 1985, 811, 265.
[129] B. Paulson, K. Pramod, P. Eaton, G. Closs, J. R. Miller, Journal of Physical Chemistry
1993, 97, 13042.
[130] M. R. Wasielewski, Chemical Reviews 1992, 92, 435.
[131] J. R. Winkler, H. B. Gray, Chemical Reviews 1992, 92, 369.
[132] M. E. Nunez, J. K. Barton, Current Opinion in Chemical Biology 2000, 4, 199.
[133] S. Steenken, S. V. Jovanovic, Journal of the American Chemical Society 1997, 119,
617.
[134] C. A. M. Seidel, A. Schulz, M. H. M. Sauer, Journal of Physical Chemistry 1996, 100,
5541.

10 Literature ______________________________________________________________________________________________________
151
[135] M. Bixon, B. Giese, S. Wessely, T. Langenbacher, M. E. Michel-Beyerle, J. Jortner,
Proceedings of the National Academy of Sciences of the United States of America
1999, 96, 11713.
[136] F. D. Lewis, X. Y. Liu, J. Q. Liu, S. E. Miller, R. T. Hayes, M. R. Wasielewski,
Nature 2000, 406, 51.
[137] S. Steenken, Chemical Reviews 1989, 89, 503.
[138] H. A. Wagenknecht, Chemie in Unserer Zeit 2002, 36, 318.
[139] P. Fromherz, B. Rieger, Journal of the American Chemical Society 1986, 108, 5361.
[140] A. M. Brun, A. Harriman, Journal of the American Chemical Society 1992, 114, 3656.
[141] C. J. Murphy, M. R. Arkin, Y. Jenkins, N. D. Ghatlia, S. H. Bossmann, N. J. Turro, J.
K. Barton, Science 1993, 262, 1025.
[142] T. J. Meade, J. F. Kayyem, Angewandte Chemie-International Edition in English
1995, 34, 352.
[143] F. D. Lewis, T. F. Wu, Y. F. Zhang, R. L. Letsinger, S. R. Greenfield, M. R.
Wasielewski, Science 1997, 277, 673.
[144] S. O. Kelley, R. E. Holmlin, E. D. A. Stemp, J. K. Barton, Journal of the American
Chemical Society 1997, 119, 9861.
[145] K. Fukui, K. Tanaka, Angewandte Chemie-International Edition 1998, 37, 158.
[146] C. Z. Wan, T. Fiebig, S. O. Kelley, C. R. Treadway, J. K. Barton, A. H. Zewail,
Proceedings of the National Academy of Sciences of the United States of America
1999, 96, 6014.
[147] F. D. Lewis, Y. F. Zhang, X. Y. Liu, N. Xu, R. L. Letsinger, Journal of Physical
Chemistry B 1999, 103, 2570.
[148] S. O. Kelley, J. K. Barton, Science 1999, 283, 375.
[149] V. Shafirovich, A. Dourandin, W. D. Huang, N. P. Luneva, N. E. Geacintov, Physical
Chemistry Chemical Physics 2000, 2, 4399.
[150] W. B. Davis, S. Hess, I. Naydenova, R. Haselsberger, A. Ogrodnik, M. D. Newton, M.
E. Michel-Beyerle, Journal of the American Chemical Society 2002, 124, 2422.
[151] M. Pascaly, J. Yoo, J. K. Barton, Journal of the American Chemical Society 2002,
124, 9083.
[152] B. Giese, J. Amaudrut, A. K. Kohler, M. Spormann, S. Wessely, Nature 2001, 412,
318.
[153] M. E. Nunez, D. B. Hall, J. K. Barton, Chemistry & Biology 1999, 6, 85.
10 Literature ______________________________________________________________________________________________________
152
[154] M. R. Arkin, E. D. A. Stemp, S. C. Pulver, J. K. Barton, Chemistry & Biology 1997, 4,
389.
[155] G. B. Schuster, Accounts of Chemical Research 2000, 33, 253.
[156] H. Ikeda, I. Saito, Journal of the American Chemical Society 1999, 121, 10836.
[157] B. Giese, Annual Review of Biochemistry 2002, 71, 51.
[158] R. F. Anderson, G. A. Wright, Physical Chemistry Chemical Physics 1999, 1, 4827.
[159] A. Messer, K. Carpenter, K. Forzley, J. Buchanan, S. Yang, Y. Razskazovskii, Y. L.
Cai, M. D. Sevilla, Journal of Physical Chemistry B 2000, 104, 1128.
[160] Y. Razskazovskii, S. G. Swarts, J. M. Falcone, C. Taylor, M. D. Sevilla, Journal of
Physical Chemistry B 1997, 101, 1460.
[161] Z. L. Cai, Z. Y. Gu, M. D. Sevilla, Journal of Physical Chemistry B 2000, 104, 10406.
[162] Z. L. Cai, M. D. Sevilla, Journal of Physical Chemistry B 2000, 104, 6942.
[163] Z. L. Cai, X. F. Li, M. D. Sevilla, Journal of Physical Chemistry B 2002, 106, 2755.
[164] X. F. Li, Z. L. Cai, M. D. Sevilla, Journal of Physical Chemistry B 2001, 105, 10115.
[165] M. G. Debije, M. T. Milano, W. A. Bernhard, Angewandte Chemie-International
Edition 1999, 38, 2752.
[166] S. Steenken, J. P. Telo, H. M. Novais, L. P. Candeias, Journal of the American
Chemical Society 1992, 114, 4701.
[167] A. Schwogler, L. T. Burgdorf, T. Carell, Angewandte Chemie-International Edition
2000, 39, 3918.
[168] C. Behrens, L. T. Burgdorf, A. Schwogler, T. Carell, Angewandte Chemie-
International Edition 2002, 41, 1763.
[169] A. Schwogler, T. Carell, Organic Letters 2000, 2, 1415.
[170] T. Carell, L. T. Burgdorf, L. M. Kundu, M. Cichon, Current Opinion in Chemical
Biology 2001, 5, 491.
[171] F. D. Lewis, X. Y. Liu, S. E. Miller, R. T. Hayes, M. R. Wasielewski, Journal of the
American Chemical Society 2002, 124, 11280.
[172] N. Amann, H. A. Wagenknecht, Synlett 2002, 687.
[173] T. L. Netzel, M. Zhao, K. Nafisi, J. Headrick, M. S. Sigman, B. E. Eaton, Journal of
the American Chemical Society 1995, 117, 9119.
[174] N. Amann, E. Pandurski, T. Fiebig, H. A. Wagenknecht, Angewandte Chemie-
International Edition 2002, 41, 2978.
[175] M. Raytchev, E. Mayer, N. Amann, H. A. Wagenknecht, T. Fiebig, Journal of the
American Chemical Society 2003, submitted.
10 Literature ______________________________________________________________________________________________________
153
[176] F. D. Lewis, Y. S. Wu, R. T. Hayes, M. R. Wasielewski, Angewandte Chemie-
International Edition 2002, 41, 3485.
[177] E. M. Boon, J. K. Barton, Current Opinion in Structural Biology 2002, 12, 320.
[178] B. Giese, Current Opinion in Chemical Biology 2002, 6, 612.
[179] J. Tomizawa, in Mol.Biology of RNA, New Perspectives (Ed.: M. D. Inouye, B. S.),
Academic Press, New York, 1987, pp. 249.
[180] Y. Eguchi, T. Itoh, J. Tomizawa, Annu. Rev. Biochem. 1991, 60, 631.
[181] J. Tomizawa, Cell 1984, 38, 861.
[182] J. Tomizawa, Cell 1985, 40, 527.
[183] J. Tomizawa, Cell 1986, 47, 89.
[184] J. Tomizawa, J. Mol. Biol. 1990, 212, 683.
[185] Y. Eguchi, J. Tomizawa, Cell 1990, 60, 199.
[186] J. Tomizawa, J. Mol. Biol. 1990, 212, 695.
[187] Y. Eguchi, J. Tomizawa, Journal of Molecular Biology 1991, 220, 831.
[188] R. S. Gregorian, D. M. Crothers, Journal of Molecular Biology 1995, 248, 968.
[189] G. del Solar, M. Espinosa, Molecular Microbiology 2000, 37, 492.
[190] J. P. Marino, R. S. Gregorian, G. Csankovszki, D. M. Crothers, Science 1995, 268,
1448.
[191] A. Lee, D. Crothers, Structure 1998, 6, 993.
[192] J. F. Milligan, O. C. Uhlenbeck, Methods in Enzymology 1989, 180, 51.
[193] D. W. Banner, M. Kokkinidis, D. Tsernoglou, Journal of Molecular Biology 1987,
196, 657.
[194] W. Eberle, W. Klaus, G. Cesareni, C. Sander, P. Rosch, Biochemistry 1990, 29, 7402.
[195] K. A. Johnson, The Enzymes, Vol. XX, Academic Press, Orlando, FL., 1992.
[196] K.-Y. Chang, I. Tinoco, J. Mol. Biol. 1997, 269, 52.
[197] J. L. Clever, Wong, M. L., Parslow, T. G., Journal of Virology 1996, 70, 5902.
[198] J. C. Paillart, E. Westhof, C. Ehresmann, B. Ehresmann, R. Marquet, Journal of
Molecular Biology 1997, 270, 36.
[199] P. F. Predki, L. M. Nayak, M. B. C. Gottlieb, L. Regan, Cell 1995, 80, 41.
[200] B. Holz, S. Klimasauskas, S. Serva, E. Weinhold, Nucleic Acids Research 1998, 26,
1076.
[201] M. W. Frey, L. C. Sowers, D. P. Millar, S. J. Benkovic, Biochemistry 1995, 34, 9185.
[202] L. A. Marquez, L. J. RehaKrantz, Journal of Biological Chemistry 1996, 271, 28903.
10 Literature ______________________________________________________________________________________________________
154
[203] A. M. Parrott, H. Lago, C. J. Adams, A. E. Ashcroft, N. J. Stonehouse, P. G. Stockley,
Nucleic Acids Research 2000, 28, 489.
[204] M. Menger, F. Eckstein, D. Porschke, Nucleic Acids Research 2000, 28, 4428.
[205] J. A. Levy, A. D. Hoffman, S. M. Kramer, J. A. Landis, J. M. Shimabukuro, Science
1984, 225, 840.
[206] R. C. Gallo, S. Z. Salahuddin, M. Popovic, G. M. Shearer, M. Kaplan, B. F. Haynes,
T. J. Palker, R. Redfield, J. Oleske, B. Safai, G. White, P. Foster, P. D. Markham,
Science 1984, 224, 505.
[207] F. Barresinoussi, J. C. Chermann, F. Rey, M. T. Nugeyre, S. Chamaret, J. Gruest, C.
Dauguet, C. Axlerblin, F. Vezinetbrun, C. Rouzioux, W. Rozenbaum, L. Montagnier,
Science 1983, 220, 868.
[208] A. D. Frankel, J. A. T. Young, Annual Review of Biochemistry 1998, 67, 1.
[209] B. G. Turner, M. F. Summers, Journal of Molecular Biology 1999, 285, 1.
[210] W. Fu, R. J. Gorelick, A. Rein, Journal of Virology 1994, 68, 5013.
[211] J. C. Paillart, R. Marquet, E. Skripkin, C. Ehresmann, B. Ehresmann, Biochimie 1996,
78, 639.
[212] H. J. Kim, K. Lee, J. J. Orear, Virology 1994, 198, 336.
[213] E. Skripkin, J. C. Paillart, R. Marquet, B. Ehresmann, C. Ehresmann, Proceedings of
the National Academy of Sciences of the United States of America 1994, 91, 4945.
[214] M. Laughrea, L. Jette, Biochemistry 1994, 33, 13464.
[215] B. Berkhout, J. L. B. vanWamel, Journal of Virology 1996, 70, 6723.
[216] M. Laughrea, L. Jette, Biochemistry 1996, 35, 1589.
[217] G. Miele, A. Mouland, G. P. Harrison, E. Cohen, A. M. L. Lever, Journal of Virology
1996, 70, 944.
[218] J. C. Paillart, E. Skripkin, B. Ehresmann, C. Ehresmann, R. Marquet, Proceedings of
the National Academy of Sciences of the United States of America 1996, 93, 5572.
[219] M. Laughrea, L. Jette, J. Mak, L. Kleiman, C. Liang, M. A. Wainberg, Journal of
Virology 1997, 71, 3397.
[220] M. Laughrea, N. Shen, L. Jette, M. A. Wainberg, Biochemistry 1999, 38, 226.
[221] J. C. Paillart, L. Berthoux, M. Ottmann, J. L. Darlix, R. Marquet, B. Ehresmann, C.
Ehresmann, Journal of Virology 1996, 70, 8348.
[222] E. Skripkin, J. C. Paillart, R. Marquet, M. Blumenfeld, B. Ehresmann, C. Ehresmann,
Journal of Biological Chemistry 1996, 271, 28812.
10 Literature ______________________________________________________________________________________________________
155
[223] F. Jossinet, J. C. Paillart, E. Westhof, T. Hermann, E. Skripkin, J. S. Lodmell, C.
Ehresmann, B. Ehresmann, R. Marquet, Rna-a Publication of the Rna Society 1999, 5,
1222.
[224] J. S. Lodmell, J. C. Paillart, D. Mignot, B. Ehresmann, C. Ehresmann, R. Marquet,
Antisense & Nucleic Acid Drug Development 1998, 8, 517.
[225] J. S. Lodmell, C. Ehresmann, B. Ehresmann, R. Marquet, Rna-a Publication of the
Rna Society 2000, 6, 1267.
[226] J. S. Lodmell, C. Ehresmann, B. Ehresmann, R. Marquet, Journal of Molecular
Biology 2001, 311, 475.
[227] D. Muriaux, H. DeRocquigny, B. P. Roques, J. Paoletti, Journal of Biological
Chemistry 1996, 271, 33686.
[228] Y. X. Feng, T. D. Copeland, L. E. Henderson, R. J. Gorelick, W. J. Bosche, J. G.
Levin, A. Rein, Proceedings of the National Academy of Sciences of the United States
of America 1996, 93, 7577.
[229] D. Muriaux, Fossé, P., Paoletti, J., Biochemistry 1996, 35, 5075.
[230] K. I. Takahashi, S. Baba, P. Chattopadhyay, Y. Koyanagi, N. Yamamoto, H. Takaku,
G. Kawai, Rna-a Publication of the Rna Society 2000, 6, 96.
[231] K. Takahashi, S. Baba, Y. Koyanagi, N. Yamamoto, H. Takaku, G. Kawai, Journal of
Biological Chemistry 2001, 276, 31274.
[232] A. Rein, L. E. Henderson, J. G. Levin, Trends in Biochemical Sciences 1998, 23, 297.
[233] E. Remy, H. de Rocquigny, P. Petitjean, D. Muriaux, V. Theilleux, J. Paoletti, B. P.
Roques, Journal of Biological Chemistry 1998, 273, 4819.
[234] B. D. Chan, K. Weidemaier, W. T. Yip, P. F. Barbara, K. Musier-Forsyth,
Proceedings of the National Academy of Sciences of the United States of America
1999, 96, 459.
[235] X. G. Li, Y. D. Quan, E. J. Arts, Z. Li, B. D. Preston, H. deRocquigny, B. P. Roques,
J. L. Darlix, L. Kleiman, M. A. Parniak, M. A. Wainberg, Journal of Virology 1996,
70, 4996.
[236] T. Y. Wu, J. H. Guo, J. Bess, L. E. Henderson, J. G. Levin, Journal of Virology 1999,
73, 4794.
[237] M. C. Williams, R. J. Gorelick, K. Musier-Forsyth, Proceedings of the National
Academy of Sciences of the United States of America 2002, 99, 8614.
[238] J. H. Guo, T. Y. Wu, B. F. Kane, D. G. Johnson, L. E. Henderson, R. J. Gorelick, J. G.
Levin, Journal of Virology 2002, 76, 4370.
10 Literature ______________________________________________________________________________________________________
156
[239] J. H. Guo, T. Y. Wu, J. Anderson, B. F. Kane, D. G. Johnson, R. J. Gorelick, L. E.
Henderson, J. G. Levin, Journal of Virology 2000, 74, 8980.
[240] J. H. Guo, L. E. Henderson, J. Bess, B. Kane, J. G. Levin, Journal of Virology 1997,
71, 5178.
[241] F. Girard, F. Barbault, C. Gouyette, T. Huynh-Dinh, J. Paoletti, G. Lancelot, Journal
of Biomolecular Structure & Dynamics 1999, 16, 1145.
[242] A. Mujeeb, J. L. Clever, T. M. Billeci, T. L. James, T. G. Parslow, Nature Structural
Biology 1998, 5, 432.
[243] A. Mujeeb, T. G. Parslow, A. Zarrinpar, C. Das, T. L. James, Febs Letters 1999, 458,
387.
[244] E. Ennifar, P. Walter, B. Ehresmann, C. Ehresmann, P. Dumas, Nature Structural
Biology 2001, 8, 1064.
[245] J. L. Clever, M. L. Wong, T. G. Parslow, Journal of Virology 1996, 70, 5902.
[246] J. C. Paillart, R. Marquet, E. Skripkin, B. Ehresmann, C. Ehresmann, Journal of
Biological Chemistry 1994, 269, 27486.
[247] E. G. H. Wagner, R. W. Simons, Annu. Rev. Microbiol. 1994, 48, 712.
[248] R. Marquet, F. Baudin, C. Gabus, J. L. Darlix, M. Mougel, C. Ehresmann, B.
Ehresmann, Nucleic Acids Research 1991, 19, 2349.
[249] A. C. Prats, C. Roy, P. Wang, M. Erard, V. Housset, C. Gabus, C. Paoletti, J. L.
Darlix, Journal of Virology 1990, 64, 774.
[250] D. Muriaux, P. Fosse, J. Paoletti, Biochemistry 1996, 35, 5075.
[251] H. Derocquigny, C. Gabus, A. Vincent, M. C. Fourniezaluski, B. Roques, J. L. Darlix,
Proceedings of the National Academy of Sciences of the United States of America
1992, 89, 6472.
[252] Y. Mély, H. DeRocquigny, N. Morellet, B. P. Roques, D. Gérard, Biochemistry 1996,
35, 5175.
[253] C. Vuilleumier, E. Bombarda, N. Morellet, D. Gerard, B. P. Roques, Y. Mely,
Biochemistry 1999, 38, 16816.
[254] E. Bombarda, A. Ababou, C. Vuilleumier, D. Gerard, B. P. Roques, E. Piemont, Y.
Mely, Biophysical Journal 1999, 76, 1561.
[255] M. A. Urbaneja, B. P. Kane, D. G. Johnson, R. J. Gorelick, L. E. Henderson, J. R.
Casas-Finet, Journal of Molecular Biology 1999, 287, 59.
[256] R. L. Karpel, L. E. Henderson, S. Oroszlan, Journal of Biological Chemistry 1987,
262, 4961.
10 Literature ______________________________________________________________________________________________________
157
[257] R. N. De Guzman, Z. R. Wu, C. C. Stalling, L. Pappalardo, P. N. Borer, M. F.
Summers, Science 1998, 279, 384.
[258] G. Myers, B. Korber, B. H. Hahn, K.-T. Jeang, J. W. Mellors, F. E. McCutchan, L. E.
Henderson, G. N. Pavlakis, in Human Retroviruses and AIDS, Los Alamos National
Laboratory, Los Alamos, New Mexico, USA, 1995.
[259] P. B. Hackett, M. W. Dalton, D. P. Johnson, R. B. Petersen, Nucleic Acids Research
1991, 19, 6929.
[260] R. L. Alford, S. Honda, C. B. Lawrence, J. W. Belmont, Virology 1991, 183, 611.
[261] V. Theilleux-Delalande, F. Girard, T. Huynh-Dinh, G. Lancelot, J. Paoletti, European
Journal of Biochemistry 2000, 267, 2711.
[262] H. Huthoff, B. Berkhout, Biochemistry 2002, 41, 10439.
[263] R. Khan, D. P. Giedroc, Journal of Biological Chemistry 1992, 267, 6689.
[264] F. Dibhajj, R. Khan, D. P. Giedroc, Protein Science 1993, 2, 231.
[265] J. C. You, C. S. McHenry, Journal of Biological Chemistry 1993, 268, 16519.
[266] V. Tanchou, C. Gabus, V. Rogemond, J. L. Darlix, Journal of Molecular Biology
1995, 252, 563.
[267] J. C. You, C. S. McHenry, Journal of Biological Chemistry 1994, 269, 31491.
[268] R. D. Berkowitz, A. Ohagen, S. Hoglund, S. P. Goff, Journal of Virology 1995, 69,
6445.
[269] Y. X. Feng, S. Campbell, D. Harvin, B. Ehresmann, C. Ehresmann, A. Rein, Journal
of Virology 1999, 73, 4251.
[270] A. S. Davydov, Theory of Molecular Excitons, McGraw-Hill, New York, NY, 1962.
[271] A. L. Sobolewski, W. Domcke, C. Dedonder-Lardeux, C. Jouvet, Physical Chemistry
Chemical Physics 2002, 4, 1093.
[272] N. J. Kim, G. Jeong, Y. S. Kim, J. Sung, S. K. Kim, Y. D. Park, Journal of Chemical
Physics 2000, 113, 10051.
[273] E. Nir, K. Kleinermanns, L. Grace, M. S. de Vries, Journal of Physical Chemistry A
2001, 105, 5106.
[274] A. A. Voityuk, K. Siriwong, N. Rosch, Physical Chemistry Chemical Physics 2001, 3,
5421.
[275] H. Y. Yi-Brunozzi, O. M. Stephens, P. A. Beal, Journal of Biological Chemistry 2001,
276, 37827.
[276] R. A. Hochstrasser, T. E. Carver, L. C. Sowers, D. P. Millar, Biochemistry 1994, 33,
11971.
10 Literature ______________________________________________________________________________________________________
158
[277] M. A. O'Neill, J. K. Barton, Proceedings of the National Academy of Sciences of the
United States of America 2002, 99.
[278] H. Kang, P. J. Chou, W. C. Johnson, D. Weller, S. B. Huang, J. E. Summerton,
Biopolymers 1992, 32, 1351.
[279] C. R. Cantor, M. M. Warshaw, H. Shapiro, Biopolymers 1970, 9, 1059.
[280] N. S. Hush, A. S. Cheung, Chemical Physics Letters 1975, 34, 11.
[281] V. Shafirovich, A. Dourandin, N. P. Luneva, N. E. Geacintov, Journal of the Chemical
Society-Perkin Transactions 2 2000, 271.
[282] M. Enescu, L. Lindqvist, Journal of Physical Chemistry 1995, 99, 8405.
[283] S. D. Wetmore, R. J. Boyd, L. A. Eriksson, Chemical Physics Letters 2000, 322, 129.
[284] V. A. Korshun, E. V. Manasova, K. V. Balakin, I. A. Prokhorenko, A. G. Buchatskii,
Y. A. Berlin, Bioorganicheskaya Khimiya 1996, 22, 923.
[285] S. I. Khan, M. W. Grinstaff, Journal of the American Chemical Society 1999, 121,
4704.
[286] P. Koenig, S. A. Reines, C. R. Cantor, Biopolymers 1977, 16, 2231.
[287] R. Kierzek, Y. Li, D. H. Turner, P. C. Bevilacqua, Journal of the American Chemical
Society 1993, 115, 4985.
[288] K. Nakatani, C. Dohno, I. Saito, Journal of the American Chemical Society 2001, 123,
9681.
[289] K. Nakatani, C. Dohno, I. Saito, Journal of the American Chemical Society 1999, 121,
10854.
[290] K. Nakatani, C. Dohno, A. Ogawa, I. Saito, Chemistry & Biology 2002, 9, 361.
[291] B. M. Lee, R. N. De Guzman, B. G. Turner, N. Tjandra, M. F. Summers, Journal of
Molecular Biology 1998, 279, 633.
[292] F. W. Studier, A. H. Rosenberg, J. J. Dunn, J. W. Dubendorff, Methods in Enzymology
1990, 185, 60.
[293] J. F. Milligan, D. R. Groebe, G. W. Witherell, O. C. Uhlenbeck, Nucleic Acids
Research 1987, 15, 8783.
[294] S. L. Beaucage, M. H. Caruthers, Tetrahedron Lett. 1981, 22, 1859.
[295] M. H. Caruthers, A. D. Barone, S. L. Beaucage, D. R. Dodds, E. F. Fisher, L. J.
McBride, M. Matteucci, Z. Stabinsky, J. Y. Tang, Methods in Enzymology 1987, 154,
287.
[296] J. D. Puglisi, I. Tinoco, Methods in Enzymology 1989, 180, 304.

10 Literature ______________________________________________________________________________________________________
159
[297] B. P. Flannery, S. A. Teukolsky, V. W. T., Numerical Recipes in Fortran, 2nd ed.,
Cambridge University Press, Cambridge, 1992.


![Salvage of Circulating Pyrimidine Nucleosides in the Rat1 · Stability of [5-3H]Uridine in Blood. Tracer amounts of [5-3H]uridine (3.6 X 10⁷ cpm/ml; 1.3 pmol) were added to blood](https://img.dokumen.tips/doc/110x75/5ffc87423757ea188c1819e1/salvage-of-circulating-pyrimidine-nucleosides-in-the-rat1-stability-of-5-3huridine.jpg)