Embed Size (px)
Citation preview

A) B) C) D)
1. The map below shows a meandering river. A–A' is thelocation of a cross section. The arrows show thedirection of the river flow.
Which cross section best represents the shape of theriver bottom at A–A'?
A) It will become jagged and its mass will decrease.B) It will become jagged and its volume will
increase.C) It will become rounded and its mass will
increase.D) It will become rounded and its volume will
decrease.
2. What change will a pebble usually undergo when it istransported a great distance by streams?
A) B)
C) D)
3. The block diagram below represents an igneous dome that uplifted overlying rock layers, which werethen weathered and eroded.
Which stream drainage pattern is most likely found on the surface of the area represented by the blockdiagram?

Base your answers to questions 4 through 6 on the information and diagrams below.
A mixture of colloids, clay, silt, sand, pebbles, and cobbles is put into stream I at point A. The watervelocity at point A is 400 centimeters per second. A similar mixture of particles is put into stream II atpoint A. The water velocity in stream II at point A is 80 centimeters per second.
A) Stream I will move all particles that are added at point A.B) Stream II will move all particles that are added at point A.C) Stream I cannot move sand.D) Stream II cannot move sand.
4. Which statement best describes what happens when the particles are placed in the streams?
A) The greatest deposition occurs at point B.B) Particles are carried in suspension and by bouncing along the bottom.C) The particles will have a greater velocity than the water in the stream.D) The velocity of the stream is the same at point B as at point C.
5. Which statement is the most accurate description of conditions in both streams?
A) increase for stream I, but not for stream IIB) increase for stream II, but not for stream IC) increase for both streamsD) not change for either stream
6. If a sudden rainstorm occurs at both streams above point A, the erosion rate will
A) B)
C) D)
7. Which quartz sample has probably undergoneabrasion in a stream for the longest period of time?
A) a decrease in mass and number of angularedges
B) a decrease in density and sizeC) an increase in weight and hardnessD) an increase in volume and number of cleavage
planes
8. A sediment particle transported by a stream over along period of time will most likely show

A) B)C) D)
9. The diagram below is a map view of a stream flowingthrough an area of loose sediments. Arrows show thelocation of the strongest current.
Which stream profile best represents the cross sectionfrom A to A' ?

Base your answers to questions 10 through 13 on the diagram below, which represents the landscapefeatures associated with a meandering river. Letters W, X, Y, and Z represent locations on thefloodplain.
A)
B)
C)
D)
10. The choices below represent stages in the formation of a meandering river. Which sequence best represents the usual changes over time?
A) a decrease in the slope of the riverB) a decrease in the temperature of the riverC) an increase in the river's dischargeD) an increase in the width of the river
11. Which change would most likely increase the velocity of the river?
A) more rounded B) more dense C) heavier D) larger
12. During transport by this river, a sediment particle will most likely become
A) W B) X C) Y D) Z
13. At which location is erosion greatest?

A) decreased, onlyB) decreased, then increasedC) increased, onlyD) remained constant
14. The diagram below shows the cross section of astream channel and the height of the stream surfaceon various dates of the year.
The stream's velocity from June 19 to July 20 at thissection of the stream most likely
A) A and B B) B and CC) C and D D) D and A
15. The map below shows a meandering stream as itenters a lake. The arrow shows the direction ofstream flow. Points A through D represent locationson the surface of the stream.
The greatest stream velocities are found closest topoints
Base your answers to questions 16 through 18 on thediagram below, which shows several differentlandscape features. Points X and Y indicate locationson the streambank.
16. Explain why the stream meanders on the floodplain,but not in the mountains.
17. Identify which point, X or Y, has more streamerosion and explain why the amounts of erosion aredifferent.
18. Explain why the upper valley in the mountains isU-shaped and the lower valley is V-shaped.
A) B) C) D)
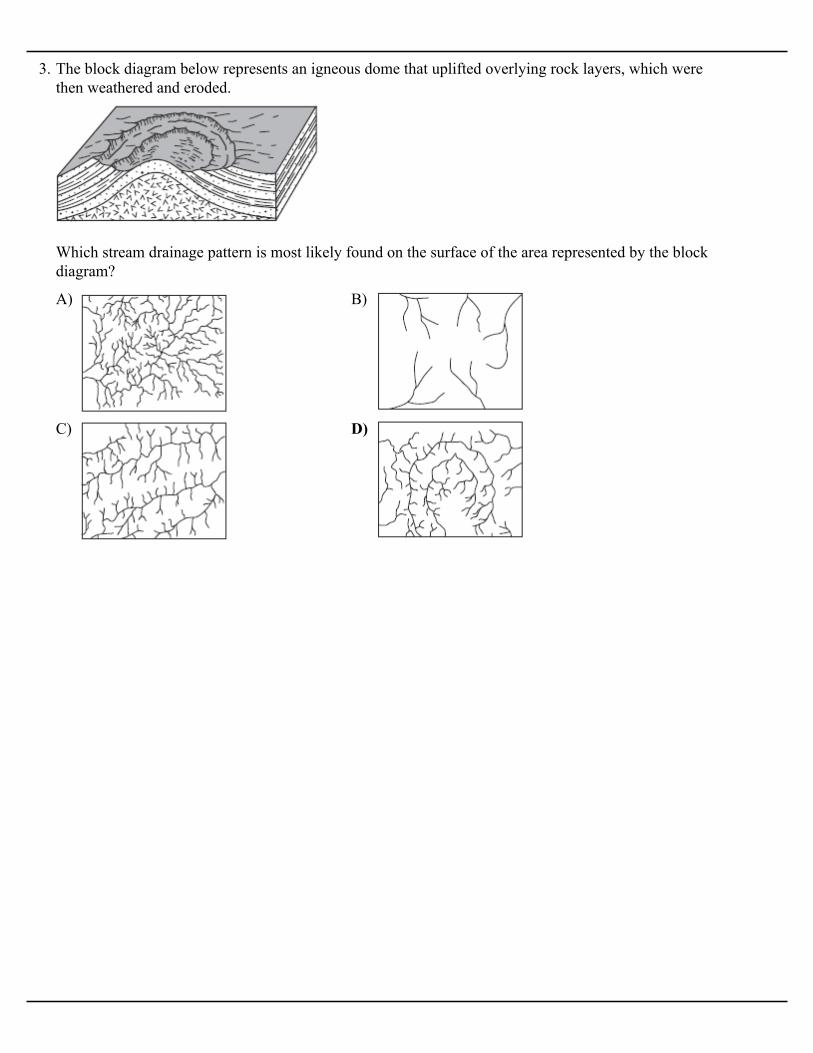
19. The map below shows the bend of a large meandering stream. The arrows show the direction ofstream flow, Letters A, B, and C are positions on the streambed where erosion and deposition datawere collected.
Which table best represents the locations where erosion and deposition are dominant and where anequilibrium exists between the two processes? [A check mark represents the dominant process foreach lettered location.]
A) B)C) D)
20. The map below represents a meandering streamflowing into a lake. A student measured waterdepths in the stream at three locations: A–A', B–B',and C–C'.
Which set of cross sections best represents thestream bed at the three locations?

A) B) C) D)
21. The map below represents a large stream meander (bend). The arrows show the direction of streamflow. Stream velocity was measured at surface locations A, B, and C.
Which graph best represents the relative velocities of the stream at locations A, B. and C?
A) B)
C) D)
22. The diagram below shows a post set in thestreambed of a river. The river levels between May 5and May 10 were recorded on the post by anobserver at noon each day.
Which graph shows the probable stream currentvelocity that occurred during this same time period?
A) decrease and the rate of erosion to decreaseB) decrease and the rate of erosion to increaseC) increase and the rate of erosion to decreaseD) increase and the rate of erosion to increase
23. The model shown below illustrates stream erosionbetween locations A and B in the stream.
Placing a second block under location A will causethe stream's velocity to
A) It will become jagged and its mass willdecrease.
B) It will become jagged and its volume willincrease.
C) It will become rounded and its mass willincrease.
D) It will become rounded and its volume willdecrease.
24. What change will a pebble usually undergo when itis transported a great distance by streams?

A) B)
C) D)
25. Based on the diagrams of rock fragments below,which shows the least evidence of erosion?
A) The volume of water will decrease and the rateof erosion will increase.
B) The volume of water will increase and the rateof erosion will decrease.
C) Both the volume of water and the rate oferosion will decrease.
D) Both the volume of water and the rate oferosion will increase.
26. The block diagram below represents a streamflowing from a mountain region.
A brief, heavy rainstorm occurs in the mountains.How will the volume of water and the rate of erosionin the stream change shortly after the rainstorm?
A) an increase in stream dischargeB) an increase in the width of the riverbedC) a decrease in the slope of the stream channelD) a decrease in the amount of material held in
suspension
27. An increase in the velocity of a stream is most likelydue to

28. Base your answer to the following question on the diagrams below. Diagrams A, B, and C representthree different river valleys.
A) angular and weathered from underlying bedrockB) angular and weathered from bedrock upstreamC) rounded and weathered from underlying bedrockD) rounded and weathered from bedrock upstream
Most sediments found on the floodplain shown in diagram A are likely to be
A) Stream B has more friction to overcome alongits banks.
B) Stream B has a higher average temperature.C) Stream B has a greater volume of water.D) Stream B has a curved streambed.
29. Stream A has a steeper slope than stream B. However, the average water velocity of stream B isgreater than that of stream A. Which is the mostreasonable explanation for this?
A) a kettle lake B) an outwash plainC) a finger lake D) a moraine
30. The diagram below shows a glacial landscapefeature forming over time from a melting block ofice.
This glacial landscape feature is best identified as
A) A B) B C) C D) D
31. The map below shows the area surrounding ameandering stream.
At which point is erosion greatest?
A) mass movement B) windC) glacial ice D) running water
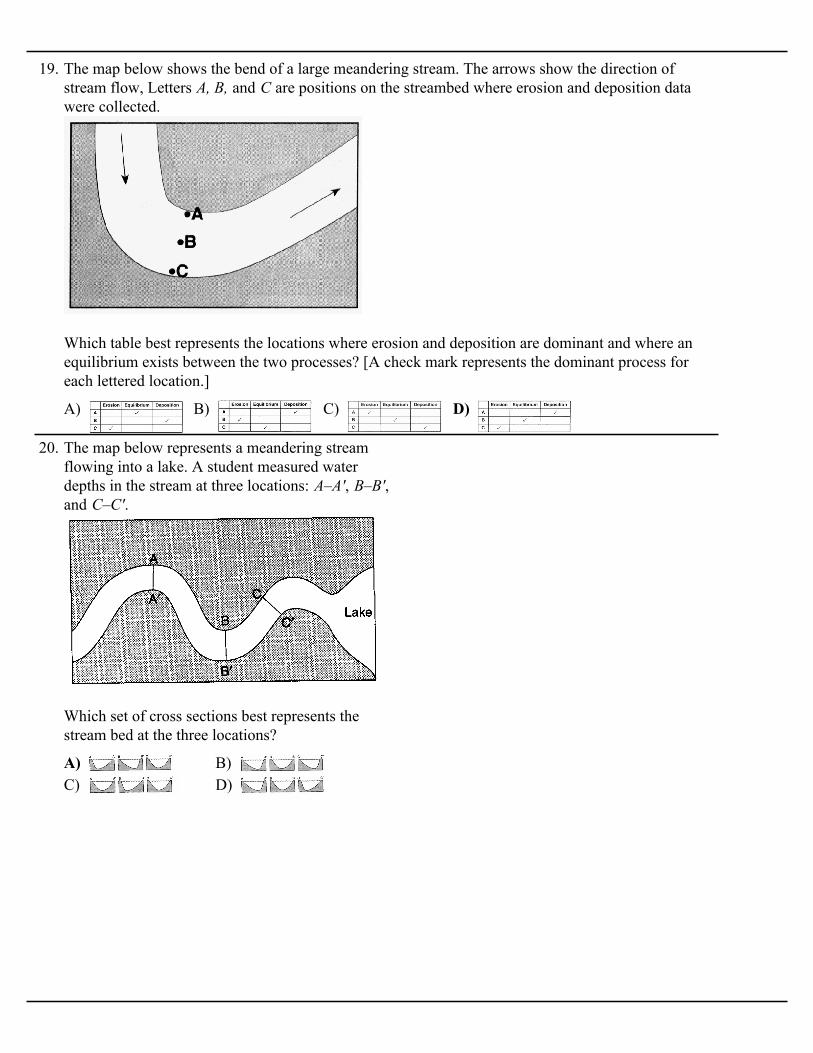
32. The diagram below shows a sedimentary rocksample.
Which agent of erosion was most likely responsiblefor shaping the particles forming this rock?
A) few lakesB) many V-shaped valleysC) many sand and gravel depositsD) thick soils formed "in place" from underlying
bedrock
33. As a result of glaciation, New York has
A) At points X and Y, only clay is beingtransported.
B) At points X and Y, only sand, silt, and clay arebeing transported.
C) Some pebbles being transported at point Y are bigger than those being transported atpoint X.
D) Some pebbles and cobbles are beingtransported at points X and Y, but not sand, silt,or clay.
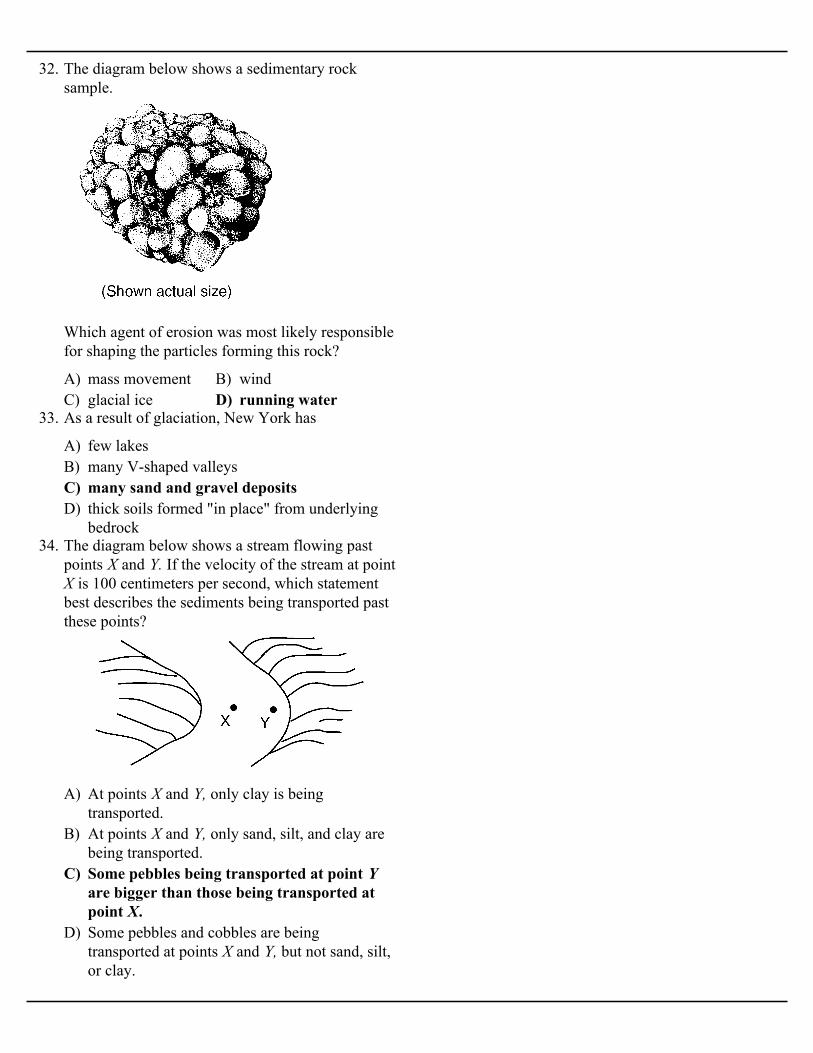
34. The diagram below shows a stream flowing pastpoints X and Y. If the velocity of the stream at point X is 100 centimeters per second, which statementbest describes the sediments being transported pastthese points?

A) B) C) D)
35. The diagram below represents a cross section of a stream. Points A, B, C, D, and E are locationswithin the stream channel.
Which graph best represents stream velocity at locations A through E?
A) Potential evapotranspiration is greater in springthan in summer.
B) More transpiration occurs in spring than insummer.
C) Most New York State water budgets have adeficit in spring.
D) Melting snow increases runoff in spring.
36. Why do most streams in the Northeast have a greaterstream discharge in spring than in summer?
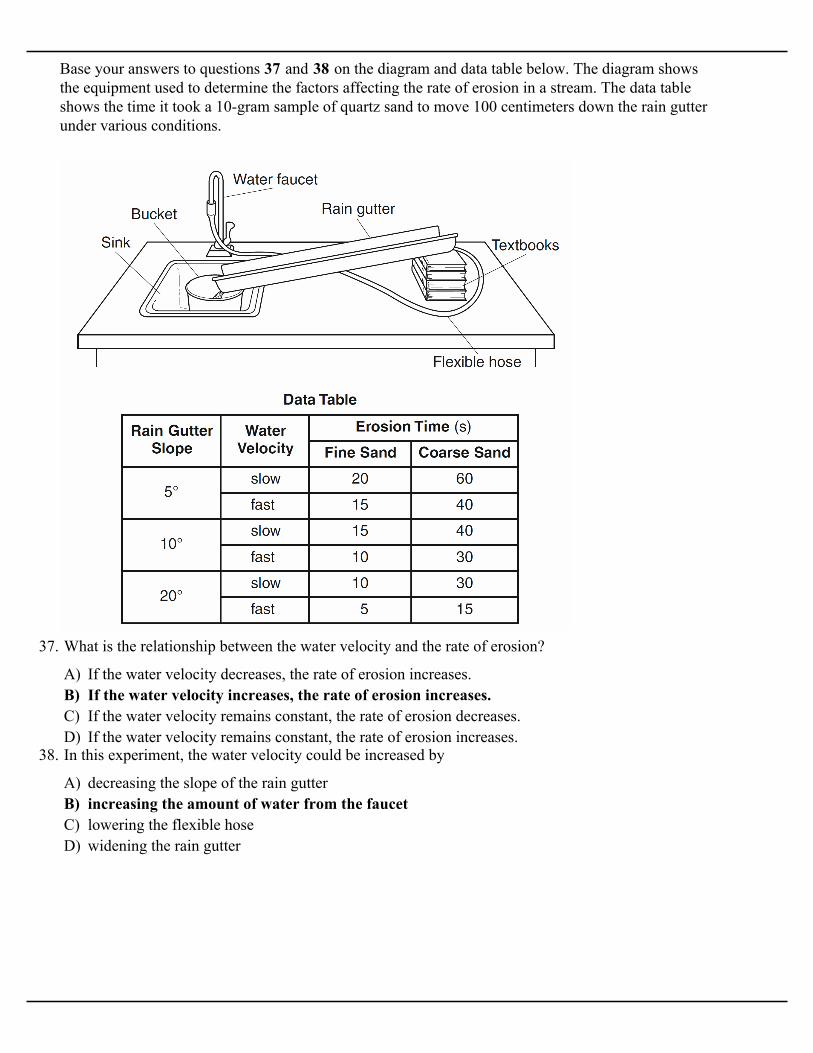
Base your answers to questions 37 and 38 on the diagram and data table below. The diagram showsthe equipment used to determine the factors affecting the rate of erosion in a stream. The data tableshows the time it took a 10-gram sample of quartz sand to move 100 centimeters down the rain gutterunder various conditions.
A) If the water velocity decreases, the rate of erosion increases.B) If the water velocity increases, the rate of erosion increases.C) If the water velocity remains constant, the rate of erosion decreases.D) If the water velocity remains constant, the rate of erosion increases.
37. What is the relationship between the water velocity and the rate of erosion?
A) decreasing the slope of the rain gutterB) increasing the amount of water from the faucetC) lowering the flexible hoseD) widening the rain gutter
38. In this experiment, the water velocity could be increased by

39. Base your answer to the following question on the map and cross sections below. The map showsmeasured changes in the position of Niagara Falls since 1678. The cross sections show the two partsof Niagara Falls: Horseshoe Falls and American Falls. Letters A through D represent the same rocklayers at both locations.
A) A B) B C) C D) D
Which rock layer shows the most resistance to weathering and erosion at Horseshoe Falls?

A) B) C) D)
40. The diagram below shows a meandering stream flowing across nearly flat topography and over loosesediments.
If arrow length represents stream velocity, which diagram best shows the relative stream velocities inthis section of the stream?
A) pebble B) sandC) silt D) clay
41. A river’s current carries sediments into the ocean.Which sediment size will most likely be deposited indeeper water farthest from the shore?
A)
B)
C)
D)
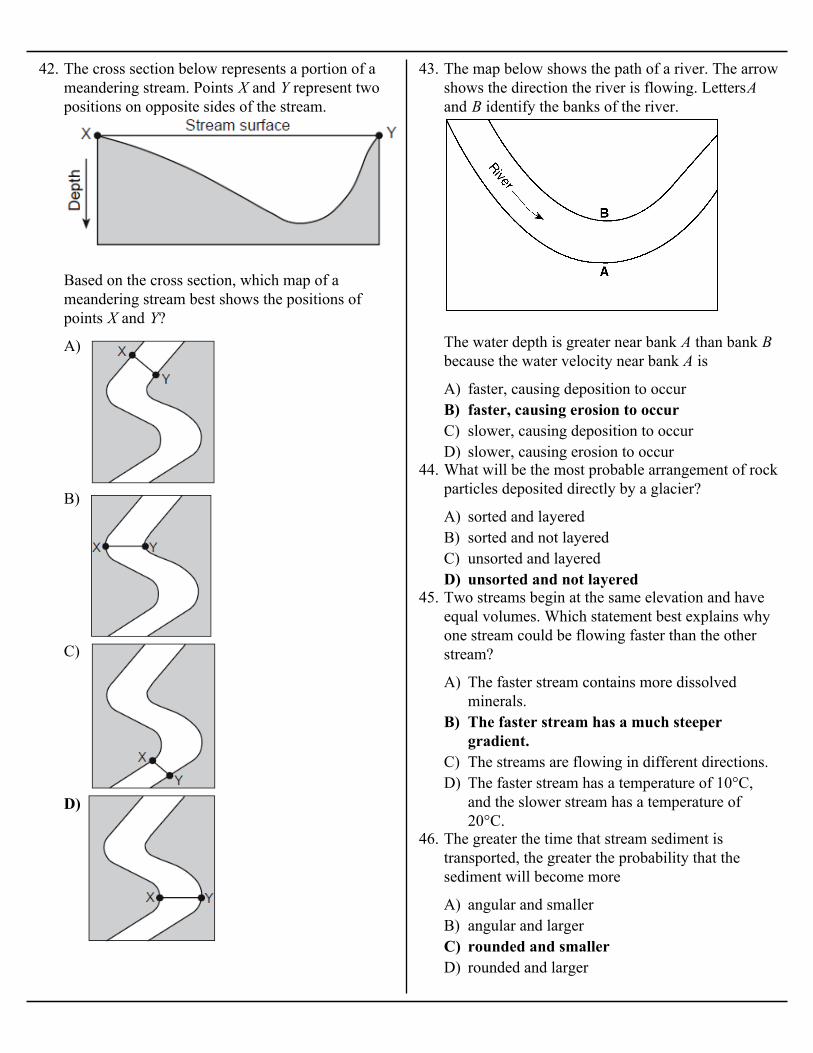
42. The cross section below represents a portion of ameandering stream. Points X and Y represent twopositions on opposite sides of the stream.
Based on the cross section, which map of ameandering stream best shows the positions ofpoints X and Y?
A) faster, causing deposition to occurB) faster, causing erosion to occurC) slower, causing deposition to occurD) slower, causing erosion to occur
43. The map below shows the path of a river. The arrowshows the direction the river is flowing. LettersA and B identify the banks of the river.
The water depth is greater near bank A than bank B because the water velocity near bank A is
A) sorted and layeredB) sorted and not layeredC) unsorted and layeredD) unsorted and not layered
44. What will be the most probable arrangement of rockparticles deposited directly by a glacier?
A) The faster stream contains more dissolvedminerals.
B) The faster stream has a much steepergradient.
C) The streams are flowing in different directions.D) The faster stream has a temperature of 10°C,
and the slower stream has a temperature of20°C.
45. Two streams begin at the same elevation and haveequal volumes. Which statement best explains whyone stream could be flowing faster than the otherstream?
A) angular and smallerB) angular and largerC) rounded and smallerD) rounded and larger
46. The greater the time that stream sediment istransported, the greater the probability that thesediment will become more

A) deposition on the inside of the meanderB) deposition on the outside of the meanderC) erosion on the inside of the meanderD) erosion on the outside of the meander
47. Trees growing on the edge of a river's meander aremost likely to fall into the river due to
48. Base your answer to the following question on thediagram below. The diagram shows points A, B, C, and D on a meandering stream.
A) gravel B) sandC) silt D) clay
Which material is most likely to be transported insuspension during periods of slowest streamvelocity?
A)
B)
C)
D)
49. Which graph best represents the relationshipbetween the discharge of a stream and the velocityof stream flow?

50. Base your answer to the following question on themap below, which shows a portion of a stream thatflows southward. Letters A through E representlocations in the stream. Line XY is the location of across section.
A) B)
C) D)
Which cross section along line XY best represents theshape of the stream bottom?
A) B)
C) D)
51. The diagram below shows a meandering stream.Measurements of stream velocity were taken alongstraight line AB.
Which graph best shows the relative streamvelocities across the stream from A to B?
A) residual soil covering a large areaB) coastal sand dunesC) V-shaped valleysD) parallel hills of unsorted sediments
52. Which landscape characteristic indicates a landscapehas been formed primarily by streams?
A) A B) B C) C D) D
53. The diagram below shows a cross section of a river.Letters A, B, C, and D represent points in the river.
At which point is the water most likely to have thegreatest velocity?

A) A B) B C) C D) D
54. The diagram below shows points A, B, C, and D ona meandering stream.
At which point does the greatest stream erosionoccur?
A) Its density is decreasing.B) Its mass is decreasing.C) Its particle size is increasing.D) Its hardness is increasing.
55. In what way is a pebble probably changing as it iscarried by a mountain stream?
A) A B) B C) C D) D
56. The diagrams below represent the map view of astream and the cross section of the stream at line XY.Letters A, B, C, and D identify four locations withinthe stream.
At which location is the water moving fastest?
A) A and B B) B and DC) A and D D) B and C
57. The map below represents a view of a flowingstream. The letters identify locations in the streamnear the interface between land and water. At whichtwo locations is erosion due to flowing water likelyto be greatest?
A)
B)
C)
D)
58. Which cross section best represents the valley shapewhere a rapidly flowing stream is cutting into thebedrock in a mountainous area?

A) breaking apart of shale as a result of waterfreezing in a crack
B) dissolving of rock particles on a limestonegravestone by acid rain
C) rolling of a pebble along the bottom of astream
D) crumbling of bedrock in one area to form soil
59. Which event is the best example of erosion?
A) at the center along the bottomB) at the center near the surfaceC) at the sides along the bottomD) at the sides near the surface
60. In the two diagrams below, the length of the arrowsrepresents the relative velocities of stream flow atvarious places in a stream. Diagram I shows thedifferent water velocities across the surface.Diagram II shows the different water velocities atvarious depths.
At which location in the stream is the water velocitygreatest?
A) Lockport dolostone and Whirlpoolsandstone
B) Rochester shale and Albion sandstone and shaleC) Clinton limestone and shale and Queenston
shaleD) Thorold sandstone and Queenston shale
61. A cross section of Niagara Falls is shown below.
Which two rock units appear to be most resistant toweathering and erosion?
A) slower, causing depositionB) faster, causing depositionC) slower, causing erosionD) faster, causing erosion
62. The diagram below shows a section of a meander ina stream. The arrows show the direction of streamflow.
The streambank on the outside of this meander issteeper than the streambank on the inside of thismeander because the water on the outside of thismeander is moving