Embed Size (px)
Citation preview

A)
B)
C)
D)
1. The diagram below shows weather instruments A and B.
Which table correctly indicates the name of the weather instrument and the weather variable that itmeasures?

2. Base your answer to the following question on the map below, which shows the position of the jetstream relative to two air masses and a low-pressure center (L) over the United States.
A) into the mT air mass to the westB) into the cP air mass to the northwestC) along the path of the jet stream to the northeastD) along the path of the jet stream to the southwest
Assuming the low-pressure center (L) follows a typical storm track, it will move

3. The weather map below shows the air temperatures recorded at the same time at cities across theUnited States.
Which map correctly shows the locations of the 40°F and 50°F isotherms?

A)
B)
C)
D)
A) relative humidity B) dewpointC) precipitation D) air pressure
4. Which weather variable generally decreases whenwind speed is increasing, clouds are thickening, andvisibility drops?

Base your answers to questions 5 and 6 on the weather map below, which represents a low-pressuresystem over New York State. The L on the map represents the center of the low-pressure system. Twofronts extend from the center of the low, and are labeled front 1 and front 2. Cloud cover has beenomitted from the station models.
A) B)
C) D)
5. Which map best represents the type of fronts and direction of movement of these fronts in relation tothe low-pressure center?

A) B)
C) D)
6. The arrows on which map best represent the surface wind pattern around this low-pressure center?
A) 90% B) 80% C) 14% D) 13%
7. What is the relative humidity when the dry-bulbtemperature is 16°C and the wet-bulb temperature is14°C?
A) The relative humidity was decreasing and thechance of precipitation was decreasing.
B) The relative humidity was decreasing and thechance of precipitation was increasing.
C) The relative humidity was increasing and thechance of precipitation was decreasing.
D) The relative humidity was increasing and thechance of precipitation was increasing.
8. An observer measured the air temperature and thedewpoint and found the difference between them tobe 12°C. One hour later, the difference between theair temperature and the dewpoint was found to be4°C. Which statement best describes the changes thatwere occurring?
A) cP B) cT C) mP D) mT
9. An air mass entering Alaska from the northern PacificOcean would most likely be labeled on a weather mapas

10. Base your answer to the following question on the weather map below and on your knowledge of Earth Science. The map shows a low-pressuresystem with two fronts extending from its center (L). Points A, B, C, and D represents locations onEarth's surface. Two different air masses are labeled.
A) A and B B) B and C C) C and D D) D and B
Which locations are most likely experiencing precipitation?
A) B) C) D)
11. A cross section of a weather front is shown below.
Which symbol would be used to represent this front on a weather map?

A) maritime polarB) maritime tropicalC) continental polarD) continental tropical
12. Which air mass is associated with low relativehumidity and high air temperature?
A) B)
C) D)
13. Which weather instrument is used to determine wind direction?
A) east to west B) west to eastC) north to south D) south to north
14. Jet stream winds over the United States generallymove from

A) A B) B C) C D) D
15. The weather map below shows isobars labeled in millibars. Points A, B, C, and D are locations onEarth's surface.
Which location was probably experiencing the highest wind speed?
A) B)
C) D)
16. Which cross section below best shows the locations of high air pressure and low air pressure near abeach on a hot, sunny, summer afternoon?

A) B)
C) D)
17. The station model below shows some weatherconditions at a location on Earth's surface.
Which present weather symbol represents the mostlikely type of precipitation occurring at this location?
A) B) C) D)
18. Which station model shows an air temperature of 75°F and a barometric pressure of 996.3 mb?
A) 15 knots, measured by a wind vaneB) 15 knots, measured by an anemometerC) 25 knots, measured by a wind vaneD) 25 knots, measured by an anemometer
19. The weather station model below shows some of theweather data for a certain location.
What is the wind speed shown on the station modeland which instrument is used to measure the windspeed?
A) 32°F B) 40°F C) 61°F D) 70°F
20. The station model below shows several weathervariables recorded at a particular location.
What was the most likely dewpoint at this location?
A) compressing and coolingB) compressing and warmingC) expanding and coolingD) expanding and warming
21. Which two processes lead to cloud formation inrising air?
A) expands and coolsB) expands and warmsC) contracts and coolsD) contracts and warms
22. Cloud formation is likely to occur in rising airbecause rising air
A) temperature of the air above the land massesis greater
B) specific heat of the land masses is greaterC) temperatures of the bodies of water are greaterD) air over the bodies of water becomes heavier
with additional water vapor
23. On sunny summer days, a breeze often develops thatblows from large bodies of water toward nearby landmasses because the

A) –25°C B) 7°CC) 3°C D) 4°C
24. The two thermometers below show the dry-bulb andwet-bulb temperatures of the air.
What is the approximate dewpoint temperature ofthe air?
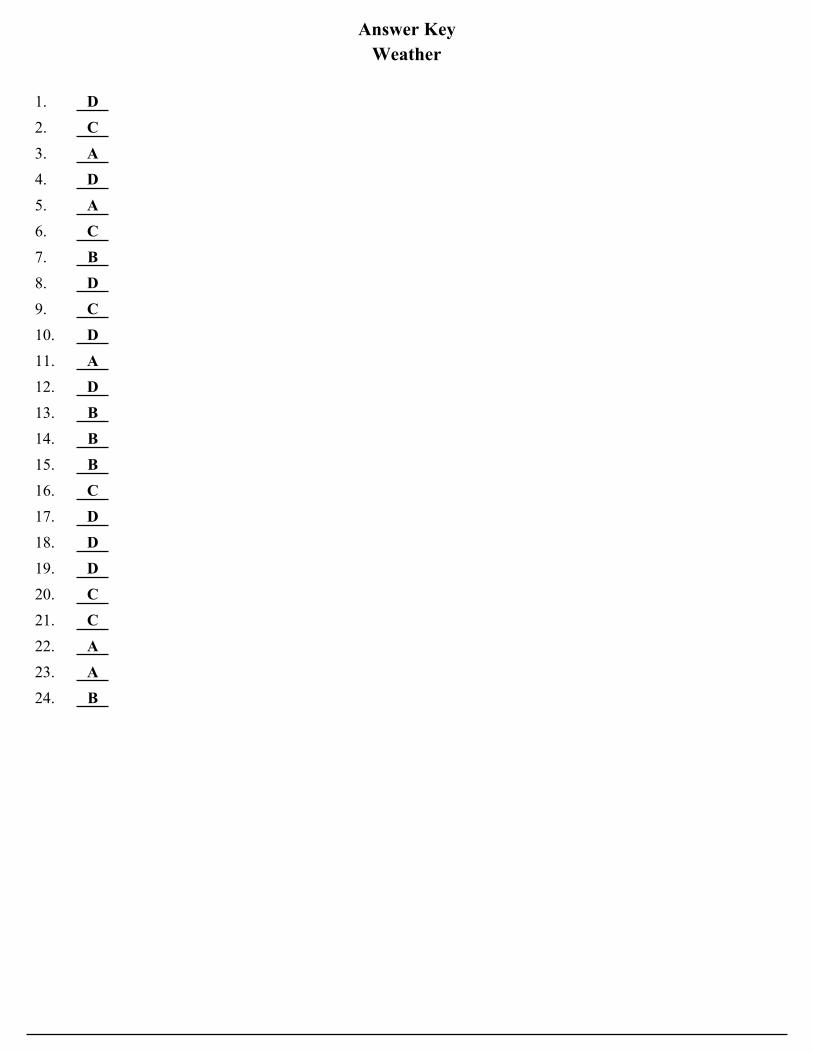
Answer KeyWeather
1. D2. C3. A4. D5. A6. C7. B8. D9. C10. D11. A12. D13. B14. B15. B16. C17. D18. D19. D20. C21. C22. A23. A24. B