Embed Size (px)
Citation preview
Copyright 2015. All rights reserved. This document has been reviewed and determined not to contain export controlled technical data.
Report of the 1st SWOT User Workshop La Jolla Beach & Tennis Club, La Jolla California -‐ 12 January 2015
Coordinators: Alice Andral, Emilie Bronner, Michel Dejus CNES Margaret Srinivasan NASA -‐ Jet Propulsion Lab, California Institute of Technology Craig Peterson NASA -‐ Stennis Space Center June 2015 swot.jpl.nasa.gov/applications

SWOT 1st User Workshop Report, La Jolla, 12 January 2015
1
1. Introduction The Surface Water and Ocean Topography mission (SWOT) is the first satellite to join both hydrology and oceanography communities in a single satellite mission. It will provide the first global determination of the ocean circulation, kinetic energy and dissipation at high resolution and the first global inventory of fresh water storage and its change on a global basis. It continues the 25 years of partnership between NASA and CNES of a series of highly successful altimetric oceanographic satellite missions. There are additional contributions from the Canadian Space Agency (CSA) and the United Kingdom Space Agency (UKSA). SWOT is recommended by the US National Research Council 2007 Decadal Survey (DS) and by the program for Earth Observation Future from the French space agency, CNES. The French government has also allocated funds from the French Investment Program to the development of the SWOT project. SWOT is a research mission, not an application mission: the SWOT mission does not develop applications; it develops the right products that encourage the appropriate use of SWOT observations.
However, a joint US-‐FR SWOT applications working group (SAWG) lead by Margaret Srinivasan, Craig Peterson, Alice Andral and Michel Dejus and including members of the SWOT Science Definition Team (SDT) and others involved in operational and applied uses of SWOT data has been formed. The role of this group is to direct the applications science focus and goals, provide links to operational agencies and data users, and to provide focus and guidance on solicitation and funding opportunities. The SAWG objectives are listed in the SWOT Application Plan available on line at http://swot.jpl.nasa.gov/applications. A guide for the proposed SWOT Early Adopters program is also available at that web location.
This first users’ workshop was an opportunity for early engagement of key user organizations (USGS, NOAA, Navy, MERCATOR, etc.). The workshop began with an overview of conventional altimetry, focusing on contributions to the development of applications (operational and research) in hydrology and oceanography, which was followed by an overview presentation on the SWOT mission and objectives; “SWOT 101”. A discussion of the expected SWOT data products followed; are they compatible with the latency and spatial requirements of users? What are the data access needs of users? Workshop participants included 27 people who attended on site, and 12 who attended the concurrent online webinar from a total of 41 registrants. Examples of existing and current applications relevant to SWOT were then highlighted. A tutorial demonstration on use of altimeter data for societal benefit, “Water Management Application Demonstration using Satellite-‐based Water Elevation Data“ followed. Discussions were fruitful and a recommendation to the SDT was made regarding the need of near real time products (<3days). The workshop agenda can be found in Appendix 1. Appendix 2 is the list of participants.
2. NADIR altimetry contribution – Emilie Bronner, CNES The primary objective of an altimetric mission is to accurately measure ocean surface topography to study global ocean circulation at mesoscale and large scales. The 23-‐year time series of nadir altimetry measurements has revolutionized the knowledge of the ocean-‐atmosphere interactions (El Niño Southern Oscillation, ocean climatologies) and has provided long term, global monitoring of ocean topography, currents, waves and wind. Many applications have been developed, especially in the operational realm, as a result of the availability of near real-‐time products. Scientists are also

SWOT 1st User Workshop Report, La Jolla, 12 January 2015
2
using altimetry to measure the height of inland water bodies such as lakes and large rivers, leading to data products such as water elevation time series, lakes volume changes and rivers rating curves.
Nadir altimetry is a mature technique after over 23 years of continuous observations. The current altimeter constellation is composed of four satellites: Saral-‐AliKa, Jason-‐2, CryoSat2, Hy-‐2A. In the coming months of 2015, Jason 3, Sentinel 3 and Hy-‐2B will be launched (Figure 1).
Figure 1. Current and future altimetry missions.
Conventional altimeters measure elevation along-‐track and from the nadir viewpoint of the satellite. The future of altimetry is built on the SWOT mission; a wide swath interferometer in Ka-‐band, the first satellite to address both ocean and hydrology objectives.
3. SWOT mission
3.1 SWOT 101 – Tamlin Pavelsky, UNC & Rosemary Morrow, LEGOS The key instrument payload of SWOT is the Ka-‐band Radar Interferometer (KaRIN) instrument. KaRIN contains two Ka-‐band SAR antennae at opposite ends of a 10-‐meter boom with both antennae transmitting and receiving the emitted radar pulses along both sides of the orbital track. KaRIN will make high-‐resolution wide swath altimetry measurements of 50km each. The interferometer resolves left and right ambiguities by illuminating only one side of the swath. Because of the near nadir geometry, the ground range resolution varies from about 70m near swath to 10m far swath.
SWOT will provide nearly global coverage of the earth between +/-‐ 77.6° latitude due to its inclination and a repeat period of 21 days. The +/-‐ 10km gap at the nadir track is filled by a conventional Jason-‐class altimeter. A radiometer for wet tropospheric delay and DORIS/GPSP/LRA for precise orbit determination are also on board. Information about the technical aspects of the SWOT mission can be found at http://swot.jpl.nasa.gov/science/technology/.
The SWOT science mission is planned to last 3 years and will be preceded by a fast orbit sampling phase that will facilitate calibration and validation objectives.

SWOT 1st User Workshop Report, La Jolla, 12 January 2015
3
SWOT will have two downlinks modes depending on the overflight surface:
-‐ Ocean low rate data will be produced by the onboard processor (OBP) continuously. Its resolution is currently proposed to be 1x1 km with a height error of 1.5 cm/km².
-‐ Over land, SWOT works in a high-‐resolution mode turned on by a mask with a presuming factor of two to reduce rate data. It will resolve 100 m wide rivers (as a baseline, with a goal of 50m) and lakes, wetlands and reservoirs of 250m² in size. The water level elevations will have an accuracy of 10 cm and a slope accuracy of 1 cm/1 km over 10 km.
-‐ In coastal regions, the high-‐rate data would be turned on when the nadir measurement is three km from land.
Conventional altimetry has provided measurements for the last 23 years of sea level variations at scales larger than 200km. But ocean currents and eddies at scales smaller than 200 km contain most of the kinetic energy of the ocean and play key roles in the transport of heat, carbon and nutrients. These ocean features affect climate through modulation of sea surface temperature and heat flux, as well as the oceanic uptake of carbon from the atmosphere. The primary oceanographic objectives of the SWOT mission are, therefore, to observe the ocean mesoscale and submesoscale circulation at spatial resolutions of 15 km and larger, providing the missing link between 15 and 200 km for ocean climate studies.
The hydrologic science objectives for the SWOT mission are to provide a global inventory of all terrestrial surface water bodies with areas exceeding 250m2 (lakes, reservoirs, wetlands) and >10km long river reaches whose width exceeds 100m (requirement). These data are sufficient to monitor the global patterns of change in storage of terrestrial surface water bodies and river discharge at sub-‐monthly, seasonal, and annual time scales. The final determination of specific SWOT data products is still evolving and is targeted primarily for science users.
3.2 AirSWOT – Greg Sadowy, JPL AirSWOT is the calibration/validation and science support instrument for the SWOT mission. The key AirSWOT sensor, the Ka-‐band SWOT Phenomenology Airborne Radar (KaSPAR), was developed by Remote Sensing Solutions (RSS) and was funded by the NASA SBIR program. AirSWOT will be used for phenomenology studies for development of KaRIN instrument and algorithm development, for calibration-‐validation of SWOT, and for science investigations. Status and current plans for transitioning the instrument from experimental to operational status was discussed. From February through June of 2015, the AirSWOT team will undertake a series of experiment campaigns that will serve to validate the AirSWOT data products, provide engineering data for the SWOT project, and provide science data for SWOT researchers. Many activities are planned for 2015 including; ocean validation, hydrology validation, and campaigns in the Mississippi Delta, and the Alaskan Yukon, and a region of Canada.
AirSWOT will provide a unique measurement capability to the science and applications communities and will be a significant resource for SWOT applications. Data products are very preliminary and require further validation, however. For more information about AirSWOT see swot.jpl.nasa.gov/airswot.
3.3 Simulated and mission data products – Ernesto Rodriguez, JPL One known characteristic of the planned SWOT data products is that they will certainly constitute, “Big Data”. This term applies to data sets so large or complex that traditional processing

SWOT 1st User Workshop Report, La Jolla, 12 January 2015
4
methodologies are challenging in a multitude of ways (storage, analysis, curation, visualization, etc.). Ernesto Rodriguez described the current approach and perspective of the SWOT Project on data products, and the relevance of key decisions to applications. The key to developing a viable user community is to understand the needs of the users now…in the years prior to launch. Some of the key elements of a successful user interface include;
• Understanding who the user community is, • Understanding how the data will be used, • Developing standard and state-‐of-‐the-‐art data and storage formats, • Working with the appropriate data distribution organizations to provide subsetting and other
tools.
The primary data products will be swath sea surface height (SSH) measurements, and surface water products. Characteristics of the primary data products relevant to applications are outlined below;
• Ocean data products (level 2); o Low Resolution (LR), 2 swaths, 10 to 60 km from nadir o On-‐board-‐processed data products; 9 squinted interferograms o Ocean products, Earth-‐fixed, swath-‐aligned 1 km grid with SSH, slope, sigma0, tides,
mean sea surface, o A goal of providing wind speed and significant wave height, o Jason-‐class nadir altimeter measurements.
• Hydrology data products (level 2); o Consistent with GIS and other standard tools, o High rate (HR) data in pixel cloud format; lat-‐long, height, area, orientation,
classification (% water), DEM height, range corrections, o Vector products; rivers, lakes, and data tied to other databases
• Coastal data products (HR) based on seasonally-‐corrected masks; o Height, sigma0, area, orientation, o HR data over coastal ocean could be processed to very fine resolutions (>~70 m) o Localized products containing both LR and HR data are possible.
Simulated ocean data products exist and can be accessed by request of the project. A hydrology data product simulator called, ‘RiverObs Hydrology Vectorizor’, which transforms the point cloud data into vectors, is development by members of the science team. It will provide simulated height & slope results for large rivers.
4. Examples of existing and current applications relevant to SWOT
4.1 Hydrology – Ed Beighley, Northeastern U., Faisal Hossain, UW, & Kostas Andreadis, JPL,
Three presentations focused on hydrology:
1. Simulating streamflow on regulated rivers and reservoir storage management during flood by Ed Beighley, Northeastern Univ.

SWOT 1st User Workshop Report, La Jolla, 12 January 2015
5
2. Improving flood warning systems and early warning forecasts in Bangladesh by Faisal Hossain, UW, and
3. A discussion on several SWOT-‐based hydrology applications by Kostas Andreadis, JPL.
Regulation of river discharge by dams and reservoirs is common for flood control, hydropower or water supply. Capturing regulated behaviour of these systems is a significant challenge, especially during flood events, where knowledge of detailed operation rules and strategies is needed. One research study on the Cumberland River basin aims to evaluate hourly streamflow estimates and the sensitivity to repeat cycle and operational period. The results showed that as the revisit cycle increases, mean error increases (1 and 7-‐day results are similar) and at least one year of sampling is necessary for model performance.
Both presentations on flood modeling stressed on the value of assimilating existing altimeter data into flood models and the importance of having near real time data even for SWOT and a synergistic use of other satellite missions (Landsat, SMAP, SMOS, Sentinel satellites, other altimetry mission, etc.). SWOT can provide water stage and flood extent (event-‐based) information.
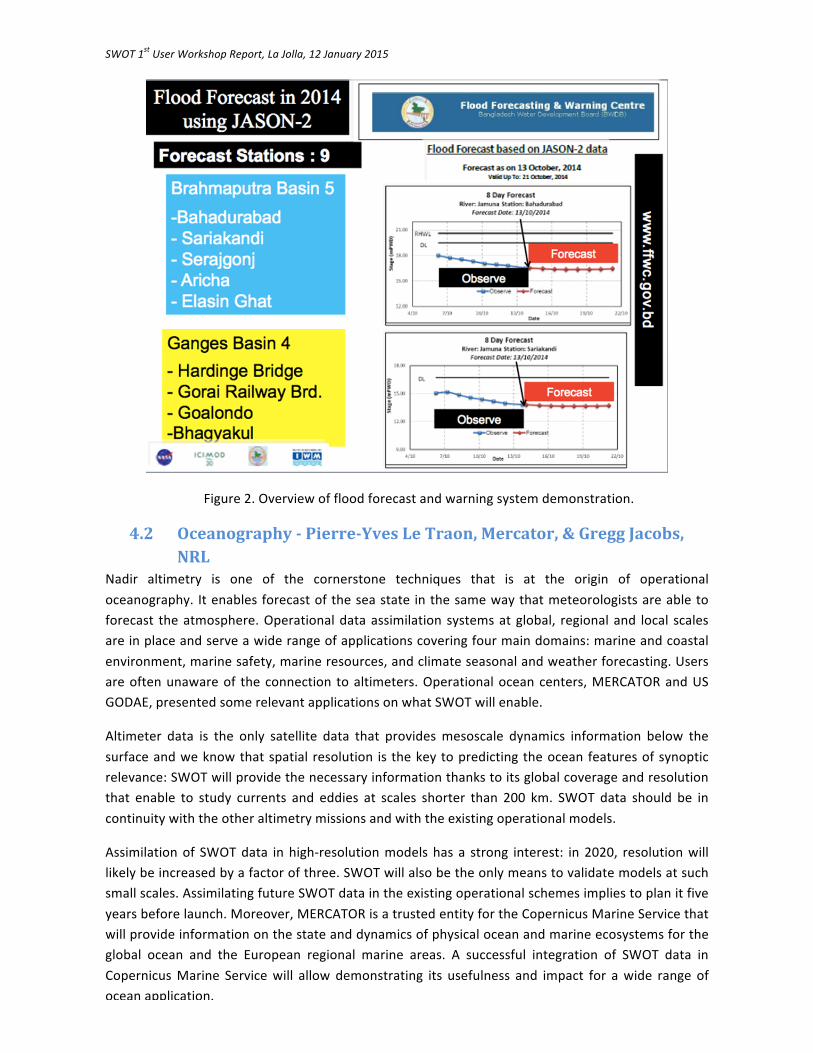
4.4 4.2 Jason 2 Toolbox and demo by Faisal Hossain, UW The flood forecasting and warning center (FFWC) in Bangladesh used JASON-‐2 IGDR observations in their flood forecasting model from nine virtual stations during the monsoon of 2014. Using the correlation between the Jason-‐2 data that of upper catchment and observed water level data inside Bangladesh, the FFWC is able to generate flood forecast up to eight-‐days lead time with reasonable accuracy, compare with five days lead time without Jason-‐2 virtual stations.
A demonstration was presented during the workshop. An easy-‐to-‐use interactive tool has been developed to extract upstream data of the virtual stations. The first step is to download the latest Jason-‐2 data on the AVISO+ website: ftp://avisoftp.cnes.fr/AVISO/pub/jason-‐2/igdr/latest_data using the Matlab program. Upstream water elevation data is determined for the day and then these elevation data are assimilated into a hydro-‐dynamic models, from which the eight-‐day flood can be forecasted.
Note: Instead of using IGDR data, it could be interesting to use OGDR (operational Geophysical Data Record) observations that are available on the AVISO website with a 3 to 5 hour delay after the measure.
SWOT 1st User Workshop Report, La Jolla, 12 January 2015
6
Figure 2. Overview of flood forecast and warning system demonstration.
4.2 Oceanography -‐ Pierre-‐Yves Le Traon, Mercator, & Gregg Jacobs, NRL
Nadir altimetry is one of the cornerstone techniques that is at the origin of operational oceanography. It enables forecast of the sea state in the same way that meteorologists are able to forecast the atmosphere. Operational data assimilation systems at global, regional and local scales are in place and serve a wide range of applications covering four main domains: marine and coastal environment, marine safety, marine resources, and climate seasonal and weather forecasting. Users are often unaware of the connection to altimeters. Operational ocean centers, MERCATOR and US GODAE, presented some relevant applications on what SWOT will enable.
Altimeter data is the only satellite data that provides mesoscale dynamics information below the surface and we know that spatial resolution is the key to predicting the ocean features of synoptic relevance: SWOT will provide the necessary information thanks to its global coverage and resolution that enable to study currents and eddies at scales shorter than 200 km. SWOT data should be in continuity with the other altimetry missions and with the existing operational models.
Assimilation of SWOT data in high-‐resolution models has a strong interest: in 2020, resolution will likely be increased by a factor of three. SWOT will also be the only means to validate models at such small scales. Assimilating future SWOT data in the existing operational schemes implies to plan it five years before launch. Moreover, MERCATOR is a trusted entity for the Copernicus Marine Service that will provide information on the state and dynamics of physical ocean and marine ecosystems for the global ocean and the European regional marine areas. A successful integration of SWOT data in Copernicus Marine Service will allow demonstrating its usefulness and impact for a wide range of ocean application.

SWOT 1st User Workshop Report, La Jolla, 12 January 2015
7
Both Pierre-‐Yves Le Traon and Gregg Jacobs stressed the necessity to have SWOT data product latency lower than 2 or 3 days maximum instead of 45 days as currently estimated.
4.3 Estuary and delta applications – Yi Chao, RRS Coastal and estuarine areas are subject to strong socio-‐economic issues. They also lack adequate gauging stations in order to understand the water level variability. For this reason, the models are calibrated/validated with few gauging stations, or none at all. SWOT will provide spatial information in 2D on the water levels in these sensitive zones under different hydrodynamic conditions. But estuarine and coastal areas are complex (tides, waves, storm surges, etc.). Enabling global hydrology will be an enormous advancement for coastal forecasts. If estuarine and coastal areas are better modeled as a result of the availability of SWOT data, there could be many potential users and many possible applications.
Studies on how SWOT will help to understand these sensitive areas are ongoing. Yi Chao presented the preliminary results obtained using SWOT simulator in the San Francisco bay. Those results are encouraging. Ongoing study and future collaborations (input/feedback needed) to use the model and SWOT simulated data to address questions related to data retrieval/processing and bay/estuary/river science will be important.
5. Conclusion and first recommendation to SDT
SWOT is a very innovative and ambitious mission. It will meet the needs of two communities, oceanography and hydrology. Although SWOT is a research mission, both NASA and CNES want SWOT data help to leverage new applications, and have high expectations for this particularly in the area of hydrology. For the ocean domain, the plan is to build on the elements currently in place in the framework of conventional altimetry and extend it to the new users communities interested in the high-‐resolution data products that will be provided by SWOT. In inland water (lakes, reservoirs, rivers on the order of 50m – 100m wide), we expect the creation of new applications, thus offering opportunities for water resources management, estuaries, coastal management, flood modeling, and propagation of epidemics, among others.
This presentations in this workshop made clear that past and present altimetry observations are essential for understand ocean circulation, supporting ocean operational centers, and are very promising in hydrology for flood forecasting, flood extent, water stage, storage change, and river discharge. To achieve these goals, a synergistic use of other sensors and mission data sets (visible, infrared, SMAP, SMOS, Landsat, GRACE, etc.) will be necessary.
SWOT will continue in continuity with existing altimeters. SWOT data will certainly have high value in model validation and improvements, as well as in climatology studies. In order for it to have high value for some applied uses of the data, a near real time capability will be key. Many applications presented at the workshop clearly demonstrated the high value of a data latency of less than 3 days. The SAWG is suggesting to the SDT that a study be conducted to evaluate the requirements and possible methodology of developing near real-‐time capabilities for SWOT:
“We wish to accommodate the need for operational users, R&D organizations, and stakeholders to generate and transition to SWOT value-‐added products and models for

SWOT 1st User Workshop Report, La Jolla, 12 January 2015
8
decision-‐making purposes for short-‐term requirements (i.e., disaster and emergency situations, facilities protection, services). The availability of NRT data capability can significantly increase the success of SWOT with respect to societal benefits.
The SWOT Applications Working Group (SAWG) proposes that a study be conducted to explore the development of one or more near real-‐time (NRT) data products that will support operational applications. We suggest that a timeframe of data return within a range of hours to a few days (rather than the current 45-‐day requirement) for L2 hydrology data products be evaluated for feasibility, both technically and financially. For ocean products, we would like to see the goal requirement described in section 2.6.2c to be realized
We acknowledge that funding for this study is not in the current project budget. The study may include exploration of compromise options such as: a) selective availability of quick look data based on time-‐sensitive application needs (i.e., major disasters -‐ dam break, oil spill) b) provision for non-‐project contributions of additional downlink infrastructure from application stakeholder community. For operational oceanography, systematic input of NRT data is required for ocean models.”
We would support the SWOT Project in carrying out this study to determine the feasibility of developing near real-‐time SWOT data products, and request that this study be completed before the data products suite is finalized.
The goals of the SAWG include;
1. Provide feedback on data product development with respect to applications, 2. Provide feedback to the SWOT mission on applications-‐relevant issues, and 3. Assess requirements and benefits of data products to a broad user community.
In order to better understand the users’ needs and to identify the ways in which the SWOT mission may be useful to operational, private, institutional, and other individual users and organizations, the SAWG has developed a SWOT user survey which will be available on the SWOT Applications website in mid-‐2015; http://swot.jpl.nasa.gov/applications. The survey will contain questions about user requirements for data products, temporal frequency, data latency, format, volume, and access, and domains of interest and general user information.

SWOT 1st User Workshop Report, La Jolla, 12 January 2015
9
Appendix 1. Agenda
-‐ Welcome/introductions: M. Srinivasan (JPL)/A. Andral (CNES)
-‐ Nadir Altimeter overview: E. Bronner (CNES)
-‐ SWOT 101: T. Pavelsky (UNC) and R. Morrow (LEGOS)
-‐ AirSWOT overview, status, capabilities: G. Sadowy (JPL)
-‐ Examples of existing and current applications relevant to SWOT:
-‐ F. Hossain (UW): Jason-2 toolbox, operational flood forecasting
-‐ Y. Chao (RSS) (via remote access): Estuary/delta applications
-‐ P.Y. LeTraon (CNES): Overview of operational oceanography applications from
Mercator Ocean & Copernicus
-‐ G. Jacobs (ONR): Operational ocean applications
-‐ K. Andreadis (JPL) (via remote access): Flood modeling
-‐ E. Beighley (NEU): Tennessee Valley reservoirs
-‐ Discu
-‐ Water Management Application Demo using Satellite-based Water Elevation Data: F.
Hossain (UW)
-‐ Simulated and mission data products: E. Rodriguez (JPL)
-‐ Data products discussion: P. Callahan (JPL), E. Rodriguez (JPL)
-‐ Feedback from participants: Facilitators: A. Andral (CNES), C. Peterson (Stennis), M.
Srinivasan (JPL), F. Hossain (UW), T. Pavelsky (UNC), R. Morrow (LEGOS)

SWOT 1st User Workshop Report, La Jolla, 12 January 2015
10
Appendix 2. List of attendees