Embed Size (px)
Citation preview

1st Quarterly Report of the KWS GroupFiscal Year 2013/2014July 1 to September 30, 2013

2 KWS SAAT AG 1st Quarterly Report 2013/2014
Guidance for fiscal 2013/2014 (ending June 30, 2014)
• Guidanceforthefullyearconfirmed,despiterestrainedtrendinthe1stquarter.Followingcompletionofthefirstquarter,weexpecttheKWSGrouptogrowitsnetsalesbyupto5%toaround€1.2billion(1,147.2million)*.
• Weexpectouroperatingincome(EBIT)tobereducedbyapproximately8%(previousyear:€150.7million)asaresultofourhighexpenditureonresearchanddevelopmentaswellasonexpandingourseedproductionandstrengtheningdistribution.
• TheEBITmarginwilllikelybe11.5%(13.1%).
• Theresearchanddevelopmentbudgetforthecurrentfiscalyearisbeingraisedby13%toabout€159(140.8)million.
in € million
Outlook for the segments and the Group
Net sales in fiscal 2012/2013Net sales forecast for fiscal 2013/2014
Corn Sugarbeet Cereals Total**
701.7762 e
328.6 321 e
111.7 108 e
1,147.21,195 e
EBIT margins
in %
Forecast Fiscal year 2013/2014 Fiscal year 2012/2013
Corn 13.3 e 13.1
Sugarbeet 20.2 e 22.4
Cereals 17.6 e 24.0
Total** 11.5 e 13.1
* The figures in parentheses are those for the previous year. ** Includes net sales and EBIT for the Corporate Segment, which are not explicitly shown in detail here.

3 KWS SAAT AG 1st Quarterly Report 2013/2014
Overview of the 1st quarter of 2013/2014
KWS GroupNetsalesmovedlowerandEBITisreducedasthecompanyintensifiesexpansionofR&Danddistribution.•Netsaleswere€103.1(113.1)million,downby8.8%•EBITdroppedby75.2%to€–38.9(–22.2)million
Corn SegmentNetsalesgrew,inparticularinnewmarkets.
•Netsales:€36.2(32.7)million;change:+10.7%•EBIT:€–28.1(–24.4)million;change:–15.2%
Sugarbeet SegmentShiftsbetweenquartersandhigherexpensesimpactedthesegment’snetsalesandincome.
•Netsales:€6.8(9.0)million;change:–24.4%•EBIT:€–18.0(–14.3)million;change:–25.9%
Cereals SegmentCerealsbusinesswasweakeryearonyearduetounfavorablepricetrendsinthemarketforcerealsforconsumption.
•Netsales:€58.7(69.5)million;change:–15.5%•EBIT:€20.7(27.6)million;change:–25.0%
CorporateExpansionofactivitiesasplannedinallcentralfunctions.
•Netsales:€1.4(1.9)million;change:–26.3%•EBIT:€–13.5(–11.1)million;change:–21.6%

4 KWS SAAT AG 1st Quarterly Report 2013/2014
1st quarter 2013/2014
1st quarter2012/2013
Net sales and income
Net sales € million 103.1 113.1
EBIT € million –38.9 –22.2
Net income for the period € million –29.3 –16.4
Capital expenditure
Capital expenditure on property, plant and equipment € million 18.1 17.2
Capital expenditure on intangible assets € million 0.3 0.5
Investments in financial assets € million 0.0 0.0
Total capital expenditure € million 18.4 17.7
Depreciation, amortization and write-downs € million 9.1 8.7
Capital structure
Total assets € million 1,147.1 1,026.7
Equity € million 612.0 570.3
Equity ratio % 53.4 55.5
Net borrowings € million 42.4 23.8
Net borrowings as a % of equity (gearing) % 6.9 4.2
Employees in the KWS Group 4,819 4,423
Share
Number of shares 6,600,000 6,600,000
Last day of trading in the first three monthsSept. 30,
2013Sept. 28,
2012
Closing price on last day of trading in first three months of the year € 257.0 207.4
Market capitalization on last day of trading in first three months of the year € million 1,969 1,369
Market capitalization of free float on last day of trading in first three months of the year € million 511 412
* The first quarter (July to September) contributes only around 10% of the KWS Group’s annual net sales due to the strongly seasonal nature of our business. Only our cereal business is largely over in this period. Initial net sales from corn and sugarbeet hybrids in the southern hemisphere – in Argentina, Brazil and Chile – can also be registered in the first quarter. However, our main markets are in the northern hemisphere, where corn and sugarbeet are not sown until the spring. Our structural costs, on the other hand, are spread evenly over the entire fiscal year.
The KWS Group at a glance 1st quarter of 2013/2014*

5 KWS SAAT AG 1st Quarterly Report 2013/2014
1st Quarterly Report 2013/2014
Business development in the first quarter
Income statement
in € million1st quarter
2013/2014 Previous year
Net sales 103.1 113.1
Operating income –38.9 –22.2
Net financial income/expenses –2.7 –1.5
Result of ordinary activities –41.6 –23.7
Income taxes –12.3 –7.3
Net income for the period –29.3 –16.4
of which shareholders of KWS SAAT AG –32.0 –19.5
of which minority interest 2.7 3.1
Earnings per share (€) –4.85 –2.96
KWS GroupKWS’ growth is based on systematic expansion of our research and breeding activities and our distribution and production units over many years. That is why we increase our budgets year after year. In the current fiscal year we have earmarked additional expenditure of around €40 million, which is spread fairly evenly over the four quarters. However, our growth is typi-cally seen in the second half of our fiscal year (ending June 30) – when our main contributors to net sales, corn and sugarbeet, are primarily sold. Revenue in the first quarter therefore falls relative to annual net sales, whereas expenses increase in line with our planning. Ultimately, that necessarily results in lower net income for the first half of the year, which explains the 75% drop in income for the first quarter. On the back of weaker cereals business, the KWS Group’s net sales in the first quarter fell by 8.8% to €103.1 (113.1) million. Operating income (EBIT) was € –38.9 (–22.2) million.
Net financial income/expenses contain only low interest income from the positive net cash balance. Interest expense from the financing of business expansion in South America impacted net financial income/expense in the first quarter. The figure for income taxes was obtained by applying the effective tax rate per company planned for the fiscal year as a whole to the pre-tax profits for the quarter.
Statement of comprehensive income
in € million1st quarter
2013/2014 Previous year
Net income for the period –29.3 –16.4
Currency translation for foreign subsidiaries –9.0 –4.9
Comprehensive income for the period –38.3 –21.3
of which shareholders of KWS SAAT AG –40.7 –24.5
of which minority interest 2.4 3.2
6 KWS SAAT AG 1st Quarterly Report 2013/2014
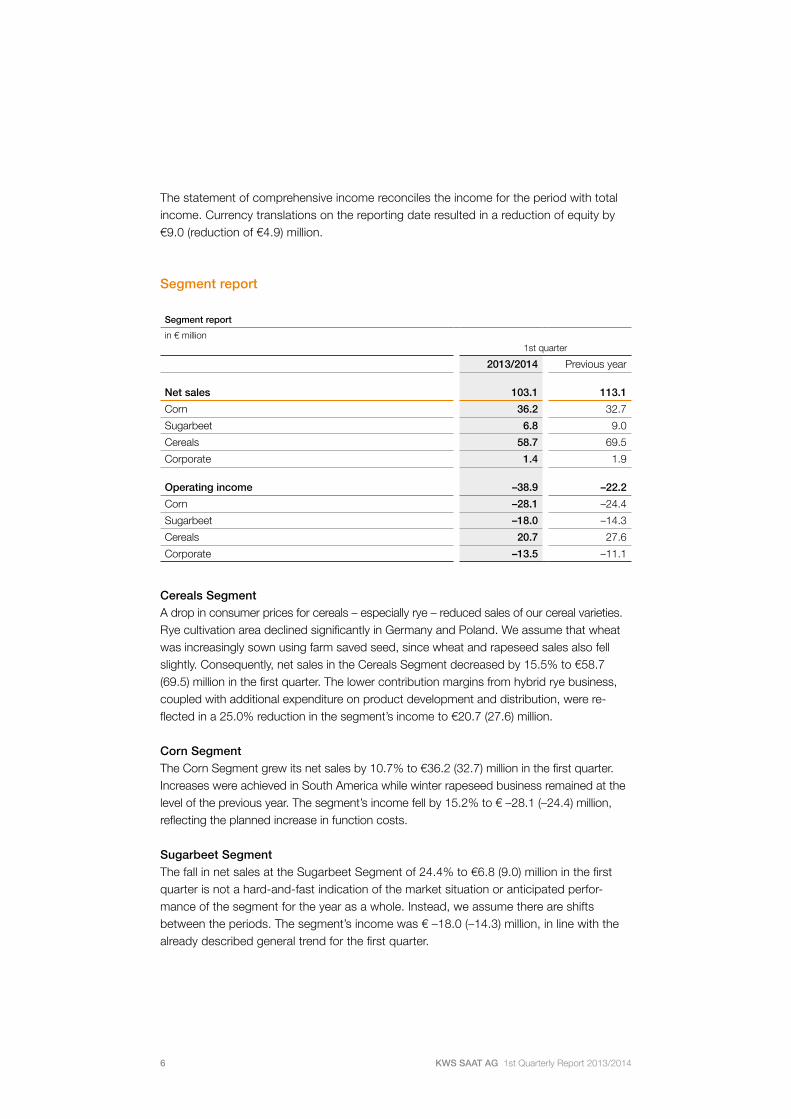
The statement of comprehensive income reconciles the income for the period with total income. Currency translations on the reporting date resulted in a reduction of equity by €9.0 (reduction of €4.9) million.
Segment report
Segment report
in € million1st quarter
2013/2014 Previous year
Net sales 103.1 113.1
Corn 36.2 32.7
Sugarbeet 6.8 9.0
Cereals 58.7 69.5
Corporate 1.4 1.9
Operating income –38.9 –22.2
Corn –28.1 –24.4
Sugarbeet –18.0 –14.3
Cereals 20.7 27.6
Corporate –13.5 –11.1
Cereals SegmentA drop in consumer prices for cereals – especially rye – reduced sales of our cereal varieties. Rye cultivation area declined significantly in Germany and Poland. We assume that wheat was increasingly sown using farm saved seed, since wheat and rapeseed sales also fell slightly. Consequently, net sales in the Cereals Segment decreased by 15.5% to €58.7 (69.5) million in the first quarter. The lower contribution margins from hybrid rye business, coupled with additional expenditure on product development and distribution, were re-flected in a 25.0% reduction in the segment’s income to €20.7 (27.6) million. Corn SegmentThe Corn Segment grew its net sales by 10.7% to €36.2 (32.7) million in the first quarter. Increases were achieved in South America while winter rapeseed business remained at the level of the previous year. The segment’s income fell by 15.2% to € –28.1 (–24.4) million, reflecting the planned increase in function costs. Sugarbeet SegmentThe fall in net sales at the Sugarbeet Segment of 24.4% to €6.8 (9.0) million in the first quarter is not a hard-and-fast indication of the market situation or anticipated perfor-mance of the segment for the year as a whole. Instead, we assume there are shifts between the periods. The segment’s income was € –18.0 (–14.3) million, in line with the already described general trend for the first quarter.

7 KWS SAAT AG 1st Quarterly Report 2013/2014
CorporateOur cross-segment function costs and research expenditures are reported in the Corporate Segment. On the back of net sales of €1.4 (1.9) million – mainly from our farms in Einbeck, Wetze, Wiebrechtshausen and Klein Wanzleben – the cross-segment costs in the first three months of the fiscal year resulted in income of € –13.5 (–11.1) million.
Capital expenditure
Capital expenditure
in € million1st quarter
2013/2014 Previous year
Total 18.4 17.7
Corn 13.1 7.3
Sugarbeet 2.9 6.8
Cereals 1.1 2.2
Corporate 1.3 1.4
In the first quarter, KWS invested €18.1 (17.2) million in property, plant and equipment. As in previous years, it is therefore showing capital expenditure well above depreciation at €9.1 (8.7) million. The main single investments related to expenditures for the expan-sion of corn production capacities in North America and France.
Out of total capital expenditure of €18.4 (17.7) million within the KWS Group, 71.2% was in the Corn Segment, 15.8% in the Sugarbeet Segment, 6.0% in the Cereals Segment and 7.0% in the Corporate Segment.
in %
Capital expenditure by region
53.3 (44.7)North and South America
21.1 (18.5)Germany
21.8 (35.9)European Union(excl. Germany)
3.8 (0.9)Rest of world

8 KWS SAAT AG 1st Quarterly Report 2013/2014
Balance sheet of the KWS Group
Assets
in € millionSept. 30, 2013 June 30, 2013 Sept. 30, 2012
Intangible assets 104.5 101.9 109.3
Property, plant and equipment 295.3 287.6 270.0
Financial assets 1.6 9.8 4.6
Noncurrent tax assets 5.6 5.7 6.2
Deferred tax assets 63.8 44.5 49.6
Noncurrent assets 470.8 449.5 439.7
Inventories and biological assets 207.9 144.4 187.2
Trade receivables 271.1 359.9 258.9
Marketable securities 44.5 100.9 23.0
Cash and cash equivalents 73.3 101.5 58.4
Current tax assets 28.5 24.4 21.8
Other current assets 51.0 40.1 37.7
Current assets 676.3 771.2 587.0
Total assets 1,147.1 1,220.7 1,026.7
Equity and Liabilities
in € million
Sept. 30, 2013 June 30, 2013 Sept. 30, 2012
Subscribed capital 19.8 19.8 19.8
Capital reserve 5.5 5.5 5.5
Retained earnings 552.5 593.2 512.0
Minority interests 34.2 31.8 33.0
Equity 612.0 650.3 570.3
Long-term provisions 90.2 91.7 91.1
Long-term borrowings 96.2 98.5 46.5
Trade payables 1.7 1.7 1.7
Deferred tax liabilities 29.0 29.7 35.9
Other long-term liabilities 10.5 9.1 8.1
Noncurrent liabilities 227.6 230.7 183.3
Short-term provisions 80.3 131.4 70.9
Short-term borrowings 64.0 33.3 58.7
Trade payables 84.2 82.7 74.6
Current tax payables 26.1 31.9 27.7
Other liabilities 52.9 60.4 41.2
Current liabilities 307.5 339.7 273.1
Liabilities 535.1 570.4 456.4
Total equity and liabilities 1,147.1 1,220.7 1,026.7

9 KWS SAAT AG 1st Quarterly Report 2013/2014
The increase in inventories is due to the absorption of the new harvest in 2013. The potential risks of realization were reflected by additional adjustments.
More than 50% of our accounts receivable, which at June 30, 2013, were €50 million higher year on year due to increases in sales volumes, were settled within the first three months of the new fiscal year. Given the net sales in the first quarter, trade receivables at September 30, 2013, were therefore only around €12 million higher than a year ago. Net financial debt at September 30, 2013, was €42.4 (23.8) million, following a net financial balance of €70.6 (75.9) million on June 30, 2013.
The long-term provisions increased by €25 million, which was taken directly to equity, as a result of the revaluation of pension provisions in accordance with IAS 19R, and the figure for the previous year was adjusted accordingly. The short-term provisions include royalties that are not yet due on the higher net sales of the previous year. The long-term financial borrowings also include our option to purchase further shares in the Brazilian production and distribution company.
Despite the seasonally related negative income, the equity ratio at September 30, 2013, was 53.4% after 53.3% on June 30, 2013.
Cash flow statement
Cash flow statement
in € million1st quarter
2013/2014 Previous year
Net income for the period –29.3 –16.4
Cash earnings –50.3 –31.0
Funds tied up in net current assets –42.7 –56.5
Net cash from operating activities –93.0 –87.5
Net cash from investing activities –18.3 –40.3
Net cash from financing activities 28.7 26.8
Change in cash and cash equivalents –82.6 –101.0
Cash and cash equivalents at beginning of period 202.4 183.0
Changes in cash and cash equivalents due to exchanging rate, consolidated group and measurement changes –2.0 –0.6
Cash and cash equivalents at end of period 117.8 81.4
Despite lower net income for the period and the sharp increase in inventories, net cash used in operating activities was at the level of the previous year at €93.0 million.

10 KWS SAAT AG 1st Quarterly Report 2013/2014
Net cash used in investing activities was €18.3 million compared with €40.3 million last year, when there was the burden of the purchase price for our commitment in Brazil. The raising of loans in our growth markets resulted in net cash from financing activities of €28.7 million following €26.8 million in the previous year.
Statements of changes in equity
Statement of changes in equity of the KWS Group
in € million Group interests
Minority interests
Group equity
Balance as at June 30, 2012 578.6 24.5 603.1
Adjustment for IAS 19R –16.8 –0.4 –17.2
Balance as at June 30, 2012 (adjusted) 561.8 24.1 585.9
Dividends paid 0.0 0.0 0.0
Changes in consolidated companies 0.0 0.0 0.0
Other changes 0.0 5.7 5.7
Consolidated net income for the period –19.5 3.1 –16.4
Other gains (losses) –5.0 0.1 –4.9
Total consolidated gains (losses) –24.5 3.2 –21.3
Balance as at September 30, 2012 537.3 33.0 570.3
Balance as at June 30, 2013 635.3 32.2 667.5
Adjustment for IAS 19R –16.8 –0.4 –17.2
Balance as at June 30, 2013 (adjusted) 618.5 31.8 650.3
Dividends paid 0.0 0.0 0.0
Changes in consolidated companies 0.0 0.0 0.0
Other changes 0.0 0.0 0.0
Consolidated net income for the period –32.0 2.7 –29.3
Other gains (losses) –8.7 –0.3 –9.0
Total consolidated gains (losses) –40.7 2.4 –38.3
Balance as at September 30, 2013 577.8 34.2 612.0
Equity in the first quarter is usually impacted by the seasonally related negative profit for the quarter. The other changes relate to the adjustments required in fiscal 2013/2014 in accordance with IAS 8 as a result of the change in pension provisions under IAS 19R. The KWS Group’s equity was also reduced by a total of €9.0 (4.9) million resulting from currency translation for foreign subsidiaries on the balance sheet date and was not recognized in profit. This was attributable in particular to weaker currencies in South America and Eastern Europe.
No dividends were paid out in the period under review.

11 KWS SAAT AG 1st Quarterly Report 2013/2014
Employees
Employees by regions
1st quarter*
2013/2014 Previous year
Germany 1,856 1,703
Europe (excluding Germany) 1,351 1,245
Americas 1,433 1,340
Other countries 179 135
Total 4,819 4,423
*at quarter end
At September 30, 2013, we had 4,819 (4,423) employees worldwide. The growth in the workforce was spread evenly over all regions. In line with our planning, just over 10% more people will be employed at the KWS Group at the end of the current fiscal year, compared with the previous year’s total of 4,443.
Risks and opportunities
You can find detailed information on the risk management system and the risk situation at the Group in the section “Risks for future development” on pages 42–45 of the 2012/2013 Annual Report.
We address the liquidity risk with professional cash management, sufficient long-term, syndicated credit lines and a high equity ratio. Our loan agreements include “financial covenants”, compliance with which has been ensured at all times to date. KWS uses extensive trade credit insurance to minimize the risk of losing receivables in risky regions and business segments. We also pursue an active receivables management policy so that impending payment defaults can be avoided.
We continue to see opportunities in our intensified research and development activities and in the planned expansion of our production and sales structures.
There has been no significant change in the situation as to opportunities and risk at the KWS Group compared with at June 30, 2013. Risks that jeopardize the company’s exis-tence are not currently discernible.

12 KWS SAAT AG 1st Quarterly Report 2013/2014
Report on events after the balance sheet date
There were also no events after September 30, 2013, that can be expected to have a significant impact on the KWS Group’s earnings, financial position and assets.
Forecast for 2013/2014
KWS GroupWe expect net sales for the current fiscal year 2013/2014 totaling about €1.2 billion (previous year: €1,147 million). Given weaker cereals business and slightly lower net sales at the Sugarbeet Segment, the rise in net sales of up to 5% is expected to be achieved solely thanks to the Corn Segment. After the excellent results of previous years, which were shaped by positive special effects, we currently anticipate an EBIT margin of 11.5% (13.1%). The lower EBIT margin is largely due to the up-front costs for developing our new markets and products. In the current fiscal year, we will spend around €159 (140.8) million on product development alone in order to advance our still young breeding pro-grams (tropical corn, corn for Eastern Europe, potatoes, winter wheat for North America, and sunflowers) and the technology joint venture GENECTIVE with our French partner Vilmorin. We are also underpinning our future growth with large investments of about €100 million. We need to expand our capacities significantly, above all in corn production, to be able to achieve the planned increases in sales volumes.
Corn SegmentThe greatest growth potential at the KWS Group is again in the Corn Segment. However, the first quarter, where only up to 5% of net sales for the year are generated, is not an indicator for the year as whole. The crucial factor for the segment will be the price of corn for consumption in the spring of 2014. In particular, that will sway the decision of farmers in North America as to what to grow. Thanks to our outstanding portfolio of varieties, an increase of around 9% in net sales (previous year: €701.7 million) and income (previous year: €92.0 million) will likely be possible.

13 KWS SAAT AG 1st Quarterly Report 2013/2014
Sugarbeet SegmentSugarbeet cultivation area in the 2013 sowing season fell to 4.2 (4.7) million hectares. Although that impacted our seed sales, we were able to compensate for it thanks to our high-yielding varieties and strong market share. KWS built on its leading market position in this segment of the industry worldwide. It can be assumed that there will not be further reductions in area – in particular in the EU 28 – in the coming cultivation period, so we see opportunities there. Trends in North America will also be key to this segment. It will hardly be able to maintain the recent market share of more than 70%, with the result that we anticipate that net sales from sugarbeet seed will decline overall by around 4%. It will only be possible to compensate for that in part through growth in seed potato business. We expect net sales at the segment to fall slightly from the previous year (€328.6 million) and, due to higher function costs, its income (previous year: €73.5 million) to drop by just over 10%.
Cereals SegmentAs far as can be seen at present, net sales for the Cereals Segment will be around €108 (111.7) million – at a very high level despite the year-on-year decline. Above all, our hybrid rye business, with its strong contribution margins, has suffered. However, it experienced a special boost last year because rye prices were above those for wheat for the first time. The lower contribution margins and cost increases – among other things for our new wheat breeding program in North America – are expected to reduce the segment’s income (previous year: €26.8 million) by just over 30%.
Corporate The cross-segment function costs and research expenditures reported under the Corporate Segment are currently expected to be approximately 13% above the previous year ( Corporate’s EBIT: € –41.6 million).
Basis of accounting and reporting
The KWS Group is a consolidated group as defined in the International Financial Report-ing Standards (IFRSs) published by the International Accounting Standards Board (IASB), London, taking into account the interpretations of the International Financial Reporting Inter-pretations Committee (IFRIC). All disclosures on KWS are therefore disclosures on the Group within the meaning of these regulations. The quarterly financial statements of the KWS Group were prepared in accordance with IAS 34, and exactly the same accounting methods applied in the preparation of the consolidated financial statements as of June 30, 2013, were used. The Notes appended to the annual financial statements as of June 30, 2013, therefore apply accordingly. Income taxes were calculated on the basis of the individual country-specific income tax rates, taking account of the planning for the fiscal year as a whole.

14 KWS SAAT AG 1st Quarterly Report 2013/2014
Companies consolidated in the KWS Group
The quarterly consolidated financial statements of the KWS Group include the single-entity financial statements of KWS SAAT AG and its subsidiaries in Germany and other countries in which it directly or indirectly controls more than 50% of the voting rights. In addition, joint ventures are proportionately consolidated according to the percentage of equity held in those companies. Subsidiaries and joint ventures that are considered im-material for the presentation and evaluation of the financial position and performance of the Group are not included.
The 50% stake acquired last year in the French research company GENECTIVE S.A. has – like our other joint ventures – been included proportionately in the consolidated financial statements since July 1, 2013. KWS SERVICES MEDITERRANEAN S.L. in Spain and KWS PERU S.A.C. in Peru were founded at the start of the fiscal year. Consequently, the number of companies consolidated in the KWS Group increased by two fully consoli-dated companies and one proportionately consolidated company, giving a total of 57 fully consolidated and eight proportionately consolidated companies in fiscal 2013/2014.
Our Annual Shareholders’ Meeting will be held on December 19, 2013, at 11:00 a.m., as usual at the company’s headquarters in Einbeck.
Einbeck, November 28, 2013
KWS SAAT AG
The Executive Board
Philip von dem Bussche Léon Broers Hagen Duenbostel Eva Kienle

15 KWS SAAT AG 1st Quarterly Report 2013/2014
Financial calendar
Financial calendar
December 19, 2013 Annual Shareholders’ Meeting in Einbeck
February 25, 2014 Report on the 2nd quarter of 2013/2014
May 27, 2014 Report on the 3rd quarter of 2013/2014
October 16, 2014 Publication of the 2013/2014 financial statements, Annual press and analyst conference in Frankfurt
November 26, 2014 Report on the 1st quarter of 2014/2015
December 18, 2014 Annual Shareholders’ Meeting in Einbeck
Safe Harbor Statement
This document contains forward-looking statements about future developments based on the current assessments of management. These forward-looking statements may be identified by words such as “forecast,” “assume,” “believe,” “assess,” “expect,” “intend,” “can/may/might,” “plan,” “should” or similar expressions.
These statements are subject to certain elements of uncertainty, risks and other factors that may result in significant deviations between expectations and actual circumstances. Examples of such risks and factors are market risks (such as changes in the competitive environment or risks of changes in interest or exchange rates), product-related risks (such as production losses as a result of bad weather, failure of production plants or quality-related risks), political risks (such as changes in the regulatory environment, including those with regard to the general regulatory framework for the cultivation of energy plants, or violations of existing laws and regulations, for example those regarding genetically modified organisms in corn seed) and general economic risks. Forward-looking state-ments must therefore not be regarded as a guarantee or pledge that the developments or events they describe will actually occur. We do not intend, nor do we assume any obliga-tion, to update or revise these forward-looking statements, since they are based solely on circumstances on the day they were published.
A German version of the 1st Quarterly Report 2013/2014 is available at www.kws.de/ir.
KWS SAAT AGGrimsehlstraße 31Postfach 14 6337555 Einbeck, GermanyPhone: +49 (0)5561 311 0Fax: +49 (0)5561 311 322www.kws.comE-mail: [email protected]
This translation of the original German version of the 1st Quarterly Report has been prepared for the convenience of our English-speaking shareholders. The German version is legally binding.