Embed Size (px)
Citation preview
1st Quarter Result for Fiscal year ending February 29, 2016
July 13, 2015
Gulliver International Co., Ltd.(7599)
Last updated: July 13, 2015
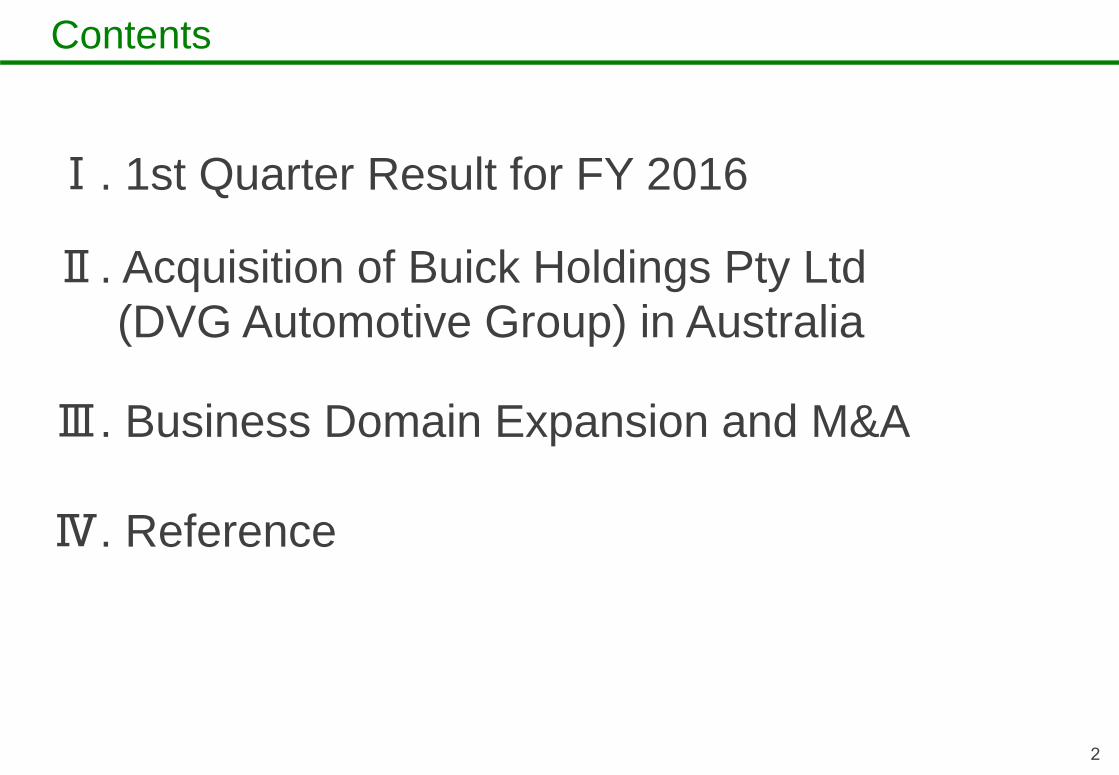
Contents
2
Ⅰ. 1st Quarter Result for FY 2016
Ⅱ. Acquisition of Buick Holdings Pty Ltd (DVG Automotive Group) in Australia
Ⅲ. Business Domain Expansion and M&A
Ⅳ. Reference
3
Ⅰ.1st Quarter Result for FY 2016

4
1Q Summary
36,230 cars
30,105 cars
12,840 cars
7.91 billion yen
1.47 billion yen
FY 20151Q
FY 20161Q
48,189 cars
37,652 cars
18,416 cars
9.69 billion yen
2.04 billion yen
No. of cars purchased
No. of wholesale
No. of retail car sales
SG&A expenses
Operating income*Number of cars for direct stores.

Consolidated Operating Income
5
1,470
620
2,040
FY2015 1Q FY2016 1Q
850
2,040
the change to estimates
for provision for merchandise
warranties
(unit:million yen)
Real-term increase in operating income
6
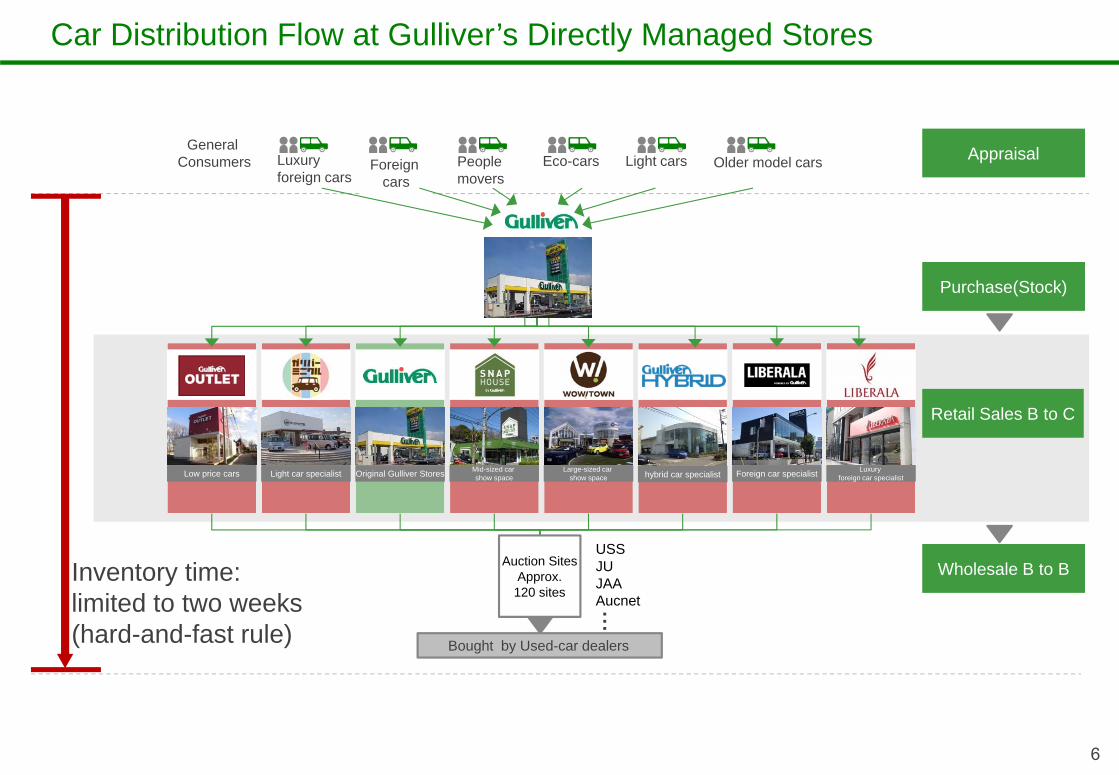
Car Distribution Flow at Gulliver’s Directly Managed Stores
Eco-cars Older model carsLight carsPeople movers
Foreign cars
Inventory time:limited to two weeks (hard-and-fast rule)
General Consumers Luxury
foreign cars
Auction SitesApprox.120 sites
USSJUJAAAucnet
Bought by Used-car dealers
・・・
Appraisal
Purchase(Stock)
Wholesale B to B
Low price cars Light car specialist Original Gulliver Stores Mid-sized car show space
Large-sized car show space Foreign car specialist Luxury
foreign car specialisthybrid car specialist
Retail Sales B to C
7
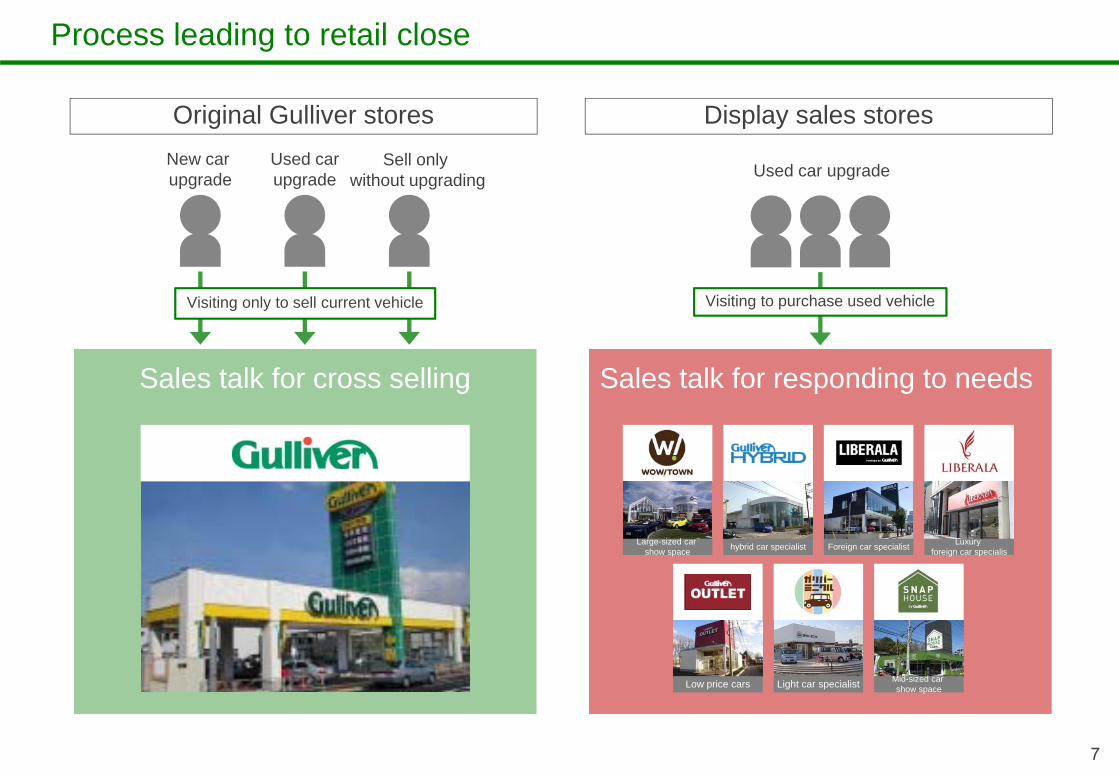
Process leading to retail close
New car upgrade
Used carupgrade
Sell only without upgrading
Original Gulliver stores
Sales talk for cross selling
Large-sized car show space Foreign car specialist Luxury
foreign car specialishybrid car specialist
Low price cars Light car specialist Mid-sized car show space
Sales talk for responding to needs
Used car upgrade
Visiting to purchase used vehicleVisiting only to sell current vehicle
Display sales stores

8
Status of display sales stores (existing stores ; sales volume)
Mar Apr May Jun Jul Aug Sep Oct Nov Dec Jan Feb
2015 2016
(unit:car)
*Average retail car sales for stores that opened before February 2015 and are fully operational in the fiscal year ending February 2016 (excluding Shake! Hamamatsu and VOLVO Matsuyama)
50
0
40
30
20
10
Ave 36.6 cars/mo
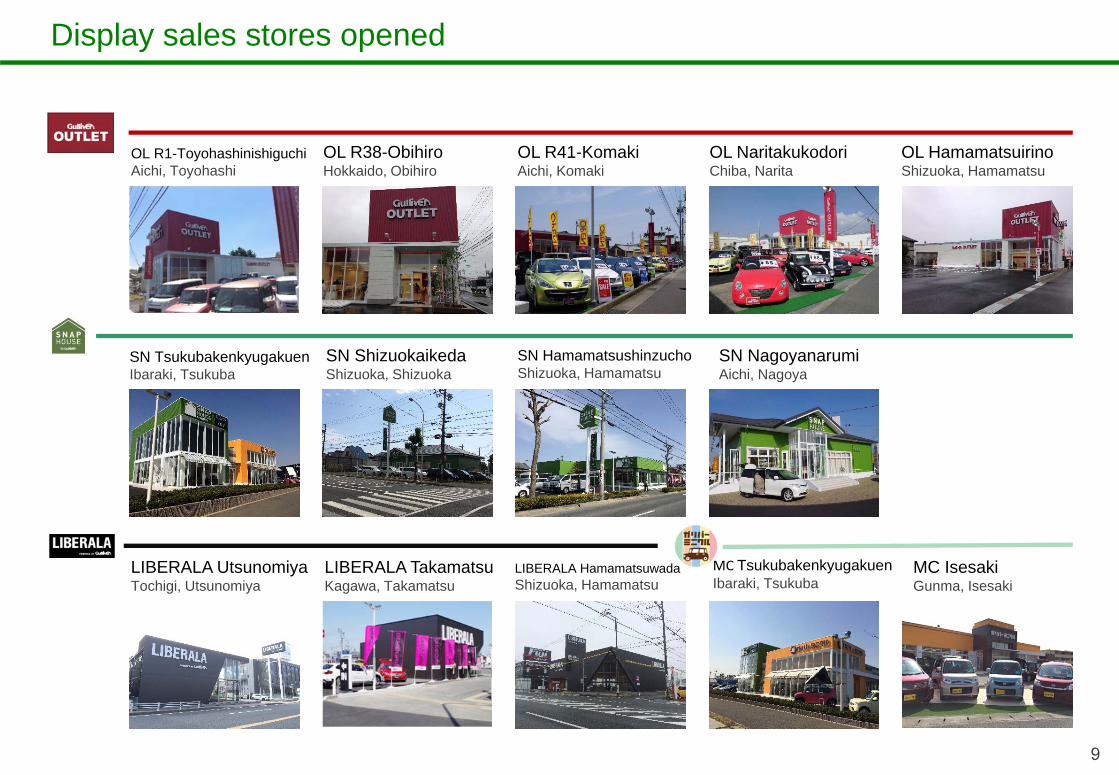
Display sales stores opened
9
OL R1-ToyohashinishiguchiAichi, Toyohashi
OL R38-ObihiroHokkaido, Obihiro
OL R41-KomakiAichi, Komaki
OL NaritakukodoriChiba, Narita
OL HamamatsuirinoShizuoka, Hamamatsu
SN TsukubakenkyugakuenIbaraki, Tsukuba
SN ShizuokaikedaShizuoka, Shizuoka
SN HamamatsushinzuchoShizuoka, Hamamatsu
SN NagoyanarumiAichi, Nagoya
LIBERALA UtsunomiyaTochigi, Utsunomiya
LIBERALA TakamatsuKagawa, Takamatsu
LIBERALA HamamatsuwadaShizuoka, Hamamatsu
MC TsukubakenkyugakuenIbaraki, Tsukuba
MC IsesakiGunma, Isesaki

10
Basis for current term development plan
Mar-MayNet Increase
Contracts finalized but not yet opened
(As of May 31)
Sites currently under negotiation
(As of May 31)
Plan to open this term
100 stores(First half 35 stores + Second half 65 stores)
13 stores 48 stores 52 stores
New projects

Business Development at Nakamitsu Motors
11
IchikawaChiba, Ichikawa
FunabashiChiba, Funabashi
MatsudoChiba, Matsudo
UrayasuChiba, Urayasu
FunabashiChiba, Funabashi
MatsudoChiba, Matsudo
KashiwaChiba, Kashiwa
UrayasuChiba, Urayasu
FunabashiChiba, Funabashi
KashiwaChiba, Kashiwa
IchikawaChiba, Ichikawa
KashiwaChiba, Kashiwa
BMW
MINI
BMW Premium Selection (used car)
*Nakamitsu Motors Co., LTD. is scheduled to be renamed Motoren Glanz Co., LTD.
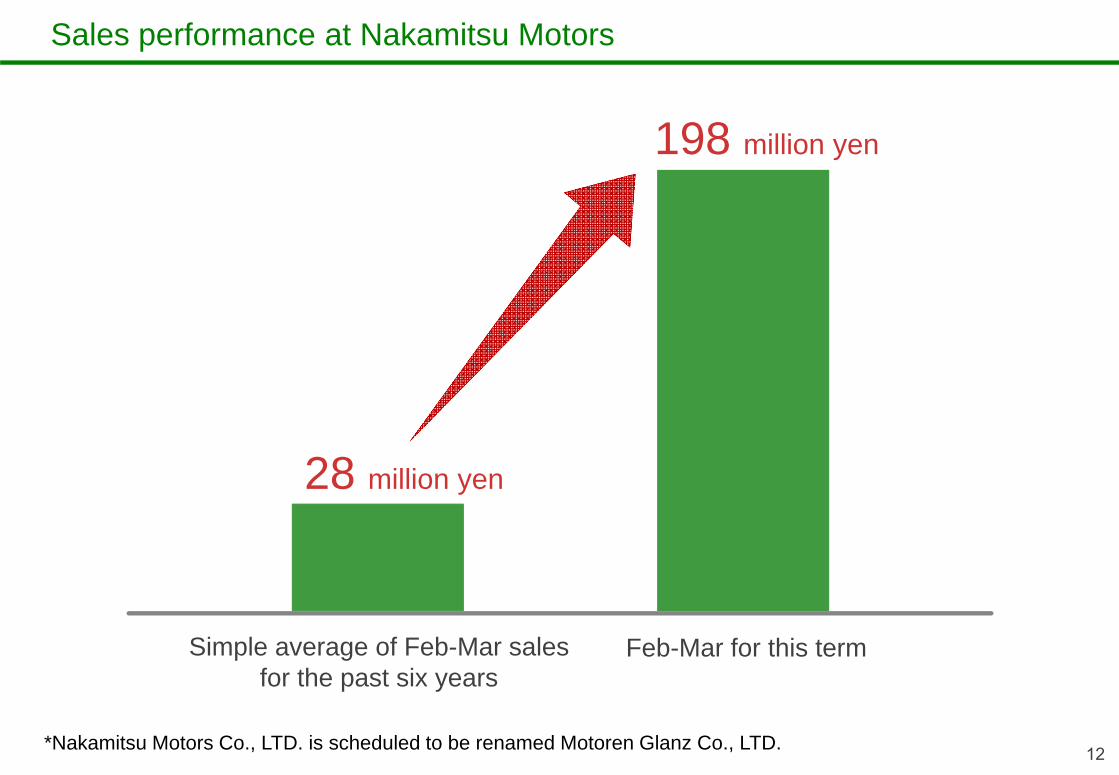
Sales performance at Nakamitsu Motors
12
Simple average of Feb-Mar salesfor the past six years
Feb-Mar for this term
28 million yen
198 million yen
*Nakamitsu Motors Co., LTD. is scheduled to be renamed Motoren Glanz Co., LTD.
Sales performance at Nakamitsu Motors
13
Aim for a 7% operating margin as soon as possible
*Nakamitsu Motors Co., LTD. is scheduled to be renamed Motoren Glanz Co., LTD.
Ⅱ. Acquisition of Buick Holdings Pty Ltd (DVG Automotive Group) in Australia
14
15
1. Why Australia?
2. What kind of company is Buick?
3. What will Buick contribute to results?
4. What will be the post-acquisitionmanagement structure?
5. How will you source the acquisition funds?

16
1. Why Australia?
2. What kind of company is Buick?
3. What will Buick contribute to results?
4. What will be the post-acquisitionmanagement structure?
5. How will you source the acquisition funds?

1995 1996 1997 1998 1999 2000 2001 2002 2003 2004 2005 2006 2007 2008 2009 2010 2011 2012 2013 2014
*Left scale
Economic Situation in Australia
17
*source: IMF Survey
Stable growth
2,500
2,000
1,500
1,000
500
0
30
25
20
15
10
5
0
PopulationNominal GDPReal GDP
(unit:billion AUD) (unit:million people)
*Right scale
*Left scale
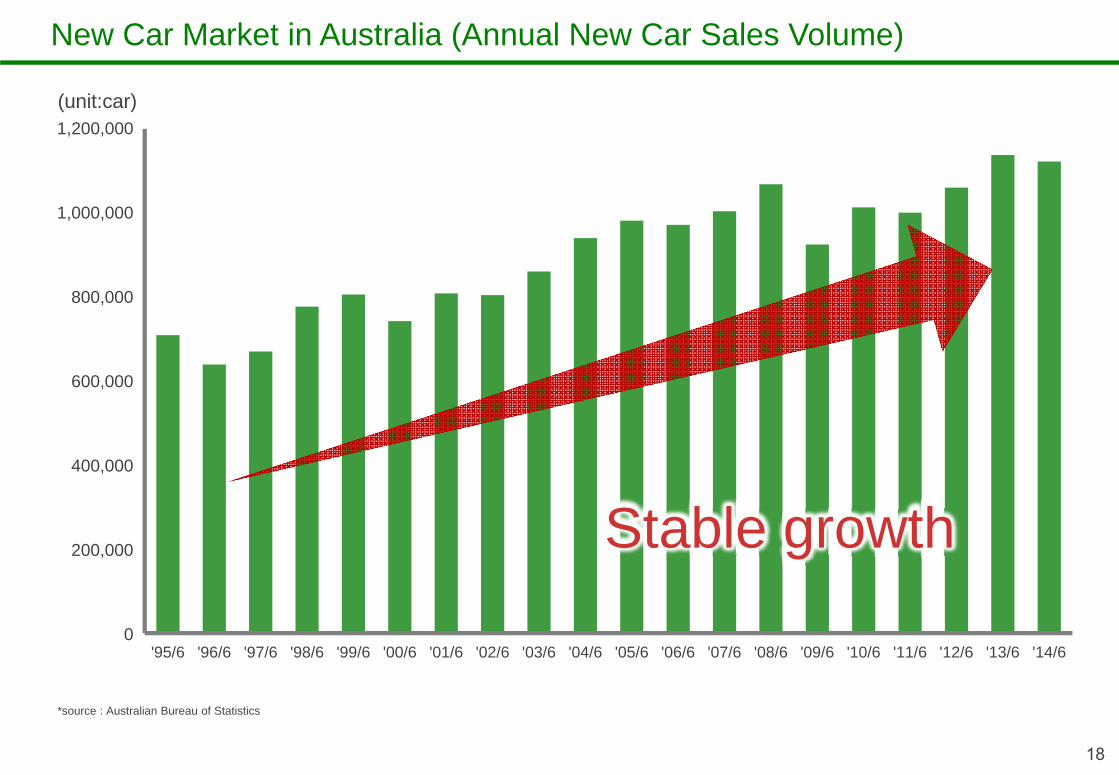
'95/6 '96/6 '97/6 '98/6 '99/6 '00/6 '01/6 '02/6 '03/6 '04/6 '05/6 '06/6 '07/6 '08/6 '09/6 '10/6 '11/6 '12/6 '13/6 '14/6
New Car Market in Australia (Annual New Car Sales Volume)
18
*source : Australian Bureau of Statistics
1,200,000
0
1,000,000
800,000
600,000
400,000
200,000
(unit:car)
Stable growth

19
1. Why Australia?
2. What kind of company is Buick?
3. What will Buick contribute to results?
4. What will be the post-acquisitionmanagement structure?
5. How will you source the acquisition funds?

20
Toyota Nissan Honda Isuzu Mitsubishi Suzuki
Hyundai Kia Holden
Chrysler Peugeot Volkswagen FIAT Alfa
Romeo
Buick Holdings operates 25 multi-brand automotivedealerships at around 10 locations in Western Australia
Overview of the Acquired Company
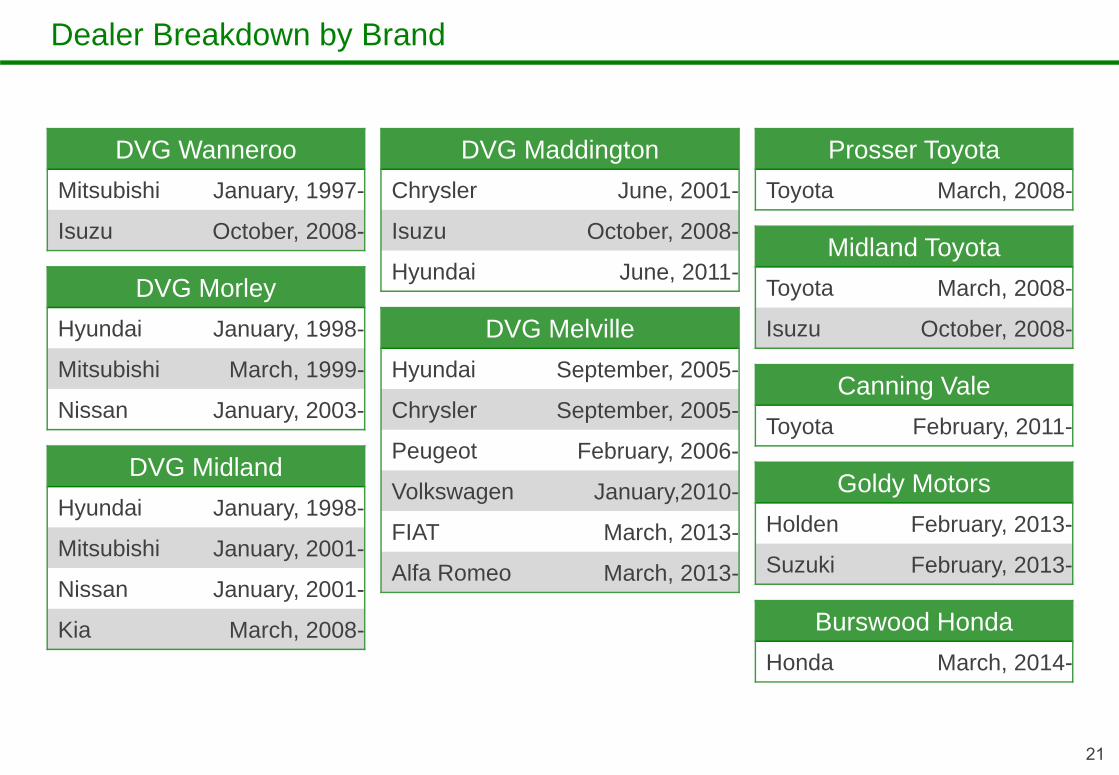
Dealer Breakdown by Brand
21
DVG MelvilleHyundai September, 2005-
Chrysler September, 2005-
Peugeot February, 2006-
Volkswagen January,2010-
FIAT March, 2013-
Alfa Romeo March, 2013-
DVG MaddingtonChrysler June, 2001-
Isuzu October, 2008-
Hyundai June, 2011-
DVG WannerooMitsubishi January, 1997-
Isuzu October, 2008-
DVG MorleyHyundai January, 1998-
Mitsubishi March, 1999-
Nissan January, 2003-
DVG MidlandHyundai January, 1998-
Mitsubishi January, 2001-
Nissan January, 2001-
Kia March, 2008-
Prosser ToyotaToyota March, 2008-
Midland ToyotaToyota March, 2008-
Isuzu October, 2008-
Canning ValeToyota February, 2011-
Goldy MotorsHolden February, 2013-
Suzuki February, 2013-
Burswood HondaHonda March, 2014-

1997 1998 1999 2000 2001 2002 2003 2004 2005 2006 2007 2008 2009 2010 2011 2012 2013 2014
History of Dealership Management
22
DVG Wanneroo Mitsubishi January, 1997-DVG Morley Hyundai January , 1998-DVG Midland Hyundai January , 1998-
DVG Morley Mitsubishi March, 1999-DVG Midland Mitsubishi January, 2001DVG Midland Nissan January, 2001-
DVG Maddington Chrysler June, 2001-DVG Morley Nissan January, 2003-
DVG Melville Hyundai September, 2005-DVG Melville Chrysler September , 2005-
DVG Melville Peugeot February, 2006-DVG Midland Kia March, 2008-Prosser Toyota Toyota March, 2008-Midland Toyota Toyota March, 2008-
DVG Wanneroo Isuzu October, 2008-DVG Maddington Isuzu October, 2008-Midland Toyota Isuzu October, 2008-
DVG Melville Volkswagen January,2010-Canning Vale Toyota February, 2011-
DVG Maddington Hyundai June, 2011-Goldy Motors Holden February, 2013-Goldy Motors Suzuki February, 2013-
DVG Melville FIAT March, 2013-DVG Melville Alfa Romeo March, 2013-
Burswood Honda Honda March, 2014-

’01/6 ’02/6 ’03/6 ’04/6 ’05/6 ’06/6 ’07/6 ’08/6 ’09/6 ’10/6 ’11/6 ’12/6 ’13/6 ’14/6
Steady growth through the development of multi-brand dealers, with a sales volume track record of approx.
14,000 vehicles a year
Historical Sales
(unit:million AUD)
23
700
600
500
400
300
200
100
0

Storefront Photos of the Local Dealerships
24
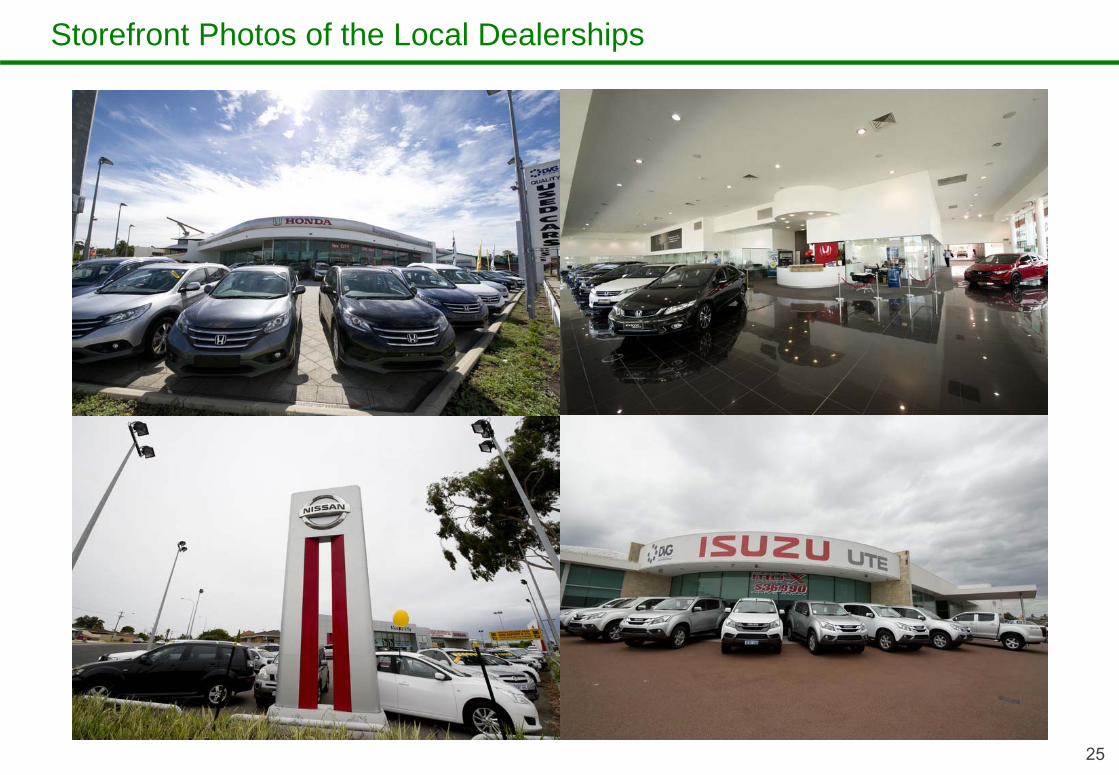
25
Storefront Photos of the Local Dealerships

26
Storefront Photos of the Local Dealerships

27
Storefront Photos of the Local Dealerships
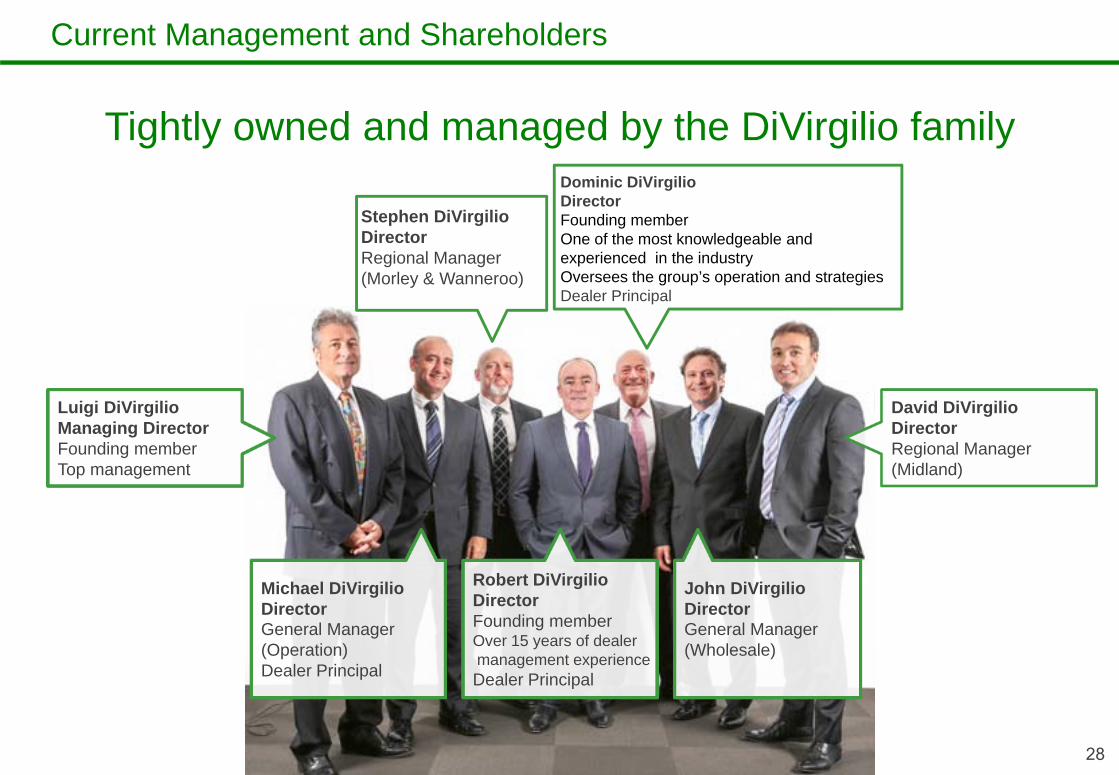
Current Management and Shareholders
28
Tightly owned and managed by the DiVirgilio family
Luigi DiVirgilioManaging DirectorFounding memberTop management
Robert DiVirgilioDirectorFounding memberOver 15 years of dealermanagement experienceDealer Principal
David DiVirgilioDirectorRegional Manager(Midland)
Michael DiVirgilioDirectorGeneral Manager(Operation)Dealer Principal
John DiVirgilioDirectorGeneral Manager(Wholesale)
Dominic DiVirgilioDirectorFounding memberOne of the most knowledgeable and experienced in the industryOversees the group’s operation and strategiesDealer Principal
Stephen DiVirgilioDirectorRegional Manager(Morley & Wanneroo)
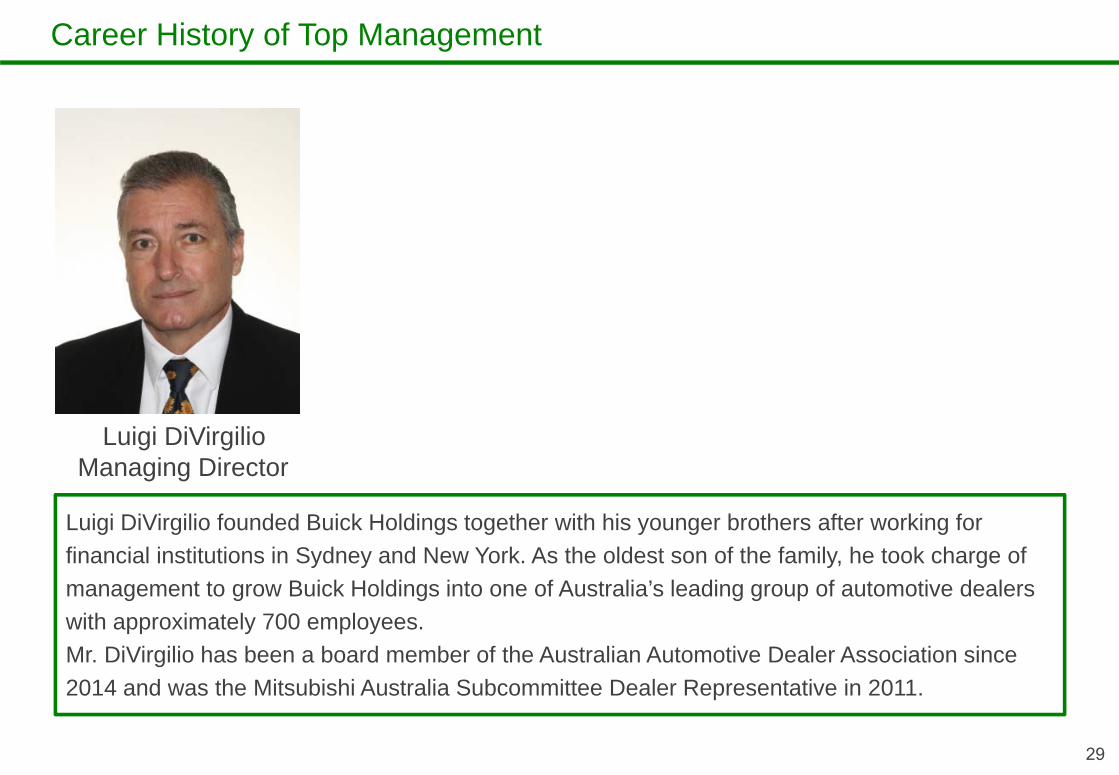
Career History of Top Management
29
Luigi DiVirgilioManaging Director
Luigi DiVirgilio founded Buick Holdings together with his younger brothers after working for financial institutions in Sydney and New York. As the oldest son of the family, he took charge of management to grow Buick Holdings into one of Australia’s leading group of automotive dealers with approximately 700 employees.Mr. DiVirgilio has been a board member of the Australian Automotive Dealer Association since 2014 and was the Mitsubishi Australia Subcommittee Dealer Representative in 2011.

Midland Toyota2014 - 5 Star Guest Experience Dealership- Sales & Service2014 Number 1 Metro Sales Guest Satisfaction Index2011, 2012, 2013 - Bronze Knight Sales Award2014 - Bronze Brand & Customer Experience Award2012, 2013 - Bronze Customer First Award for Excellence2013 - Bronze Business Management Award2013, 2014, 2015 - Fleet Specialist Dealer Accredited2013, 2014 - Used Cars Excellence Award2014 - TSM Foundations Accredited Dealer
Prosser Toyota - Gosnells
2013·Toyota Financial Services Toyota Access Silver Award·Toyota Sales Silver Knight award·Toyota Used Car Excellence award·Toyota Business Management Excellence Bronze award·Toyota Fleet Specialist Dealer· Toyota Fleet Management Dealer of the Year2014·Toyota Financial Services Toyota Access Bronze award·Toyota Fleet Specialist Dealer·Toyota Fleet Management Dealer of the Year·Toyota Used Car Certified award·Toyota Service 5 Star Guest Survey rating·Toyota Sales 5 Star Guest Survey rating2015·Achieved Toyota Service Foundations accreditation (June)·Toyota Service 5 Star Guest Survey rating YTD (number 1 in metro area YTD)·Toyota Sales 5 Star Guest Survey rating YTD
Midland Isuzu2014 - National Dealer Evaluation Program Top 25 Award
Midland NissanNissan has achieved Platinum Dealership award for the last 3 years, in the last year they changed it to the Nissan Dealer excellence award. In 2014 Midland Nissan was awarded Nissan dealer excellence award. This would be 5th year in a row Midland Nissan has achieved Nissans highest accolades.The Nissan award covers all areas of the business. To achieve the award you need to be above national average in both Sales and service CSi, you also need to achieve all sales and parts targets.Midland Nissan has also achieved Nissan Global dealership of the year award in 2013.
Midland HyundaiHyundai has achieved the same awards from 2011 -2013 We have achieved Best Sales Manager Award for our category and we also achieved Best Service Manager for our category.We have also achieved Best sales and Best service CSI from 2011-2013.Midland Hyundai also achieved the Best Service CSI for 2014 in our category.
Burswood HondaNational Awards·Honda Dealer of the Year 2009·Honda Customer Service Excellence Award 2009·National Honda Insurance Sales Winner 2009·Honda Dealer of the Year 2007·Honda Excellence Award Winner 2010·Honda Excellence Award Winner 2011·Honda Excellence Award Winner 2012·Honda Excellence Award Winner 2013Western Australia·New Car Sales Excellence 2009·New Car Sales Excellence 2008·New Car Sales Excellence 2006·Overall Excellence 2010·Overall Excellence 2009·Overall Excellence 2008·Overall Excellence 2007·Overall Excellence 2006·Overall Excellence 2005·Service Overall Excellence 2009·Service Overall Excellence 2005·Service Overall Excellence 2003·Service Overall Excellence 2001·Parts and Accessories Excellence Award 2009·Parts and Accessories Excellence Award 2008·Parts and Accessories Excellence Award 2006·30th Anniversary Honda dealership 2008
Prosser Toyota - Canning Vale
2013·Silver Service Excellence Award Metro (Number 1 in the State, top 5 in Australia)·Bronze Service Excellence Award Metro·Bronze Business Management Excellence Award·Silver Toyota Access Dealer of the Year·TSM Foundations Accredited (Toyota Customer Service Workshop Management)·Toyota Sales Silver Knight2014·Silver Service Excellence Award Metro (Number 1 in the State, top 5 in Australia)·Bronze Service Excellence Award Metro·Bronze Toyota Access Dealer of the Year·TSM Foundations PLUS (Toyota Customer Service Workshop Management) Express MaintenanceAll 2015 awards will be announced in February next year.·We are currently a 5 Star Dealer YTD in 2015
Wanneroo MitsubishiHave for the last 2 years achieved “Millennium Dealer” status, being one of 12 -14 Dealers of 200 Nationally.This has earned the Dealership and all expense paid holiday to Japan with the CEO (Oshikiri)
Wanneroo IsuzuStill holding “Number One” status in WA, retaining this title since we acquired the franchise in 2008
Morley Mitsubishi1 dealer in WA for CSI satisfaction for over 2 years running.
Maddington IsuzuDEP recognition 2014 and 2014 Platinum Award for CSI ServiceCSI: Customer Satisfaction Inventory
Maddington HyundaiCat B Sales person of the year award
Awarded Consecutively by Auto Makers High Customer Satisfaction and Service Quality Ratings
History of Awards and Commendations (Excerpt, Random Order)
30

Strengths of Buick Holdings
31
Cohesive management of the DiVirgilio family
Highly rated customer satisfaction and service
Centralized management structure
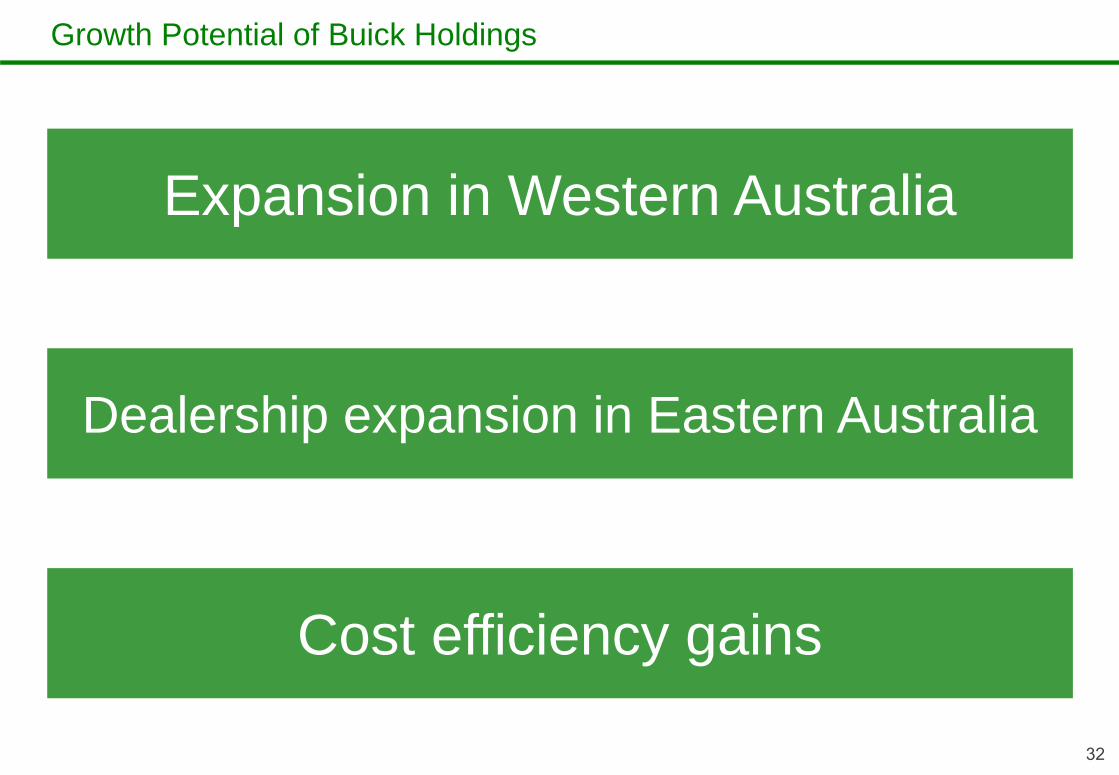
Growth Potential of Buick Holdings
32
Expansion in Western Australia
Dealership expansion in Eastern Australia
Cost efficiency gains

33
1. Why Australia?
2. What kind of company is Buick?
3. What will Buick contribute to results?
4. What will be the post-acquisitionmanagement structure?
5. How will you source the acquisition funds?
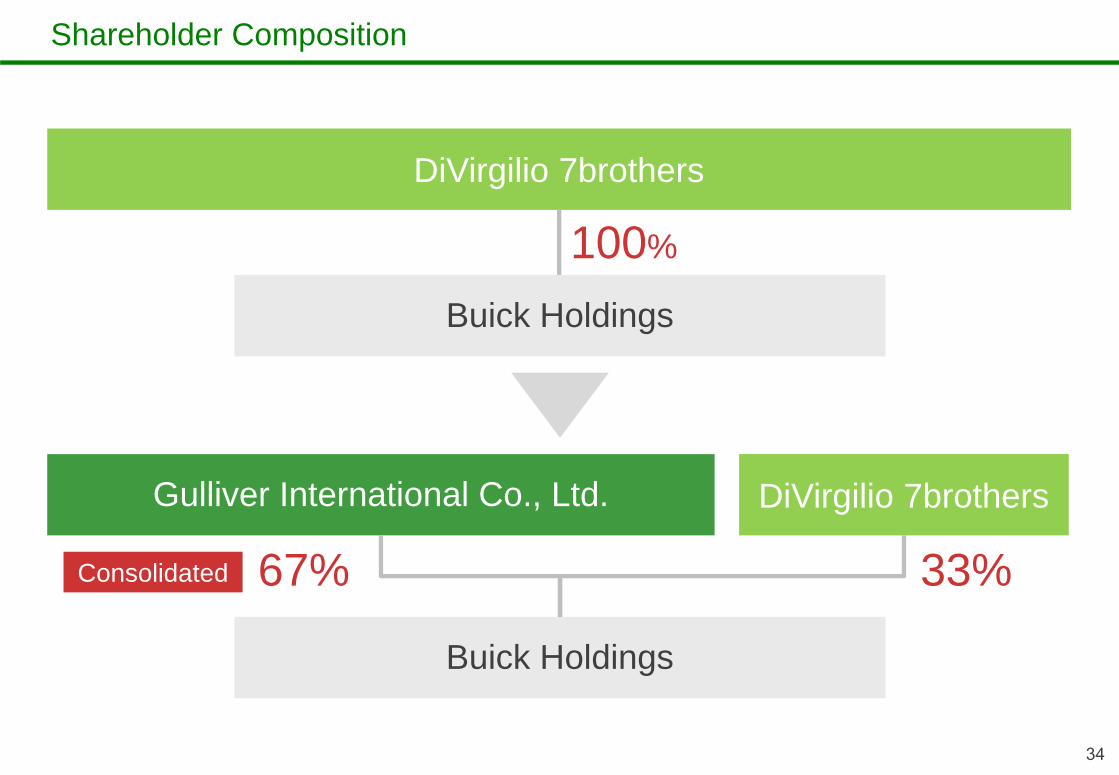
DiVirgilio 7brothers
34
Shareholder Composition
Buick Holdings
Buick Holdings
Gulliver International Co., Ltd. DiVirgilio 7brothers
100%
67% 33%Consolidated
35
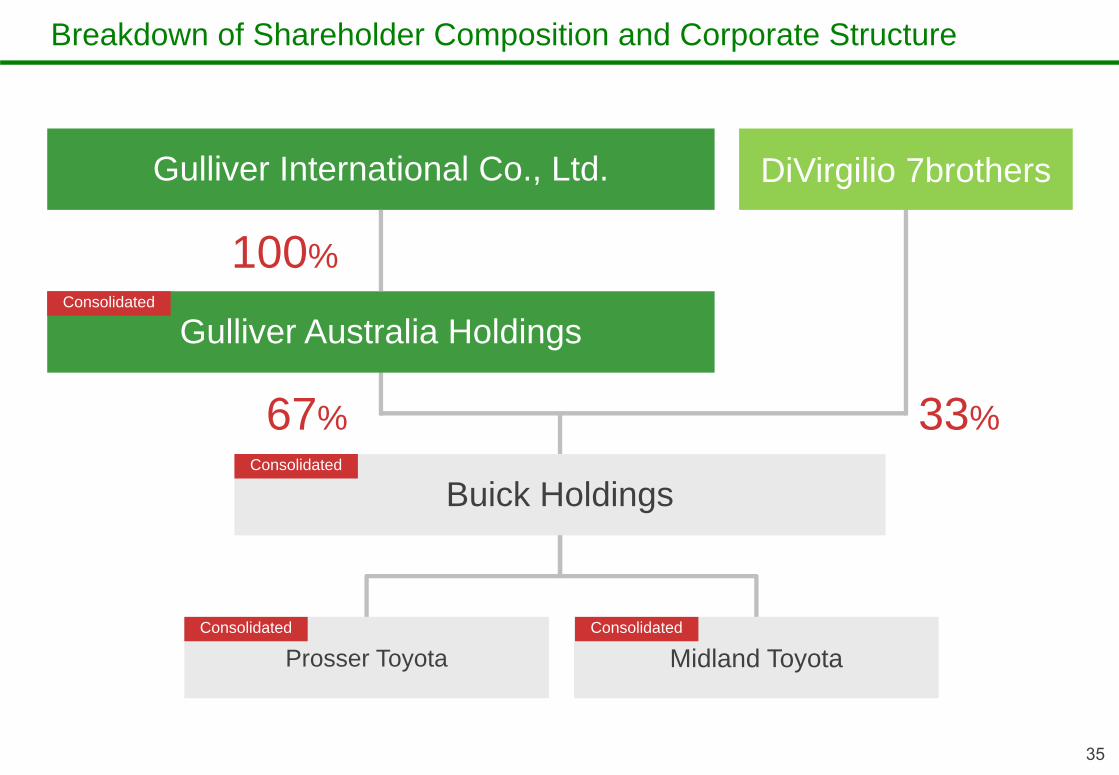
Breakdown of Shareholder Composition and Corporate Structure
Buick Holdings
Gulliver International Co., Ltd. DiVirgilio 7brothers
67% 33%
Gulliver Australia Holdings
Prosser Toyota Midland ToyotaConsolidated
100%
Consolidated
Consolidated
Consolidated
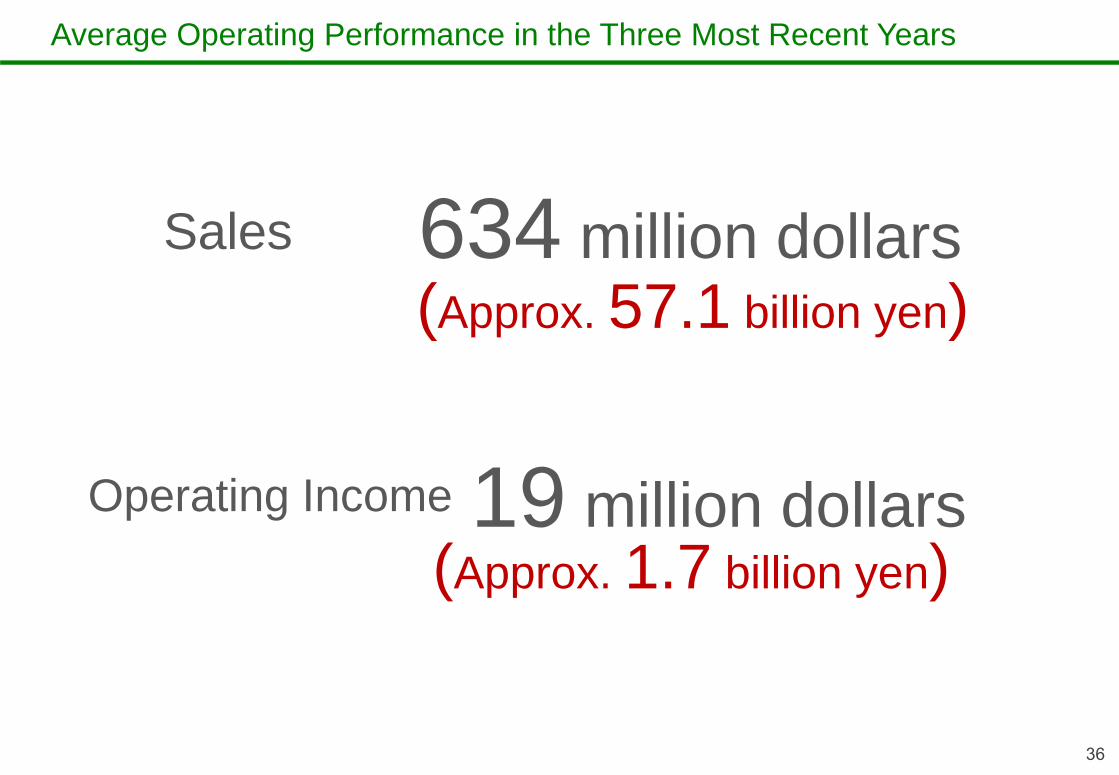
Average Operating Performance in the Three Most Recent Years
36
634 million dollarsSales
19 million dollarsOperating Income
(Approx. 57.1 billion yen)
(Approx. 1.7 billion yen)

Trend and Average in Sales in the Three Most Recent Years
37
*The above figures are the results of Buick Holdings Pty Ltd restated in accordance with Japanese GAAP under certain conditions.*The three-year average is a simple average of the fiscal years ended June 2012 through June 2014*Based on an exchange rate of A$1=¥90
580.6
658.3 664.7
'12/6 '13/6 '14/6 The three-year average0
600
500
400
300
200
100
634.5 million dollars
700
(57.1 billion yen)

Trend and Average in Operating Income in the Three Most Recent Years
38
*Adjusted operating income is the amount of operating income less expenses that will not be incurred after the acquisition (remuneration paid to the current owner company, etc. ).*The above figures are the results of Buick Holdings Pty Ltd restated in accordance with Japanese GAAP under certain conditions.*The three-year average is a simple average of the fiscal years ended June 2012 through June 2014*Based on an exchange rate of A$1=¥90
14.0
16.8
9.2
19.4
23.1
15.8
'12/6 '13/6 '14/6 The three-year average
Operating Income Adjusted operating income25
0
20
15
10
5
19.4million dollars
(1.74 billion yen)
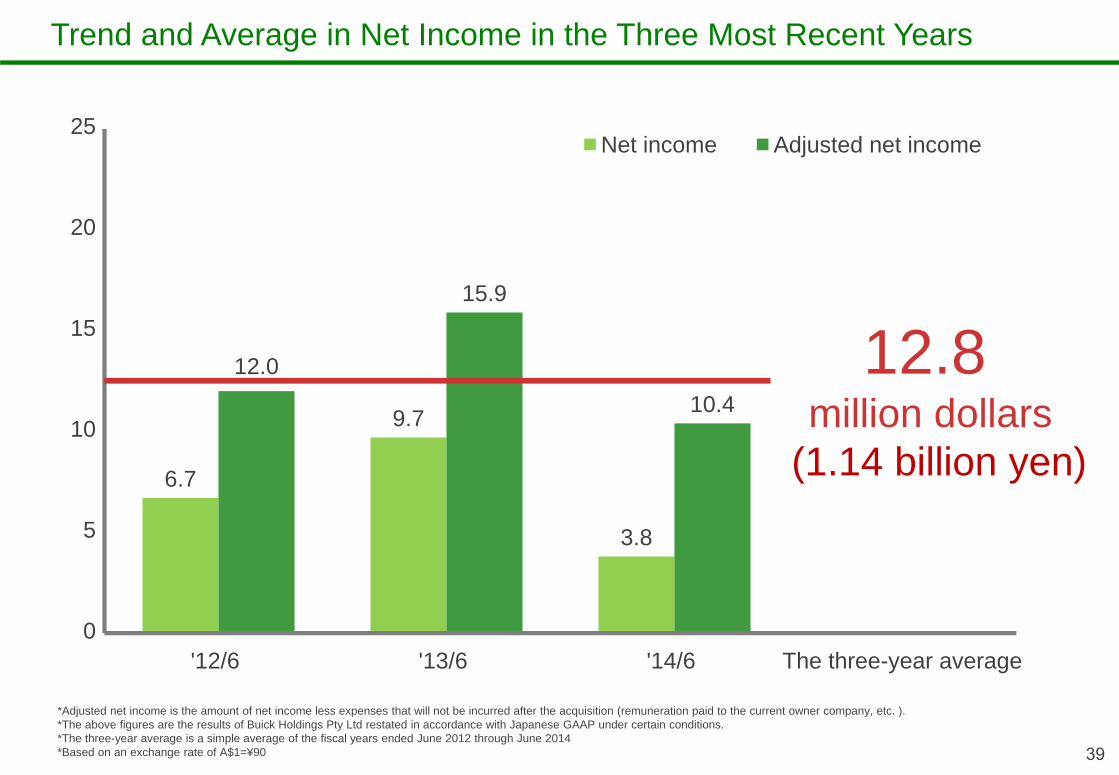
Trend and Average in Net Income in the Three Most Recent Years
39
6.7
9.7
3.8
12.0
15.9
10.4
'12/6 '13/6 '14/6 The three-year average
Net income Adjusted net income
*Adjusted net income is the amount of net income less expenses that will not be incurred after the acquisition (remuneration paid to the current owner company, etc. ).*The above figures are the results of Buick Holdings Pty Ltd restated in accordance with Japanese GAAP under certain conditions.*The three-year average is a simple average of the fiscal years ended June 2012 through June 2014*Based on an exchange rate of A$1=¥90
12.8million dollars
25
0
20
15
10
5
(1.14 billion yen)
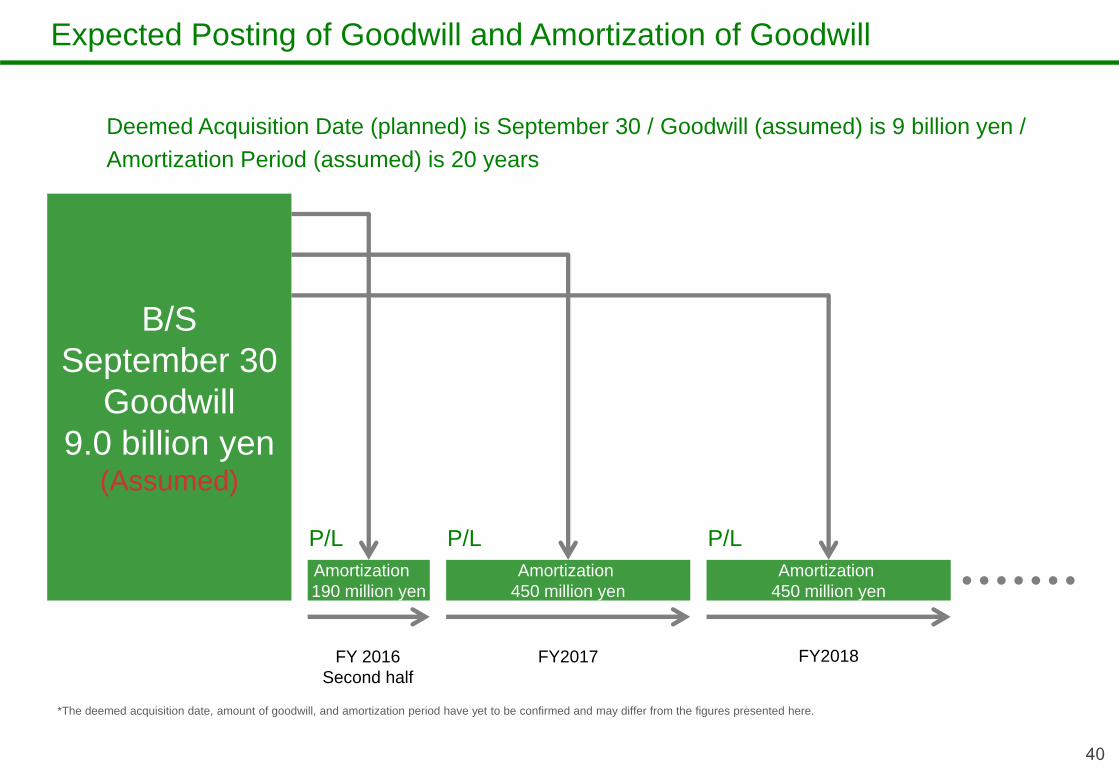
Expected Posting of Goodwill and Amortization of Goodwill
40
B/SSeptember 30
Goodwill9.0 billion yen
(Assumed)
Amortization 450 million yen
Amortization 450 million yen
Amortization 190 million yen
FY 2016Second half
FY2017 FY2018
Deemed Acquisition Date (planned) is September 30 / Goodwill (assumed) is 9 billion yen /Amortization Period (assumed) is 20 years
P/L
*The deemed acquisition date, amount of goodwill, and amortization period have yet to be confirmed and may differ from the figures presented here.
P/L P/L
41
1. Why Australia?
2. What kind of company is Buick?
3. What will Buick contribute to results?
4. What will be the post-acquisitionmanagement structure?
5. How will you source the acquisition funds?
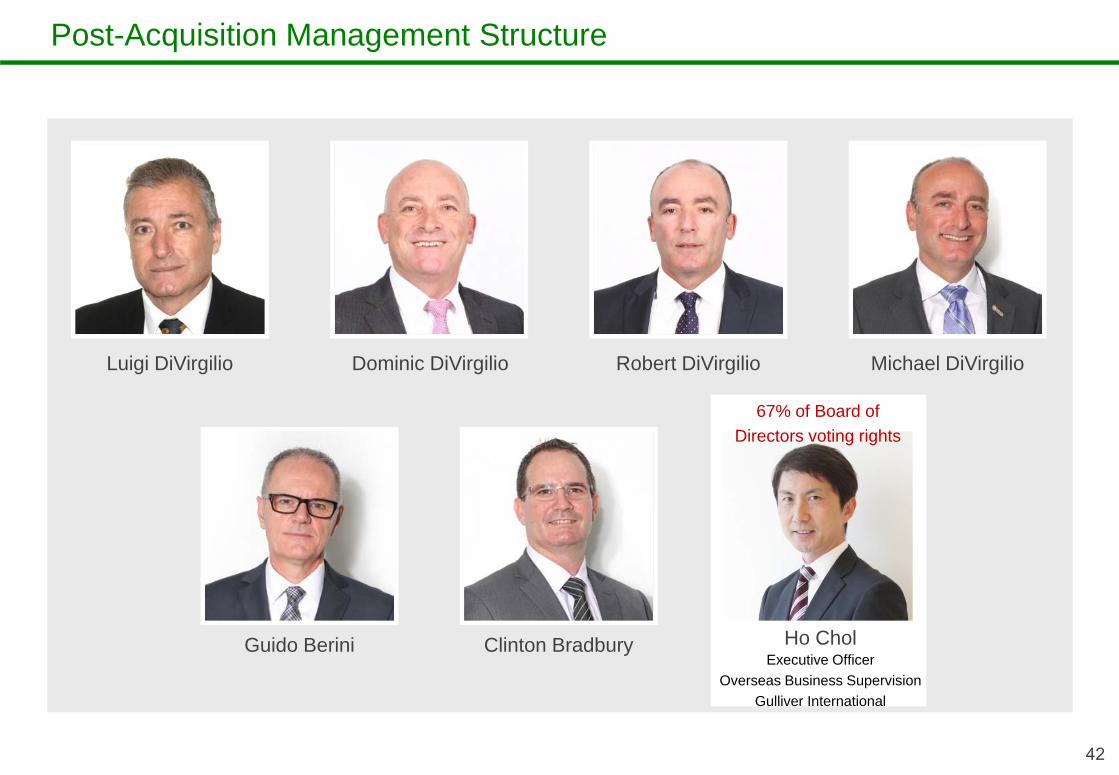
Post-Acquisition Management Structure
42
67% of Board of Directors voting rights
Luigi DiVirgilio Dominic DiVirgilio Robert DiVirgilio Michael DiVirgilio
Ho CholExecutive Officer
Overseas Business SupervisionGulliver International
Guido Berini Clinton Bradbury
Board of Directors
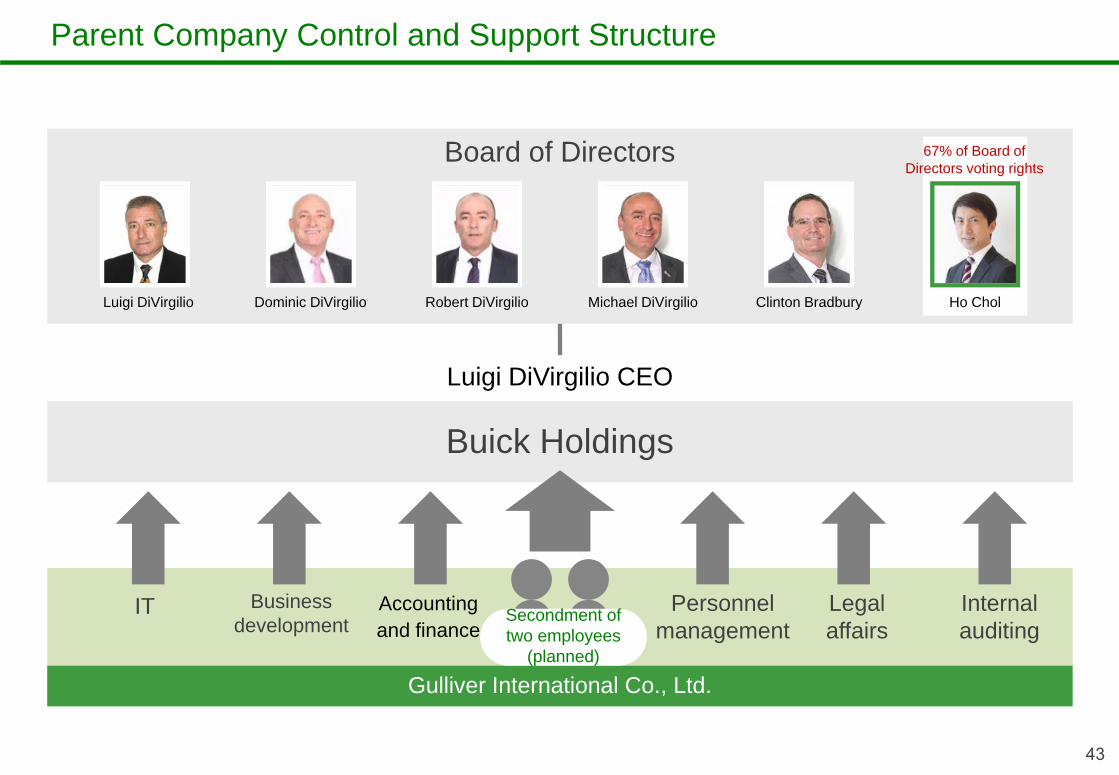
Parent Company Control and Support Structure
43
67% of Board of Directors voting rights
Luigi DiVirgilio CEO
Ho Chol
Gulliver International Co., Ltd.
Luigi DiVirgilio Dominic DiVirgilio Robert DiVirgilio Michael DiVirgilio Clinton Bradbury
Buick Holdings
Secondment of two employees
(planned)
Business development
Accounting and finance
Legal affairs
Personnel management
IT Internal auditing
44
1. Why Australia?
2. What kind of company is Buick?
3. What will Buick contribute to results?
4. What will be the post-acquisitionmanagement structure?
5. How will you source the acquisition funds?
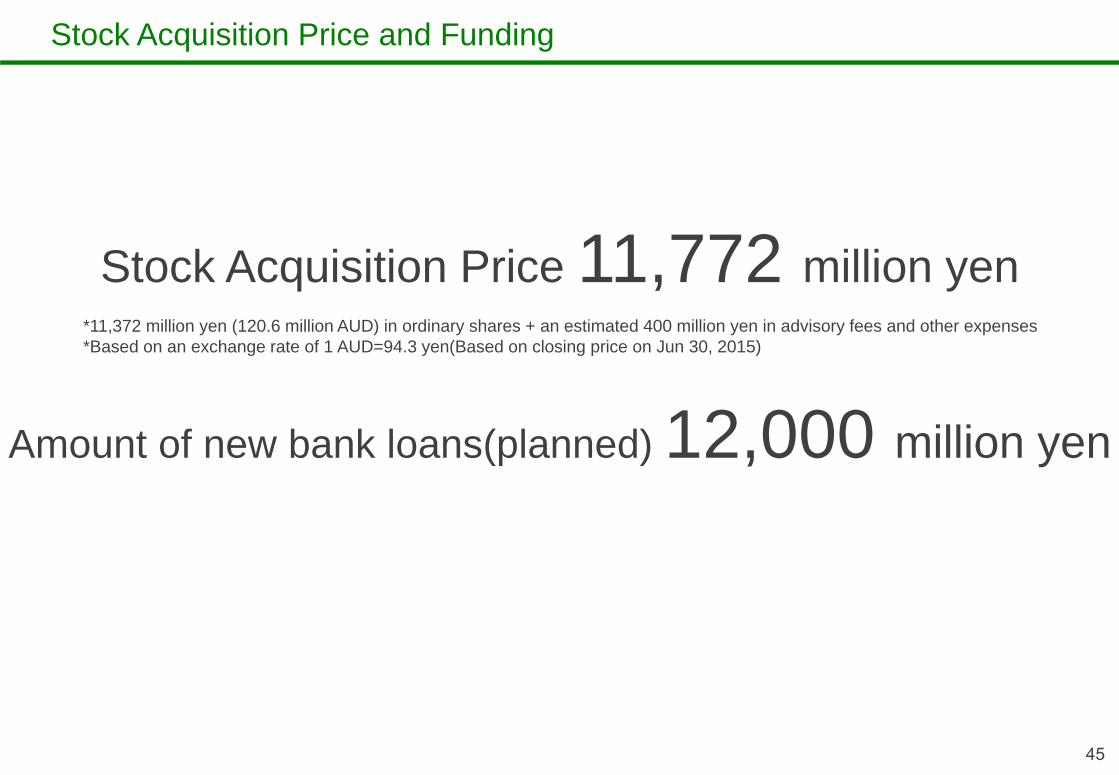
Stock Acquisition Price and Funding
45
Stock Acquisition Price 11,772 million yen*11,372 million yen (120.6 million AUD) in ordinary shares + an estimated 400 million yen in advisory fees and other expenses*Based on an exchange rate of 1 AUD=94.3 yen(Based on closing price on Jun 30, 2015)
Amount of new bank loans(planned) 12,000 million yen
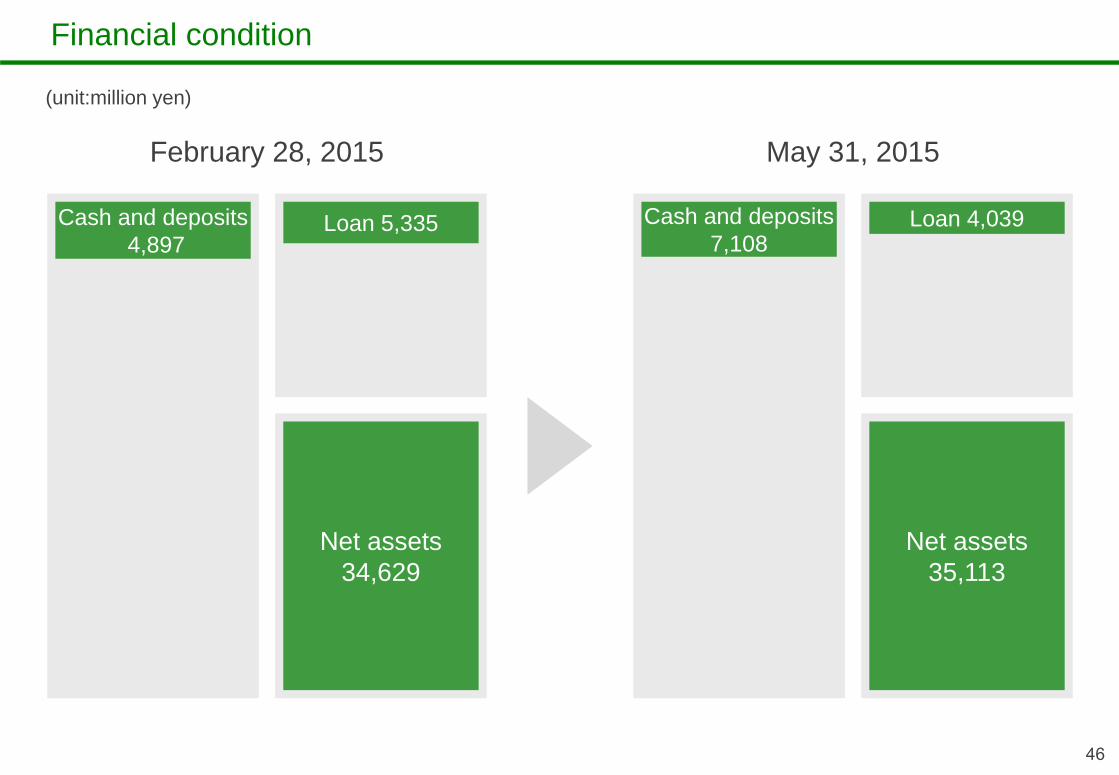
Financial condition
46
Cash and deposits4,897
Net assets34,629
February 28, 2015 May 31, 2015
Loan 5,335 Cash and deposits7,108
Net assets35,113
Loan 4,039
(unit:million yen)

Financial condition
47
D/E ratio0.1
0.5after the 12.0 billion
yen in loans
Cash and deposits7,108
Net assets35,113
Loan 4,039
Should rise to around
(unit:million yen)
May 31, 2015
Ⅲ. Business Domain Expansion and M&A
48

49
Future Goals for Gulliver
Create world's largest vehicle sales infrastructure
* Reference : Medium-Term Business Plan & Result for Fiscal year to February 28, 2014
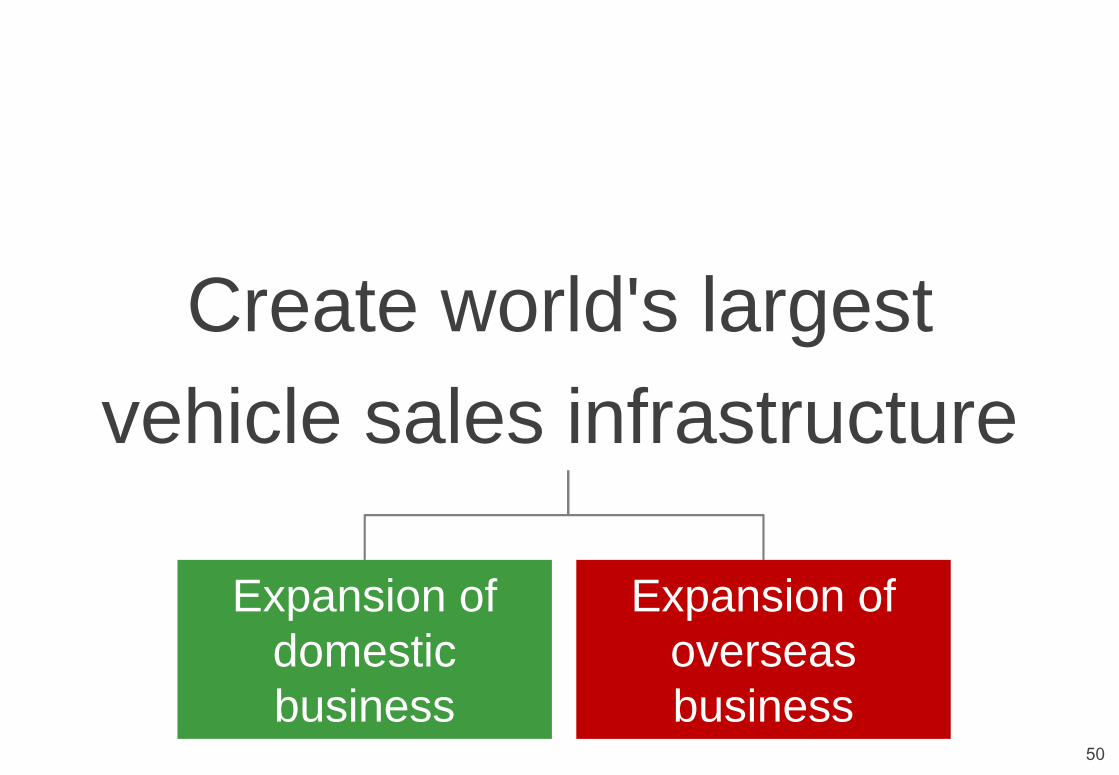
50
Expansion ofdomestic business
Expansion ofoverseas business
Create world's largest vehicle sales infrastructure
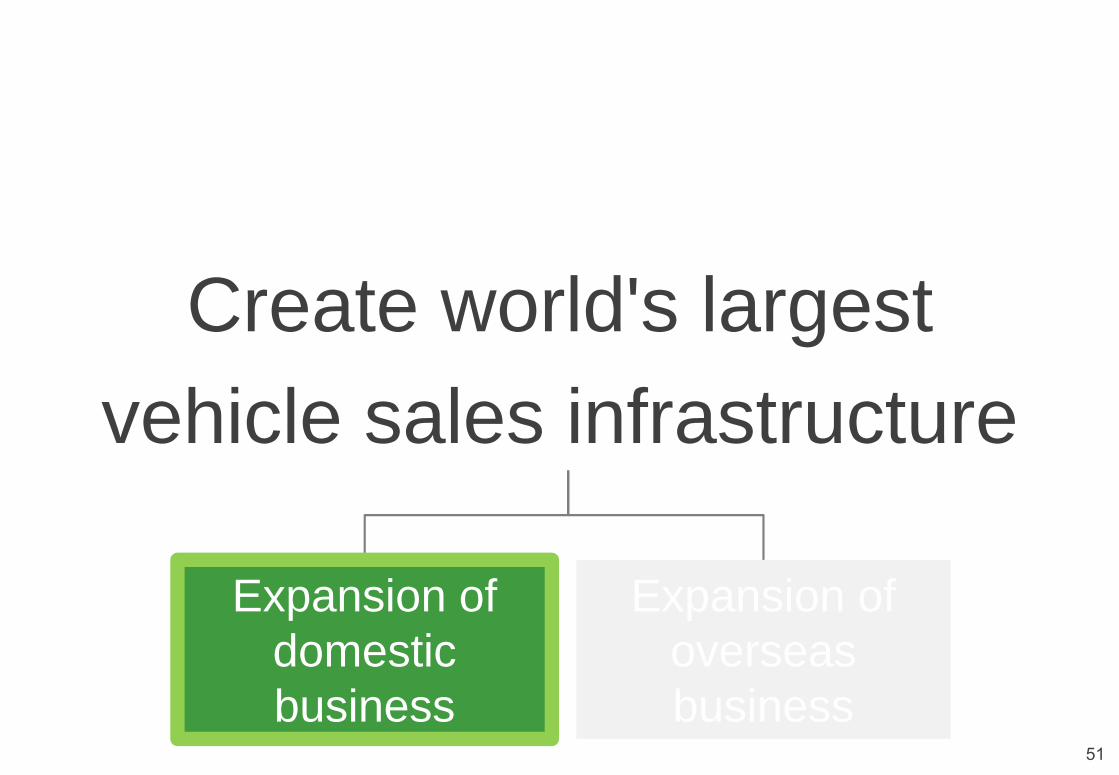
51
Expansion ofdomestic business
Expansion ofoverseas business
Create world's largest vehicle sales infrastructure
52
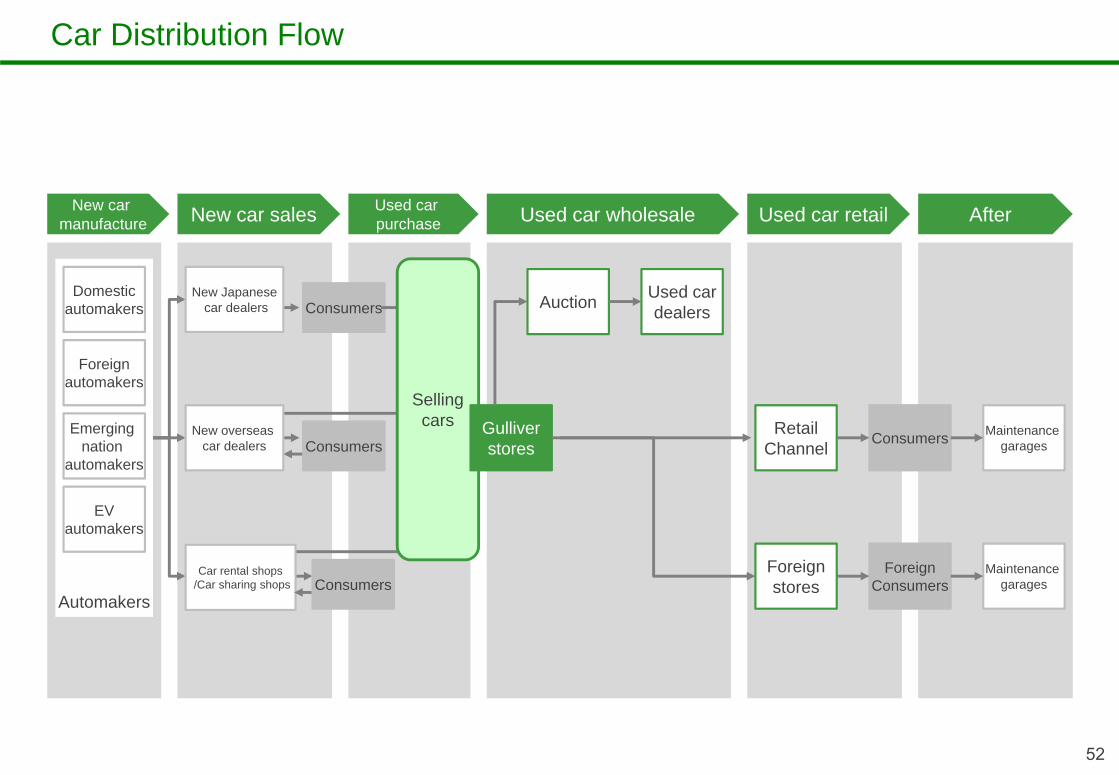
Car Distribution Flow
Automakers
Foreignstores
Used cardealers
RetailChannel
New car manufacture
Consumers
Used car purchase
Consumers
ForeignConsumers
New car sales Used car wholesale Used car retail After
Maintenance garages
Maintenance garages
Auction
EVautomakers
Emerging nation
automakers
Domesticautomakers
Foreignautomakers
Selling cars Gulliver
storesNew overseas
car dealers
New Japanesecar dealers
Car rental shops/Car sharing shops
Consumers
Consumers
53
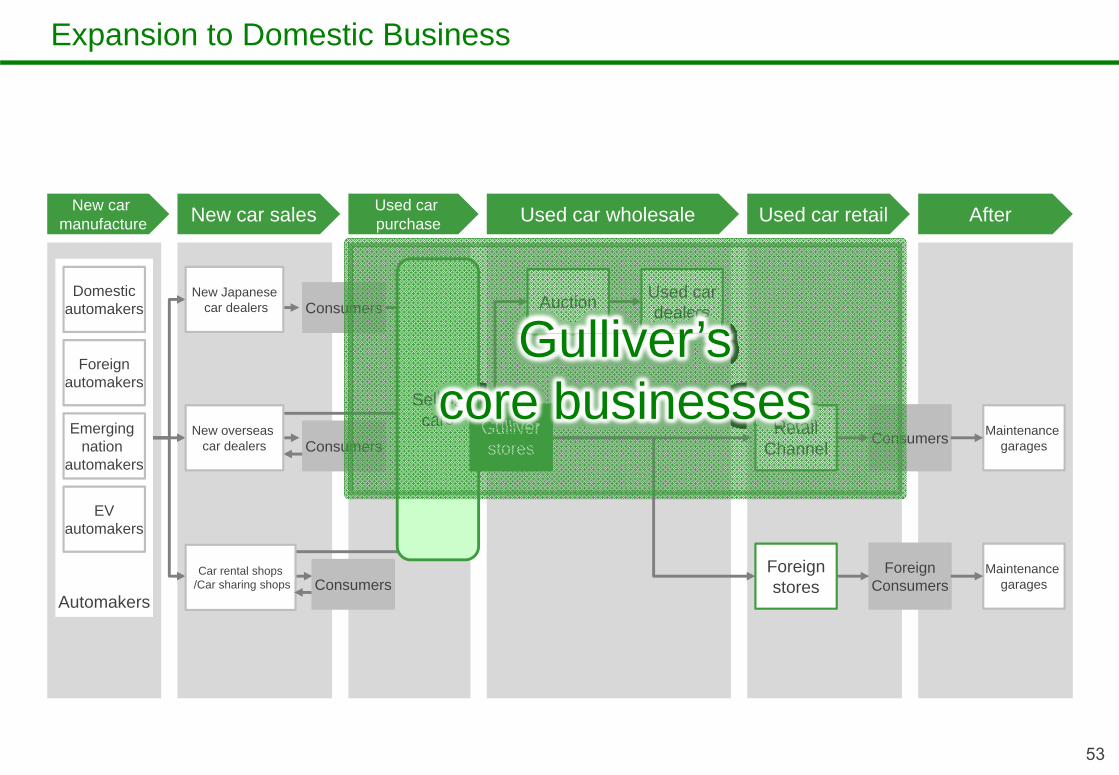
Expansion to Domestic Business
Automakers
Foreignstores
Used cardealers
RetailChannel
New car manufacture
Used car purchase
Consumers
ForeignConsumers
New car sales Used car wholesale Used car retail After
Maintenance garages
Maintenance garages
Auction
EVautomakers
Emerging nation
automakers
Domesticautomakers
Foreignautomakers
Selling cars Gulliver
stores
Consumers
New overseas car dealers
New Japanesecar dealers
Car rental shops/Car sharing shops
Consumers
Consumers
Gulliver’s core businesses

54
Expansion to Domestic Business
Automakers
Foreignstores
Used cardealers
RetailChannel
New car manufacture
Used car purchase
Consumers
ForeignConsumers
New car sales Used car wholesale Used car retail After
Maintenance garages
Maintenance garages
Auction
EVautomakers
Emerging nation
automakers
Domesticautomakers
Foreignautomakers
Selling cars Gulliver
stores
1. Expansion of used vehicle purchases
2. Expansion of sales routes
Consumers
New overseas car dealers
New Japanesecar dealers
Car rental shops/Car sharing shops
Consumers
Consumers
Gulliver’s core businesses

55
Expansion to Domestic Business
Automakers
Foreignstores
Used cardealers
RetailChannel
New car manufacture
Used car purchase
Consumers
ForeignConsumers
New car sales Used car wholesale Used car retail After
Maintenance garages
Maintenance garages
Auction
EVautomakers
Emerging nation
automakers
Domesticautomakers
Foreignautomakers
Selling cars Gulliver
stores
1. Expansion of used vehicle purchases
2. Expansion of sales routes
Consumers
New overseas car dealers
New Japanesecar dealers
Car rental shops/Car sharing shops
Consumers
Consumers
Gulliver’s core businesses
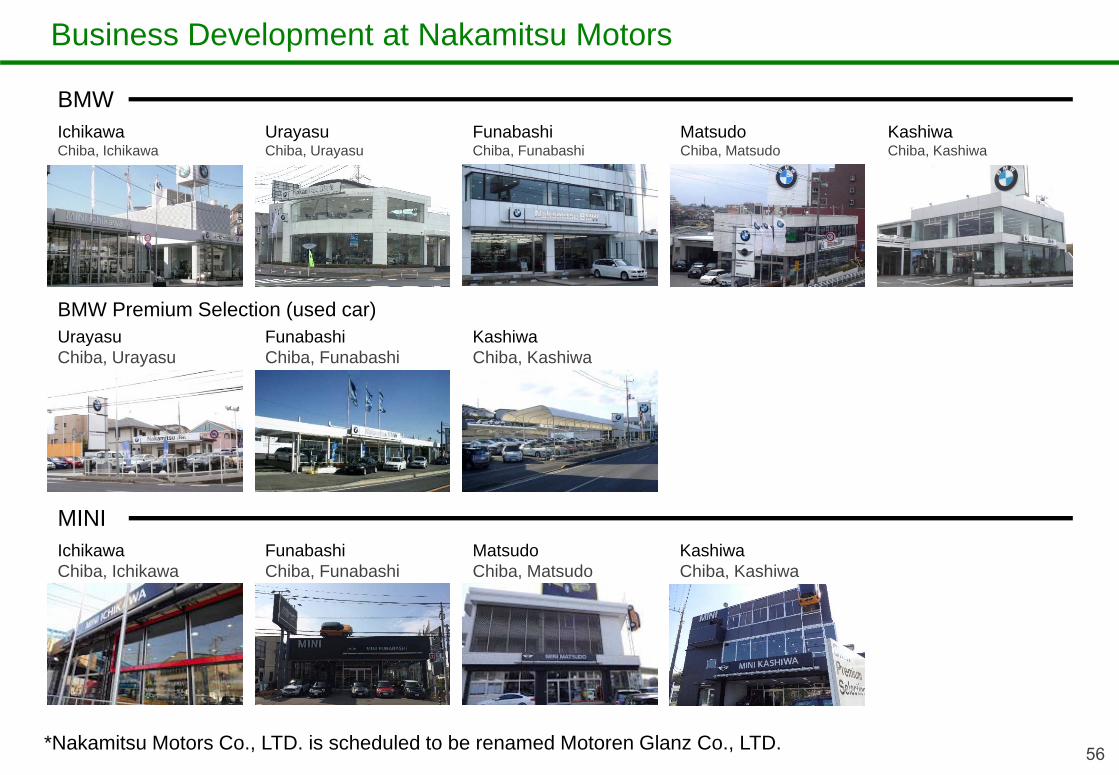
Business Development at Nakamitsu Motors
56
IchikawaChiba, Ichikawa
FunabashiChiba, Funabashi
MatsudoChiba, Matsudo
UrayasuChiba, Urayasu
FunabashiChiba, Funabashi
MatsudoChiba, Matsudo
KashiwaChiba, Kashiwa
UrayasuChiba, Urayasu
FunabashiChiba, Funabashi
KashiwaChiba, Kashiwa
IchikawaChiba, Ichikawa
KashiwaChiba, Kashiwa
BMW
MINI
BMW Premium Selection (used car)
*Nakamitsu Motors Co., LTD. is scheduled to be renamed Motoren Glanz Co., LTD.
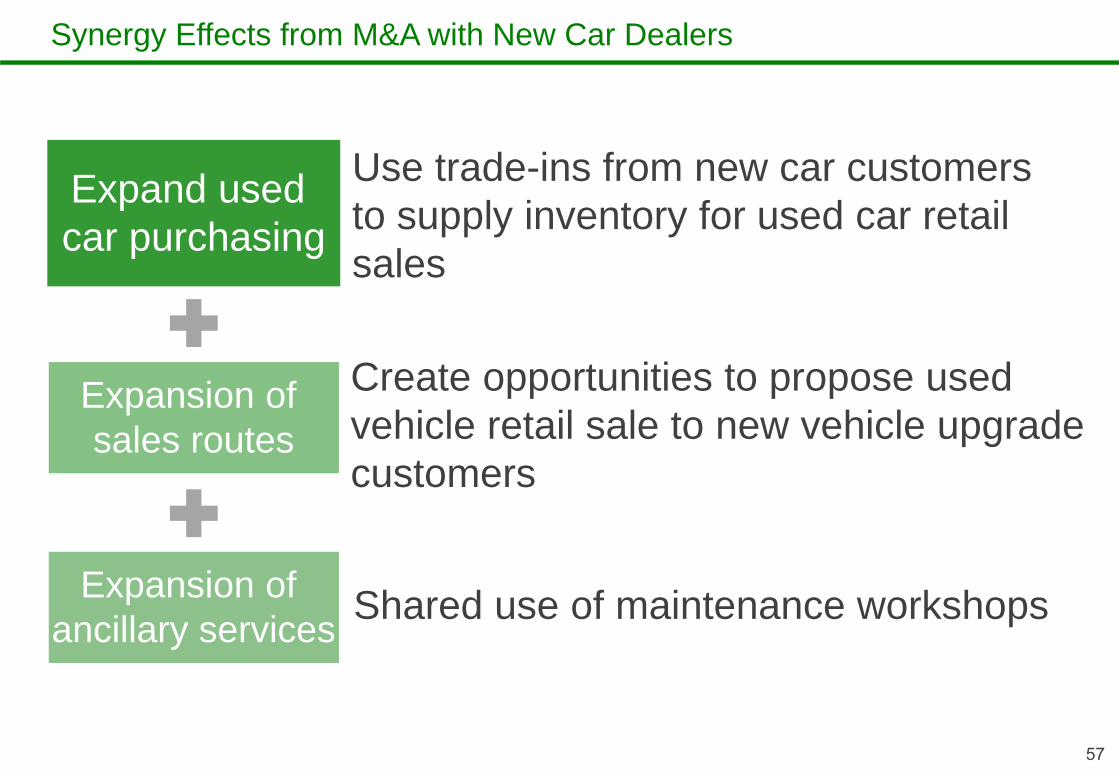
Synergy Effects from M&A with New Car Dealers
57
Use trade-ins from new car customers to supply inventory for used car retail sales
Create opportunities to propose used vehicle retail sale to new vehicle upgrade customers
Shared use of maintenance workshops
Expand used car purchasing
Expansion of sales routes
Expansion of ancillary services

58
Expansion to Domestic Business
Automakers
Foreignstores
Used cardealers
RetailChannel
New car manufacture
Used car purchase
Consumers
ForeignConsumers
New car sales Used car wholesale Used car retail After
Maintenance garages
Maintenance garages
Auction
EVautomakers
Emerging nation
automakers
Domesticautomakers
Foreignautomakers
Selling cars Gulliver
stores
1. Expansion of used vehicle purchases
2. Expansion of sales routes
Consumers
New overseas car dealers
New Japanesecar dealers
Car rental shops/Car sharing shops
Consumers
Consumers
Gulliver’s core businesses
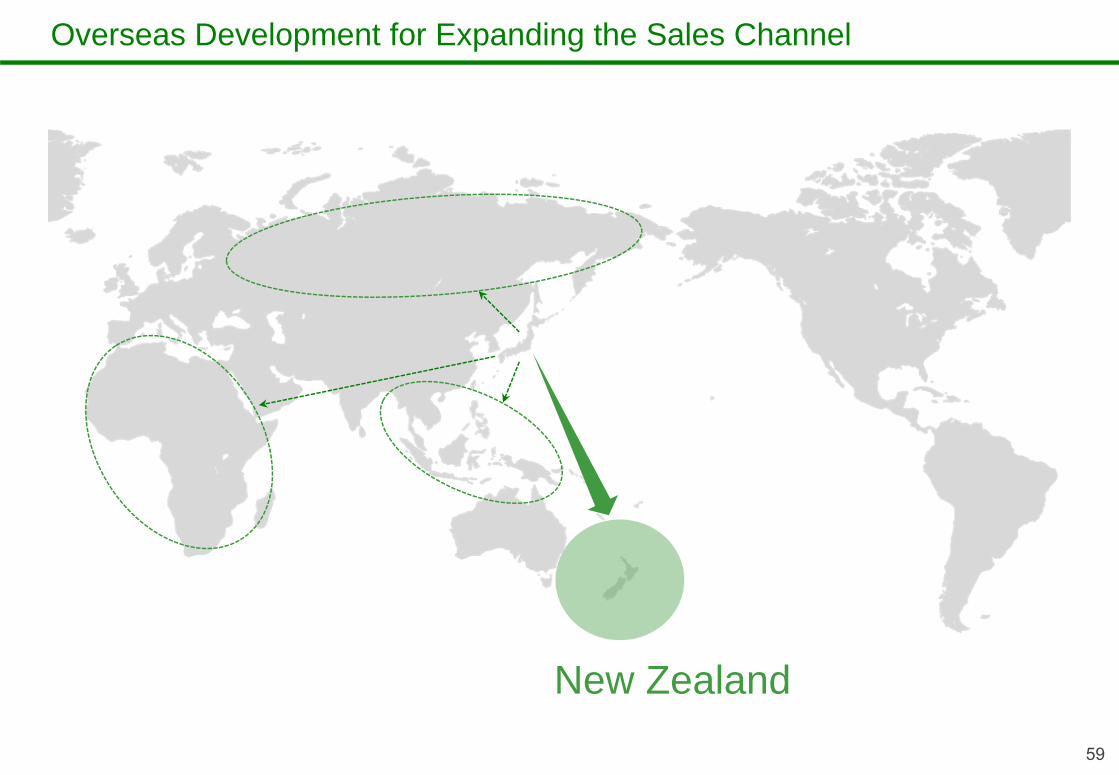
Overseas Development for Expanding the Sales Channel
59
New Zealand
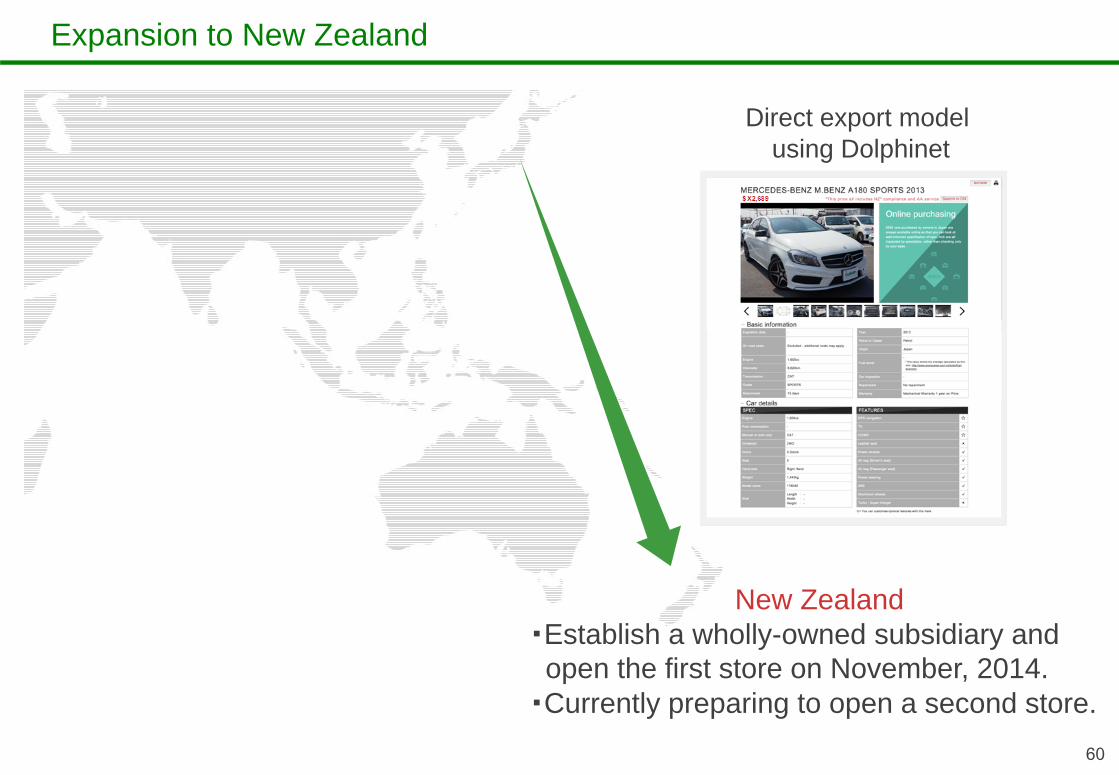
Expansion to New Zealand
60
New Zealand・Establish a wholly-owned subsidiary and open the first store on November, 2014.
・Currently preparing to open a second store.
Direct export modelusing Dolphinet

61
Expansion ofdomestic business
Expansion ofoverseas business
Create world's largest vehicle sales infrastructure

Target Areas of Overseas Business Expansion
62
USA
ASEAN
Australia

Expansion of overseas business
63
Growth Market
Underdeveloped used car market infrastructure
Gulliver’s policyDevelop an infrastructure business in
used car distribution
(New and used)cars market: Underdeveloped
ASEAN
Stable Market
(New and used)cars market: Mature
Gulliver’s policyM&A of new car dealers
Industry reorganization and consolidation
Australia

Article
Industry Reorganization and Consolidation
64
https://newspicks.com/news/647551/body

Search results
Industry Reorganization and Consolidation
65
Search results
Buffett dealers

Examples in the U.S.
66
* Sales and Net Income are Computed based on $1=¥112.5* Market capitalization as of July 2, 2015. Computed based on $1=¥123.0
New Cars BusinessAutoNation(http://www.autonation.com/)
Used Cars BusinessCarMax(http://www.carmax.com/)
Automobile Infrastructure・Internet BusinessCox Automotive(http://www.coxautoinc.com/)
million dollars418
billion dollars7.23
19,108
million dollars597
billion dollars13.91
million dollars14,268
Make them a group company
Group employees number around 24,000
Manheim(Auction)Autotrader(Internet Media)Kelly Blue Book(Internet Media)V Auto(Software)
MarketCapitalization
MarketCapitalization
Sales Sales
Net Income Net Income
million dollars
67
Future goals for Gulliver
Create world's largest vehicle sales infrastructure
* Reference : Medium-Term Business Plan & Result for Fiscal year to February 28, 2014
Ⅳ. Reference
68
69
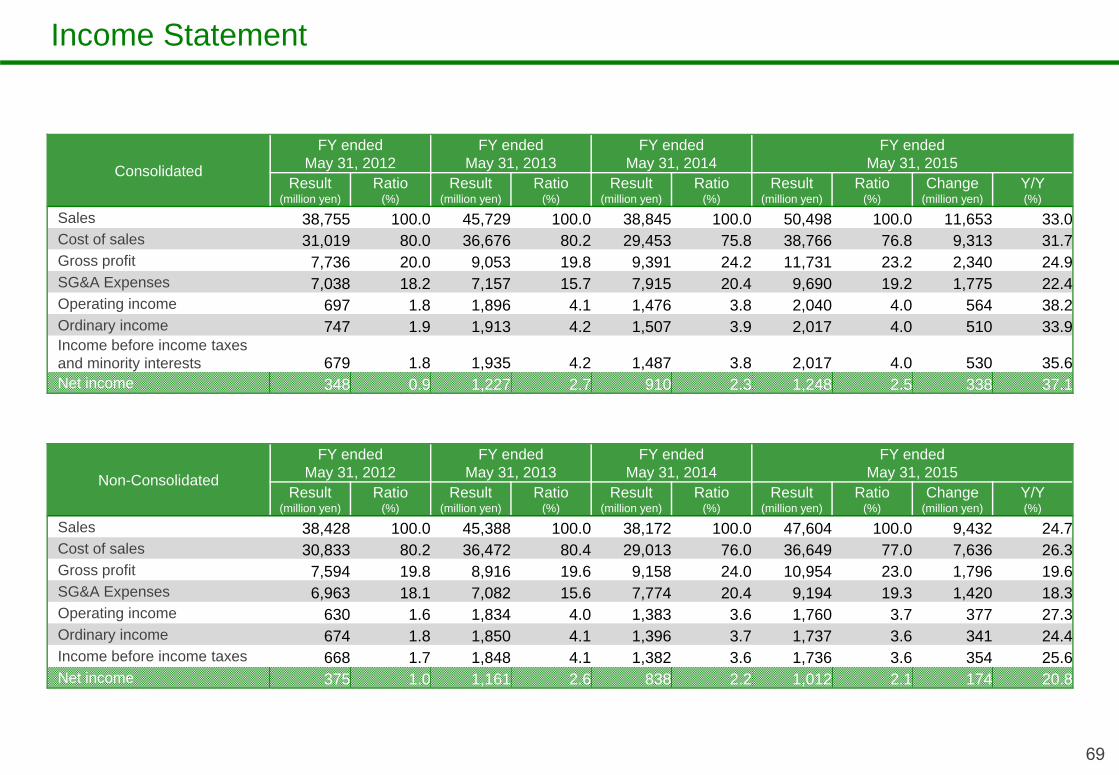
Income Statement
Consolidated
FY endedMay 31, 2012
FY endedMay 31, 2013
FY endedMay 31, 2014
FY endedMay 31, 2015
Result(million yen)
Ratio(%)
Result(million yen)
Ratio(%)
Result(million yen)
Ratio(%)
Result(million yen)
Ratio(%)
Change(million yen)
Y/Y(%)
Sales 38,755 100.0 45,729 100.0 38,845 100.0 50,498 100.0 11,653 33.0Cost of sales 31,019 80.0 36,676 80.2 29,453 75.8 38,766 76.8 9,313 31.7Gross profit 7,736 20.0 9,053 19.8 9,391 24.2 11,731 23.2 2,340 24.9SG&A Expenses 7,038 18.2 7,157 15.7 7,915 20.4 9,690 19.2 1,775 22.4Operating income 697 1.8 1,896 4.1 1,476 3.8 2,040 4.0 564 38.2Ordinary income 747 1.9 1,913 4.2 1,507 3.9 2,017 4.0 510 33.9Income before income taxes and minority interests 679 1.8 1,935 4.2 1,487 3.8 2,017 4.0 530 35.6Net income 348 0.9 1,227 2.7 910 2.3 1,248 2.5 338 37.1
Non-Consolidated
FY endedMay 31, 2012
FY endedMay 31, 2013
FY endedMay 31, 2014
FY endedMay 31, 2015
Result(million yen)
Ratio(%)
Result(million yen)
Ratio(%)
Result(million yen)
Ratio(%)
Result(million yen)
Ratio(%)
Change(million yen)
Y/Y(%)
Sales 38,428 100.0 45,388 100.0 38,172 100.0 47,604 100.0 9,432 24.7Cost of sales 30,833 80.2 36,472 80.4 29,013 76.0 36,649 77.0 7,636 26.3Gross profit 7,594 19.8 8,916 19.6 9,158 24.0 10,954 23.0 1,796 19.6SG&A Expenses 6,963 18.1 7,082 15.6 7,774 20.4 9,194 19.3 1,420 18.3Operating income 630 1.6 1,834 4.0 1,383 3.6 1,760 3.7 377 27.3Ordinary income 674 1.8 1,850 4.1 1,396 3.7 1,737 3.6 341 24.4Income before income taxes 668 1.7 1,848 4.1 1,382 3.6 1,736 3.6 354 25.6Net income 375 1.0 1,161 2.6 838 2.2 1,012 2.1 174 20.8
70
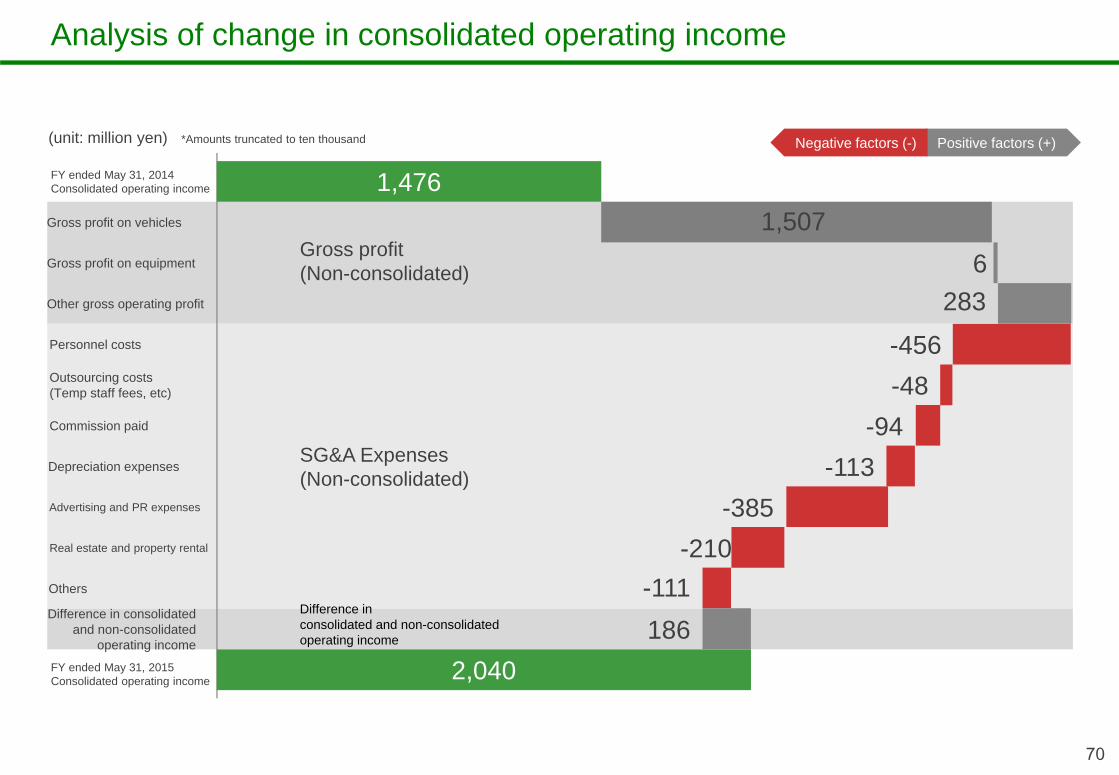
Analysis of change in consolidated operating income
1,476
2,040
1,5076
283
-456-48
-94-113
-385-2108
186-111
Positive factors (+)Negative factors (-)
Gross profit(Non-consolidated)
SG&A Expenses(Non-consolidated)
Difference in consolidated and non-consolidated operating income
(unit: million yen) *Amounts truncated to ten thousand
FY ended May 31, 2014Consolidated operating income
Gross profit on vehicles
Gross profit on equipment
Other gross operating profit
Personnel costs
Outsourcing costs(Temp staff fees, etc)
Commission paid
Depreciation expenses
Advertising and PR expenses
Real estate and property rental
Others
Difference in consolidated and non-consolidated
operating income
FY ended May 31, 2015Consolidated operating income
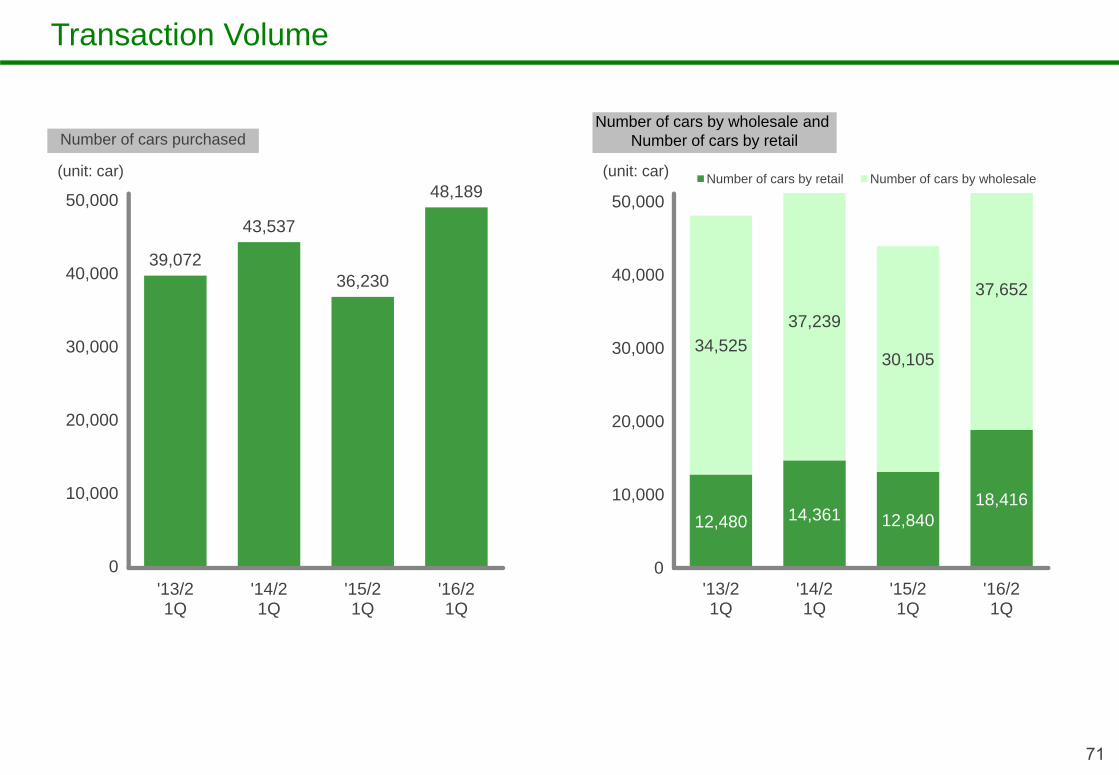
12,480 14,361 12,84018,416
34,52537,239
30,105
37,652
'13/21Q
'14/21Q
'15/21Q
'16/21Q
Number of cars by retail Number of cars by wholesale
39,072
43,537
36,230
48,189
'13/21Q
'14/21Q
'15/21Q
'16/21Q
71
Transaction Volume
50,000
40,000
30,000
20,000
10,000
0 0
50,000
40,000
30,000
20,000
10,000
Number of cars purchasedNumber of cars by wholesale and
Number of cars by retail
(unit: car) (unit: car)
72
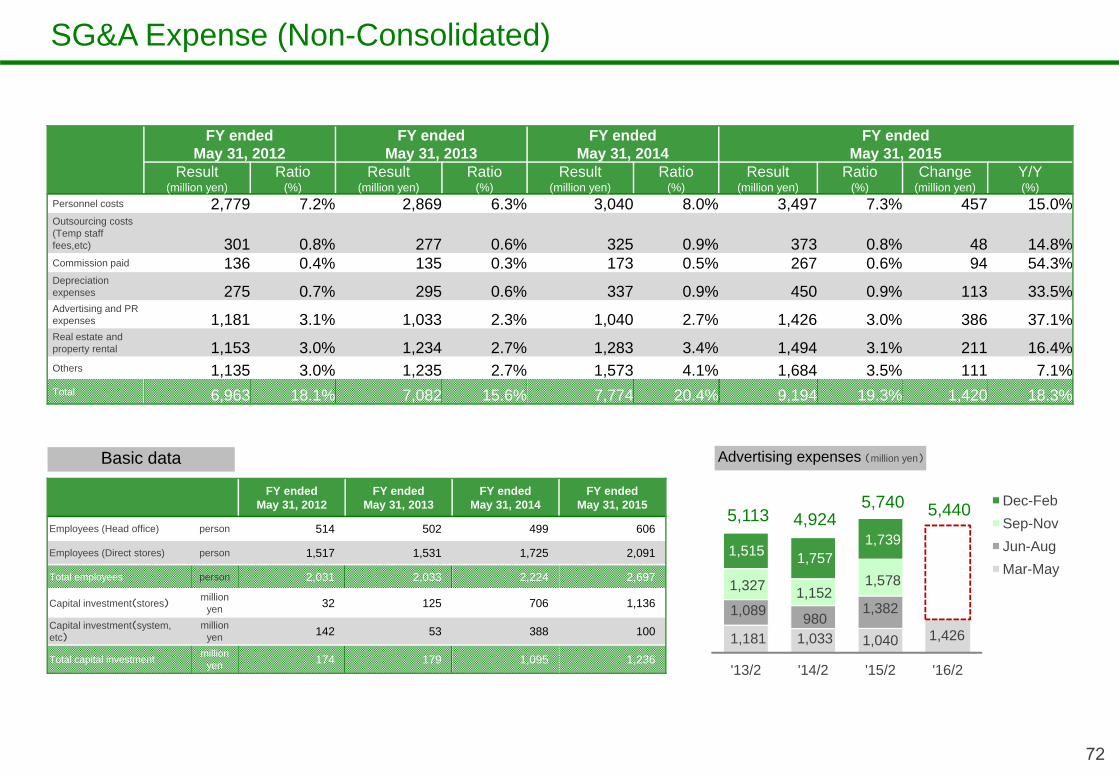
SG&A Expense (Non-Consolidated)
FY endedMay 31, 2012
FY endedMay 31, 2013
FY endedMay 31, 2014
FY endedMay 31, 2015
Result(million yen)
Ratio(%)
Result(million yen)
Ratio(%)
Result(million yen)
Ratio(%)
Result(million yen)
Ratio(%)
Change(million yen)
Y/Y(%)
Personnel costs 2,779 7.2% 2,869 6.3% 3,040 8.0% 3,497 7.3% 457 15.0%Outsourcing costs(Temp stafffees,etc) 301 0.8% 277 0.6% 325 0.9% 373 0.8% 48 14.8%Commission paid 136 0.4% 135 0.3% 173 0.5% 267 0.6% 94 54.3%Depreciation expenses 275 0.7% 295 0.6% 337 0.9% 450 0.9% 113 33.5%Advertising and PR expenses 1,181 3.1% 1,033 2.3% 1,040 2.7% 1,426 3.0% 386 37.1%Real estate and property rental 1,153 3.0% 1,234 2.7% 1,283 3.4% 1,494 3.1% 211 16.4%Others 1,135 3.0% 1,235 2.7% 1,573 4.1% 1,684 3.5% 111 7.1%Total 6,963 18.1% 7,082 15.6% 7,774 20.4% 9,194 19.3% 1,420 18.3%
FY endedMay 31, 2012
FY endedMay 31, 2013
FY endedMay 31, 2014
FY endedMay 31, 2015
Employees (Head office) person 514 502 499 606
Employees (Direct stores) person 1,517 1,531 1,725 2,091
Total employees person 2,031 2,033 2,224 2,697
Capital investment(stores)million
yen 32 125 706 1,136
Capital investment(system, etc)
million yen 142 53 388 100
Total capital investment million yen 174 179 1,095 1,236
'13/2 '14/2 '15/2 '16/2
Dec-FebSep-NovJun-AugMar-May
1,033980
1,152
1,757
4,9245,740
1,040
1,382
1,578
1,739
1,181
1,089
1,327
1,515
5,113 5,440
1,426
Basic data Advertising expenses (million yen)
73
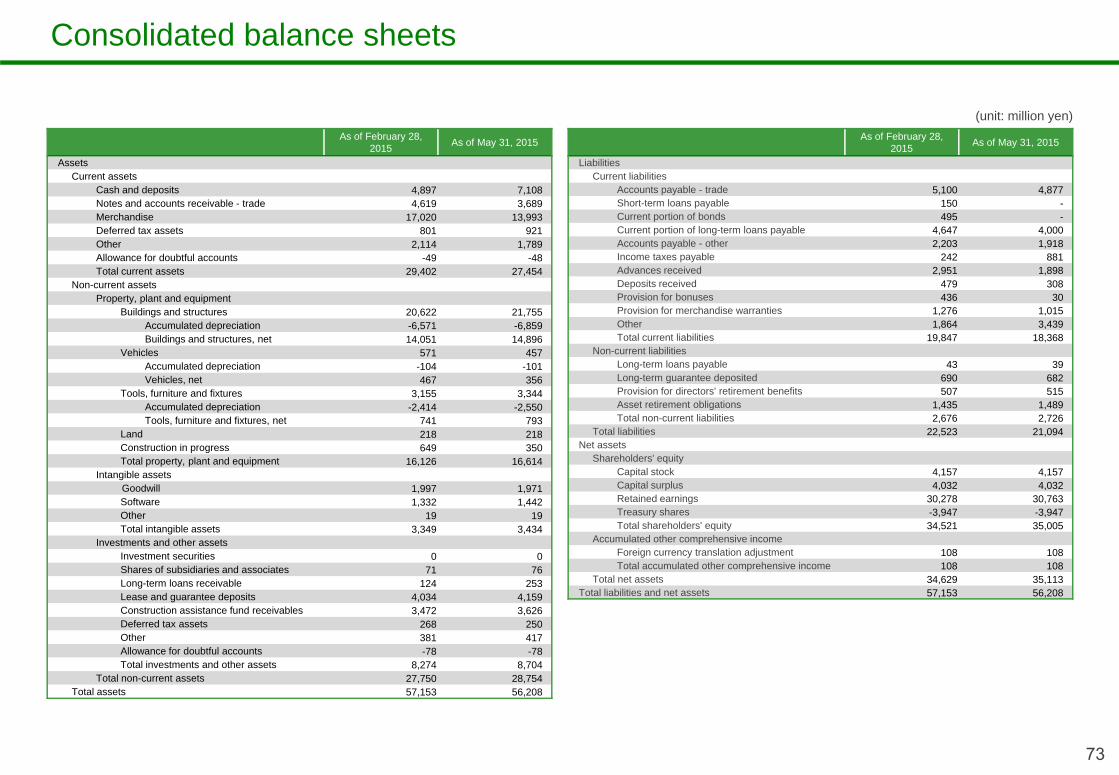
Consolidated balance sheets
As of February 28, 2015 As of May 31, 2015
LiabilitiesCurrent liabilities
Accounts payable - trade 5,100 4,877Short-term loans payable 150 -Current portion of bonds 495 -Current portion of long-term loans payable 4,647 4,000Accounts payable - other 2,203 1,918Income taxes payable 242 881Advances received 2,951 1,898Deposits received 479 308Provision for bonuses 436 30Provision for merchandise warranties 1,276 1,015Other 1,864 3,439Total current liabilities 19,847 18,368
Non-current liabilitiesLong-term loans payable 43 39Long-term guarantee deposited 690 682Provision for directors' retirement benefits 507 515Asset retirement obligations 1,435 1,489Total non-current liabilities 2,676 2,726
Total liabilities 22,523 21,094Net assets
Shareholders' equityCapital stock 4,157 4,157Capital surplus 4,032 4,032Retained earnings 30,278 30,763Treasury shares -3,947 -3,947Total shareholders' equity 34,521 35,005
Accumulated other comprehensive incomeForeign currency translation adjustment 108 108Total accumulated other comprehensive income 108 108
Total net assets 34,629 35,113Total liabilities and net assets 57,153 56,208
As of February 28, 2015 As of May 31, 2015
AssetsCurrent assets
Cash and deposits 4,897 7,108 Notes and accounts receivable - trade 4,619 3,689 Merchandise 17,020 13,993 Deferred tax assets 801 921 Other 2,114 1,789 Allowance for doubtful accounts -49 -48 Total current assets 29,402 27,454
Non-current assetsProperty, plant and equipment
Buildings and structures 20,622 21,755 Accumulated depreciation -6,571 -6,859 Buildings and structures, net 14,051 14,896
Vehicles 571 457 Accumulated depreciation -104 -101 Vehicles, net 467 356
Tools, furniture and fixtures 3,155 3,344 Accumulated depreciation -2,414 -2,550 Tools, furniture and fixtures, net 741 793
Land 218 218 Construction in progress 649 350 Total property, plant and equipment 16,126 16,614
Intangible assetsGoodwill 1,997 1,971 Software 1,332 1,442 Other 19 19 Total intangible assets 3,349 3,434
Investments and other assetsInvestment securities 0 0 Shares of subsidiaries and associates 71 76 Long-term loans receivable 124 253 Lease and guarantee deposits 4,034 4,159 Construction assistance fund receivables 3,472 3,626 Deferred tax assets 268 250 Other 381 417 Allowance for doubtful accounts -78 -78 Total investments and other assets 8,274 8,704
Total non-current assets 27,750 28,754 Total assets 57,153 56,208
(unit: million yen)