Embed Size (px)
Citation preview


COVER SHEET
A S 0 9 6 - 0 0 5 5 5 5
S.E.C. Registration Number
P H I L I P P I N E N A T I O N A L B A N K
Company’s Full Name)
P N B F I N A N C I A L C E N T E R
P R E S I D E N T D I O S D A D O
M A C A P A G A L B L V D . , P A S A Y C I T Y
(Business Address: No. Street City/Town/ Province)
Christine B. Marzan 8891-60-40
Contact Person Company Telephone Number
9 3 0 17 - Q
4 30
Month Day FORM TYPE Month Day
Fiscal Year Annual Meeting
Secondary License Type, If Applicable
C F D
Dept. Requiring this Doc. Amended Articles Number/Section
Total amount of Borrowings
36,527
Total No. of Stockholders Domestic Foreign -----------------------------------------------------------------------------------------------------------------------------------------------------------
To be accomplished by SEC Personnel concerned
File Number LCU
Document I.D. Cashier
S T A M P S
Remarks = pls. use black ink for scanning purposes

SEC Number AS096-005555
File Number
PHILIPPINE NATIONAL BANK
AND SUBSIDIARIES (Company’s Full Name)
PNB Financial Center,
Pres. Diosdado P. Macapagal Boulevard, Pasay City (Company’s Address)
(632) 8891-6040 to 70 (Telephone Number)
December 31, 2018
(Calendar Year Ended)
SEC FORM 17-Q REPORT Form Type
(Amendment Designation (if applicable)
SEPTEMBER 30, 2019 Period Ended Date
LISTED
(Secondary License Type and File Number)

SECURITIES AND EXCHANGE COMMISSION
SEC FORM 17-Q
QUARTERLY REPORT PURSUANT TO SECTION 17 OF THE SECURITIES REGULATION CODE
AND SRC RULE 17(2)(b) THEREUNDER
1. For the quarter ended : September 30, 2019 2. Commission Identification No. : AS096-005555
3. BIR Tax Identification No. : 000-188-209-000
4. Exact name of issuer as specified in its charter : Philippine National Bank
5. Province, country or other jurisdiction of : Metro Manila, Philippines
incorporation or organization
6. Industry Classification Code :
7. Address of principal office : PNB Financial Center, Pres. Diosdado P. Macapagal Blvd, Pasay City, 1300
8. Issuer’s telephone number, including area code : (632) 8891-60-40 up to 70 / (632) 8526-3131 to 70
9. Former name, former address, and former fiscal year, if changed since last report : N/A
10. Securities registered pursuant to Sections 8 and 12 of the Code or Sections 4 and 8 of the RSA
Title of Each Class No. of Shares of Common Stock Amount of Debt Outstanding Outstanding (Unpaid Subscription)
Common Shares 1,525,764,850 None
11. Are any or all of these securities listed on a Stock Exchange:
Yes [ Ö ] No [ ]
Stock Exchange : Philippine Stock Exchange Class of Securities : Common Shares
12. Indicate by check mark whether the registrant:
a) has filed all reports required to be filed by Section 17 of the Code and SRC Rule 17 thereunder or Section 11 of the RSA and RSA Rule 11 (a) – 1 thereunder, and Sections 26 and 141 of the Corporation Code of the Philippines during the preceding twelve (12) months (or for such shorter period that the registrant was required to file such reports)
Yes [ Ö ] No [ ]
b) has been subject to such filing requirements for the past ninety (90) days.
Yes [ Ö ] No [ ]
(SEC Use Only)

PART I - FINANCIAL INFORMATION
FINANCIAL STATEMENTS
1. Philippine National Bank (the Parent Company) was established in the Philippines in 1916 and started commercial operations that same year. The Parent Company is one of the country’s largest private universal banks in terms of assets and deposits. It provides a full range of banking and other financial services to its highly diverse clientele comprised of individual depositors, small and medium enterprise, domestic and international corporations, government institutions, and overseas Filipinos. The subsidiaries of the Parent Company are engaged in a number of diversified financial and related businesses such as remittance, non-life insurance, banking, leasing, stock brokerage, foreign exchange trading and/or related services. Collectively, the Parent Company and its subsidiaries are referred to as “the Group”.
2. The unaudited interim consolidated financial statements included in this regulatory filing contains the following:
· Statements of financial position
· Statements of income
· Statements of changes in equity
· Statements of cash flows
· Schedule of aging of accounts receivable
· Selected explanatory notes and other schedules and information in compliance with the requirements of the Securities Regulations Code
3. The accompanying unaudited interim financial statements have been prepared in accordance with
Philippine Financial Reporting Standards (PFRS) adopted by the Philippine Securities and Exchange Commission (SEC).
4. The accompanying interim financial statements of the Group have accordingly been prepared consistent with the most recent annual audited financial statements as of December 31, 2018, except for the new, amended or improved PFRSs which became effective beginning on or after January 1, 2019.

- 2 - SEC 17Q Report 3Q19
MANAGEMENT’S DISCUSSION AND ANALYSIS OF FINANCIAL CONDITION AND RESULTS OF
OPERATIONS
1. Financial condition as at September 30, 2019 (Unaudited) compared to December 31, 2018
(Audited)
The Group’s consolidated total assets stood at P1.2 trillion as of September 30, 2019, 19.9% or P195.8 billion higher compared to P983.6 billion reported as of December 31, 2018. Changes (more than 5%) in assets were registered in the following accounts:
· Due from Bangko Sentral ng Pilipinas (BSP) and Interbank Loans Receivable registered increases by P45.8 billion and by P15.8 billion, respectively from P102.7 billion and P11.2 billion, respectively as of December 31, 2018.
· Cash and Other Cash Items, Due from Other Banks and Securities Held Under Agreements to Resell as of September 30, 2019 at P14.6 billion, P17.0 billion and P1.4 billion, respectively, decreased by P2.2 billion, P3.5 billion and P19.3 billion compared to P16.8 billion, P20.5 billion and P20.7 billion, respectively, as of December 31, 2018.
Please refer to the statements of cash flows for more information relating to cash and other cash items.
· Financial Assets at Fair Value Through Profit or Loss (FVTPL) at P17.0 billion was higher by 70.4% or P7.0 billion from P10.0 billion as of December 31, 2018 attributed mainly to the purchases and sale of various investment securities.
· Financial Assets at Fair Value Through Other Comprehensive Income (FVOCI) was higher at P134.0 billion as of September 30, 2019, an increase of P82.3 billion or by 159.3% from the P51.7 billion level as of December 31, 2018 due to acquisitions of various investment securities net of matured accounts.
· Financial Assets at Amortized Cost was higher at P104.9 billion as of September 30, 2019, an increase of P5.1 billion or by 5.1% from the P99.8 billion level as of December 31, 2018 due to acquisitions of various investment securities.
· Loans and Receivables increased by P63.1 billion or 10.9%, at P644.8 billion as of September 30, 2019 from P581.7 billion as of December 31, 2018, due mainly from increase in corporate loans.
· Property and Equipment went up by P1.7 billion from P19.7 billion as of December 31, 2018 to P21.4 billion as of September 30, 2019, mainly due to the P1.7 billion transition adjustment as a result of the adoption of PFRS 16 – Leases. PFRS 16 requires lessees to recognize all qualified lease contracts as Right-to-Use Assets with the related Lease Liability in the balance sheet.
· Investment in an Associate of P2.7 billion pertains to the investment of the Parent Company representing 44% ownership in Allianz PNB Life Insurance, Inc.
· Deferred Tax Asset decreased by P0.1 billion or 6.0%, at P2.0 billion as of September 30, 2019 from P2.1 billion as of December 31, 2018.

- 3 - SEC 17Q Report 3Q19
· Assets of Disposal Group Classified as Held for Sale represents assets of PNB General Insurers(PNB Gen). As of September 30, 2019, PNB Gen assets is at P8.3 billion, slightly higher compared to P8.2 billion as of December 31, 2018. With PNB Gen being classified as discontinued operation in 2018, the comparative consolidated statement of income and comprehensive income and cash flow in September 2018 have been re-presented to show the discontinued operations separately from the continued operations.
· Other Assets amounted to P5.7 billion as of September 30, 2019 or a decrease of P0.4 billion from P6.1 billion as of December 31, 2018.
Consolidated liabilities increased by 20.2% or P172.5 billion from P855.1 billion as of December 31, 2018 to P1.0 trillion as of September 30, 2019. Major changes in liability accounts were as follows:
· Deposit Liabilities totaled P821.0 billion, P87.7 billion or 12.0% higher compared to its year-end 2018 level of P733.3 billion. Demand deposits, and Time deposits went up by P12.2 billion or 8.0%, and P114.3 billion or 77.6%, respectively, partially offset by the decrease in Savings deposits, and Long-Term Negotiable Certificate of Deposits (LTNCD) by P38.0 billion or 9.5%, and by P0.8 billion or 2.6%, respectively.
· Financial liabilities at FVTPL increased by P0.1 billion from 2018 year-end balance of P0.5 billion mainly from the increase in negative fair value balance of interest rate swaps and forwards.
· Bonds Payable increased by P52.2 billion, from P15.6 billion as of December 31, 2018 to P67.8 billion as of September 30, 2019, mainly accounted for by the Parent Company’s issuance of P13.7 billion fixed-rate bonds on May 8, 2019 due 2021 and additional issuance of US$750 million fixed-rate senior notes from its Euro Medium Term Note (EMTN) Program on June 27, 2019 maturing on September 27, 2024.
· Bills and Acceptances Payable increased by P31.1 billion or 44.4% from P70.1 billion to P101.2 billion as of December 31, 2018 and September 30, 2019, respectively, mostly attributable to interbank loans from the BSP and local banks .
· Lease liability of P1.5 billion pertains to the lease liability of the Group as a result of the adoption of PFRS 16 – Leases. Refer to the Property and Equipment discussion above.
· Accrued Taxes, Interest and Other Expenses was higher by P1.0 billion, from P6.2 billion as of December 31, 2018 to P7.2 billion as of September 30, 2019, mainly due to the increase in accrued interest from deposits and bonds.
· Income Tax Payable decreased by P0.2 billion from P0.9 billion to P0.7 billion as of December 31, 2018 and September 30, 2019, respectively.

- 4 - SEC 17Q Report 3Q19
Total equity accounts stood at P152.0 billion from P128.6 billion as of December 31, 2018, or an improvement of P23.4 billion attributed mainly to the following:
· Capital Stock and Additional Paid-In Capital increased by P11.8 billion from the net proceeds from the 2019 Stock Rights Offering.
· current period’s net income attributable to Equity Holders of the Parent Company of P6.3 billion.
· decrease in Accumulated Translation Gain of P0.7 billion. · improvement in Net unrealized gains/(losses) on Financial Assets at FVOCI from a P3.2 billion
loss as of December 31, 2018 to a gain amounting to P2.6 billion as of September 30, 2019, resulting in an unrealized gain of P5.8 billion for the period.
2. Results of operation for the nine months ended September 30, 2019 (Unaudited) compared to same period ended September 30, 2018 (Unaudited) A. For the Nine Months Ended September 30, 2019 vs. September 30, 2018
For the nine months ended September 30, 2019, the Group registered a net income of P6.4 billion, P1.1 billion or 14.8% lower than the P7.5 billion net income for the same period last year on account of significant decline in net gains on sale or exchange of assets. The Group’s core income comprising primarily of net interest income and net service fees and commissions recorded substantial improvements in the current period. Net income for the current period also included significant increase in net gains from trading and investment securities.
· Net interest income totaled P23.4 billion, higher by 16.9% or P3.4 billion compared to the same period last year mainly due to the expansion in loan, interbank loans, and trading and investment securities portfolios which accounted for the P7.8 billion, P0.1 billion, P0.2 billion and P3.3 billion increase in interest income, respectively, partly offset by the decrease of P0.2 billion in deposits with banks and others. Total interest income increased by 43.3% or P11.2 billion from P25.9 billion to P37.1 billion. Total interest expense also increased to P13.7 billion or by P7.8 billion from P5.9 billion for the same period last year primarily due to growth in deposit liabilities and other borrowings.
· Other income decreased to P3.4 billion compared to P7.0 billion for the same period last year mainly due to decline in net gains on sale or exchange of assets, and foreign exchange gains of P4.1 billion, and P0.5 billion, respectively, partly offset by higher net gains in trading and investment securities by P1.0 billion.
· Net service fees and commission income stood at P2.9 billion, 14.3% or P0.4 billion higher compared the same period last year driven by growth in deposit and credit card related fees.
· Administrative and other operating expenses amounted to P21.2 billion for the nine months ended September 30, 2019, or 10.7% higher compared to the same period last year as strong revenue growth, particularly in interest income and trading gains, translated to higher business related taxes.
· Reported net income (loss) from discontinued operations for the nine months ended September 30, 2019 and 2018 pertains to the Net Income of PNB General Insurers Company, Inc. Classified as Held for Sale.

- 5 - SEC 17Q Report 3Q19
· Total Comprehensive Income for the nine months ended September 30, 2019 amounted to P11.6 billion which is P5.4 billion or 87.5% higher than the same period last year due mainly to increase in net unrealized gains on financial assets at FVOCI.
B. For the Quarter Ended September 30, 2019 vs. September 30, 2018 For the quarter ended September 30, 2019, the Group registered a net income of P2.4 billion, P0.3 billion or 17.1% higher than the P2.1 billion net income for the quarter ended September 30, 2018 on account of significant decline in net gains on foreign exchange. The increase in net income was attributed to improvements in the Group’s core income comprising primarily of net interest income and net service fees and commissions, as well as non recurring net gains from sale or exchange of assets.
· Net interest income totaled P8.7 billion, higher by 25.0% or P1.7 billion compared to the same quarter last year mainly due to the expansion in loan and investment securities portfolios which accounted for the P2.7 billion and P1.5 billion increase in interest income, respectively. Total interest income increased by 45.8% or P4.2 billion from P9.2 billion to P13.4 billion. Total interest expense also increased to P4.8 billion or by P2.5 billion from P2.3 billion for the same quarter last year primarily due to growth in deposit liabilities and other borrowings.
· Other income is lower at P975.2 million in the current quarter from P1.0 billion for the same quarter last year mainly due to decline in net gain on foreign exchange gains by P0.5 billion, partially offset by the increase in net gains on sale of exchange of assets, and trading and investment securities of P0.3 billion and P0.1 billion, respectively.
· Net service fees and commission income slightly increased to P1.0 billion for the quarter ended September 30, 2019 from P0.8 billion for the quarter ended September 30, 2018.
· Administrative and other operating expenses increased to P7.4 billion for the quarter ended September 30, 2019 from P6.2 billion for the same quarter last year, mainly due to increase in Provision for impairment, credit and other losses, taxes and licenses, depreciation and amortization, and miscellaneous by P0.3 billion, P0.4 billion, P0.2 billion and 0.3 billion, respectively, partly offset by a decrease in Occupancy and equipment-related costs by P0.1 billion.
· Reported net income from discontinued operations for the quarters ended September 30, 2019 and September 30, 2018 pertains to the Net Income of PNB Gen Classified as Held for Sale.
· Total Comprehensive Income for the quarter ended September 30, 2019 amounted to P4.1 billion.

- 6 - SEC 17Q Report 3Q19
3. Key performance indicators 09/30/2019 09/30/2018 12/31/2018 Income statement Return on equity (ROE)1/ 6.11% 8.18% 7.70% Return on assets (ROA)2/ 0.79% 1.15% 1.05% Net interest margin (NIM)3/ 3.18% 3.39% 3.30% Cost efficiency ratio4/ 66.79% 60.83% 60.98%
Balance sheet BSP Capital Adequacy Ratios (CAR):
CAR 14.58% 14.76% 14.35% Tier 1 Ratio 13.78% 14.03% 13.55%
Non-performing loans (NPL) Ratio:
Net of allowance 0.52% 0.37% 0.34% Gross of allowance 1.74% 1.90% 1.76%
Liquid assets-to-Total assets Ratio 30.49% 23.92% 23.77% Current assets-to-current liabilities 61.34% 55.90% 54.89%
1/ Annualized net income divided by average total equity for the period indicated 2/ Annualized net income divided by average total assets for the period indicated 3/ Annualized net interest income divided by average interest-earning assets for the period indicated. 4/ Ratio of total operating expenses (excluding provision for impairment, credit and other losses) to total operating income.
· Consolidated risk-based CAR and Tier 1 ratio computed based on BSP guidelines continue to remain above minimum regulatory requirements. These ratios measure the Group’s capital buffers relative to various risks it assumes. The Group’s regulatory capital ratios was lower compared to year-end, as growth in risk-weighted assets, particularly credit risk, outpaced increases in qualifying regulatory capital.
· On July 22, 2019, the Parent Company issued and listed 276,625,172 new shares from the SRO with a corresponding increase in Total Equity by P11.8 billion. With the additional capital, the Group improved its CAR by 58 basis points from last quarter of 14.00%.
· Other financial soundness indicators are shown in Annex A.
SELECTED NOTES TO THE INTERIM FINANCIAL STATEMENTS
1. Fair value hierarchy
· The significant judgments and assumptions made in the Group’s interim financial statements are consistent with the most recent annual financial statements issued.
· The Group uses the following hierarchy for determining and disclosing the fair value of assets and liabilities by valuation technique. These levels are based in the inputs that are used to determine the fair value and can be summarized in: o Level 1: quoted (unadjusted) prices in active markets for identical assets or liabilities o Level 2: other techniques for which all inputs which have a significant effect on the recorded
fair value are observable, either directly or indirectly o Level 3: techniques which use inputs which have a significant effect on the recorded fair
value that are not based on observable market data.

- 7 - SEC 17Q Report 3Q19
· The Group held the following assets and liabilities measured at fair value and at cost but for which fair values are disclosed and their corresponding level in fair value hierarchy:
Consolidated
September 30, 2019
Valuation
Date
Carrying
Value Level 1 Level 2 Level 3 Total
Assets measured at fair value:
Financial Assets
Financial assets at FVTPL:
Government securities 09/30/19 P=14,440,224 P=8,019,326 P=6,420,898 P=– P=14,440,224
Equity securities 09/30/19 1,536,111 1,536,111 – – 1,536,111
Derivative assets 09/30/19 359,410 – 345,153 14,257 359,410
Private debt securities 09/30/19 693,019 2,653 690,366 – 693,019
Investment in UITFs 09/30/19 5,348 – 5,348 – 5,348
Financial assets at FVOCI:
Government securities 09/30/19 101,861,198 79,931,536 21,929,662 – 101,861,198
Private debt securities 09/30/19 31,176,069 19,858,609 7,243,701 4,073,759 31,176,069
Equity securities* 09/30/19 224,989 48,372 176,617 – 224,989
P=150,296,368 P=109,396,607 P=36,811,745 P=4,088,016 P=150,296,368
Liabilities measured at fair value:
Financial Liabilities
Financial liabilities at FVTPL:
Derivative liabilities 09/30/19 P=566,659 P=– P= 566,659 P=– P=566,659
P=566,659 P=– P=566,659 P=– P=566,659
Assets for which fair values are
disclosed:
Financial Assets
Financial assets at amortized cost 09/30/19 P=104,895,739 P=71,721,472 P=34,781,650 P=111,342 P=106,614,464
Loans and receivables:**
Receivables from customers 09/30/19 P=631,673,001 P=– P=668,098,131 P=– P=668,098,131
Nonfinancial Assets
Investment properties:***
Land 09/30/19 P=11,168,639 P=– P=– P=20,350,126 P=20,350,126
Buildings and improvements 09/30/19 2,598,433 – – 4,868,680 4,868,680
P=750,335,812 P=71,721,472 P=702,879,781 P=25,330,148 P=799,931,401
Liabilities for which fair values are
disclosed:
Financial Liabilities
Financial liabilities at amortized cost:
Time deposits 09/30/19 P=261,480,342 P=– P=– P=261,480,342 P=261,480,342
LTNCD's 09/30/19 30,578,729 – – 30,233,260 30,233,260
Bonds Payable 09/30/19 67,829,741 – – 71,860,875 71,860,875
Bills payable 09/30/19 100,075,525 – – 100,272,031 100,272,031
P=459,964,337 P=– P=– P=463,846,508 P=463,846,508
* Excludes unquoted equity securities
** Net of allowance for credit losses
*** Based on the fair values from appraisal reports which are different from their carrying amounts which are carried at cost

- 8 - SEC 17Q Report 3Q19
Consolidated
December 31, 2018
Valuation
Date Carrying
Value Level 1 Level 2 Level 3 Total
Assets measured at fair value:
Financial Assets:
Financial assets at FVTPL: Government securities 12/28/18 P=8,457,711 P=7,127,592 P=1,330,119 P=– P=8,457,711Derivative assets 12/28/18 574,629 – 516,775 57,854 574,629
Private debt securities 12/28/18 415,583 – 415,583 – 415,583
Equity securities 12/28/18 545,149 545,149 – – 545,149Investments in UITF 12/28/18 6,375 – 6,375 – 6,375
Financial assets at FVOCI:
Government securities 12/28/18 33,116,495 19,415,700 13,700,795 – 33,116,495
Private debt securities 12/28/18 17,672,009 5,581,723 12,090,285 – 17,672,008Equity securities* 12/28/18 885,663 488,029 281,910 115,724 885,663
P=61,673,614 P=33,158,193 P=28,341,842 P=173,578 P=61,673,613
Liabilities measured at fair value: Financial Liabilities Financial Liabilities at FVTPL:
Designated at FVTPL:
Derivative liabilities 12/28/18 P=470,648 P=– P=470,648 P=– P=470,648
Assets for which fair values are disclosed:
Financial Assets
Financial assets at amortized cost 12/28/18 P=99,772,711 P=87,006,196 P=8,980,697 P=200,702 P=96,187,595
Loans and Receivables:**
Receivables from customers 12/28/18 561,627,786 – – 563,770,117 563,770,117Unquoted debt securities 12/28/18 – – – – –
P=661,400,497 P=87,006,196 P=8,980,697 P=563,970,819 P=659,957,712
Nonfinancial Assets Investment property:***
Land 12/28/18 P=11,298,258 P=– P=– P=22,583,028 P=22,583,028Buildings and improvements 12/28/18 2,190,608 – – 2,662,848 2,662,848
P=13,488,866 P=– P=– P=25,245,876 P=25,245,876
Liabilities for which fair values are disclosed:
Financial Liabilities Financial liabilities at amortized
cost:
Time deposits 12/28/18 P=147,210,729 P=– P=– P=144,481,264 P=144,481,264LTNCD’s 12/28/18 31,403,225 – – 28,517,657 28,517,657Bonds Payable 12/28/18 15,661,372 – – 14,499,746 14,499,746
Bills payable 12/28/18 68,316,974 – – 60,436,716 60,436,716
P=262,592,300 P=– P=– P=247,935,383 P=247,935,383
* Excludes unquoted equity securities
** Net of allowance for credit losses
*** Based on the fair values from appraisal reports which is different from their carrying amounts which are carried at cost
· When fair values of listed equity and debt securities, as well as publicly traded derivatives at the reporting date are based on quoted market prices or binding dealer price quotations, without any deduction for transaction costs, the instruments are included within Level 1 of the hierarchy.
· For all other financial instruments, fair value is determined using valuation techniques. Valuation techniques include net present value techniques, comparison to similar instruments for which market observable prices exist and other revaluation models.

- 9 - SEC 17Q Report 3Q19
2. Financial risk management
· The Board of Directors, through the Risk Oversight Committee (ROC), exercises oversight and provides guidance to an experienced Senior Management team who works closely with their teams in managing risk. There is a robust risk culture, which seamlessly flows through not only within the Parent Company, but also across the Group subsidiaries and affiliates.
· The Parent Company’s Board of Directors has delegated specific responsibilities to various board committees, which are integral to the PNB’s risk governance framework and allow executive management, through management committees, to evaluate the risks inherent in the business and to manage them effectively.
· Executive officers are assigned to various management committees that provide the leadership and execution of the vision and policies approved by the Group’s board of directors. The Group’s business strategies are driven for most part by the day-to-day directions decided by these management committees with approvals and notation by the various board level committees.
· The PNB Board ROC is mandated to set risk appetite, approve frameworks, policies and processes for managing risk, and accept risks beyond the approval discretion provided to management.
· The approach to managing risk is outlined in the Group’s Enterprise Risk Management (ERM) Framework, which creates the context for setting policies and standards, and establishing the right practices throughout the PNB Group. It defines the risk management processes and sets out the activities, tools, and organizational structure to ensure material risks are identified, measured, monitored and managed.
· The Risk Management Framework includes: o a comprehensive risk management approach; o a detailed structure of limits, guidelines and other parameters used to govern risk-taking; o a clear delineation of lines of responsibilities for managing risk; o an adequate system for measuring risk; and o effective internal controls and a comprehensive monitoring & risk-reporting process.
· The Risk Management Group (RMG) is primarily responsible for the monitoring of risk management functions to ensure that a robust risk-oriented organization is maintained. RMG is independent from the business lines and is organized into 7 divisions: 1. Credit Risk Division 2. BASEL/ICAAP/Operational Risk Management Division 3. Market & ALM Division 4. Information Technology Risk Division (which include Business Continuity Management,
Outsourcing Risk, Project Management Monitoring) 5. Data Privacy Management Division 6. Trust Risk Division 7. Business Intelligence & Data Warehouse Division.

- 10 - SEC 17Q Report 3Q19
· Each division monitors the implementation of the processes and procedures that support the policies for risk management applicable to the organization. These policies clearly define the kinds of risks to be managed, set forth the organizational structure and provide appropriate training necessary to manage and control risks. The policies also provide for the validation, audits & compliance testing, to measure the effectiveness and suitability of the risk management structure.
· RMG also functions as the Secretariat to the ROC which meets monthly to discuss the immediate previous month’s total risk profile according to the material risks defined by the Group in its ICAAP document. Further, each risk division engages with all levels of the organization among its business and support groups. This ensures that the risk management and monitoring is embedded at the moment of origination.
Risk Categories and Definitions
Risks are broadly classified and defined into the following categories, and are managed in accordance to their characteristics. These are monitored accordingly under the Enterprise Risk Management (ERM) Framework:
Risk
Category
Risk Definition Risk Monitoring
Process
Risk Management Tools
Credit Risk (including Credit Concentration Risks and Counterparty Risks)
Credit risk is the risk to earnings or capital that arises from an obligor/s, customer/s or counterparty’s failure to perform and meet the terms of its contract. Credit Concentration Risk is part of credit risk that measures the risk concentration to any single customer or group of closely-related customers with the potential threat of losses which are substantial enough to affect the financial soundness of a financial institution. (BSP
Circular 414)
Loan Portfolio Analysis
Credit Dashboards Credit Review Credit Model
Validation
§ Trend Analysis (Portfolio / Past Due and NPL Levels
§ Regulatory and Internal Limits § Stress Testing § Rapid Portfolio Review § CRR Migration § Tracking the movements of
the loan portfolio § Concentrations and
Demographics Review § Large Exposure Report § Counterparty Limits
Monitoring § Adequacy of Loan Loss
Reserves Review § Specialized Credit Monitoring
(Power, Real Estate)
Market Risk Market risk is the risk to earnings or capital arising from adverse movements in factors that affect the market value of financial instruments, products and transactions in an institution’s overall portfolio, both on or off balance sheet and contingent financial contracts. Market risk arises from market-making, dealing and position taking in interest rate, foreign exchange, equity, and commodities market.
§ Value at Risk Utilization
§ Results of Marking to Market
§ Risks Sensitivity/Duration Report
§ Exposure to Derivative/Structured Products
§ VAR Limits § Stop Loss Limits § Management Triggers § Duration Report § ROP Exposure Limit § Limit to Structured Products § 30-day AFS Holding Period § Exception Report on Traders’
Limit § Exception Report on Rate
Tolerance

- 11 - SEC 17Q Report 3Q19
Liquidity Risk Liquidity risk is generally defined as the current and prospective risk to earnings or capital arising from an FI’s inability to meet its obligations when they come due.
§ Funding Liquidity Plan
§ Liquidity Ratios § Large Fund
Providers § MCO § Liquid Gap
Analysis
§ MCO Limits § Liquid Assets Monitoring § Stress testing § Large Fund Provider Analysis § Contingency Planning
Interest Rate Risk in the Banking Books (IRBB)
Interest rate risk is the current and prospective risk to earnings or capital arising from movements in interest rates. The amount at risk is a function of the magnitude and direction of interest rate changes and the size and maturity structure of the mismatch position. (BSP Circ 510, dated 03 Feb 2006)
§ Interest Rate Gap
Analysis
§ Earnings at Risk
Measurement
§ Duration based
Economic Value of
Equity
§ EAR Limits § Balance Sheet Profiling § Repricing Gap Analysis § Duration based Economic
Value of Equity § Stress Testing
Operational Risk
Operational Risk refers to the risk of loss resulting from inadequate or failed internal processes, people and systems; or from external events. This definition includes Legal Risk, but excludes Strategic and Reputational Risk. Operational Risk is inherent in all activities, products and services, and cuts across multiple activities and business lines within the financial institution and across the different entities in a banking group or conglomerate where the financial institution belongs. (BSP Circular 900)
§ Risk Identification § Risk Measurement § Risk Evaluation
(i.e. Analysis of Risk)
§ Risk Management ( i.e. Monitor, Control or Mitigate Risk)
Monitoring of Pillar II Risks fall under the purview of Operational Risk Management:
1. Risk Identification – Risk Maps
2. Risk Measurement and Analysis – ICAAP Risk Assessment
§ Internal Control § Board Approved Operating
Policies and Procedures Manuals
§ Board Approved Product Manuals
§ Loss Events Report (LER) § Risk and Control Self-
Assessment (RCSA) § Key Risk Indicators (KRI) § Business Continuity
Management (BCM) § Statistical Analysis
Included in the Operational Risks:
Reputational Risk (Customer Franchise Risk ) including Social Media and AML Risks
Reputational risk is the current and prospective impact on earnings or capital arising from negative public opinion. Customer franchise risk is defined as the failure to find, attract, and win new clients, nurture and retain those the Bank already has, and entice former clients back into the fold as well as the failure to meet client’s expectation in delivering the Group’s products and services.
§ Risk Identification
§ Risk Measurement
§ Risk Evaluation (i.e. Analysis of Risk)
§ Risk Management ( i.e. Monitor, Control or Mitigate Risk)
Monitoring of Pillar
§ Account Closures Report § Service Desk Customer Issues
Report/Customer Complaints Monitoring Report
§ Mystery Caller/Shopper § Evaluation/ Risk Mitigation of
negative media coverage § Public Relations Campaign § Review of Stock Price
performance § Fraud Management Program § Social Media Management
Framework
- 12 - SEC 17Q Report 3Q19
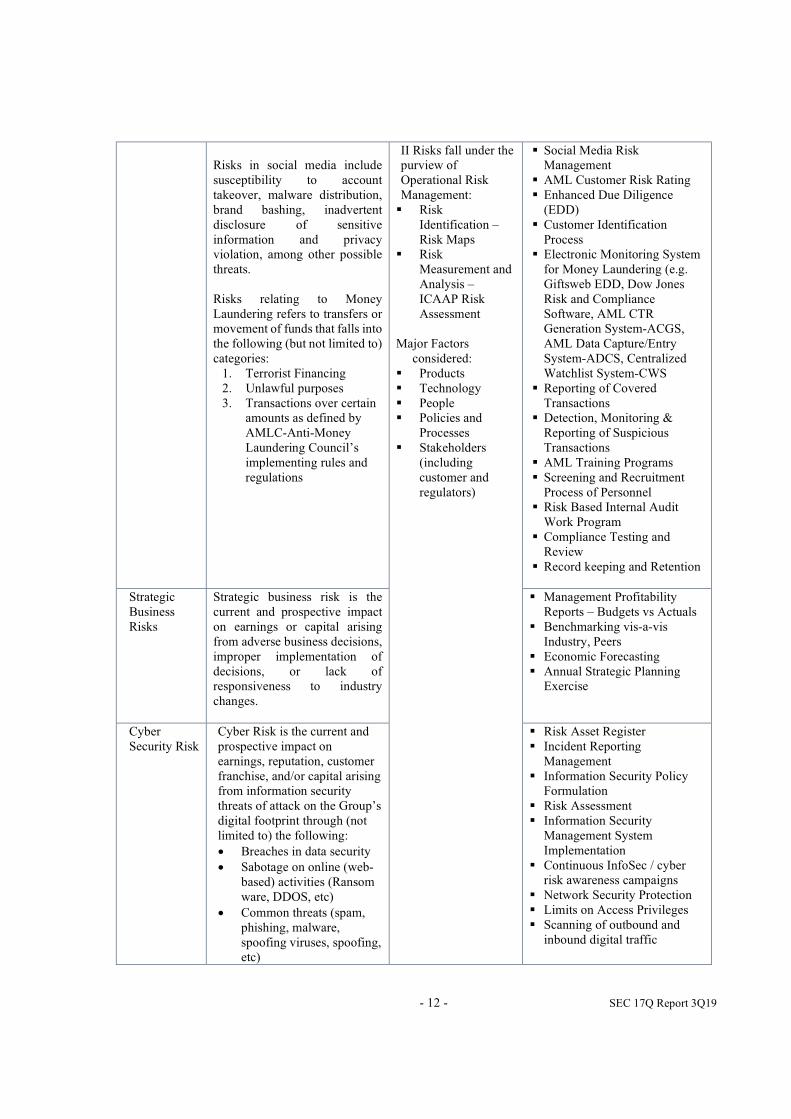
Risks in social media include susceptibility to account takeover, malware distribution, brand bashing, inadvertent disclosure of sensitive information and privacy violation, among other possible threats. Risks relating to Money Laundering refers to transfers or movement of funds that falls into the following (but not limited to) categories:
1. Terrorist Financing 2. Unlawful purposes 3. Transactions over certain
amounts as defined by AMLC-Anti-Money Laundering Council’s implementing rules and regulations
II Risks fall under the purview of Operational Risk Management: § Risk
Identification – Risk Maps
§ Risk Measurement and Analysis – ICAAP Risk Assessment
Major Factors
considered: § Products § Technology § People § Policies and
Processes § Stakeholders
(including customer and regulators)
§ Social Media Risk Management
§ AML Customer Risk Rating § Enhanced Due Diligence
(EDD) § Customer Identification
Process § Electronic Monitoring System
for Money Laundering (e.g. Giftsweb EDD, Dow Jones Risk and Compliance Software, AML CTR Generation System-ACGS, AML Data Capture/Entry System-ADCS, Centralized Watchlist System-CWS
§ Reporting of Covered Transactions
§ Detection, Monitoring & Reporting of Suspicious Transactions
§ AML Training Programs § Screening and Recruitment
Process of Personnel § Risk Based Internal Audit
Work Program § Compliance Testing and
Review § Record keeping and Retention
Strategic Business Risks
Strategic business risk is the current and prospective impact on earnings or capital arising from adverse business decisions, improper implementation of decisions, or lack of responsiveness to industry changes.
§ Management Profitability Reports – Budgets vs Actuals
§ Benchmarking vis-a-vis Industry, Peers
§ Economic Forecasting § Annual Strategic Planning
Exercise
Cyber Security Risk
Cyber Risk is the current and prospective impact on earnings, reputation, customer franchise, and/or capital arising from information security threats of attack on the Group’s digital footprint through (not limited to) the following:
· Breaches in data security
· Sabotage on online (web-based) activities (Ransom ware, DDOS, etc)
· Common threats (spam, phishing, malware, spoofing viruses, spoofing, etc)
§ Risk Asset Register § Incident Reporting
Management § Information Security Policy
Formulation § Risk Assessment § Information Security
Management System Implementation
§ Continuous InfoSec / cyber risk awareness campaigns
§ Network Security Protection § Limits on Access Privileges § Scanning of outbound and
inbound digital traffic

- 13 - SEC 17Q Report 3Q19
· Scams and Frauds (Social engineering, identify thefts, email scams, etc)
Information Security / Data Privacy
Information Security Risk is the risk to organizational operations due to the potential for unauthorized access, use, disclosure, disruption, modification or destruction of information or information assets that will compromise its Confidentiality, Integrity, and Availability (CIA). Social Engineering can result in various key risk indicators – phishing, spamming, dumpster diving, direct approach, baiting, spying & eavesdropping, among others.
Data Privacy Risk refers to the risk of misuse of personal data that could lead to individual harm which may take the form of loss of ]income, other financial loss, reputational damage, discrimination, and other harms.
§ Installation of firewalls,
IPS/IDS, enterprise security
solution (anti-virus for
endpoint, email and
internet).
§ Enterprise–wide
Implementation of the
Information Security
Management Systems
§ Education / InfoSec
Awareness is also constantly
conducted
§ Conduct of internal and 3rd
party vulnerability
assessments and penetration
testing (to include social
engineering tests) and follow
through on remediation of
threats and risks
§ Implementing the enterprise-
wide data privacy risk
management framework
which complies with both
domestic and global
requirements
§ Institutionalization of data
protection culture within the
group through regular
awareness programs
Information Technology (including Core Banking Implemen-tation)
Technology Risk results from human error, malicious intent, or even non-compliance to regulations. It threatens assets and processes vital to the Group’s business and may prevent compliance with regulations, impact profitability, and damage your company’s reputation in the marketplace. Risks in the smooth operation of the newly implemented core banking application may also threaten the delivery of service to clients and customers.
§ Risk Asset Register § Risk Awareness Campaigns § IT Risk Assessments § Formal Project management
Program adoption § Vulnerability Assessment
and Penetration Testing § Maintenance and upgrades of
disaster recovery sites § Business Users / IT joint
engagement for problem resolution
§ Technology Operations Management Policies & Guidelines
§ Vendor Management Process Monitoring

- 14 - SEC 17Q Report 3Q19
· The PNB risk management framework banks on a dynamic process that supports the development and implementation of the strategy of the Group. The process revolves around methodically addressing risks associated with the business lines of the bank. The ERM Framework, with regular reviews and updates, has served PNB well and has been resilient through economic cycles. The organization has placed a strong reliance on this risk governance framework and the three lines-of-defense model (see Figure 2), which are fundamental to PNB’s aspiration to be world-class at managing risk.
1. The first line of defense is made up of the management of business lines and legal entities.
Business units are responsible for their risks. Effective first line management includes: a. the proactive self-identification/assessment of issues and risks, including emerging risks
b. the design, implementation and ownership of appropriate controls c. the associated operational control remediation
d. a strong control culture of effective and transparent risk partnership. 2. The second line of defense comes from both the risk management function and the
compliance function of the Group, which are independent of business operations. The risk management unit implements the risk management framework, provides independent oversight over specific board directives and is responsible for regular reporting to the ROC. The compliance function develops and implements governance standards, frameworks and policies for each material risk type to which the group is exposed. This ensures consistency in approach across the group’s business lines and legal entities. The compliance function reports directly to the Board Audit and Compliance Committee.
3. The third line of defense is the internal audit function & the compliance testing function
which provides an independent assessment(s) of the adequacy and effectiveness of the overall risk management framework and governance structures. The internal audit function & compliance testing function report directly to the Board Audit & Compliance Committee (BACC).
3. Segment Reporting
· The Group’s operating businesses are determined and managed separately according to the nature of services provided and the different markets served with each segment representing a strategic business unit.
· The Group’s business segments follow:
- Retail Banking - principally handling individual customer’s deposits, and providing consumer type loans, credit card facilities and fund transfer facilities;
- Corporate Banking - principally handling loans and other credit facilities and deposit accounts for corporate and institutional customers; and
- Global Banking and Market - principally providing money market, trading and treasury services, as well as the management of the Group’s liquidity and foreign exchange operations.
- Other Segments - include International Banking and Remittance Group, Trust Banking Group, Domestic Subsidiaries, Insurance, Leasing, Remittances and other support services.

- 15 - SEC 17Q Report 3Q19
Transactions between segments are conducted at estimated market rates on an arm’s length basis. Interest is credited to or charged against business segments based on a pool rate which approximates the marginal cost of funds.
· The Group has no significant customer which contributes 10.00% or more of the consolidated revenue.
· Business segment information of the Group follows:
September 30, 2019
Retail
Banking Corporate
Banking Global Banking
and Market Others
Adjustments and
Eliminations* Total
Net interest margin Third party (P=4,637,679) P=22,946,803 P=4,568,398 P=629,786 (P=130,433) P=23,376,875
Inter-segment 18,391,420 (18,489,521) 98,101 – – –
Net interest margin after inter-segment transactions 13,753,741 4,457,282 4,666,499 629,786 (130,433) 23,376,875
Other income 2,078,076 1,463,957 1,963,622 1,960,250 (472,903) 6,993,002
Segment revenue 15,831,817 5,921,239 6,630,121 2,590,036 (603,336) 30,369,877
Other expenses 8,278,149 3,708,829 309,024 1,256,443 44,573 13,597,018
Segment result P=7,553,668 P=2,212,410 P=6,321,097 P=1,333,593 (P=647,909) 16,772,859
Unallocated expenses 8,357,461
Net income before income tax 8,415,398
Income tax 2,087,907
Net income from continuing operations 6,327,491
Net income from discontinued operations 77,275
Net Income 6,404,766
Non-controlling interests 66,300
Net income for the year attributable to equity holders of the Parent Company P=6,338,466
Other segment information
Capital expenditures P=873,930 P=1,974 P=19,392 P=677,627 P=– P=1,572,923
Unallocated capital expenditure 1,260,799
Total capital expenditure P=2,833,722
Depreciation and amortization P=549,208 P=32,664 P=1,204 P=442,227 P=– P=1,025,303
Unallocated depreciation and amortization 1,052,813
Total depreciation and amortization P=2,078,116
Provision for impairment, credit and other losses P=820,884 P=603,008 P=– P=3,038 P=– P=1,426,930
As of September 30, 2019
Retail
Banking Corporate
Banking Global Banking
and Market Others
Adjustments and
Eliminations* Total
Segment assets P=134,952,626 P=638,976,383 P=313,767,820 P=107,507,737 (P=19,996,606) P=1,175,207,960
Unallocated assets 4,282,265
Total assets P=1,179,490,225
Segment liabilities P=659,954,405 P=125,742,077 P=205,875,578 P=52,003,622 (P=18,411,940) P=1,025,163,742
Unallocated liabilities 2,378,740
Total liabilities P=1,027,542,482
* The eliminations and adjustments column mainly represent the RAP to PFRS adjustments

- 16 - SEC 17Q Report 3Q19
September 30, 2018
Retail
Banking Corporate
Banking Global Banking
and Market Others
Adjustments and
Eliminations* Total
Net interest margin Third party P=1,686,446 P=15,290,789 P=2,587,961 P=100,250 P=332,503 P=19,997,949 Inter-segment 9,657,213 (9,541,060) (116,153) – – –
Net interest margin after inter-segment transactions 11,343,659 5,749,729 2,471,808 100,250 332,503 19,997,949
Other income 1,839,436 6,772,593 920,098 185,796 430,055 10,147,978
Segment revenue 13,183,095 12,522,322 3,391,906 286,046 762,558 30,145,927 Other expenses 9,052,151 2,072,312 290,815 250,398 1,002,245 12,667,921
Segment result P=4,130,944 P=10,450,010 P=3,101,091 P=35,648 (P=239,687) 17,478,006
Unallocated expenses 7,113,703
Net income before income tax 10,364,303 Income tax 2,576,491
Net income from continuing operations 7,787,812
Net loss from discontinued operations (267,324)
Net Income 7,520,488 Non-controlling interests 70,973
Net income for the year attributable to equity holders of the Parent Company P=7,449,515
Other segment information Capital expenditures P=941,500 P=1,736 P=268 P=360,142 P=219,986 P=1,523,632
Unallocated capital expenditure 884,809
Total capital expenditure P=2,408,441
Depreciation and amortization P=428,632 P=32,205 P=973 P=168,810 P=28,400 P=659,019
Unallocated depreciation and amortization 770,016
Total depreciation and amortization P=1,429,034
Provision for (reversal of) impairment, credit and other losses P=582,654 P=952,302 P=– (P=380) P=53,888 P=1,588,463
As of December 31, 2018
Retail
Banking Corporate
Banking Global Banking
and Market Others
Adjustments and
Eliminations* Total
Segment assets P=176,979,190 P=521,012,459 P=196,800,341 P=100,415,100 (P=15,695,142) P=979,511,948
Unallocated assets 4,136,238
Total assets P=983,648,186
Segment liabilities P=584,241,976 P=129,260,747 P=118,145,318 P=34,755,735 (P=15,261,242) P=851,142,534
Unallocated liabilities 3,946,640
Total liabilities P=855,089,174
* The eliminations and adjustments column mainly represent the RAP to PFRS adjustments

- 17 - SEC 17Q Report 3Q19
· Although the Group’s businesses are managed on a worldwide basis, the Group operates in five (5) principal geographical areas of the world. The distribution of assets, liabilities and credit commitments items as of September 30, 2019 and December 31, 2018 and capitalized expenditures and revenues for the nine months ended September 30, 2019 and September 30, 2018 by geographic region of the Group follows:
Non Current Assets Liabilities Credit Commitments
September 30,
2019
December 31, 2018
September 30,
2019
December 31, 2018
September30,
2019
December 31, 2018
Philippines P=531,415,891 P=451,576,392 P=992,441,738 P=821,782,475 P=37,286,994 P=3,555,349
Asia (excluding Philippines) 5,539,021 5,828,575 32,255,814 30,496,429 596,894 8,053
USA and Canada 121,881,338 127,628,675 2,403,959 2,311,128 – 632
United Kingdom and Other European Union Countries 3,273,021 1,731,423
440,971 499,142 – 21
P=662,109,271 P=586,765,065 P=1,027,542,482 P=855,089,174 P=37,883,888 P=3,564,055
Capital Expenditures Revenues
September 30,
2019
September 30, 2018
September 30,
2019
September 30, 2018
Philippines P=2,830,741 P=2,401,362 P=41,950,938 P=33,787,500 Asia (excluding Philippines) – 6,605 1,031,903 1,369,169
USA and Canada 589 453 1,109,447 519,790
United Kingdom and Other European Union Countries 2,392 21 82,262 91,964
P=2,833,722 P=2,408,441 P=44,174,550 P=35,768,423
· The Philippines is the home country of the Parent Company, which is also the main operating company. The Group offers a wide range of financial services as discussed in Note 1. Additionally, most of the remittance services are managed and conducted in Asia, Canada, USA and United Kingdom.
· The areas of operations include all the business segments.
4. Related party transactions
· In the ordinary course of business, the Parent Company extends loans and enters into other transactions with its subsidiaries and affiliates, and with certain Directors, Officers, Stockholders and Related Interests (DOSRI). Under the Parent Company’s policy, these loans and other transactions are made substantially on the same terms as with other individuals and businesses of comparable risks. The amount of direct credit accommodations to each of the Parent Company’s DOSRI, 70.00% of which must be secured, should not exceed the amount of their respective deposits and book value of their respective investments in the Parent Company.
· In the aggregate, DOSRI loans should not exceed the Parent Company’s equity or 15.00% of the Parent Company’s total loan portfolio, whichever is lower. As of September 30, 2019 and December 31, 2018, the Parent Company was in compliance with such regulations.
· Parties are considered to be related if one party has the ability, directly or indirectly, to control the other party or exercise significant influence over the other party in making financial and operating decisions. The Group’s related parties include: o key management personnel, close family members of key management personnel and entities
which are controlled, significantly influenced by or for which significant voting power is held by key management personnel or their close family members;
o significant investors;

- 18 - SEC 17Q Report 3Q19
o subsidiaries, joint ventures and associates and their respective subsidiaries; and o post-employment benefit plans for the benefit of the Group’s employees.
5. Changes in contingent assets and contingent liabilities since last annual balance sheet date are in the
normal course of business and are not anticipated to cause any material losses from those commitments and/or contingent liabilities.
6. Significant elements of the Group’s revenues consist mainly of net interest margin, service fees, net
trading revenues and gains from disposal of reacquired properties while the Group’s expenses consist mainly of staff cost, depreciation and amortization of assets and provisions for probable losses. Please refer to the discussions on the results of operations for further details.
7. The Group has nothing material to report on the following items:
· Known demands, commitments, events or uncertainties that will have a material impact on the Group’s liquidity and continuing operations within the next twelve (12) months.
· Any events that will trigger direct or contingent financial obligations that is material to the Group, including any default or acceleration of an obligation.
· Material off-balance sheet transactions, various commitments, arrangements, contingent assets and contingent liabilities other than those already discussed above.
· Material commitments for capital expenditures.
· Issuances, repurchases and repayments of debt and equity securities.
· Seasonal aspects that had a material effect on the PNB Group’s financial condition and results of operations.
· Dividends declared or paid.
· Change in estimates reported in prior interim periods and in prior financial years.
· Material events subsequent to the end of the interim period other than disclosed below.
· Changes in the composition of the enterprise during the interim period, including business combinations, acquisitions and disposal of subsidiaries and long-term investments, restructuring and discontinuing operations.
8. On July 22, 2019, the Parent Company issued and listed 276,625,172 common shares priced at P43.38 per
share from its Stock Rights Offering (SRO). The net proceeds from the SRO amounted to P11.7 billion.
9. The last tranche of reserve requirement reduction (50 bps) took effect on July 26, 2019. The reduction in reserve requirement infuses additional liquidity to the Parent Company that can be used to support Parent Company’s strategy of safe and aggressive growth.
10. On August 29, 2019, the Monetary Board of BSP, through its Resolution No. 1310, approved the
integration of PNB Savings Bank (PNBSB) with the Bank via acquisition of assets and assumption of liabilities of PNBSB in exchange for cash. Once integration, is rolled out, the Bank would be able to deliver a more efficient banking experience, and will be able to serve a wider customer base while the customers of PNBSB will have access to the Bank’s diverse portfolio of financial solutions. The consumer lending business, currently operated through PNBSB, will also benefit from the Group’s ability to efficiently raise low cost of funds.
11. On October 11, 2019, the Parent Company issued the second tranche of its 5 & ½ year Long-Term
Negotiable Certificates of Time Deposit amounting to P4.6 billion maturing on April 11, 2025 with an interest rate of 4.375% to extend the maturity profile of the Parent Company, support compliance with required BSP liquidity ratios, and raise long-term funds for general corporate purposes.
- 19 - SEC 17Q Report 3Q19
12. There are no material disclosures that have not been reported under SEC Form 17-C during the period
covered by this report.
PART II – OTHER INFORMATION
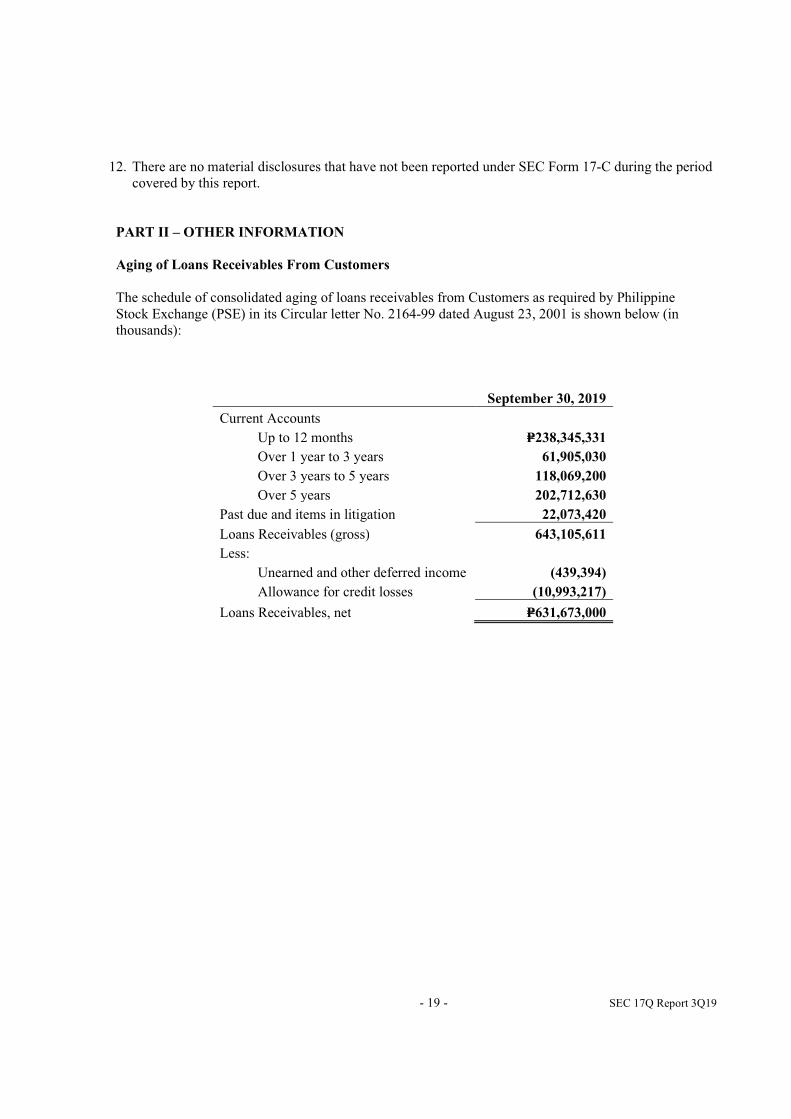
Aging of Loans Receivables From Customers
The schedule of consolidated aging of loans receivables from Customers as required by Philippine Stock Exchange (PSE) in its Circular letter No. 2164-99 dated August 23, 2001 is shown below (in thousands):
September 30, 2019
Current Accounts
Up to 12 months P=238,345,331
Over 1 year to 3 years 61,905,030
Over 3 years to 5 years 118,069,200
Over 5 years 202,712,630
Past due and items in litigation 22,073,420
Loans Receivables (gross) 643,105,611
Less:
Unearned and other deferred income (439,394)
Allowance for credit losses (10,993,217)
Loans Receivables, net P=631,673,000

- 20 - SEC 17Q Report 3Q19
OTHER MATTERS
Changes in accounting policies effective on or after January 1, 2019
PFRS 16, Leases Under the new standard, lessees will no longer classify their leases as either operating or finance leases in accordance with PAS 17, Leases. Rather, lessees will apply the single-asset model. Under this model, lessees will recognize the assets and related liabilities for most leases on their balance sheets, and subsequently, will depreciate the lease assets and recognize interest on the lease liabilities in their profit or loss. Leases with a term of 12 months or less or for which the underlying asset is of low value are exempted from these requirements. The accounting by lessors is substantially unchanged as the new standard carries forward the principles of lessor accounting under PAS 17. Lessors, however, will be required to disclose more information in their financial statements, particularly on the risk exposure to residual value. When adopting PFRS 16, an entity is permitted to use either a full retrospective or a modified retrospective approach, with options to use certain transition reliefs. The adoption of the PFRS 16 resulted in the recognition of Right-of-Use Assets amounting to P1.7 billion under the Property and Equipment and the related Lease Liability of the same amount as of January 1, 2019.
The Group continues to refine and improve its newly implemented accounting and financial reporting process, controls and governance structure as a result of adopting PFRS 16. Therefore, the estimation of impact is subject to change until the finalization of the Financial Statements for the year ending December 31, 2019.

- 21 - SEC 17Q Report 3Q19
PHILIPPINE NATIONAL BANK AND SUBSIDIARIES
INTERIM CONSOLIDATED STATEMENTS OF FINANCIAL POSITION As of September 30, 2019
(With Comparative Audited Figures as of December 31, 2018)
(In Thousands)
September 30,
2019
(Unaudited)
December 31, 2018
(Audited)
ASSETS Cash and Other Cash Items P=14,599,006 P=16,825,487Due from Bangko Sentral ng Pilipinas 148,528,452 102,723,312Due from Other Banks 17,043,099 20,525,318Interbank Loans Receivable 27,073,930 11,248,455Securities Held Under Agreements to Resell 1,358,000 20,700,000Financial Assets at Fair Value Through Profit or Loss (FVTPL) 17,034,112 9,999,447Financial Assets at Fair Value Through Other Comprehensive Income
(FVOCI) 134,015,108 51,674,167Financial Assets at Amortized Cost 104,895,739 99,772,711Loans and Receivables 644,846,092 581,695,477Property and Equipment 21,438,183 19,710,145Investments in an Associate 2,668,463 2,418,842Investment Properties 13,767,072 13,488,866Deferred Tax Assets 1,960,677 2,086,510Intangible Assets 2,922,769 3,025,157Goodwill 13,375,407 13,375,407Assets of Disposal Group Classified as Held for Sale 8,296,716 8,238,623Other Assets 5,667,400 6,140,262
TOTAL ASSETS P=1,179,490,225 P=983,648,186
LIABILITIES AND EQUITY
LIABILITIES Deposit Liabilities Demand P=165,297,768 P=153,065,163Savings 363,596,977 401,622,361Time 261,480,342 147,210,729Long Term Negotiable Certificates 30,578,729 31,403,225
820,953,816 733,301,478Financial Liabilities at FVTPL 566,659 470,648Lease Liability 1,493,605 –
Bonds Payable 67,829,741 15,661,372Bills and Acceptances Payable 101,193,473 70,082,835Accrued Taxes, Interest and Other Expenses 7,176,920 6,167,398Income Tax Payable 666,080 900,693Liabilities of Disposal Group Classified as Held for Sale 7,203,447 7,237,811Other Liabilities 20,458,741 21,266,939
TOTAL LIABILITIES 1,027,542,482 855,089,174
(Forward)
- 22 - SEC 17Q Report 3Q19
September 30,
2019
(Unaudited)
December 31, 2018
(Audited)
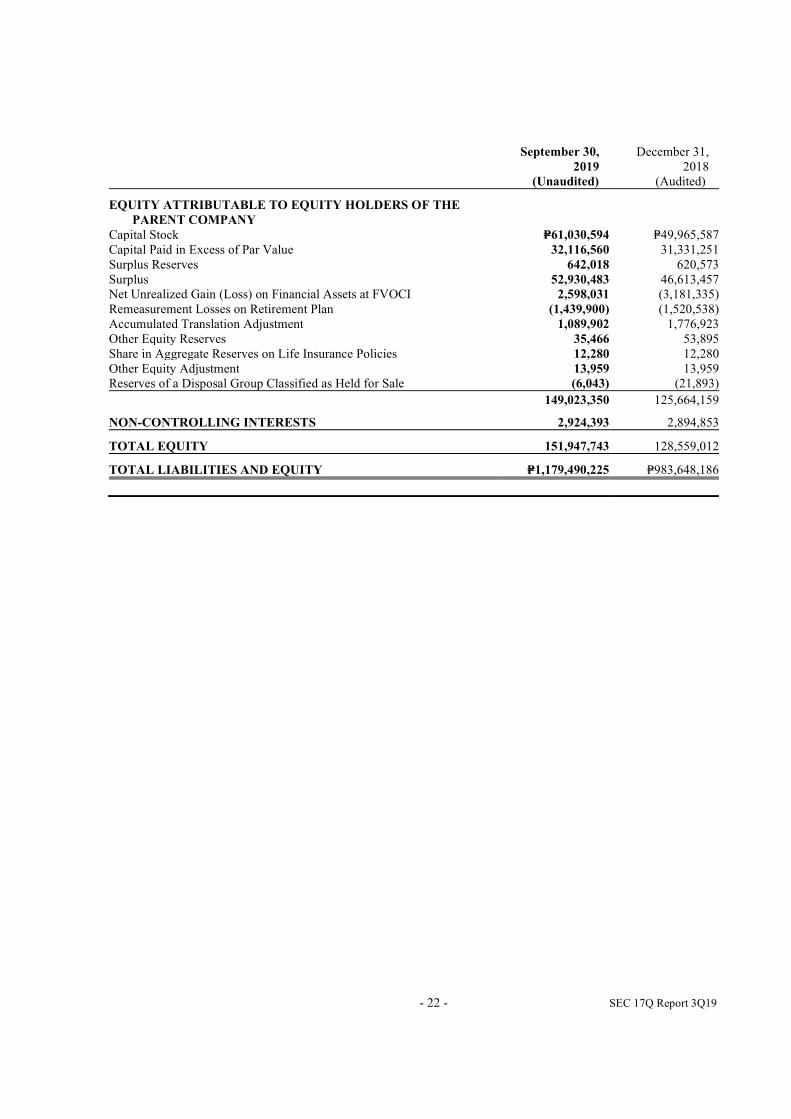
EQUITY ATTRIBUTABLE TO EQUITY HOLDERS OF THE
PARENT COMPANY Capital Stock P=61,030,594 P=49,965,587Capital Paid in Excess of Par Value 32,116,560 31,331,251Surplus Reserves 642,018 620,573Surplus 52,930,483 46,613,457Net Unrealized Gain (Loss) on Financial Assets at FVOCI 2,598,031 (3,181,335)Remeasurement Losses on Retirement Plan (1,439,900) (1,520,538)Accumulated Translation Adjustment 1,089,902 1,776,923Other Equity Reserves 35,466 53,895Share in Aggregate Reserves on Life Insurance Policies 12,280 12,280Other Equity Adjustment 13,959 13,959Reserves of a Disposal Group Classified as Held for Sale (6,043) (21,893)
149,023,350 125,664,159
NON-CONTROLLING INTERESTS 2,924,393 2,894,853
TOTAL EQUITY 151,947,743 128,559,012
TOTAL LIABILITIES AND EQUITY P=1,179,490,225 P=983,648,186
- 23 - SEC 17Q Report 3Q19
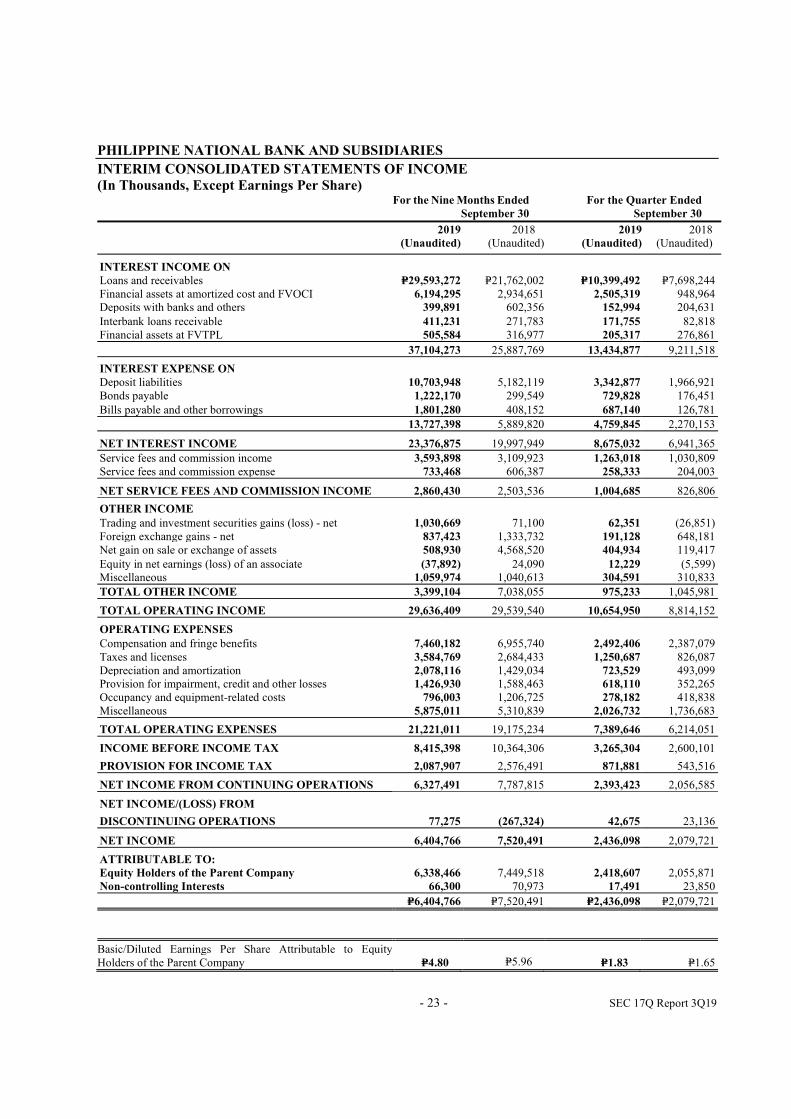
PHILIPPINE NATIONAL BANK AND SUBSIDIARIES
INTERIM CONSOLIDATED STATEMENTS OF INCOME
(In Thousands, Except Earnings Per Share) For the Nine Months Ended
September 30
For the Quarter Ended
September 30
2019
(Unaudited)
2018 (Unaudited)
2019
(Unaudited)
2018 (Unaudited)
INTEREST INCOME ON
Loans and receivables P=29,593,272 P=21,762,002 P=10,399,492 P=7,698,244 Financial assets at amortized cost and FVOCI 6,194,295 2,934,651 2,505,319 948,964 Deposits with banks and others 399,891 602,356 152,994 204,631
Interbank loans receivable 411,231 271,783 171,755 82,818 Financial assets at FVTPL 505,584 316,977 205,317 276,861
37,104,273 25,887,769 13,434,877 9,211,518
INTEREST EXPENSE ON Deposit liabilities 10,703,948 5,182,119 3,342,877 1,966,921 Bonds payable 1,222,170 299,549 729,828 176,451
Bills payable and other borrowings 1,801,280 408,152 687,140 126,781
13,727,398 5,889,820 4,759,845 2,270,153
NET INTEREST INCOME 23,376,875 19,997,949 8,675,032 6,941,365
Service fees and commission income 3,593,898 3,109,923 1,263,018 1,030,809 Service fees and commission expense 733,468 606,387 258,333 204,003
NET SERVICE FEES AND COMMISSION INCOME 2,860,430 2,503,536 1,004,685 826,806
OTHER INCOME
Trading and investment securities gains (loss) - net 1,030,669 71,100 62,351 (26,851) Foreign exchange gains - net 837,423 1,333,732 191,128 648,181 Net gain on sale or exchange of assets 508,930 4,568,520 404,934 119,417
Equity in net earnings (loss) of an associate (37,892) 24,090 12,229 (5,599) Miscellaneous 1,059,974 1,040,613 304,591 310,833
TOTAL OTHER INCOME 3,399,104 7,038,055 975,233 1,045,981
TOTAL OPERATING INCOME 29,636,409 29,539,540 10,654,950 8,814,152
OPERATING EXPENSES
Compensation and fringe benefits 7,460,182 6,955,740 2,492,406 2,387,079 Taxes and licenses 3,584,769 2,684,433 1,250,687 826,087 Depreciation and amortization 2,078,116 1,429,034 723,529 493,099 Provision for impairment, credit and other losses 1,426,930 1,588,463 618,110 352,265 Occupancy and equipment-related costs 796,003 1,206,725 278,182 418,838 Miscellaneous 5,875,011 5,310,839 2,026,732 1,736,683
TOTAL OPERATING EXPENSES 21,221,011 19,175,234 7,389,646 6,214,051
INCOME BEFORE INCOME TAX 8,415,398 10,364,306 3,265,304 2,600,101
PROVISION FOR INCOME TAX 2,087,907 2,576,491 871,881 543,516
NET INCOME FROM CONTINUING OPERATIONS 6,327,491 7,787,815 2,393,423 2,056,585
NET INCOME/(LOSS) FROM
DISCONTINUING OPERATIONS 77,275 (267,324) 42,675 23,136
NET INCOME 6,404,766 7,520,491 2,436,098 2,079,721
ATTRIBUTABLE TO: Equity Holders of the Parent Company 6,338,466 7,449,518 2,418,607 2,055,871 Non-controlling Interests 66,300 70,973 17,491 23,850
P=6,404,766 P=7,520,491 P=2,436,098 P=2,079,721
Basic/Diluted Earnings Per Share Attributable to Equity Holders of the Parent Company P=4.80
P=5.96 P=1.83 P=1.65

- 24 - SEC 17Q Report 3Q19
PHILIPPINE NATIONAL BANK AND SUBSIDIARIES
INTERIM CONSOLIDATED STATEMENTS OF COMPREHENSIVE INCOME
(In Thousands) For the Nine Months Ended For the Quarter Ended
September 30 September 30
2019
(Unaudited)
2018 (Unaudited)
2019
(Unaudited)
2018(Unaudited)
NET INCOME P=6,404,766 P=7,520,488 P=2,436,098 P=2,079,718
OTHER COMPREHENSIVE INCOME (LOSS) Items that recycle to profit or loss in subsequent periods: Net unrealized gain/(loss) on financial assets at FVOCI 5,301,117 (1,473,422) 1,554,399 (52,328) Share in changes in net unrealized gains (losses) on financial assets at FVOCI of subsidiaries and an associate 494,101 (408,369)
223,750
(119,960)
Accumulated translation adjustment (731,769) 1,019,454 (158,510) (81,760)
5,063,449 (862,337) 1,619,639 (254,048)
Items that do not recycle to profit or loss in subsequent periods:
Remeasurement gains (losses) on retirement plan 175,663 (917,375) 67,482 (19,903) Share in changes in remeasurement gains (losses) of subsidiaries and an associate (94,378) 421,945 – 126,817
81,285 (495,430) 67,482 106,914
OTHER COMPREHENSIVE INCOME
FOR THE PERIOD, NET OF TAX 5,144,734 (1,357,767) 1,687,121 (147,134)
TOTAL COMPREHENSIVE INCOME FOR
PERIOD P=11,549,500 P=6,162,721 P=4,123,219 P=1,932,584
ATTRIBUTABLE TO:
Equity Holders of the Parent Company P=11,527,299 P=5,893,386 P=4,083,934 P=1,870,259
Non-controlling Interests 22,201 269,335 39,285 62,325
P=11,549,500 P=6,162,721 P=4,123,219 P=1,932,584

- 2
5 -
SE
C 1
7Q
Rep
ort
3Q
19
PH
ILIP
PIN
E N
AT
ION
AL
BA
NK
AN
D S
UB
SID
IAR
IES
INT
ER
IM C
ON
SO
LID
AT
ED
ST
AT
EM
EN
TS
OF
CH
AN
GE
S I
N E
QU
ITY
(I
n T
ho
usa
nd
s)
Cap
ital
Sto
ck
Cap
ital
Paid
in E
xces s
of
Par V
alu
e
Su
rp
lus
Rese
rves
Su
rp
lus
Net
un
reali
zed
gain
/(lo
ss)
on
fin
an
cia
l ass
ets
at
FV
OC
I
Rem
easu
rem
en
t
Lo
sses
on
Reti
rem
en
t
Pla
n
Accu
mu
late
d
Tran
slati
on
Ad
just
men
t
Oth
er E
qu
ity
Rese
rves
Oth
er E
qu
ity
Ad
just
men
t
Sh
are i
n
Aggregate
Rese
rves
on
Lif
e
Insu
ran
ce
Poli
cie
s
Rese
rves
of
a
Dis
posa
l
Grou
p H
eld
for S
ale
T
ota
l
Non
-
con
troll
ing
Inte
rest
s
To
tal
Eq
uit
y
Bal
ance
at
Januar
y 1
, 201
9
P=49,9
65,5
87
P=
31,3
31,2
51
P=620,5
73
P=46,6
13,4
62
(
P=3,1
81,3
35)
(P=
1,5
20,5
38)
P=1,7
76,9
23
P=53,8
95
P=
13,9
59
P=12,2
80
(P=21,8
93)
P=125,6
64,1
64
P=
2,8
94,8
53
P=128,5
59,0
17
Tota
l co
mpre
hen
sive
inco
me
(loss
) fo
r th
e
per
iod
–
–
–6,3
38,4
66
5,7
95,2
18
80,6
36
(687,0
21)
–
––
–
11,5
27,2
99
22,2
01
11,5
49,5
00
Issu
ance
of
stock
11,0
65,0
07
785,3
09
––
–
–
––
–
––
11,8
50,3
16
–
11,8
50,3
16
Oth
er e
quit
y r
eser
ves
–
–
––
–
–
–(1
8,4
29)
––
–
(18
,429)
–(1
8,4
29)
Dec
lara
tion o
f div
iden
ds
by s
ubsi
dia
ries
–
–
––
–
–
––
–
––
–
(2,5
33)
(2,5
33)
Res
erves
of
dis
posa
l gro
up c
lass
ifie
d a
s
h
eld f
or
sale
–
–
––
(15
,852)
2
––
–
–
15,8
50
–
–
–
Pri
or
per
iod a
dju
stm
ent
–
––
––
–
––
–
––
–
4,4
94
4,4
94
Surp
lus
rese
rves
–
–
––
–
–
––
–
––
–
5,3
78
5,3
78
Tra
nsf
er t
o s
urp
lus
rese
rves
–
–
21,4
45
(21
,445)
–
–
––
–
––
–
––
Ba
lan
ce a
t S
ep
tem
ber 3
0,
2019
P=61,0
30,5
94
P=
32,1
16,5
60
P=642,0
18
P=52,9
30,4
83
P=2,5
98,0
31
(P=1,4
39,9
00)
P=1,0
89,9
02
P=35,4
66
P=
13,9
59
P=12,2
80
(P=6
,043)
P=149,0
23,3
50
P=
2,9
24,3
93
P=151,9
47,7
43
See
acc
om
pa
nyi
ng
No
tes
to C
on
soli
da
ted
Fin
an
cial
Sta
tem
ents
- 2
6 -
SE
C 1
7Q
Rep
ort
3Q
19
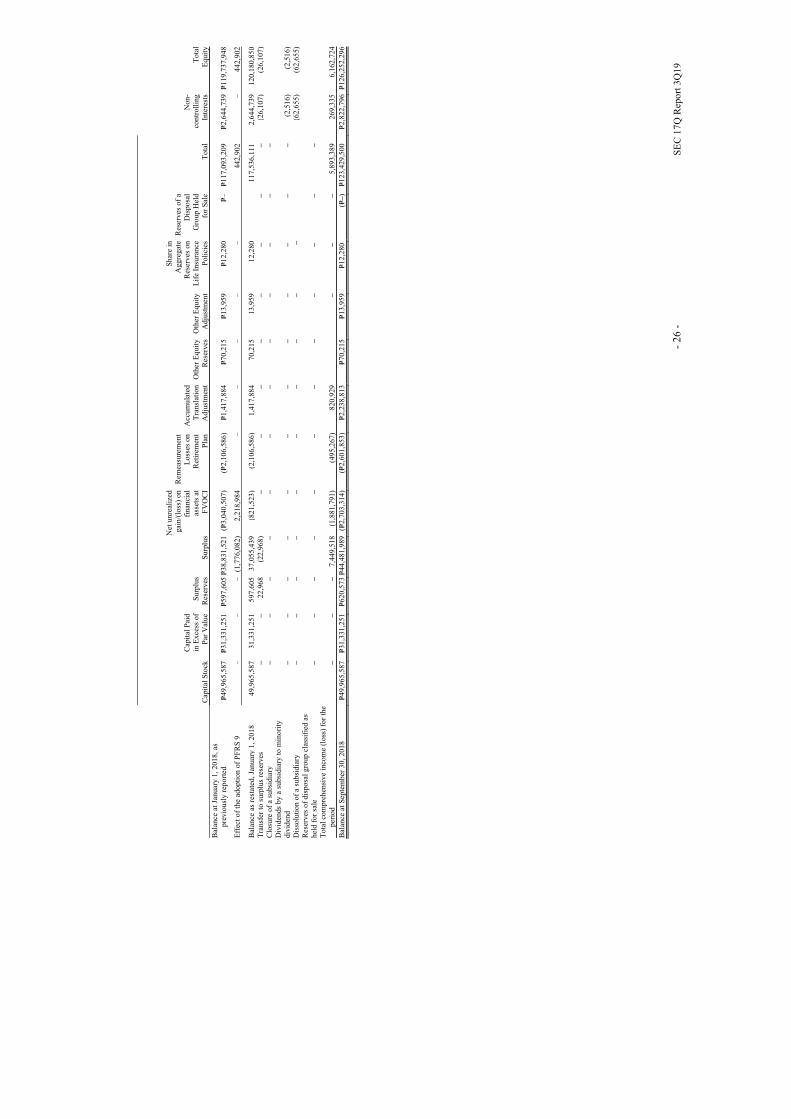
C
apit
al S
tock
Cap
ital
Pai
din
Exce
ss o
fP
ar V
alue
Surp
lus
Res
erves
Surp
lusN
et u
nre
aliz
ed
gai
n/(
loss
) on
finan
cial
as
sets
at
FV
OC
I
Rem
easu
rem
ent
Loss
es o
n
Ret
irem
ent
Pla
n
Acc
um
ula
ted
Tra
nsl
atio
n A
dju
stm
ent
Oth
er E
qu
ity
R
eser
ves
O
ther
Equ
ity
Adju
stm
ent
Shar
e in
A
ggre
gat
e R
eser
ves
on
Lif
e In
sura
nce
P
oli
cies
Res
erves
of
a D
isposa
l G
roup H
eld
for
Sal
eT
ota
l
Non-
contr
oll
ing
Inte
rest
sT
ota
lE
quit
y
Bal
ance
at
Januar
y 1
, 2018,
as
pre
vio
usl
y r
eport
ed
P=49,9
65,5
87
P=
31,3
31,2
51
P=597,6
05
P=38,8
31,5
21
(P=3,0
40,5
07)
(P=2,1
06,5
86)
P=1,4
17,8
84
P=70,2
15
P=
13,9
59
P=12,2
80
P=–
P=117,0
93,2
09
P=
2,6
44,7
39
P=119,7
37,9
48
Eff
ect
of
the
adopti
on o
f P
FR
S 9
–
–
–(1
,776,0
82)
2,2
18,9
84
––
–
––
442,9
02
–
442,9
02
Bal
ance
as
rest
ated
, Ja
nuar
y 1
, 2018
49,9
65,5
87
31,3
31,2
51
597,6
05
37,0
55,4
39
(82
1,5
23)
(2,1
06,5
86)
1,4
17,8
84
70,2
15
13,9
59
12,2
80
117,5
36,1
11
2,6
44,7
39
120,1
80,8
50
T
ransf
er t
o s
urp
lus
rese
rves
–
–
22,9
68
(22
,968)
–
–
––
––
–
–
(26
,107)
(26
,107)
Clo
sure
of
a su
bsi
dia
ry
–
––
––
–
–
–
––
–
–
Div
iden
ds
by a
subsi
dia
ry t
o m
ino
rity
div
iden
d
–
––
–
–
–
––
––
–
–
(2,5
16)
(2,5
16)
Dis
solu
tion o
f a
subsi
dia
ry
–
––
––
–
–
–
––
(6
2,6
55)
(62
,655)
Res
erves
of
dis
posa
l gro
up c
lass
ifie
d a
s hel
d f
or
sale
–
–
––
–
–
––
––
–
–
Tota
l co
mpre
hen
sive
inco
me
(loss
) fo
r th
e
per
iod
–
–
–7,4
49,5
18
(1,8
81,7
91)
(49
5,2
67)
820,9
29
–
–
–5,8
93,3
89
269,3
35
6,1
62,7
24
Bal
ance
at
Sep
tem
ber
30,
2018
P=49,9
65,5
87
P=
31,3
31,2
51
P=620,5
73
P=44,4
81,9
89
(P=2,7
03,3
14)
(P=2,6
01,8
53)
P=2,2
38,8
13
P=70,2
15
P=
13,9
59
P=12,2
80
(P=
–)
P=123,4
29,5
00
P=
2,8
22,7
96
P=126
,252
,296

- 27 -
PHILIPPINE NATIONAL BANK AND SUBSIDIARIES
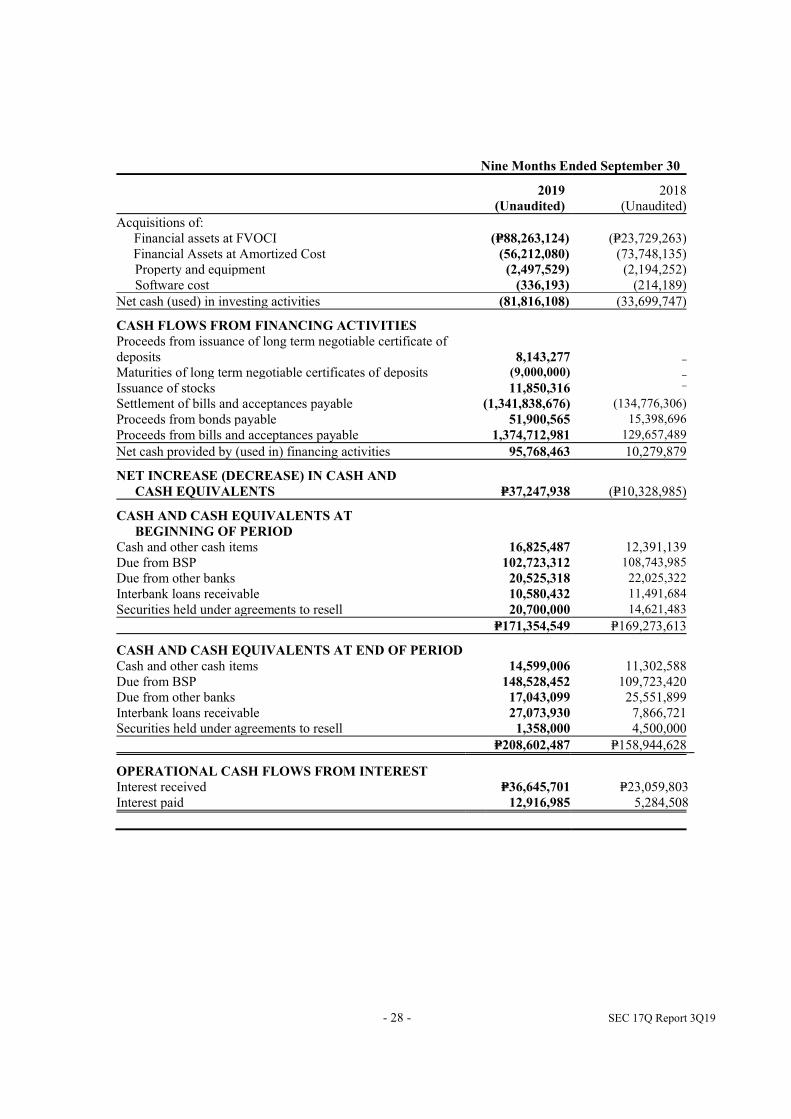
INTERIM CONSOLIDATED STATEMENTS OF CASH FLOWS (In Thousands) Nine Months Ended September 30
2019
(Unaudited)
2018 (Unaudited)
CASH FLOWS FROM OPERATING ACTIVITIES Income before income tax from continuing operations P=8,415,398 P=10,364,306 Income before income tax from discontinued operations 91,406 (256,752)
Income before income tax 8,506,804 10,107,554Adjustments for: Realized trading loss on financial assets at FVOCI (999,340) –
Realized trading loss on available-for-sale investments – (158,192) Depreciation and amortization 2,078,116 1,429,034 Amortization of premium/(discount) on investments securities (166,647) 789,981 Provision for impairment, credit and other losses 1,426,930 1,588,463 Net loss on sale or exchange of assets (508,930) (4,568,520) Mark-to-market loss/(gain) on derivatives (11,220) 598,809 Share in net income of an associate – (21,496) Amortization of transaction costs 83,563 15,640
Unrealized foreign exchange gain/(loss) on bills payable and acceptances (1,763,667) 2,983,188Unrealized foreign exchange gain on bonds payable 216,467 –
Changes in operating assets and liabilities: Decrease (increase) in amounts of:
Interbank loans receivables 668,023 1,062,905 Financial assets at fair value through profit or loss (7,023,445) (2,476,378) Loans and receivables (65,204,198) (52,466,077) Other assets (463,657) 2,528,739 Increase (decrease) in amounts of: Financial liabilities at fair value through profit or loss 96,011 289,147 Deposit liabilities 88,476,834 54,911,879 Accrued taxes, interest and other expenses 1,009,522 793,966 Other liabilities (803,063) (1,200,713)
Net cash generated from operations 25,618,103 16,207,929Income taxes paid (2,322,520) (3,117,046)
Net cash provided by operating activities 23,295,583 13,090,883
CASH FLOWS FROM INVESTING ACTIVITIES Proceeds from sale of:
Financial assets at FVOCI 12,803,054 39,410,225Financial Assets at Amortized Cost 51,153,533 19,356,795
Investment properties 501,203 6,949,640 Property and equipment 1,035,028 469,432
(forward)
- 28 - SEC 17Q Report 3Q19
Nine Months Ended September 30
2019
(Unaudited)
2018(Unaudited)
Acquisitions of: Financial assets at FVOCI (P=88,263,124) (P=23,729,263)
Financial Assets at Amortized Cost (56,212,080) (73,748,135) Property and equipment (2,497,529) (2,194,252) Software cost (336,193) (214,189)
Net cash (used) in investing activities (81,816,108) (33,699,747)
CASH FLOWS FROM FINANCING ACTIVITIES
Proceeds from issuance of long term negotiable certificate of deposits 8,143,277 –
Maturities of long term negotiable certificates of deposits (9,000,000) –
Issuance of stocks 11,850,316 –
Settlement of bills and acceptances payable (1,341,838,676) (134,776,306)
Proceeds from bonds payable 51,900,565 15,398,696
Proceeds from bills and acceptances payable 1,374,712,981 129,657,489
Net cash provided by (used in) financing activities 95,768,463 10,279,879
NET INCREASE (DECREASE) IN CASH AND
CASH EQUIVALENTS P=37,247,938 (P=10,328,985)
CASH AND CASH EQUIVALENTS AT
BEGINNING OF PERIOD
Cash and other cash items 16,825,487 12,391,139Due from BSP 102,723,312 108,743,985
Due from other banks 20,525,318 22,025,322
Interbank loans receivable 10,580,432 11,491,684
Securities held under agreements to resell 20,700,000 14,621,483
P=171,354,549 P=169,273,613
CASH AND CASH EQUIVALENTS AT END OF PERIOD
Cash and other cash items 14,599,006 11,302,588Due from BSP 148,528,452 109,723,420Due from other banks 17,043,099 25,551,899Interbank loans receivable 27,073,930 7,866,721Securities held under agreements to resell 1,358,000 4,500,000
P=208,602,487 P=158,944,628
OPERATIONAL CASH FLOWS FROM INTEREST
Interest received P=36,645,701 P=23,059,803 Interest paid 12,916,985 5,284,508