Embed Size (px)
Citation preview

Company UpdateMay 2021

Disclaimer
This presentation was prepared by Controladora Vuela Compañía de Aviación, S.A.B. de C.V., (d/b/a Volaris, the "Company") with the purpose of providing interested parties certain financial and other information of the Company. This presentation is confidential and may not be retransmitted or distributed to any other persons for any purpose whatsoever. This presentation is for discussion purposes and highlights basic information about the Company and this offering. Because it is a summary, it does not contain all the information that you should consider before investing. The information contained herein is subject to change without notice, its accuracy is not guaranteed, it has not been independently verified and it may not contain all material information concerning the Company. Neither the Company, nor any of their respective directors makes any representation or warranty (express or implied) regarding, or assumes any responsibility or liability for, the accuracy or completeness of, or any errors or omissions in, any information or opinions contained herein. None of the Company nor any of their respective directors, officers, employees, stockholders or affiliates nor any other person accepts any liability (in negligence, or otherwise) whatsoever for any loss howsoever arising from any use of this presentation or its contents or otherwise arising in connection therewith. No reliance may be placed for any purposes whatsoever on the information set forth in this presentation or on its completeness. This presentation should be read in conjunction with the base prospectus included in the registration statement, and the related prospectus supplement (including any information incorporated by reference therein), filed by Volaris with the Securities and Exchange Commission (the "SEC") in connection with the offering to which this presentation relates. You may get these documents by visiting EDGAR on the SEC website (www.sec.gov).
This presentation does not constitute or form part of any offer or invitation for sale or subscription of or solicitation or invitation of any offer to buy or subscribe for any securities, nor shall it or any part of it form the basis of or be relied on in connection with any contract or commitment whatsoever. Recipients of this presentation are not to construe the contents of this presentation as legal, tax or investment advice and should consult their own advisers in this regard.
This presentation contains statements that constitute forward-looking statements within the meaning of the Securities Act of 1933, as amended, the Securities Exchange Act of 1934 and the Private Securities Litigation Reform of 1995 which involve risks and uncertainties. We have based these forward-looking statements largely on our current expectations and projections about future events and financial trends affecting the financial condition of our business. Forward-looking statements should not be read as a guarantee or assurance of future performance or results and will not necessarily be accurate indications of the times at, or by, which such performance or results will be achieved. Forward-looking statements are based on information available at the time those statements are made and/or management’s good faith belief as of that time with respect to future events and are subject to risks and uncertainties that could cause actual performance or results to differ materially from those expressed in or suggested by the forward-looking statements. In addition, in this presentation, the words “believe,” “may,” “estimate,” “continue,” “anticipate,” “intend,” “expect,” “predict,” “potential” and similar expressions, as they relate to our company, our business and our management, are intended to identify forward-looking statements. In light of these risks and uncertainties, the forward-looking events and circumstances discussed in this presentation may not occur and actual results could differ materially from those anticipated or implied in the forward-looking statements. All forward-looking statements attributable to us or persons acting on our behalf are expressly qualified in their entirety by the cautionary statements set forth above. Forward-looking statements speak only as of the date of this presentation. You should not put undue reliance on any forward-looking statements. We assume no obligation to update forward-looking statements to reflect actual results, changes in assumptions or changes in other factors affecting forward-looking information, except to the extent required by applicable law. If we update one or more forward-looking statements, no inference should be drawn that we will make additional updates with respect to those or other forward-looking statements. The risks and uncertainties regarding these forward-looking statements include, but are not limited to, those set forth under the heading “Risk Factors” in the Company’s Report on Form 20 for the year ended December 31st, 2020, and in the Company’s other filings with the SEC, which are available at www.sec.gov.
Neither the SEC, the Mexican National Banking and Securities and Commission nor any other authority has approved or disapproved the information contained in this presentation, its accuracy or completeness.
2

Volaris is set and financially capitalized to grow and capture opportunities
Among the lowest cost airlines in the world
Demographics and bus to air substitution strategy fuels long term growth
Our ancillary revenue focus and point-to-point network support market leadership and stimulation
Fast recovery in terms of ASMs during COVID-19 as Volaris fills the void created by current market opportunities and VFR resilience
Flexible fleet and labor contracts provide a unique toolset to capitalize on current and secular growth opportunities
Solid liquidity and best positioned to deliver return on invested capital (ROIC)
3

Company Overview

NEW YORKNEW YORK
WASHINGTON, D.C.WASHINGTON, D.C.
GUATEMALAGUATEMALA
SAN SALVADORSAN SALVADOR
SAN JOSESAN JOSE
The highest-growth ultra-low-cost carrier of Latin America
Volaris has transported 141+ million passengerssince inception and almost 11.8M since COVID-19 started
Volaris is the largest Mexican carrier (1) Volaris ultra-low-cost model
• 68 airports offered: 43 domestic and 25 international (1) – with opportunity to increase market share in Mexico City Airport
• Ultra-low-cost airline serving Mexico, the U.S. and Central America
• Young fleet (5.3 yrs. on average) with 87 aircraft (35% NEOs) (1)
• 13.7 M passengers in the LTM (1)
• 419 daily flights (1)
• 170 routes: 105 domestic and 65 international (1)
• Highly productive airline with high asset utilization• 56 full time employees per aircraft with variable, performance -
based compensation structure and only one union• 11.3 and 10.6 block hours per day in 2020 and 1Q21• Operated 102% of capacity during December 2020 vs previous
year
• Member of the Dow Jones Sustainability MILA Pacific Alliance Index since November 2020
5Note: (1) As of March 2021
• “Volaris” trademark received Famous Trademark Recognition by the Mexican Institute of Industrial Property (“IMPI”) in April 2021

0
25
50
75
100%
20176.9
16.8
6.3
12.6
11.4
45.8
44.3
20186.7
17.2
7.9
11.7
10.2
45.7
46.9
20197.9
15.8
9.9
11.6
9.3
44.5
47.9
2020
11.2
11.35.5
16.0
10.1
43.9
19.8
Mar'207.9
11.3
9.0
11.4
8.6
50.9
2.7
Mar'218.5
10.23.8
23.2
13.7
40.5
2.1
81 77 74 81Y4 LF %84 68 64 65AM
VolarisAeromexicoInterjetVivaAmericanUnitedAeromar
OtherForeign
Volaris reached 38% domestic and 8% international market share in March 2021
Market share(On board passengers, M)
Source: AFAC-SCT
Domestic International
6
0
25
50
75
100%
2017
27.5
29.1
21.2
16.9
5.345.2
2018
28.4
27.7
20.5
18.4
5.049.5
2019
31.3
24.3
19.7
20.2
4.453.5
2020
38.4
25.3
8.8
24.4
3.128.2
Mar'20
33.7
23.1
18.3
21.7
3.23.1
Mar'21
38.2
29.5
29.4
2.83.2
81 86 89VB
81 73 66 86AM
88Y4 LF %89* 81* 81* 85*
VolarisAeromexicoInterjetVivaOthers

Strong, disruptive ultra-low-cost business model continues to see success, making air travel accessible to all
Resilient ULCC Business Model
Capacityincrease
Cost reduction
Lowbase fares
More customers
More ancillaries
CASM ex-fuel (USD cents)
1Q 2020= $4.131Q 2021= $4.78
Average base fare (USD)
1Q 2020= $471Q 2021= $37
Passengers1Q 2020= 5.2M1Q 2021= 4.2M
Ancillaries (% of total revenues)
1Q 2020= 35%1Q 2021= 49%
ASMs 1Q 2020= 106.9% of 2019 capacity1Q 2021= 94.3% of 2019 capacity
Unrestricted cash and cash equivalents (USD)
1Q 2020= $453M1Q 2021= $423M
7

As one of the lowest unit-cost operators worldwide we are uniquely positioned to continue a profitable growth strategy
Cost reduction
“True” low-cost business model that enables an extraordinary competitive advantage against peers
CY2019 CASM | USD cents (1)
CASM ex-fuel CASM
Source: Company FilingsNote: Non-USD data converted to USD using an average exchange rate for the period for convenience purposes only (1) Presenting average CASM and CASM ex-fuel. "US LCCs": Southwest, Allegiant, Jet Blue, Spirit; "Latin American Carriers": Avianca, Azul, Copa, Aeromexico, LATAM and Gol; "US Legacy Carriers": Delta, American Airlines, Alaska Airlines and United Airlines
8
4.0 4.0 4.0 4.05.6 5.5
7.5 7.510.22.1 2.2 2.5 2.5
2.3 3.0
2.7 3.2
3.5
6.1 6.2 6.5 6.57.8
8.5
10.2 10.7
13.7
Wizz Air Air Asia Volaris Ryan Air Frontier Indigo US LCCs Latin AmericanCarriers
US Legacy Carriers
900
1,100
1,300
1,500
0
10
20
30
'08 '09 '10 '11 '12 '13 '14 '15 '16 '17 '18 '19
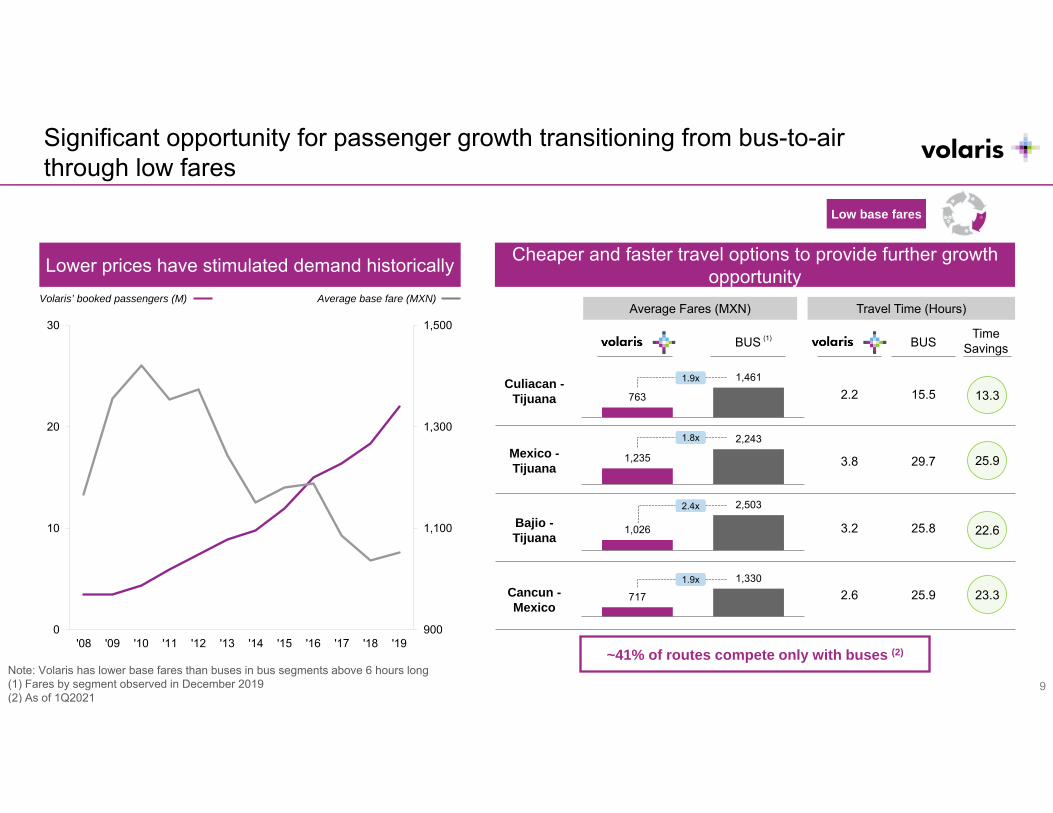
Significant opportunity for passenger growth transitioning from bus-to-air through low fares
Low base fares
1,235
2,243
1,026
2,503
763
1,461
Lower prices have stimulated demand historicallyVolaris’ booked passengers (M) Average base fare (MXN)
Cheaper and faster travel options to provide further growth opportunity
Culiacan -Tijuana
BUS
Average Fares (MXN) Travel Time (Hours)
BUS
Mexico -Tijuana
Bajio -Tijuana
Cancun -Mexico
717
1,330
2.2 15.5
3.8 29.7
3.2 25.8
2.6 25.9
13.3
25.9
22.6
23.3
1.9x
1.8x
2.4x
1.9x
Time Savings
(1)
~41% of routes compete only with buses (2)
9Note: Volaris has lower base fares than buses in bus segments above 6 hours long (1) Fares by segment observed in December 2019(2) As of 1Q2021

For over a decade, Volaris has been the main source of the Air Travel market growth in Mexico and there is still room for further growth
10
Air Trips per Capita Mexican Socioeconomical Profile (%)Bus-to-Air Market Potential (million passengers)
World (2019) = 0.6
Mexico remains an underpenetrated market with most of its growth during the recent years
coming from Volaris…… with huge bus-switching opportunities… … and an emerging middle-class
Source: World Bank, INEGI, SCT and CONAPO
20252010
Volaris targets the emerging Mexican middle-class
Market sources of future growth
Growing young population in an underpenetrated market
Huge bus market subject to bus-switching
Consolidation of a middle-class, young population
Mexico is still an underpenetrated market when compared with other economies
Sources of growth
2018
18.4
Other
2.5
Busswitching
1.1
2019
22.0
Other
1.0
Busswitching
0.5
2021
23.5
Mexican Bus Market Volaris Potential Growth
1.7%(CAGR)
We will continue to exploit the potential to convert bus passengers to the air market
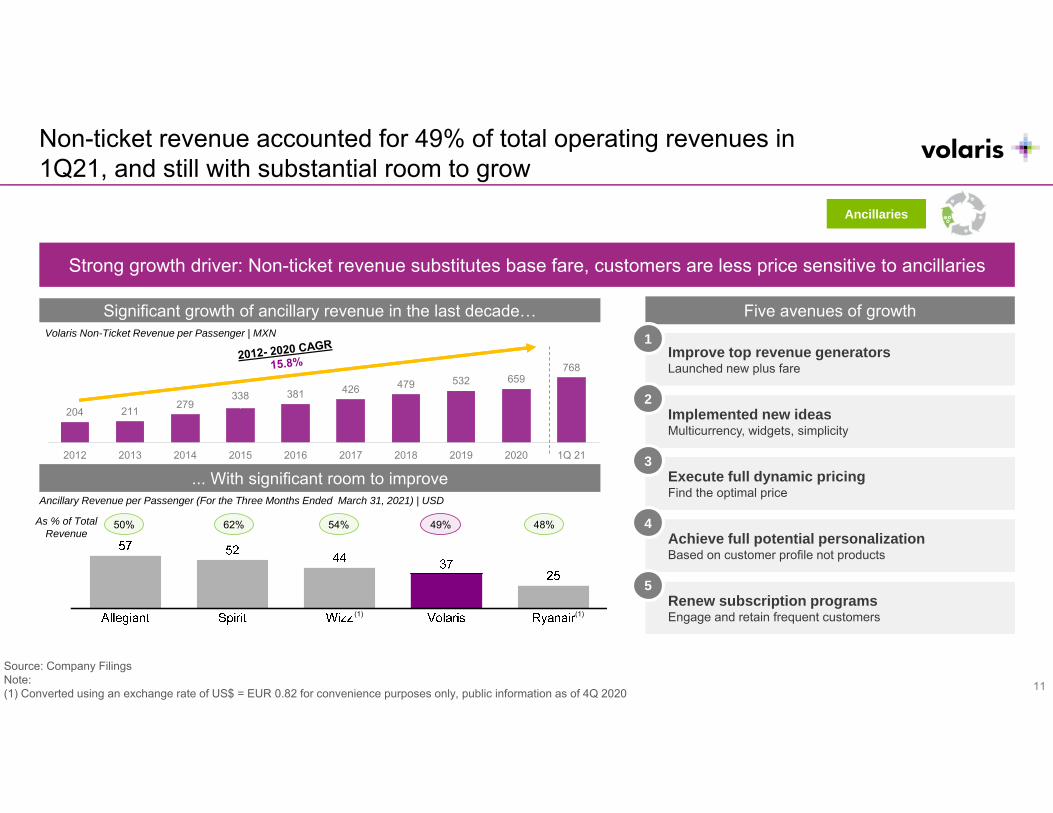
204 211 279338 381 426 479 532 659
768
2012 2013 2014 2015 2016 2017 2018 2019 2020 1Q 21
Ancillaries
As % of Total Revenue
Volaris Non-Ticket Revenue per Passenger | MXN
Five avenues of growth
Strong growth driver: Non-ticket revenue substitutes base fare, customers are less price sensitive to ancillaries
Improve top revenue generatorsLaunched new plus fare
Implemented new ideasMulticurrency, widgets, simplicity
Execute full dynamic pricingFind the optimal price
Achieve full potential personalizationBased on customer profile not products
Renew subscription programsEngage and retain frequent customers
... With significant room to improve
1
2
3
4
5
Ancillary Revenue per Passenger (For the Three Months Ended March 31, 2021) | USD
Significant growth of ancillary revenue in the last decade…
50% 62% 54% 49% 48%
(1) (1)
Source: Company FilingsNote:(1) Converted using an exchange rate of US$ = EUR 0.82 for convenience purposes only, public information as of 4Q 2020 11
Non-ticket revenue accounted for 49% of total operating revenues in 1Q21, and still with substantial room to grow
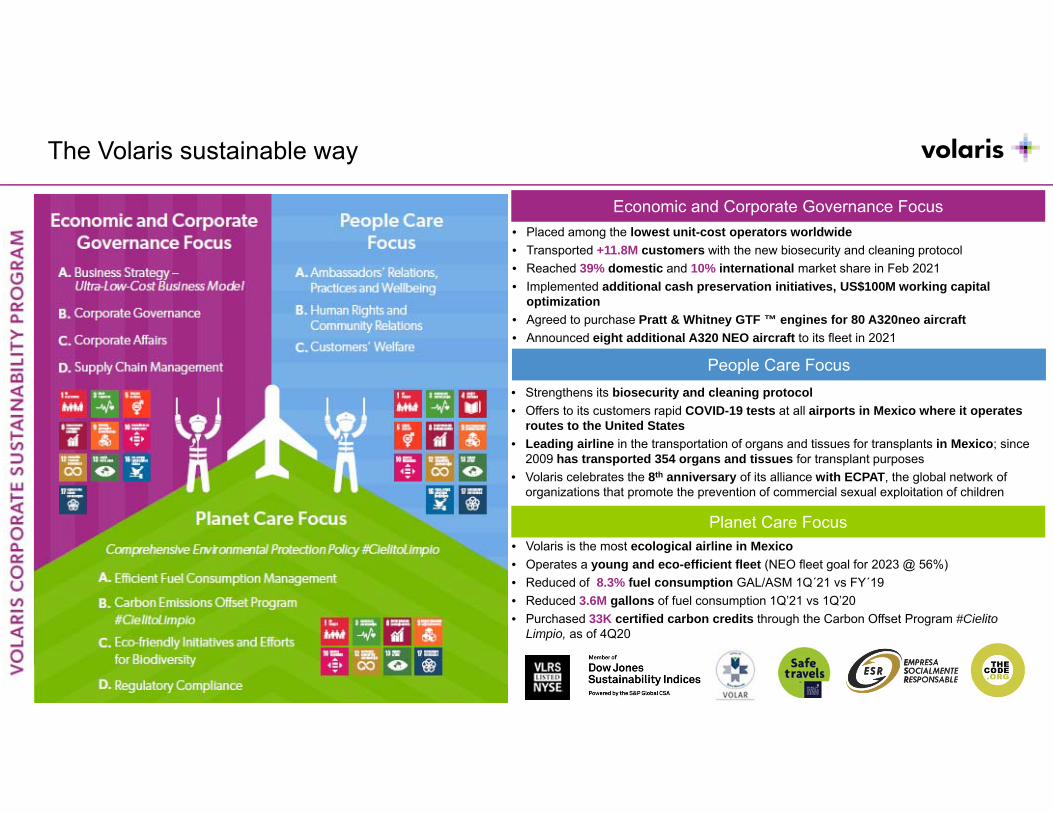
Economic and Corporate Governance Focus
The Volaris sustainable way
• Placed among the lowest unit-cost operators worldwide• Transported +11.8M customers with the new biosecurity and cleaning protocol• Reached 39% domestic and 10% international market share in Feb 2021 • Implemented additional cash preservation initiatives, US$100M working capital
optimization• Agreed to purchase Pratt & Whitney GTF ™ engines for 80 A320neo aircraft• Announced eight additional A320 NEO aircraft to its fleet in 2021
People Care Focus• Strengthens its biosecurity and cleaning protocol• Offers to its customers rapid COVID-19 tests at all airports in Mexico where it operates
routes to the United States• Leading airline in the transportation of organs and tissues for transplants in Mexico; since
2009 has transported 354 organs and tissues for transplant purposes• Volaris celebrates the 8th anniversary of its alliance with ECPAT, the global network of
organizations that promote the prevention of commercial sexual exploitation of children
Planet Care Focus• Volaris is the most ecological airline in Mexico• Operates a young and eco-efficient fleet (NEO fleet goal for 2023 @ 56%)• Reduced of 8.3% fuel consumption GAL/ASM 1Q´21 vs FY´19• Reduced 3.6M gallons of fuel consumption 1Q’21 vs 1Q’20• Purchased 33K certified carbon credits through the Carbon Offset Program #Cielito
Limpio, as of 4Q20

Business Update“Our priorities for the remainder of the year are: first, generate consistent growth for our investors with actions in line with our
sustainability program; grow and consolidate our leadership in core markets while increasing presence at Mexico City airports; accelerate the return and expand our operations in Central America; ensure a solid corporate infrastructure with the highest
industry standards on training and safety as well as technological tools to foster our commercial and administrative needs for sustainable growth; maintain a peaceful labor environment with productive and flexible terms and conditions; and finally, preserve our solid capital structure balancing short-term liquidity with the right long-term funding to support our growth”.
Enrique Beltranena, CEO & President of Volaris

Key initiatives are allowing Volaris to compete from a position of strength
Ability to adjust capacity to match demand with a focus on rebuilding TRASM after the second wave of the pandemic
Focus on maintaining lean cost structure with one of the lowest unit costs in the global airline industry
Strict measures to preserve liquidity, closing 1Q21 with USD $423M in cash and cash equivalents
Recovery gained momentum and in 1Q21 focused on strengthening the foundation of Volaris’ long-term growth
Priority for 2Q21 and 3Q21 is to accelerate Volaris’ recovery with profitability and ensure a solid infrastructure to support this growth
14

Executed on multiple actions to bolster liquidity, reduce costs and capture market opportunities
Liquidity, cash preservation,
and cost reduction
• In December 2020, Volaris concluded an upsized offering of ADSs, raising ~USD $164.4M in
net proceeds
• In 2020, implemented strict liquidity preservation program resulting in ~USD $266M of
benefits, and aircraft deferrals postponing USD $200M in PDPs
• Additional working capital relief of +USD $100M during 1Q of 2021
• Comprehensive negotiations with key suppliers
• Cost/payment deferral contingency plan including cutting non-essential expenses and
negotiating cost reductions with more than 360 suppliers
• Maintained labor base at reduced compensation levels
• Capital expenditures reduced to a minimum
Play offense
Closely monitoring capacity reductions from competitors for possible opportunities Testing new ancillaries (“flexibility combo”)
Targeted promotions to test stimulation potential Launched five new domestic routes and seven new international routes in 2020
Executed agreements to incorporate 8 additional NEO aircraft in 2021
15

1%
8%
21%
28%
35%43%
52%
56%
2016 2017 2018 2019 2020 2021 2022 2023
Our NEO aircraft transition plan will keep us driving fuel efficiency towards a lower CASM and support our green initiative commitment
New contractual fleet plan with Airbus provides flexibility for opportunistic growth, through straight operating leases
% of NEOs in Fleet
77 82 86 98 108 1067169
Total # of Aircraft including Volaris Current Contractual Order Book
2019 Expenses Breakdown
38%
62%
Fuel Expense
Other
Total # of Aircraft
16
8 additional NEOaircraft

Latest traffic figures show a recovery trend to pre-COVID levels
Capacity Network• Flexible and strategic operational plan to reduce
capacity
• Cancelled and consolidated flights to defend profitability
• Capacity* increases dependent on demand and sales triggers‒ 2Q 2020: operated 23% of capacity vs. 2019‒ 3Q 2020: operated 75% of capacity vs. 2019‒ 4Q 2020: operated 95% of capacity vs. 2019‒ 1Q 2021: operated 88% of capacity vs. 2020‒ 2Q 2021: planning to operate ~110% vs. 2019
• New routes 4Q 2020 - 1Q 2021Mexico City to:
- Campeche, Campeche- Dallas, Texas- Houston, Texas- Fresno, California- Ontario, California- San Jose, California- Sacramento, California
Cancun to Oaxaca, OaxacaMorelia to Chicago, Illinois (OHD)Mexicali to Cancun, Quintana Roo
* Measured in terms of Available Seat Miles (ASMs) 17
Dec 2020
Jan 2021
Feb 2021
Mar2021
April2021
Routes 178 177 178 170 181
Stations 68 68 68 68 71
Domestic 43 43 43 43 43
International 25 25 25 25 28
Average daily segments 382 370 337 410 426ASMs(in millions, scheduled & charter)
2,250 2,149 1,509 1,722 2,224
Domestic 1,554 1,519 1,150 1,369 1,701
International 697 630 359 353 523Total Load Factor(in %, scheduled, RPMs/ASMs)
78.5% 73.9% 74.1% 86.9% 82.4%

26% of Mexico’s fleet is coming offline, creating a massive opportunity for Volaris to take share
Capacity impact from competitor fleet reduction (1) Change in market share (2)
Note: (1) Fleet reduction doesn’t consider 737 MAX since were inactive in Dec’19; Total fleet includes TAR, Aeromar(2) AFAC-SCT information; Share change of listed airlines
Reduction of 26% of narrow-body fleet in the market;
equivalent to 70 Volaris A320
Aircraft Percentage Points | From Mar-20 to Mar-21
Domestic International
18
235
4 2
355
319
(56)(21)
242
(7) (6)
0
100
200
300
400
Total FleetMexicanCarriers(Dec-19)
TotalNarrow-
body FleetMexicanCarriers
Interjet AeroMexico Total Narrow-body FleetMexicanCarriers(Jun-20)
Interjet AeroMexico AeroMexico -MAX active
Others Total Narrow-body FleetMexicanCarriers(Dec-20)
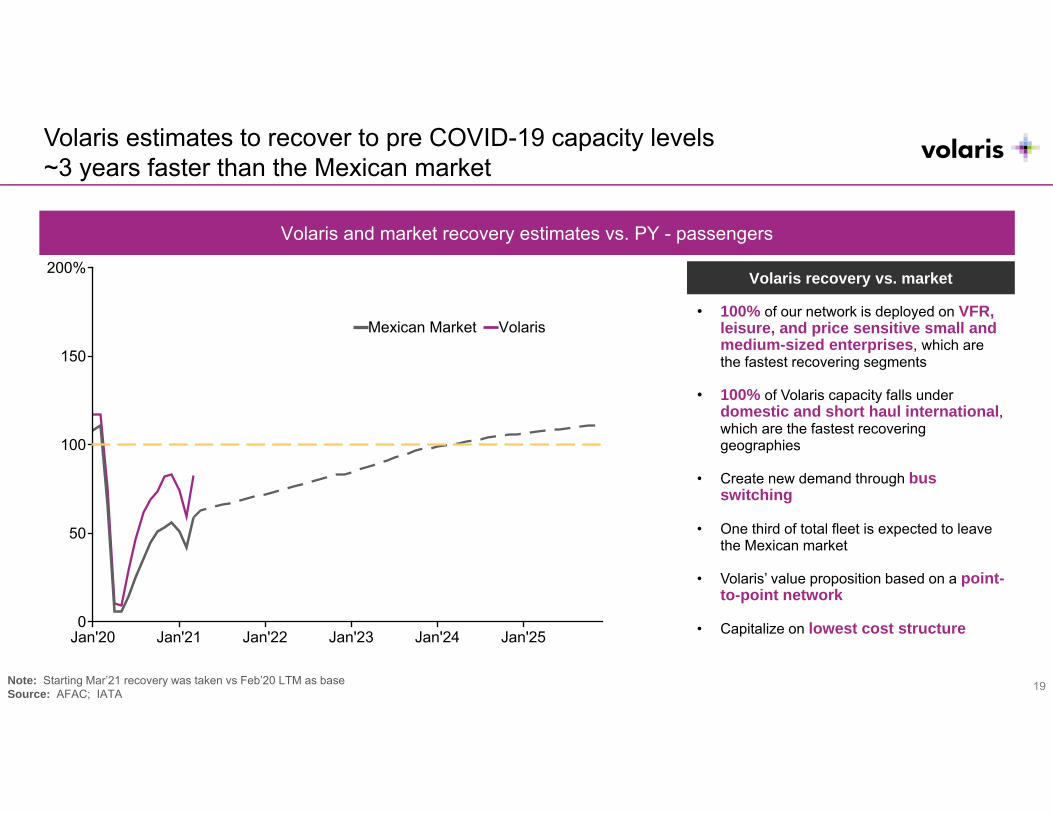
Volaris and market recovery estimates vs. PY - passengers
Volaris estimates to recover to pre COVID-19 capacity levels~3 years faster than the Mexican market
• 100% of our network is deployed on VFR, leisure, and price sensitive small and medium-sized enterprises, which are the fastest recovering segments
• 100% of Volaris capacity falls under domestic and short haul international, which are the fastest recovering geographies
• Create new demand through bus switching
• One third of total fleet is expected to leave the Mexican market
• Volaris’ value proposition based on a point-to-point network
• Capitalize on lowest cost structure
Volaris recovery vs. market
Note: Starting Mar’21 recovery was taken vs Feb’20 LTM as baseSource: AFAC; IATA
19
0
50
100
150
200%
Jan'20 Jan'21 Jan'22 Jan'23 Jan'24 Jan'25
Mexican Market Volaris
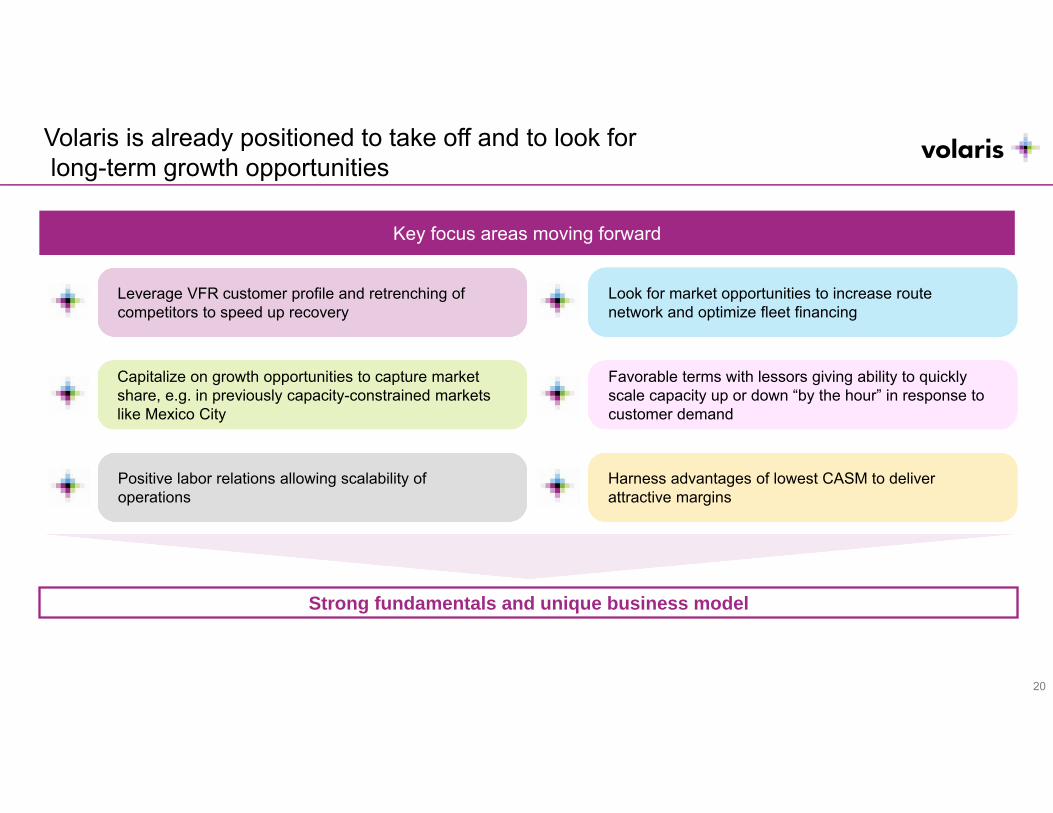
Volaris is already positioned to take off and to look forlong-term growth opportunities
Leverage VFR customer profile and retrenching of competitors to speed up recovery
Look for market opportunities to increase route network and optimize fleet financing
Harness advantages of lowest CASM to deliver attractive margins
Positive labor relations allowing scalability of operations
Capitalize on growth opportunities to capture market share, e.g. in previously capacity-constrained markets like Mexico City
Favorable terms with lessors giving ability to quickly scale capacity up or down “by the hour” in response to customer demand
Strong fundamentals and unique business model
Key focus areas moving forward
20