Embed Size (px)
Citation preview

1Q14 Business Report
I. Corporate Overview □ Affiliates
As of end-1Q 2014, Samsung Group had a total of 74 domestic affiliates. Compared to end-2013, two new affiliate (Samsung Welstory, Samsung Card Customer Service) were added and three (Samsung Corning Precision Materials, Samsung SNS, Global Tech) were excluded. Among Samsung Group’s 74 affiliates, 17 including Samsung Electronics are listed, and 57 are unlisted.
(As of March 31, 2014)
No. of affiliates Name of affiliates
Listed 17
Samsung C&T, Cheil Industries, Samsung Electronics, Samsung SDI, Samsung Techwin, SEMCO, Samsung Heavy Industries, Samsung Card, Samsung Life Insurance, Hotel Shilla, Samsung Fire & Marine Insurance, Samsung Securities, Samsung Fine Chemicals, Samsung Engineering, S1, Cheil Worldwide, Credu
Unlisted 57
Samsung Everland, Samsung Petrochemical, Samsung SDS, Samsung General Chemicals, Samsung Total Petrochemicals, Samsung Lions, SERI, STECO, Samsung Thales, SEMES, Living Plaza, Samsung Electronics Service, Samsung Electronics Logitech, Hantok Chemicals, CVnet Corporation, Care Camp, Allat Corp., SECUI.com, Wealthia.com, Open Tide Korea, 365Homecare, Samsung Futures, Samsung Venture Investment Corporation, Samsung Asset Management, Saengbo, SD Flex, World Cyber Games, Samsung Claim Adjustment Service, Anycar Service, S-Core, Samsung Bluewings, HTSS, RAY, Songdo Land Mark City, S1 CRM, Open Hands, S-EnPol, Samsung Medison, Samsung Biologics, SMP, STM, Nuri Solution, Colombo Korea, Samsung Life Service, Miracom Inc., SU Materials, Natural 9, Samsung Display, Samsung Bioepis, Samsung Corning Advanced Glass , Daejung Offshore Wind Power Co., Ltd., SAMSUNG SRA Asset Management, Jung-ahm Wind Power, Sungkyunkwan University Dormitory, Samsung SGL Carbon Composite Materials Co., Ltd, Samsung Welstory, Samsung Card Customer Service
Total 74
☞ Refer to 『□ Affiliates』 in 『III. Corporate Governance and Affiliates』 for more details about domestic and overseas affiliates.

□ Subsidiaries Subject to Consolidated Financial Statements As of end-1Q 2014, Samsung Electronics’ consolidated subsidiaries totaled 153 with one subsidiary being newly included and one excluded compared to end-2013. Following is the list of consolidated subsidiaries.
(Million won)
Subsidiaries Established in Major business End-2013
asset Stake Classified as major
subsidiary
Samsung Electronics America Inc. 1978.07 Sale of electronic goods 12,248,560 Over
50% O
Samsung Receivables Corporation 1998.03 Bond management 2,780,689 Over 50% O
Samsung Semiconductor Inc. 1983.07 Sale of electronic goods 7,346,339 Over
50% O
Samsung Electronics Canada Inc. 1980.07 Sale of electronic goods 522,775 Over
50% O
Samsung Information Systems America Inc. 1988.1 R&D 184,101 Over 50% O
Grandis, Inc. 2002.06 R&D 108,037 Over 50% O
Samsung International Inc. 1983.1 CTV production 34,424 Over 50% X
Samsung Mexicana S.A. de C.V 1988.03 Production of electronic goods 1,065,830 Over
50% O
Samsung Telecommunications America LLC. 1992.01 Sale of telecom
products 4,735,432 Over 50% O
Samsung Austin Semiconductor LLC. 1996.02 Production of semiconductors 6,393,348 Over
50% O
SEMES America Inc. 1998.1 Semiconductor equipment 1,090 Over
50% X
Samsung Electronics Mexico S.A. De C.V. 1995.07 Production and sale of electronic goods 1,554,638 Over
50% O
Samsung Electronics Latino America Miami, Inc. 1995.05 Sale of electronic
goods 259,165 Over 50% O
Nvelo, Inc. 2010.05 Software 1,519 Over 50% X
Samsung Electronics Latinoamerica (Zona Libre) 1989.04 Sale of electronic
goods 375,274 Over 50% O
Samsung Electronics Venezuela, C.A. 2010.05 Marketing and services 8,928 Over
50% X
Samsung Electronica Colombia S.A. 1997.03 Sale of electronic goods 327,320 Over
50% O
Samsung Electronics Panama. S.A. 2012.07 Consulting 3,549 Over 50% X
Samsung Electronica Da Amazonia LTDA. 1994.1 Production and sale of electronic goods 3,429,136 Over
50% O
Samsung Electronics Argentina S.A. 1996.06 Marketing and services 49,454 Over
50% X
Samsung Electronics Chile Limitada 2002.12 Sale of electronic goods 492,709 Over
50% O
Samsung Electronics Peru S.A.C. 2010.04 Sale of electronic goods 150,228 Over
50% O
Samsung Electronics (UK) Ltd. 1995.07 Sale of electronic goods 1,393,507 Over
50% O

Samsung Electronics(London) Ltd. 1999.01 Holding company 7,647 Over 50% X
Samsung Electronics Holding GmbH 1982.02 Holding company 886,338 Over 50% O
Samsung Semiconductor Europe GmbH 1987.12 Sale of semiconductors and LCD
1,016,296 Over 50% O
Samsung Electronics GmbH 1984.12 Sale of electronic goods 1,214,277 Over
50% O
Samsung Electronics Iberia, S.A. 1989.01 Sale of electronic goods 783,438 Over
50% O
Samsung Electronics France S.A.S 1988.01 Sale of electronic goods 1,157,900 Over
50% O
Samsung Electronics Hungarian Private Co. Ltd 1989.1 Production and sale
of electronic goods 1,249,691 Over 50% O
Samsung Electronics Czech and Slovak s.r.o. 2010.01 Sale of electronic goods 170,011 Over
50% O
Samsung Electronics Italia S.P.A. 1991.04 Sale of electronic goods 1,004,423 Over
50% O
Samsung Electronics Europe Logistics B.V. 1991.05 Logistics 1,903,892 Over 50% O
Samsung Electronics Benelux B.V. 1995.07 Sale of electronic goods 1,290,124 Over
50% O
Samsung Display Slovakia s.r.o. 2007.03 TFT-LCD processing 299,196 Over
50% O
Samsung Electronics Romania LLC 2007.09 Sale of electronic goods 144,702 Over
50% O
Samsung Electronics Polska, SP.Zo.o 1996.04 Sale of electronic goods 557,370 Over
50% O
Samsung Electronics Portuguesa S.A. 1982.09 Sale of electronic goods 132,631 Over
50% O
Samsung Electronics Nordic Aktiebolag 1992.03 Sale of electronic goods 533,252 Over
50% O
Samsung Nanoradio Design Center 2004.02 R&D 21,737 Over 50 X
Samsung Semiconductor Europe Limited 1997.04 Sale of semiconductor and LCD
98,884 Over 50% O
Samsung Electronics Austria GmbH 2002.01 Sale of electronic goods 323,756 Over
50% O
Samsung Electronics Slovakia s.r.o 2002.06 Production of CTV and monitors 1,764,078 Over
50% O
Samsung Electronics European Holding Cooperatief U.A. 2008.1 Holding company 5,780,302 Over
50% O
Samsung Electronics Poland Manufacturing SP.Zo.o 2010.02 Production of home
appliances 373,469 Over 50% O
Samsung Electronics Greece S.A. 2010.04 Sale of electronic goods 108,514 Over
50% O
Nanoradio Hellas AE 2007.11 R&D 21,737 Over 50% X
Samsung Denmark Research Center ApS 2012.09 R&D 22,520 Over 50% X
Samsung France Research Center SARL 2012.10 R&D 22,406 Over 50% X
Samsung Cambridge Solution Centre Limited 2012.09 R&D 132,919 Over
50% O

Samsung Electronics Baltic SIA 2001.1 Sale of electronic goods 44,495 Over
50% X
Samsung Electronics Overseas B.V. 1997.01 Sale of electronic goods 173,644 Over
50% O
Samsung Electronics Rus LLC 1999.03 Marketing 12,392 Over 50% X
Samsung Electronics Rus Company LLC 2006.1 Sale of electronic goods 1,410,054 Over
50% O
Samsung Electronics Ukraine LLC 2004.01 Marketing 79 Over 50% X
Samsung Electronics Ukraine Company LLC 2008.09 Sale of electronic goods 189,644 Over
50% O
Samsung R&D Institute Rus LLC 2011.11 R&D 13,767 Over 50% X
Samsung Electronics Kazakhstan LLP 2006.07 Marketing 964 Over 50% X
Samsung Electronics KZ and Central Asia LLP 2008.09 Sale of electronic
goods 161,062 Over 50% O
Samsung Electronics Rus Kaluga LLC 2007.07 Production of CTV 1,122,495 Over 50% O
Samsung Russia Service Centre LLC 1997.11 Service 41,567 Over 50% X
Samsung Electronics West Africa 2010.03 Marketing 61,414 Over 50% O
Samsung Electronics East Africa 2011.12 Marketing 26,006 Over 50% X
Samsung Gulf Electronics Co., Ltd. 1995.05 Sale of electronic goods 1,071,694 Over
50% O
Samsung Electronics Egypt S.A.E 2012.07 Production and sale of electronic goods 251,866 Over
50% O
Samsung Electronics Israel Ltd. 2012.09 Marketing 3,150 Over 50% X
Samsung Electronics Tunisia S.A.R.L 2012.09 Marketing 1,667 Over 50% X
Samsung Electronics Pakistan(Private) Ltd. 2012.11 Marketing 1,814 Over
50% X
Samsung Electronics South Africa(Pty) Ltd. 1994.06 Sale of electronic goods 787,562 Over
50% O
Samsung Electronics Turkey 1984.12 Sale of electronic goods 674,173 Over
50% O
Samsung Semiconductor Israel R&D Center,Ltd. 2007.1 R&D 22,940 Over
50% X
Samsung Electronics Levant Co.,Ltd. 2009.07 Sale of electronic goods 403,713 Over
50% O
Samsung Electronics Morocco SARLAU 2009.11 Sale of electronic goods 88,406 Over
50% O
Samsung Japan Corporation 1975.12 Sale of electronic goods 1,174,832 Over
50% O
Samsung R&D Institute Japan Co. Ltd 1992.08 R&D 181,723 Over 50% O
Samsung Electronics Japan Co., Ltd. 2008.09 Sale of electronic goods 712,050 Over
50% O
Samsung Electronics Display (M) Sdn. Bhd. 1995.03 Production and sale of electronic goods 814,820 Over
50% O
Samsung Electronics Malaysia Sdn. Bhd. 1989.09 Production of home appliances 277,354 Over
50% O
Samsung Vina Electronics Co., Ltd. 1995.01 Production and sale of electronic goods 175,780 Over
50% O

Samsung Asia Private Ltd. 2006.07 Sale of electronic goods 2,425,585 Over
50% O
Samsung India Electronics Private Ltd. 1995.08 Production and sale of electronic goods 1,924,832 Over
50% O
Samsung R&D Institute India-Bangalore Private Limited 2005.05 R&D 147,900 Over
50% O
Samsung Electronics Australia Pty. Ltd. 1987.11 Sale of electronic goods 578,624 Over
50% O
PT Samsung Electronics Indonesia 1991.08 Production and sale of electronic goods 647,199 Over
50% O
PT Samsung Telecommunications Indonesia 2003.03 Sale of telecom systems and services
15,944 Over 50% X
Thai-Samsung Electronics Co., Ltd. 1988.1 Production and sale of electronic goods 1,476,296 Over
50% O
Samsung Electronics Philippines Corporation 1996.03 Sale of electronic
goods 127,203 Over 50% O
Samsung Malaysia Electronics (SME) Sdn. Bhd. 2003.05 Sale of electronic
goods 814,104 Over 50% O
Samsung R&D Institute BanglaDesh 2010.08 R&D 6,662 Over 50% X
Samsung Electronics Vietnam Co., Ltd. 2008.03 Production of electronic goods 5,625,759 Over
50% O
Samsung Telecommunications Malaysia Sbn. Bhd. 2009.08
Sale of telecom systems and services
11,593 Over 50% X
Samsung Display DongGuan Co., Ltd. 2001.11 TFT-LCD production 1,015,838 Over
50% O
Samsung Display TianJin Co., Ltd. 2004.06 TFT-LCD production 650,311 50% O
Samsung Electronics Hong Kong Co., Ltd. 1988.09 Sale of electronic goods 1,188,620 Over
50% O
Suzhou Samsung Electronics Co., Ltd. 1995.04 Production of home appliances 645,699 Over
50% O
Samsung Suzhou Electronics Export Co., Ltd. 1995.04 Production of home
appliances 352,780 Over 50% O
Samsung (CHINA) Investment Co., Ltd. 1996.03 Sale of electronic goods 8,406,438 Over
50% O
Samsung Mobile R&D Center China-Guangzhou 2010.01 R&D 38,323 Over
50% X
Samsung Tianjin Mobile Development Center 2010.08 R&D 28,245 Over
50% X
Samsung Electronics Suzhou Semiconductor Co., Ltd. 1994.12 Semiconductor
processing 660,374 Over 50% O
Samsung Electronics (Shandong) Digital Printing Co., Ltd. 1993.03 Production of
printers 761,018 Over 50% O
Samsung Electronics Huizhou Co., Ltd. 1992.12 Production of electronic goods 4,599,200 Over
50% O
Tianjin Samsung Electronics Co., Ltd. 1993.04 Production of electronic goods 907,752 Over
50% O
Samsung Electronics Taiwan Co., Ltd. 1994.11 Sale of electronic goods 1,390,404 Over
50% O
Beijing Samsung Telecom R&D Center 2000.09 R&D 44,780 Over 50% X

Tianjin Samsung Telecom Technology Co., Ltd. 2001.03 Production of
telecom products 2,939,027 Over 50% O
Shanghai Samsung Semiconductor Co., Ltd. 2001.1 Sale of semiconductor and LCD
1,310,109 Over 50% O
Samsung Electronics Suzhou Computer Co., Ltd. 2002.09 Production of
electronic goods 846,670 Over 50% O
Samsung Display SuZhou Co., Ltd. 2002.09 TFT-LCD processing 554,424 Over
50% O
Samsung Suzhou LCD Co., Ltd 2011.07 TFT-LCD processing 1,463,589 Over
50% O
Shenzhen Samsung Kejian Mobile Telecommunication Technology Co., Ltd. 2002.02 Sale of telecom
products 88,698 Over 50% O
Samsung Electronics Shanghai Telecommunication Co., Ltd. 2001.11 Sale of telecom and
network products 1,411 Over 50% X
Samsung Semiconductor (China) R&D Co., Ltd. 2003.04 R&D 18,982 Over
50% X
Samsung Electronics China R&D Centre 2004.05 R&D 25,429 Over 50% X
Samsung (China) Semiconductor Co., Ltd. 2012.09 Production of
semiconductor 3,752,682 Over 50% O
Samsung Electronics Hainan Fiberoptics Co., Ltd. 2004.04 Production of fiber
optic and cable 111,367 Over 50% O
Samsung Electronics (Beijing) Service Company Limited 2005.01 Services 140,868 Over
50% O
Tianjin Samsung LED Co., Ltd. 2009.05 Production of LED 457,896 Over 50% O
Tianjin Samsung Opto-Electronics Co., Ltd. 1994.02 Production of camera and camcorder
241,957 Over 50% O
World Cyber Games 2000.07 Game tournaments 2,234 Over 50% X
Samsung Display 2012.04 Production and sale of TFT-LCD 35,754,894 Over
50% O
SU Materials 2011.08 Production of electronic goods 21,711 Over
50% X
STECO 1995.06 Production of semiconductor components
91,556 Over 50% O
SEMES 1993.01 Semiconductor/FPD manufacturing equipment
669,232 Over 50% O
Samsung Electronics Service 1998.1 Electronics goods repair services 335,588 Over
50% O
Samsung Electronics Sales 1996.07 Electronics goods Sales 564,361 Over
50% O
Samsung Electronics Logitech 1998.04 Total logistic services 140,733 Over
50% O
Samsung Bluewings 2008.12 Team and game sponsorship 4,115 Over
50% X
SVIC #6 Venture Capital Union 2005.07 Investment in venture firms and new technologies
37,284 Over 50% X
SVIC #14 Venture Capital Union 2009.05 Investment in venture firms and new technologies
55,465 Over 50% O

SVIC #20 Venture Capital Union 2011.03 Investment in venture firms and new technologies
30,532 Over 50% X
SVIC #21 Venture Capital Union 2011.11 Investment in venture firms and new technologies
61,384 Over 50% O
SVIC #22 Venture Capital Union 2011.11 Investment in venture firms and new technologies
93,554 Over 50% O
SVIC #23 Venture Capital Union 2012.10 Investment in venture firms and new technologies
10,746 Over 50% X
Hi Pioneer Private Securities Investment Trust 1 2011.08
Investment in venture firms and new technologies
19,189 Over 50% X
Samsung Medison 1985.07 Medical equipment 309,321 Over 50% O
RAY 2004.10 Dental CT 5,950 Over 50% X
SONOACE Deutschland GmbH 2001.1 Medical equipment 322 Over 50% X
Samsung Medison Europe B.V. 2005.11 Medical equipment 602 Over 50% X
Samsung Medison Shanghai Medical Instrument Co., Ltd. 1992.11 Medical equipment 10,692 Over
50% X
Medison Medical Equipment Shanghai Co., Ltd. 2005.03 Medical equipment 757 Over
50% X
Samsung Medison India Private Ltd. 2009.01 Medical equipment 96 Over 50% X
Nexus DX Inc. 2009.07 Medical equipment 15,214 Over 50% X
Nanogen Recognomics GmbH 2001.07 Medical equipment - Over 50% X
NeuroLogica Corp. 2004.02 Medical equipment 187,297 Over 50% O
Samsung Electronics Vietnam THAINGUYEN Co., Ltd. 2013.03 Production of
telecom products 590,033 Over 50% O
Samsung Network R&D Center China-Shenzhen 2013.03 R&D 5,738 Over
50% X
Samsung Electronics Switzerland GmbH 2013.05 Sale of electronic goods 115,759 Over
50% O
Samsung R&D Institute China-Xian 2013.07 R&D 8,179 Over 50% X
SEMES (XIAN) Co., Ltd. 2013.07 Semiconductor equipment 242 Over
50% X
Samsung Electronics New Zealand Limited 2013.09 Sale of electronic
goods 3,163 Over 50% X
RT SV CO-INVEST, LP 2014.02 Investment in venture firms - Over
50% X
※ Companies whose total assets were KRW50 billion or more at end-2013 are classified as major subsidiaries.

□ Total Number of Shares, etc. 1. Total number of shares ( As of March 31, 2014)
(Unit: # of shares)
Classification Type of shares Note Common Preferred Total I. No. of authorized shares 400,000,000 100,000,000 500,000,000 - II. No. of shares issued 155,609,337 23,893,427 179,502,764 - III. No. of shares decreased 8,310,000 1,060,000 9,370,000 -
1. Capital reduction - - - -
2. Share cancellation 8,310,000 1,060,000 9,370,000 Treasury share cancellation
3. Redemption of redeemable shares - - - - 4. Others - - - -
IV. No. of outstanding shares (II-III) 147,299,337 22,833,427 170,132,764 - V. Treasury shares 16,360,561 2,979,693 19,340,254 - VI. Float (IV-V) 130,938,776 19,853,734 150,792,510 - 2. Treasury shares
In 1Q 2014, Samsung Electronics distributed 23,655 common shares in relation to the exercise of stock options of current and former management. As of end-1Q 2014, Samsung Electronics held 16,360,561common treasury shares and 2,979,693 preferred treasury shares.
(As of March 31, 2014)
(# of shares)
Acquisition method Share type
Period-beginning
shares
Change Period-end
shares Acquisition (+)
Disposal (-)
Cancellation (-)
Acquisition under the Capital
Market Act
Direct acquisition
Intra-market direct
acquisition
Common 16,384,216 - 23,655 - 16,360,561
Preferred 2,979,693 - - - 2,979,693
TOB Common - - - - - Preferred - - - - -
Exercise of
appraisal right
Common - - - - -
Preferred - - - - - Sub-total
(a) Common 16,384,216 - 23,655 - 16,360,561 Preferred 2,979,693 - - - 2,979,693

Acquisition under trust contracts
Shares held by trustee
Common - - - - -
Preferred - - - - - Shares held in kind
Common - - - - -
Preferred - - - - -
Sub-total (b)
Common - - - - - Preferred - - - - -
Other acquisitions (c) Common - - - - -
Preferred - - - - -
Total (a+b+c) Common 16,384,216 - 23,655 - 16,360,561
Preferred 2,979,693 - - - 2,979,693

□ Voting Shares
Samsung Electronics issued 147,299,337 common shares, which is 29.5% of authorized shares. The company issued 22,833,427 preferred shares. 16,360,561 common treasury shares held by the company and preferred shares do not have voting rights. 12,506,577 shares have limited voting rights under relevant laws. Thus, the number of shares with voting rights is 118,432,199.
( As of March 31, 2014)
(# of shares) Classification No. of shares Note
No. of outstanding shares (A)
Common 147,299,337 - Preferred 22,833,427 -
Shares without voting rights (B)
Common 16,360,561 Article 369-2 of the Commercial Act "Treasury Shares"
- - -
Shares with voting rights eliminated by Articles of Incorporation (C)
Preferred 22,833,427 2,979,693 preferred treasury shares included
- - -
Shares with limited voting rights under relevant laws (D)
Common 12,479,184
Restricted by the Monopoly Regulation and Fair Trade Act: 10,622,814 shares held by Samsung Life Insurance & 1,856, 370 shares held by Samsung Fire & Marine Insurance
Common 27,393 Restricted by the Insurance Business Act: Some part of shares held by special account of Samsung Life Insurance
Shares with revived voting rights (E)
- - - - - -
Shares with voting rights (F = A - B - C - D + E)
Common 118,432,199 - Preferred - -
※ Among shares for which voting rights are restricted by relevant laws, some of 12,479,184 shares
(10,622,814 shares held by Samsung Life Insurance’s proprietary account and 1,856,370 shares held by Samsung Fire & Marine Insurance) whose voting rights are restricted by the Monopoly Regulation and Fair Trade Act can exercise voting rights in relation to appointment and dismissal of board members, revision of the Articles of Incorporation, etc.

□ Dividend - Dividends paid out in the recent three fiscal years
Classification 1Q 2014 2013 2012 Par value per share (won) 5,000 5,000 5,000 Net profit (million won) 4,968,366 17,929,520 17,398,530
EPS (won) 32,951 118,946 115,576 Total cash dividend (million won) - 2,156,969 1,206,562 Total stock dividend (million won) - - -
Dividend payout ratio (%) - 12.0 6.9
Cash dividend yield (%) Common - 1.0 0.5 Preferred - 1.4 0.1
Stock dividend yield (%) Common - - - Preferred - - -
Cash dividend per share (won) Common - 14,300 8,000 Preferred - 14,350 8,050
Stock dividend per share (share) Common - - - Preferred - - -
※Based on individual financial statements. ※EPS denotes to basic EPS. ※For information about calculation of basic EPS, refer to notes of 1Q 2014 audited financial
statements.

II. Business Operation
□ Summary of Financials by Business Division (Unit: million won, %)
Category Classification 1Q 2014 2013 2012
Amount Portion Amount Portion Amount Portion
CE
Total sales 27,840,111 22.0% 125,088,762 22.4% 117,897,781 24.6%
Internal sales 16,523,869 22.6% 74,757,247 22.7% 66,792,779 24.0%
Net sales 11,316,242 21.1% 50,331,515 22.0% 51,105,002 25.4%
Operating profit 191,669 2.3% 1,673,343 4.5% 2,324,036 8.0%
Total asset 43,823,331 13.1% 47,183,953 14.9% 38,947,252 14.1%
IM
Total sales 67,859,260 53.6% 299,161,654 53.6% 224,920,171 46.9%
Internal sales 35,417,246 48.5% 160,344,435 48.7% 119,075,388 42.8%
Net sales 32,442,014 60.4% 138,817,219 60.7% 105,844,783 52.6%
Operating profit 6,428,670 75.7% 24,957,741 67.8% 19,418,235 66.8%
Total asset 98,702,668 29.6% 86,132,881 27.1% 68,743,115 24.9%
DS
Semi-conductor
Total sales 17,136,048 13.5% 70,908,145 12.7% 66,976,623 14.0%
Internal sales 7,741,936 10.6% 33,471,566 10.2% 32,090,017 11.5%
Net sales 9,394,112 17.5% 37,436,579 16.4% 34,886,606 17.3%
Operating profit 1,949,175 23.0% 6,887,978 18.7% 4,173,730 14.4%
Total asset 80,054,132 24.0% 76,224,096 24.0% 67,136,914 24.4%
Display
Total sales 12,435,270 9.8% 61,294,886 11.0% 69,359,762 14.5%
Internal sales 6,338,518 8.7% 31,457,770 9.5% 36,360,406 13.1%
Net sales 6,096,752 11.4% 29,837,116 13.0% 32,999,356 16.4%
Operating profit △83,574 △1.0% 2,980,563 8.1% 3,214,750 11.1%
Total asset 46,791,002 14.0% 42,195,558 13.3% 41,429,074 15.0%
Total
Total sales 30,677,773 24.2% 134,394,781 24.1% 136,724,256 28.5%
Internal sales 15,121,314 20.7% 66,633,875 20.2% 68,436,962 24.6%
Net sales 15,556,459 29.0% 67,760,906 29.6% 68,287,294 34.0%
Operating profit 1,870,758 22.0% 10,000,665 27.2% 7,416,325 25.5%
Total asset 152,311,608 45.7% 145,872,686 45.9% 130,371,546 47.3%
※ Internal sales include sales within Business divisions. ※ Net sales include sales between Business divisions of the head office and overseas subsidiaries subject to consolidated financial statements.

□ Capex
Capex up to 1Q 2014 totaled KRW5.4 trillion, most of which was spent on future preparations, especially upgrading semiconductor and DP production lines. 2014 Capex level will be similar to the previous year, and will be managed in a flexible manner depending on the global business situations.
- Capex by business division
(Unit: 100 million won)
Business Purpose Period Investment in 1Q 2014 Amount
Semiconductor Establishment, addition, upgrade
Jan '14 ~ Mar '14
Buildings, facilities 33,358
DP Establishment, addition, upgrade
Jan '14 ~ Mar '14
Buildings, facilities 7,105
Others Others Jan '14 ~ Mar '14
Buildings, facilities 13,275
Total 53,738 □ Major Customers
As of 1Q 2014, major customers included Apple, Deutsche Telekom, Ingram Micro, Sprint, and Verizon. Sales to our five major customers accounted for about 12% of total sales.

III. Corporate Governance and Affiliates □ Affiliates 1. Names of the Group and Affiliates
- The name of the group: Samsung
As of end-1Q 2014, Samsung Group had a total of 74 domestic affiliates. Compared to end-2013, two new affiliate (Samsung Welstory, Samsung Card Customer Service) were added and three (Samsung Corning Precision Materials, Samsung SNS, Global Tech) were excluded. Among Samsung Group’s 74 affiliates, 17 including Samsung Electronics are listed, and 57 are unlisted.
(As of March 31, 2014)
No. of affiliates Name of affiliates
Listed 17
Samsung C&T, Cheil Industries, Samsung Electronics, Samsung SDI, Samsung Techwin, SEMCO, Samsung Heavy Industries, Samsung Card, Samsung Life Insurance, Hotel Shilla, Samsung Fire & Marine Insurance, Samsung Securities, Samsung Fine Chemicals, Samsung Engineering, S1, Cheil Worldwide, Credu
Unlisted 57
Samsung Everland, Samsung Petrochemical, Samsung SDS, Samsung General Chemicals, Samsung Total Petrochemicals, Samsung Lions, SERI, STECO, Samsung Thales, SEMES, Living Plaza, Samsung Electronics Service, Samsung Electronics Logitech, Hantok Chemicals, CVnet Corporation, Care Camp, Allat Corp., SECUI.com, Wealthia.com, Open Tide Korea, 365Homecare, Samsung Futures, Samsung Venture Investment Corporation, Samsung Asset Management, Saengbo, SD Flex, World Cyber Games, Samsung Claim Adjustment Service, Anycar Service, S-Core, Samsung Bluewings, HTSS, RAY, Songdo Land Mark City, S1 CRM, Open Hands, S-EnPol, Samsung Medison, Samsung Biologics, SMP, STM, Nuri Solution, Colombo Korea, Samsung Life Service, Miracom Inc., SU Materials, Natural 9, Samsung Display, Samsung Bioepis, Samsung Corning Advanced Glass , Daejung Offshore Wind Power Co., Ltd., SAMSUNG SRA Asset Management, Jung-ahm Wind Power, Sungkyunkwan University Dormitory, Samsung SGL Carbon Composite Materials Co., Ltd, Samsung Welstory, Samsung Card Customer Service
Total 74

2. Stake-Holdings among Affiliates and Subsidiaries [Domestic] (As of End-March, 2014) (%, based on common shares)
Investee
Samsung C&T
Cheil Ind.
SEC Samsung SDI
SEMCO
Samsung Heavy Ind.
Samsung Techwin
Hotel Shilla
Samsung Engin-eering
Cheil World-wide
Samsung Fine Chemi-cals
S1 Samsung SDS
Investor
Samsung C&T 4.1 4.3 7.8 12.6 5.6 17.1
Cheil Ind. 0.0 0.4 0.1 13.1 3.2 SEC 20.4 23.7 17.6 25.5 5.1 2.6 8.4 22.6 Samsung SDI 7.4 0.1 11.5 11 SEMCO 2.4 0.3 7.9 Samsung Ever-land 0.1 Samsung Heavy Ind. Samsung Techwin 0.1 Cheil World-wide 0.1
Samsung Fine Chemicals
Samsung General Chemicals
Samsung Petro chemical
Hotel Shilla 2.2 S1 SERI Samsung SDS Samsung Life Insurance
5.3 0.1 7.6 0.3 3.5 0.6 7.8 0.0 5.4
Samsung Fire & Marine Insurance
0.0 1.3 0.0 0.0 0.0 0.0 0.0 1.1 0.0 0.0 1.0
Samsung Securities 2.0 3.1 0.0 1.3 Samsung Card 4.7 1.3 3.0 1.9 Wealthia.com Samsung Medison Samsung Display Samsung Biologics SVIC #6
Sungkyun kwan University
Total 12.7 4.8 12.9 20.6 23.7 24.3 32.4 17.4 22.0 18.3 31.1 20.6 47.5

Investee
Samsung Ever-
land
Samsung General Chemi-cals
Samsung Total Petro-chem.
Samsung Petro-chem.
Hantok Chemi-cals
Samsung Lions SERI STE
CO SEMES
Samsung Electro-nics Service
World Cyber Games
Living Plaza
Samsung Blue Wings
Investor
Samsung C&T 1.5 38.7 27.3 7.5 1.0
Cheil Ind. 4.0 0.9 21.4 15.0 1.0
SEC 3.9 13.0 27.5 29.8 51.0 91.5 99.3 47.6 100.0 100.0
Samsung SDI 4.0 10.7 28.6
SEMCO 4.0 10.5 12.5 23.8 Samsung Ever-land 2.0
Samsung Heavy Ind. 1.0
Samsung Techwin 26.5
Cheil World-wide 0.6 3.0
Samsung Fine Chemicals
3.6 50.0
Samsung General Chemicals
50.0
Samsung Petro chemical
Hotel Shilla
S1 SERI Samsung SDS
Samsung Life Insurance
14.8
Samsung Fire & Marine Insurance
Samsung Securities
Samsung Card 5.0 Wealthia.com Samsung Medison
Samsung Display
Samsung Biologics
SVIC #6
Sungkyun kwan University
Total 18.5 95.0 50.0 61.6 50.0 67.5 100.0 51.0 91.5 99.3 47.6 100.0 100.0

Investee Samsun
g Electro-
nics Logitech
Samsung Display
RAY
Samsung Medison
Samsung Biolo-gics
Samsung Bioepis
Samsung Corning Advanced Glass
SU Materials
Samsung Thales Cvnet Care
Camp
Songdo Land Mark City
SD Flex
Investor
Samsung C&T 7.3 40.1 52.8 41.4
Cheil Ind. 50.0 SEC 100.0 84.8 68.5 44.5 Samsung SDI 15.2
SEMCO Samsung Ever-land 44.5
Samsung Heavy Ind.
Samsung Techwin 50.0
Cheil World-wide
Samsung Fine Chemicals
Samsung General Chemicals
Samsung Petro chemical
Hotel Shilla
S1 SERI Samsung SDS 9.4
Samsung Life Insurance
Samsung Fire & Marine Insurance
Samsung Securities
Samsung Card Wealthia.com Samsung Medison
Samsung Display 50.0 50.0
Samsung Biologics 88.2
SVIC #6 64.6
Sungkyun kwan University
Total 100.0 100.0 64.6 68.5 96.3 88.2 50.0 50.0 50.0 49.5 52.8 41.4 50.0

Investee
Colombo Korea
Natural 9
Samsung Welstory
Daejung Offshore Wind Power
Jung-ahm Wind Power
SECUI. com HTSS S1
CRM S-EnPol SMP STM Credu Wealthia. com
Investor
Samsung C&T
Cheil Ind. SEC Samsung SDI 13.8
SEMCO Samsung Ever-land 100.0 51.0 100.0 8.7 21.0
Samsung Heavy Ind. 50.1 50.0
Samsung Techwin
Cheil World-wide
Samsung Fine Chemicals
100.0 50.0 50.0
Samsung General Chemicals
Samsung Petro chemical
Hotel Shilla
S1 52.2 100.0 93.4 SERI 15.2 5.2 Samsung SDS 4.3 47.2 10.5
Samsung Life Insurance
0
Samsung Fire & Marine Insurance
Samsung Securities 1.6
Samsung Card 3.3 Wealthia.com Samsung Medison
Samsung Display
Samsung Biologics
SVIC #6
Sungkyun kwan University
Total 100.0 51.0 100.0 50.1 50.0 65.2 100.0 93.4 100.0 50.0 63.8 62.4 41.5

Investee
Open Tide
Korea S-Core Open
Hands Mirac-om Inc.
Nuri Solution
Samsung SGL Carbon Composite Materials
Sungkyunkwan University Dormitory
Samsung Life Insurance
Saengbo
365 Home-care
Samsung Life Service
Samsung SRA Asset Mana-gement
Investor
Samsung C&T
Cheil Ind. SEC Samsung SDI
SEMCO 0.6 Samsung Ever-land 19.3
Samsung Heavy Ind.
Samsung Techwin
Cheil World-wide 10.4 0.2
Samsung Fine Chemicals
0.5
Samsung General Chemicals
Samsung Petro chemical
50.0
Hotel Shilla
S1 19.2 SERI Samsung SDS 72.6 94.8 100.0 100.0 100.0 0.4 28.8
Samsung Life Insurance
50.0 99.8 100.0
Samsung Fire & Marine Insurance
Samsung Securities
Samsung Card Wealthia.com 14.4 Samsung Medison
Samsung Display
Samsung Biologics
SVIC #6
Sungkyun kwan University
100.0
Total 83.0 94.8 100.0 100.0 100.0 50.0 100.0 21.0 50.0 62.5 99.8 100.0
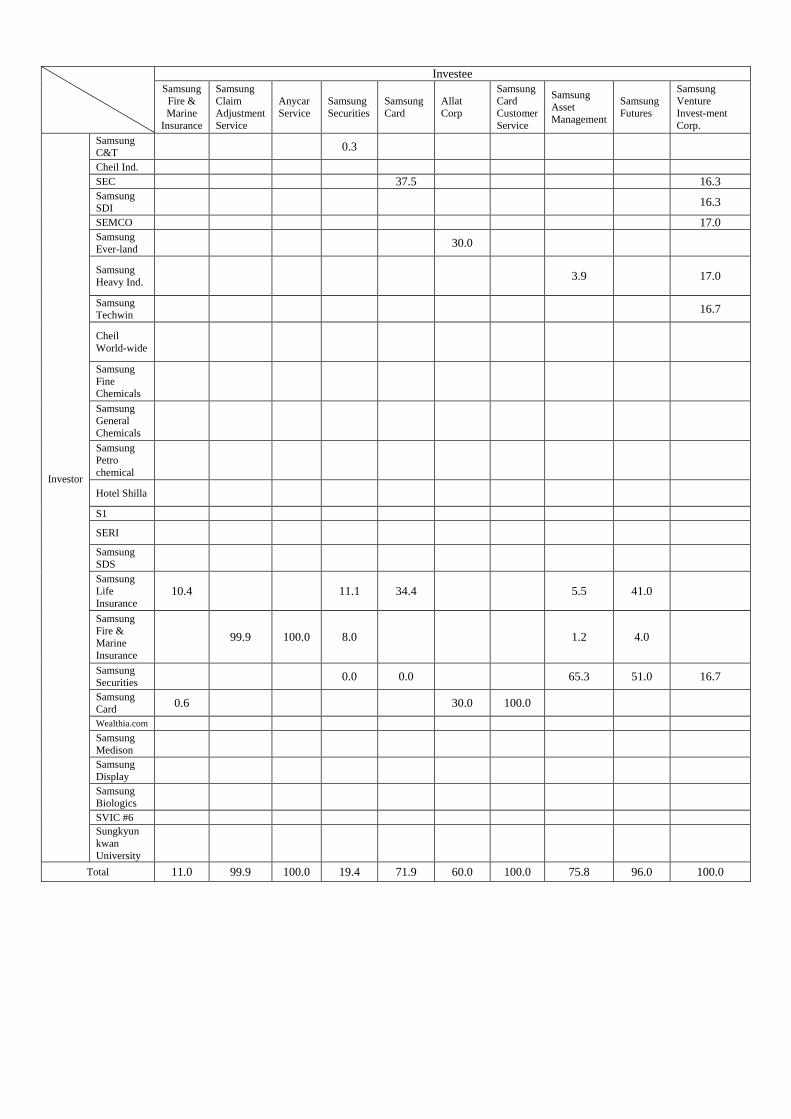
Investee Samsung
Fire & Marine
Insurance
Samsung Claim Adjustment Service
Anycar Service
Samsung Securities
Samsung Card
Allat Corp
Samsung Card Customer Service
Samsung Asset Management
Samsung Futures
Samsung Venture Invest-ment Corp.
Investor
Samsung C&T 0.3
Cheil Ind. SEC 37.5 16.3 Samsung SDI 16.3
SEMCO 17.0 Samsung Ever-land 30.0
Samsung Heavy Ind. 3.9 17.0
Samsung Techwin 16.7
Cheil World-wide
Samsung Fine Chemicals
Samsung General Chemicals
Samsung Petro chemical
Hotel Shilla
S1 SERI Samsung SDS
Samsung Life Insurance
10.4 11.1 34.4 5.5 41.0
Samsung Fire & Marine Insurance
99.9 100.0 8.0 1.2 4.0
Samsung Securities 0.0 0.0 65.3 51.0 16.7
Samsung Card 0.6 30.0 100.0 Wealthia.com Samsung Medison
Samsung Display
Samsung Biologics
SVIC #6
Sungkyun kwan University
Total 11.0 99.9 100.0 19.4 71.9 60.0 100.0 75.8 96.0 100.0

[Overseas] (As of end-March, 2014) (%, based on common shares)
Investor Investee Stake
Samsung C&T MYODO METAL CO., LTD. 100.0
Samsung C&T Samsung C&T Japan Corporation 100.0
Samsung C&T Samsung C&T America Inc. 100.0
Samsung C&T Samsung Finance Corporation. 80.0
Samsung C&T Samsung E&C America, INC. 100.0
Samsung C&T SAMSUNG OIL & GAS USA CORP 90.0
Samsung C&T Samsung Renewable Energy Inc. 100.0
Samsung C&T SCNT Power Norte S. De R.L. de C.V. 100.0
Samsung C&T QSSC, S.A. de C.V. 60.0
Samsung C&T Samsung C&T Oil & Gas Parallel 100.0
Samsung C&T Samsung C&T Automation Inc. 70.0
Samsung C&T Samsung C&T Canada Ltd. 100.0
Samsung C&T Samsung C&T Deutchland GmbH 100.0
Samsung C&T Samsung C&T U.K. Ltd. 100.0
Samsung C&T Xiod Distribution 25.0
Samsung C&T Samsung C&T France S.A.S 100.0
Samsung C&T Samsung C&T ECUK Limited 100.0
Samsung C&T Whessoe Project Limited. 100.0
Samsung C&T SCNT Investment Atlantic SPRL 100.0
Samsung C&T POSS-SLPC, s.r.o 50.0
Samsung C&T Solluce Romania 1 B.V. 80.0
Samsung C&T SAM investment Manzanilo.B.V 53.3
Samsung C&T Solluce Slovenia 1 B.V. 80.0
Samsung C&T Ecosolar OOD 100.0
Samsung C&T Ecoenergy Solar OOD 100.0
Samsung C&T Agirlplam EOOD 100.0
Samsung C&T Fishtrade EOOD 100.0
Samsung C&T Manageprojekt EOOD 100.0
Samsung C&T Solar Park EOOD 100.0
Samsung C&T Veselinovo Energy OOD 100.0
Samsung C&T Samsung C&T Construction Hunga 100.0
Samsung C&T Samsung Engineering & Construction(M) SDN.BHD. 100.0
Samsung C&T Samsung C&T Malaysia SDN. BHD 100.0

Samsung C&T Erdsam Co., Ltd. 100.0
Samsung C&T Samsung Chemtech 51.7
Samsung C&T S-print Inc 40.0
Samsung C&T Cassava Investment Korea Pte. Ltd. 29.7
Samsung C&T P.T. Samsung Development 100.0
Samsung C&T Samsung Development (Thailand) Co., Ltd. 33.0
Samsung C&T Samsung C&T Thailand Co., Ltd 44.0
Samsung C&T Cheil Holding Inc. 40.0
Samsung C&T Samsung Const. Co. Phils.,Inc. 25.0
Samsung C&T Samsung Design Philippines Inc 100.0
Samsung C&T Samsung Oil & Gas(Timor Sea 06-102) Ltd. 100.0
Samsung C&T Samsugn Oil & Gas Australia PTY. LTD 100.0
Samsung C&T PT. INSAM BATUBARA ENERGY 95.0
Samsung C&T Samsung C&T India Pte., Ltd. 100.0
Samsung C&T Samsung C&T Corporation India 100.0
Samsung C&T Malaysia Samsung Steel Center Sdn.Bhd 70.0
Samsung C&T Samsung C&T Singapore Pte., Ltd. 100.0
Samsung C&T S&G Biofuel PTE.LTD 50.5
Samsung C&T SAMSUNG C&T Mongolia LLC. 70.0
Samsung C&T Samsung C&T Eng.&Const. Mogolia 100.0
Samsung C&T SAMSUNG C&T HONGKONG Ltd. 100.0
Samsung C&T Shunde Shengpu Processing Center Co. Ltd 51.6
Samsung C&T Samsung C&T Taiwan Co., Ltd. 100.0
Samsung C&T Samsung Precision Stainless Steel(pinghu) Co.,Ltd. 55.0
Samsung C&T Samsung E&C (Shanghai) Co.,Ltd. 100.0
Samsung C&T Suzhou Shengpu Processing Center Co. Ltd 50.0
Samsung C&T Samsung Nigeria Co., Ltd. 99.9
Samsung C&T LOBINAVE - Estaleiro Naval do Lobito, Limitada 40.0
Samsung C&T SAMSUNG C&T CORPORATION SAUDI ARABIA 100.0
Samsung C&T Samsung C&T Chile Copper SpA 100.0
Samsung C&T Samsung C&T DO Brasil Participacoes LTDA 100.0
Samsung C&T Samsung Corporation Rus LLC 100.0
Samsung C&T KSI LLP 25.0
Samsung C&T JSC BALKHASH THERMAL POWER PLA 75.0
Samsung C&T Samsung SDI America, Inc. 8.3
Samsung C&T Samsung SDI (Malaysia) SDN. BHD. 6.4
Samsung C&T Samsung SDI (Hong Kong) Ltd. 2.4

Samsung C&T Samsung SDI Brasil Ltda. 0.0
Samsung C&T Beijing Samsung Real Estate Co., Ltd 10.0
Samsung C&T America Inc. Meadowland Distribution 100.0
Samsung C&T America Inc. SAMSUNG OIL & GAS USA CORP 10.0
Samsung C&T America Inc. Samsung Green repower, LLC 100.0
Samsung C&T America Inc. Samsung Solar Construction Inc. 100.0
Samsung C&T America Inc. QSSC, S.A. de C.V. 20.0
Samsung C&T America Inc. Samsung C&T Automation Inc. 30.0
Samsung C&T America Inc. S-print Inc 24.0
Samsung E&C America, INC Samsung E&C RADIUS, INC. 100.0
Samsung Renewable Energy Inc. SP Armow Wind Ontario LP Inc 50.0
Samsung Renewable Energy Inc. SRE GRW EPC GP Inc. 100.0
Samsung Renewable Energy Inc. SRE GRW EPC LP 100.0
Samsung Renewable Energy Inc. SRE SKW EPC GP Inc. 100.0
Samsung Renewable Energy Inc. SRE SKW EPC LP 100.0
Samsung Renewable Energy Inc. SRE GRW LP Holdings LP 100.0
Samsung Renewable Energy Inc. SRE SKW LP Holdings LP 100.0
Samsung Renewable Energy Inc. SRE WIND PA GP INC. 100.0
Samsung Renewable Energy Inc. SRE WIND PA LP 100.0
Samsung Renewable Energy Inc. SRE GRS Holdings GP Inc. 100.0
Samsung Renewable Energy Inc. SRE GRS Holdings LP 100.0
Samsung Renewable Energy Inc. SRE K2 EPC GP Inc. 100.0
Samsung Renewable Energy Inc. SRE K2 EPC LP 100.0
Samsung Renewable Energy Inc. SRE K2 LP HOLDINGS LP 100.0
Samsung Renewable Energy Inc. SRE KS HOLDINGS GP INC. 100.0
Samsung Renewable Energy Inc. SRE KS HOLDINGS LP 100.0
Samsung Renewable Energy Inc. SOUTHGATE SOLAR GP INC. 100.0
Samsung Renewable Energy Inc. SOUTHGATE SOLAR LP 100.0
Samsung Renewable Energy Inc. WINDSOR SOLAR GP INC. 100.0
Samsung Renewable Energy Inc. WINDSOR SOLAR LP 100.0
Samsung Renewable Energy Inc. SRE Wind GP Holding Inc. 100.0
Samsung Renewable Energy Inc. SP Ontario Wind Development LP 50.0
Samsung Renewable Energy Inc. SP Southgate Wind LP 50.0
Samsung Green repower, LLC SOLAR PROJECTS SOLUTIONS,LLC 66.0
Samsung Green repower, LLC SPS Atwell Island, LLC 100.0
Kingston Solar GP Inc. Kingston Solar LP Inc. 0.0
K2 Wind Ontario Inc. K2 Wind Ontario LP 0.0

SP Armow Wind Ontario GP Inc SP Armow Wind Ontario LP 0.0
Samsung C&T Oil & Gas Parallel PLL Holdings LLC 83.6
Samsung C&T Oil & Gas Parallel PLL E&P LLC 90.0
SRE GRW EPC GP Inc. SRE GRW EPC LP 0.0
SRE SKW EPC GP Inc. SRE SKW EPC LP 0.0
PLL Holdings LLC Parallel Petroleum LLC 61.0
SRE GRW LP Holdings LP Grand Renewable Wind LP Inc. 44.5
SRE SKW LP Holdings LP South Kent Wind LP Inc. 50.0
SRE WIND PA GP INC. SRE WIND PA LP 0.0
SRE GRS Holdings GP Inc. Grand Renewable Solar GP Inc. 50.0
SRE GRS Holdings GP Inc. SRE GRS Holdings LP 0.0
SRE K2 EPC GP Inc. SRE K2 EPC LP 0.0
SRE K2 LP HOLDINGS LP K2 Wind Ontario LP 33.3
SRE KS HOLDINGS GP INC. Kingston Solar GP Inc. 100.0
SRE KS HOLDINGS GP INC. SRE KS HOLDINGS LP 0.0
SRE KS HOLDINGS LP Kingston Solar LP Inc. 100.0
SOUTHGATE SOLAR GP INC. SOUTHGATE SOLAR LP 0.0
SRE Wind GP Holding Inc. K2 Wind Ontario Inc. 50.0
SRE Wind GP Holding Inc. SP Armow Wind Ontario GP Inc 50.0
SRE Wind GP Holding Inc. SP Southgate Wind GP 50.0
SRE Wind GP Holding Inc. SRE GRW LP Holdings LP 0.0
SRE Wind GP Holding Inc. SRE SKW LP Holdings LP 0.0
SRE Wind GP Holding Inc. SRE K2 LP HOLDINGS LP 0.0
SRE Wind GP Holding Inc. SP Ontario Wind Development GP 50.0
SRE Wind GP Holding Inc. South Kent Wind GP Inc. 50.0
SRE Wind GP Holding Inc. Grand Renewable Wind GP Inc. 50.0
SP Ontario Wind Development GP SP Ontario Wind Development LP 0.0
South Kent Wind GP Inc. South Kent Wind LP Inc. 0.0
Grand Renewable Wind GP Inc. Grand Renewable Wind LP Inc. 0.0
Samsung C&T Deutchland GmbH Samsung C&T Italia S.A.R.L 100.0
Samsung C&T Deutchland GmbH SCNT Investment Atlantic SPRL 0.0
Samsung C&T Deutchland GmbH POSS-SLPC, s.r.o 20.0
Samsung C&T Deutchland GmbH Solluce Romania 1 B.V. 20.0
Samsung C&T Deutchland GmbH Solluce Slovenia 1 B.V. 20.0
Samsung C&T Deutchland GmbH S.C. Otelinox S.A 94.3
Samsung C&T Deutchland GmbH KSI LLP 25.0
Samsung C&T U.K. Ltd. Xiod Distribution 75.0
Samsung C&T U.K. Ltd. Samsung Nigeria Co., Ltd. 0.1

Samsung C&T France S.A.S Comptoir Des Produits Inoxydables S.A.S. 12.5
Solluce Romania 1 B.V. LJG GREEN SOURCE ENERGY ALPHA 78.0
SAM investment Manzanilo.B.V Terminal KMS de GNL S. de R.L de C.V 37.5
Solluce Slovenia 1 B.V. ZE Solar 1 D.O.O. 70.0 Samsung Engineering & Construction(M) SDN.BHD. SS KUKDONG JASATERA J/V 70.0
Cassava Investment Korea Pte. PT. Cahaya Borneo Sukses Agros 49.0
Cassava Investment Korea Pte. PT. Cassava Borneo Sukses Plan 49.0
Samsung C&T Thailand Co., Ltd Samsung Development (Thailand) 67.0
Cheil Holding Inc. Samsung Const. Co. Phils.,Inc. 75.0
Samsung C&T Singapore Pte., Ltd. Samsung Chemtech 48.3
Samsung C&T Singapore Pte., Ltd. S-print Inc 16.0
Samsung C&T Singapore Pte., Ltd. Cassava Investment Korea Pte. Ltd. 12.7
Samsung C&T Singapore Pte., Ltd. PT. INSAM BATUBARA ENERGY 5.0
Samsung C&T Singapore Pte., Ltd. Malaysia Samsung Steel Center Sdn.Bhd 30.0
Samsung C&T Singapore Pte., Ltd. S&G Biofuel PTE.LTD 12.6
S&G Biofuel PTE.LTD PT. Gandaerah Hendana 95.0
S&G Biofuel PTE.LTD PT. Inecda 95.0
SAMSUNG C&T HONGKONG Ltd. Samsung C&T Thailand Co., Ltd 13.2
SAMSUNG C&T HONGKONG Ltd. Tianjin International Trade Co. Ltd 100.0
SAMSUNG C&T HONGKONG Ltd. Samsung Trading (Shanghai Pu Dong New Area) Co., Ltd. 100.0
SAMSUNG C&T HONGKONG Ltd. Karson Industrial Co., Ltd. 100.0
SAMSUNG C&T HONGKONG Ltd. Samsung Trading (Shenzhen) Co., Ltd. 100.0
SAMSUNG C&T HONGKONG Ltd. Samsung Precision Stainless St 45.0
SAMSUNG C&T HONGKONG Ltd. Samsung (China) Logistics Ltd. 100.0
SAMSUNG C&T HONGKONG Ltd. Samsung Corporation (Gaungzhou) Limited. 100.0
SAMSUNG C&T HONGKONG Ltd. Suzhou Shengpu Processing Center Co. Ltd 20.0
Samsung (China) Logistics Ltd. Samsung Corporation (Tianjin) Limited. 100.0
Samsung (China) Logistics Ltd. Shenzhen Samsung Shipping Container Line Co., Ltd. 100.0
Samsung C&T Chile Copper SpA Pampa Camarones S.A. 46.5
S.C. Otelinox S.A Comptoir Des Produits Inoxydables S.A.S. 87.5
Samsung Electronics Samsung Japan Corporation 100.0
Samsung Electronics Samsung R&D Institute Japan Co. Ltd 100.0
Samsung Electronics Samsung Electronics America Inc. 100.0
Samsung Electronics Samsung Electronics Canada Inc. 100.0
Samsung Electronics Samsung Electronics Mexico S.A. De C.V. 63.6

Samsung Electronics Nvelo.Inc 100.0
Samsung Electronics Samsung Electronics (UK) Ltd. 100.0
Samsung Electronics Samsung Electronics(London) Ltd. 100.0
Samsung Electronics Samsung Electronics Holding GmbH 100.0
Samsung Electronics Samsung Electronics Iberia, S.A. 100.0
Samsung Electronics Samsung Electronics France S.A.S 100.0
Samsung Electronics Samsung Electronics Hungarian RT. 100.0
Samsung Electronics Samsung Electronics Italia S.P.A. 100.0
Samsung Electronics Samsung Electronics Europe Logistics B.V. 100.0
Samsung Electronics Samsung Electronics Benelux B.V. 100.0
Samsung Electronics Samsung Electronics Overseas B.V. 100.0
Samsung Electronics Samsung Electronics Polska, SP.Zo.O 100.0
Samsung Electronics Samsung Electronics Portuguesa S.A. 100.0
Samsung Electronics Samsung Electronics Nordic Aktiebolag 100.0
Samsung Electronics Samsung Electronics Austria Gmbh 100.0
Samsung Electronics Samsung Electronics Slovakia s.r.o 55.7
Samsung Electronics Samsung Electronics Europe Holding Cooperatief U.A. 100.0
Samsung Electronics Samsung Electronics Display (M) Sdn Bhd 75.0
Samsung Electronics Samsung Electronics (M) Sdn. Bhd. 100.0
Samsung Electronics Samsung Vina Electronics Co., Ltd. 100.0
Samsung Electronics Samsung Asia Private Ltd. 100.0
Samsung Electronics Samsung India Electronics Private Ltd 100.0
Samsung Electronics Samsung R&D Institute India-Bangalore Private Limited 100.0
Samsung Electronics Samsung Electronics Australia Pty. Ltd. 100.0
Samsung Electronics PT Samsung Electronics Indonesia 100.0
Samsung Electronics Thai-Samsung Electronics Co. Ltd. 91.8
Samsung Electronics Samsung Malaysia Electronics (SME) Sdn. Bhd. 100.0
Samsung Electronics Samsung Electronics Hong Kong Co., Ltd. 100.0
Samsung Electronics Suzhou Samsung Electronics Co., Ltd 69.1
Samsung Electronics Samsung (CHINA) Investment Co.,Ltd. 100.0
Samsung Electronics Samsung Electronics Suzhou Semiconductor Co., Ltd. 100.0
Samsung Electronics Samsung Electronics (Shandong) Digital Printing Co., Ltd. 87.1
Samsung Electronics Samsung Electronics Huizhou Co., Ltd. 89.6
Samsung Electronics Tianjin Samsung Electronics Co., Ltd. 48.2
Samsung Electronics Samsung Electronics Taiwan Co., Ltd. 100.0
Samsung Electronics Tianjin Samsung Telecom Technology Co., Ltd. 90.0
Samsung Electronics Shanghai Samsung Semiconductor Co., Ltd. 100.0

Samsung Electronics Samsung Electronics Suzhou Computer Co.,Lcd 73.7
Samsung Electronics Shenzhen Samsung Electronics Telecommunication Co., Ltd. 95.0
Samsung Electronics Samsung Electronic Shanghai Telecommunications Co., Ltd. 100.0
Samsung Electronics Samsung Semiconductor China R&D.,Ltd. 100.0
Samsung Electronics Samsung (China) Semiconductor 100.0
Samsung Electronics Samsung Electronics Hainan Fiberoptics Co., Ltd 100.0
Samsung Electronics Samsung Gulf Electronics Co., Ltd. 100.0
Samsung Electronics Samsung Electronics Egypt 0.1
Samsung Electronics Samsung Electronics South Africa (Pty) Ltd. 100.0
Samsung Electronics Samsung Electronics Latinoamerica (Zona Libre) 100.0
Samsung Electronics Samsung Electronica Da Amazonia LTDA. 87.0
Samsung Electronics Samsung Electronics Argentina S.A. 98.0
Samsung Electronics Samsung Electronics Chile Limitada(Ltda) 4.1
Samsung Electronics Samsung Electronics Rus Company LLC 100.0
Samsung Electronics Samsung Electronics Rus Kaluga LLC 100.0
Samsung Electronics Samsung Russia Service Centre LLC 100.0
Samsung Electronics Samsung SDI Brasil Ltda. 0.1
Samsung Electronics Tianjin Samsung LED Co.,LTD 100.0
Samsung Electronics Tianjin Samsung Opto-Electronics GmbH 82.0
Samsung Bioepis SAMSUNG BIOEPIS UK LIMITED 100.0
Samsung Display Intellectual Keystone Technology LLC. 29.0
Samsung Display Samsung Display Slovakia s.r.o 100.0
Samsung Display Samsung Display Suzhou Co., Ltd. 100.0
Samsung Display Samsung Suzhou LCD 60.0
Samsung Display Samsung Display Dongguan 100.0
Samsung Display Samsung Display Tianjin 95.0
Samsung Display Novaled GmbH 9.9
SEMES SEMES America,Inc. 100.0
SEMES SEMES (XIAN) Co., Ltd. 100.0
Samsung Medison SonAce Deutschland GmbH 100.0
Samsung Medison Samsung Medison Europe B.V. 100.0
Samsung Medison Samsung Medison India Private LTD. 100.0
Samsung Medison Samsung Medison Shanghai Medical Instrument Co., Ltd 100.0
Samsung Medison Medison Medical Equipment Shanghai Co., Ltd. 100.0
Samsung Electronics America In Nexus DX, Inc. 100.0
Samsung Electronics America In NeuroLogica Corp. 100.0

Samsung Electronics America Inc. Samsung Receivables Corporation 38.1
Samsung Electronics America Inc. Samsung Semiconductor Inc. 100.0
Samsung Electronics America Inc. Intellectual Keystone Technology LLC. 17.0
Samsung Electronics America Inc. Samsung R&D Institute America 100.0
Samsung Electronics America Inc. Samsung International Inc. 100.0
Samsung Electronics America Inc. Samsung Telecommunications America LLC. 100.0
Nexus DX, Inc. Nanogen Recognomics GmbH 60.0
Samsung Semiconductor Inc. Grandis Inc. 100.0
Samsung Semiconductor Inc. Samsung Austin Semiconductor LLC. 100.0
Samsung International Inc. Samsung Mexicana S.A. De C.V. 100.0
Samsung Telecommunications America LLC. Samsung Receivables Corporation 61.9
Samsung Electronics Mexico S.A Samsung Electronics Digital Appliance Mexico, SA de CV 100.0
Samsung Electronics (UK) Ltd. Samsung Semiconductor Europe Limited 100.0
Samsung Electronics Holding GmbH Samsung Semiconductor Europe GmbH 100.0
Samsung Electronics Holding GmbH Samsung Electronics GmbH 100.0
Samsung Electronics Hungarian RT. Samsung Electronics Czech and Slovak s.r.o. 30.0
Samsung Electronics Hungarian RT. Samsung Electronics Slovakia s.r.o 44.3
Samsung Electronics Benelux B.V. Samsung Electronics Mexico S.A. De C.V. 36.4
Samsung Electronics Benelux B.V. SAMSUNG ELECTRONICS BALTICS SI 100.0
Samsung Electronics Benelux B.V. Samsung Electronics West Africa 100.0
Samsung Electronics Benelux B.V. Samsung Electronics East Africa 100.0
Samsung Electronics Benelux B.V. Samsung Electronics Egypt S.A.E 99.9
Samsung Electronics Benelux B.V. Samsung Electronics Israel Ltd. 100.0
Samsung Electronics Benelux B.V. Samsung Electronics Tunisia S.A.R.L 99.0
Samsung Electronics Benelux B.V. Samsung Electronics Pakistan 100.0
Samsung Electronics Benelux B.V. Samsung Electronics Turkey 100.0
Samsung Electronics Benelux B.V. Samsung Semiconductor Israel R&D Center,LTD. 100.0
Samsung Electronics Benelux B.V. Samsung Electronics Levant Co.,Ltd 100.0
Samsung Electronics Benelux B.V. Samsung Electronics Morocco SARLAU 100.0
Samsung Electronics Benelux B.V. Samsung Electronics Venezuela 100.0
Samsung Electronics Benelux B.V. Samsung Electronica Da Amazonia LTDA. 13.0
Samsung Electronics Benelux B.V. Samsung Electronics Chile Limitada(Ltda) 95.9
Samsung Electronics Benelux B.V. Samsung Electronics Peru S.A.C. 100.0
Samsung Electronics Benelux B.V. Samsung Electronics Russia LLC 100.0
Samsung Electronics Benelux B.V. Samsung Electronics Ukraine LLC 100.0
Samsung Electronics Benelux B.V. Samsung Electronics Ukraine Company LLC 100.0
Samsung Electronics Benelux B.V. Samsung R&D Institute Rus LLC 100.0
Samsung Electronics Benelux B.V. Samsung Electronics Kazakhstan LLP 100.0

Samsung Electronics Benelux B.V. Samsung Electronics KZ and Central Asia LLP 100.0
Samsung Electronics Austria GmbH Samsung Electronics Switzerland GmbH 100.0
Samsung Electronics Europe Holding Cooperatief U.A. Samsung Electronics Czech and Slovak s.r.o. 70.0
Samsung Electronics Europe Holding Cooperatief U.A. Samsung Electronics Romania LLC 100.0
Samsung Electronics Europe Holding Cooperatief U.A.
Samsung Electronics Poland Manufacturing SP.Zo.o 100.0
Samsung Electronics Europe Holding Cooperatief U.A. Samsung Electronics Greece S.A. 100.0
Samsung Electronics Europe Holding Cooperatief U.A. Samsung Nanoradio Design Centre 100.0
Samsung Electronics Europe Holding Cooperatief U.A. Samsung Denmark Research Centre 100.0
Samsung Electronics Europe Holding Cooperatief U.A. Samsung France Research Center 100.0
Samsung Electronics Europe Holding Cooperatief U.A. Samsung Cambridge Solution Cen 100.0
Samsung Electronics Europe Holding Cooperatief U.A. Novaled GmbH 40.0
Samsung Nanoradio Design Center Nanoradio Hellas AE 100.0
Samsung Electronics Display (M) Sdn Bhd Tianjin Samsung Electronics Co., Ltd. 2.2
Samsung Asia Private Ltd. Samsung Electronics Japan Co., 100.0
Samsung Asia Private Ltd. Samsung Electronics Display (M) Sdn. Bhd. 25.0
Samsung Asia Private Ltd. Samsung Electronics New Zealand Limited 100.0
Samsung Asia Private Ltd. Samsung Electronics Philippine 100.0
Samsung Asia Private Ltd. Samsung R&D Institute BanglaDesh 100.0
Samsung Asia Private Ltd. Samsung Electronics Vietnam Co., Ltd. 100.0
Samsung Asia Private Ltd. Samsung Telecommunications Malaysia Sbn. Bhd. 100.0
Samsung Asia Private Ltd. Samsung Electronics Vietnam THAINGUYEN Co., Ltd. 100.0
Samsung Asia Private Ltd. Samsung SDI (Malaysia) SDN. BH 25.0
Samsung Asia Private Ltd. Samsung Electro-Mechanics Thailand 25.0
Samsung Asia Private Ltd. iMarket Asia Co., Ltd. 11.3
PT Samsung Electronics Indonesia P.T. Samsung Telecommunications Indonesia 99.0
Samsung Electronics Hong Kong iMarket Asia Co., Ltd. 11.3
Suzhou Samsung Electronics Co., Ltd Samsung Suzhou Electronics Export Co.,Ltd 100.0
Samsung (CHINA) Investment Co.,Ltd. Suzhou Samsung Electronics Co., Ltd 19.2
Samsung (CHINA) Investment Co.,Ltd. Samsung Mobile R&D Center China-Guangzhou 100.0
Samsung (CHINA) Investment Co.,Ltd. Samsung Tianjin Mobile Development Center 100.0
Samsung (CHINA) Investment Co.,Ltd. Samsung Network R&D Center China-Shenzhen 100.0
Samsung (CHINA) Investment Co.,Ltd Samsung R&D Institute China-Xian 100.0
Samsung (CHINA) Investment Co.,Ltd. Samsung Electronics (Shandong) Digital Printing Co., Ltd. 12.9
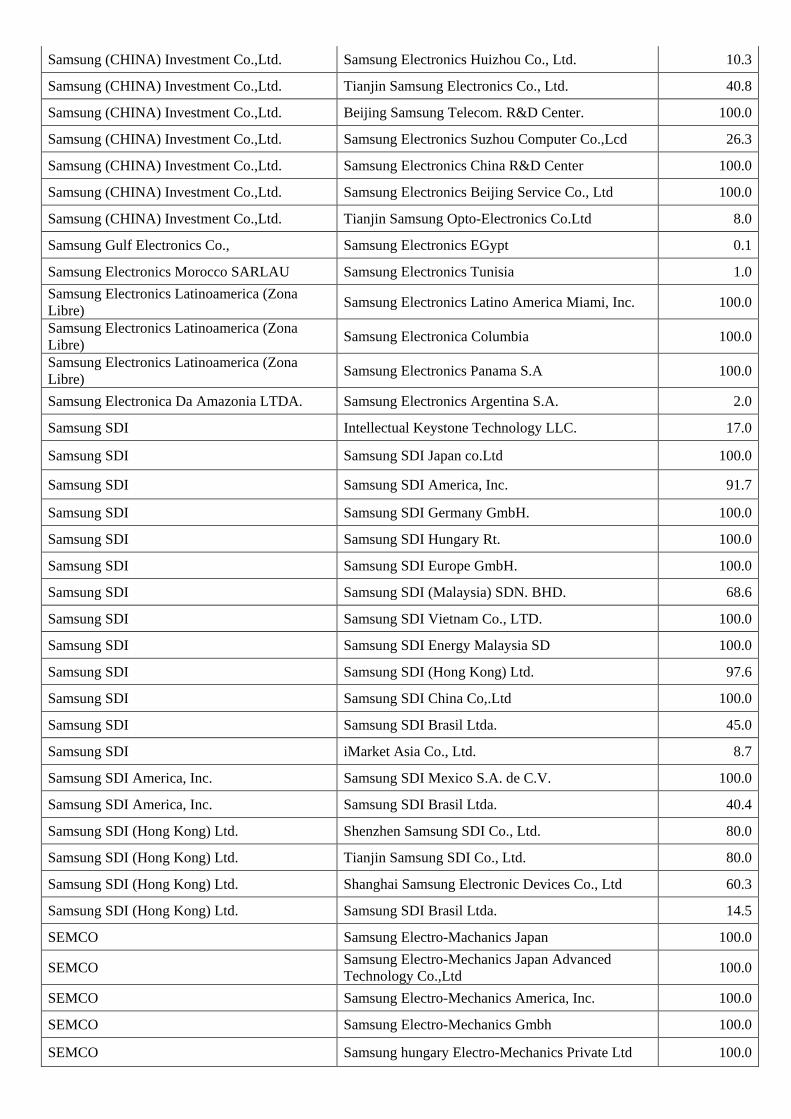
Samsung (CHINA) Investment Co.,Ltd. Samsung Electronics Huizhou Co., Ltd. 10.3
Samsung (CHINA) Investment Co.,Ltd. Tianjin Samsung Electronics Co., Ltd. 40.8
Samsung (CHINA) Investment Co.,Ltd. Beijing Samsung Telecom. R&D Center. 100.0
Samsung (CHINA) Investment Co.,Ltd. Samsung Electronics Suzhou Computer Co.,Lcd 26.3
Samsung (CHINA) Investment Co.,Ltd. Samsung Electronics China R&D Center 100.0
Samsung (CHINA) Investment Co.,Ltd. Samsung Electronics Beijing Service Co., Ltd 100.0
Samsung (CHINA) Investment Co.,Ltd. Tianjin Samsung Opto-Electronics Co.Ltd 8.0
Samsung Gulf Electronics Co., Samsung Electronics EGypt 0.1
Samsung Electronics Morocco SARLAU Samsung Electronics Tunisia 1.0 Samsung Electronics Latinoamerica (Zona Libre) Samsung Electronics Latino America Miami, Inc. 100.0
Samsung Electronics Latinoamerica (Zona Libre) Samsung Electronica Columbia 100.0
Samsung Electronics Latinoamerica (Zona Libre) Samsung Electronics Panama S.A 100.0
Samsung Electronica Da Amazonia LTDA. Samsung Electronics Argentina S.A. 2.0
Samsung SDI Intellectual Keystone Technology LLC. 17.0
Samsung SDI Samsung SDI Japan co.Ltd 100.0
Samsung SDI Samsung SDI America, Inc. 91.7
Samsung SDI Samsung SDI Germany GmbH. 100.0
Samsung SDI Samsung SDI Hungary Rt. 100.0
Samsung SDI Samsung SDI Europe GmbH. 100.0
Samsung SDI Samsung SDI (Malaysia) SDN. BHD. 68.6
Samsung SDI Samsung SDI Vietnam Co., LTD. 100.0
Samsung SDI Samsung SDI Energy Malaysia SD 100.0
Samsung SDI Samsung SDI (Hong Kong) Ltd. 97.6
Samsung SDI Samsung SDI China Co,.Ltd 100.0
Samsung SDI Samsung SDI Brasil Ltda. 45.0
Samsung SDI iMarket Asia Co., Ltd. 8.7
Samsung SDI America, Inc. Samsung SDI Mexico S.A. de C.V. 100.0
Samsung SDI America, Inc. Samsung SDI Brasil Ltda. 40.4
Samsung SDI (Hong Kong) Ltd. Shenzhen Samsung SDI Co., Ltd. 80.0
Samsung SDI (Hong Kong) Ltd. Tianjin Samsung SDI Co., Ltd. 80.0
Samsung SDI (Hong Kong) Ltd. Shanghai Samsung Electronic Devices Co., Ltd 60.3
Samsung SDI (Hong Kong) Ltd. Samsung SDI Brasil Ltda. 14.5
SEMCO Samsung Electro-Machanics Japan 100.0
SEMCO Samsung Electro-Mechanics Japan Advanced Technology Co.,Ltd 100.0
SEMCO Samsung Electro-Mechanics America, Inc. 100.0
SEMCO Samsung Electro-Mechanics Gmbh 100.0
SEMCO Samsung hungary Electro-Mechanics Private Ltd 100.0

Liability Company
SEMCO Samsung Electro-Mechanics Thailand Co., Ltd. 75.0
SEMCO Samsung Electro-Mechanics Philippines, Corp. 100.0
SEMCO Calamba Premier Realty Corporation. 39.8
SEMCO Samsung Electro-Mechanics Pte. 100.0
SEMCO Samsung Electro Mechanics Vietnam Co., Ltd 100.0
SEMCO Dongguan Samsung Electro Mechanics Co., Ltd. 100.0
SEMCO Tianjin Samsung Electro-Mechanics 81.8
SEMCO Samsung Electro-Mechanics(HK) Co., Ltd. 100.0
SEMCO Samsung High-Tech Electro-Mechanics(Tianjin) Co., Ltd 95.0
SEMCO Samsung Electro-Mechanics(Shenzhen) Co., LTd 100.0
SEMCO Kunshan Samsung Electro-Mechanics Co., Ltd 100.0
SEMCO iMarket Asia Co., Ltd. 8.7 Samsung Electro-Mechanics Japan Advanced Technology Co.,Ltd
Samsung Electro-Mechanics Nakhonratchasima Co.,Ltd. 100.0
Samsung Electro-Mechanics America, Inc. Samsung Electro-Mechanics Do Brasil Intermediacoes 100.0
Calamba Premier Realty Corpora BATINO REALTY CORPORATION 100.0
Samsuing Fire & Marine Insurance Samsung Fire & Marine Management Corporation 100.0
Samsuing Fire & Marine Insurance Samsung Fire & Marine Insurance Company of Europe Ltd. 100.0
Samsuing Fire & Marine Insurance P.T. Asuransi Samsung Tugu 70.0
Samsuing Fire & Marine Insurance Samsung Vina Insurance Co., Ltd. 50.0
Samsuing Fire & Marine Insurance Samsung Reinsurance Pte., Ltd. 100.0
Samsuing Fire & Marine Insurance Samsung Property Insurance (China) Co., Ltd. 100.0
Samsuing Fire & Marine Insurance SAMSUNG FIRE & MARINE CONSULTORIA EM SEGUROS LTDA. 100.0
Samsung Total Petrochemicals Dongguan Samsung Total Engineering Plastics Limited 100.0
Samsung Total Petrochemicals Samsung Total Petrochemicals Trading (Shanghai) Co., Ltd. 100.0
Samsung Heavy Industries Camellia Consulting Corporation 100.0
Samsung Heavy Industries Samsung Wind Energy,Inc 100.0
Samsung Heavy Industries Offshore 1 consulting Corporation 51.0
Samsung Heavy Industries Samsung heavy Industries Hamburg GmbH 100.0
Samsung Heavy Industries Samsung Heavy Industries India Pvt.Ltd. 100.0
Samsung Heavy Industries SAMSUNG HEAVY INDUSTRIES (M) 100.0

SDN.BHD
Samsung Heavy Industries Samsung Heavy Industries (Ningbo) Co., Ltd. 100.0
Samsung Heavy Industries Samsung Heavy Industries (Rong Cheng) Co., Ltd. 100.0
Samsung Heavy Industries Rongcheng Gaya Shipbuilding 100.0
Samsung Heavy Industries Samsung Heavy Industries Trade(Shanghai) Co.,Ltd 100.0
Samsung Heavy Industries SAMSUNG HEAVY INDUSTRIES NIGERIA Co., Ltd 100.0
Samsung Heavy Industries Samsung Heavy Industries Brazil 100.0
Samsung Heavy Industries SHI BRAZIL CONSTRUCTION 100.0
Camellia Consulting Corporation Oil & Gas Solution LLC 50.0
Offshore 1 consulting Corporat AMEC Samsung Oil&Gas, LLC 51.0
Samsung Life Insurance Samsung Life Investment (America) 100.0
Samsung Life Insurance Samsung Life Investment (U.K.) Limited. 100.0
Samsung Life Insurance 30 GRESHAM STREET(JERSEY) LIMI 100.0
Samsung Life Insurance THAI SAMSUNG LIFE INSURANCE CO 28.7
Samsung Life Insurance Samsung Air China Life 50.0
Samsung Life Insurance Beijing Samsung Real Estate Co 90.0
Samsung Asset Management Samsung Investment Management(Singapore) 100.0
Samsung Asset Management Samsung Investment Management(Hong Kong) 100.0
Cheil Industries SAMSUNG CHEIL INDUSTRIES JAPAN 100.0
Cheil Industries Samsung Chemical (USA), INC. 100.0
Cheil Industries Starex Compounding America Inc 100.0
Cheil Industries Samsung Chemical Europe Gmbh 100.0
Cheil Industries Samsung Chemical Hungary Limited 100.0
Cheil Industries Novaled GmbH 50.1
Cheil Industries SAMSUNG CHEMICAL(THAILAND) CO. 59.4
Cheil Industries Samsung Chemical Material Trading(Shanghai) Co., Ltd. 100.0
Cheil Industries Tianjin Samsung Engineering Plastics Co., Ltd. 100.0
Cheil Industries Dongguan Samsung Engineering Plastics Co., Ltd. 100.0
Cheil Industries Samsung Chemical Electronic Materials (SuZhou) Co., Ltd. 100.0
Starex Compounding America Inc. STARCOM MEXICO 100.0
SAMSUNG CHEMICAL(THAILAND) CO. Samsung Thai Engineering Co., 19.0
Samsung Techwin Techwin Engineering Center Co. 100
Samsung Techwin Samsung Opto-Electronics America, Inc. 100

Samsung Techwin SAMSUNG TECHWIN EUROPE, Ltd. 100
Samsung Techwin Tianjin Samsung Techwin Opto-Electronics 95.0
Samsung Techwin Shanghai Samsung Techwin 100.0
Samsung Techwin Samsung Techwin DO Brasil Equipamentos De Seguranca Ltda 100.0
Samsung Everland Samsung Fashion America Inc. 100.0
Samsung Everland Samsung Fashion S.r.L 100.0
Samsung Everland COLOMBO VIA DELLA SPIGA S.R.L 100.0
Samsung Everland Samsung Fashion Trading (Shanghai) 100.0
Samsung Everland Samsung Everland Inc. Vietnam 100.0
Samsung Everland iMarket Asia Co., Ltd. 19.3
Samsung Welstory Shanghai Ever-Hongjun Business 51.0
Credu Language Testing International 82.4
Opentide Greater China Co., Ltd. Opentide China Co., Ltd. 100.0
Opentide Greater China Co., Ltd. OpenTide Taiwan Co., Ltd 100.0
Opentide Greater China Co., Ltd. OpenTide Interactive Advertising Co.,Ltd 100.0
Opentide China Co., Ltd. Opentide e-Commerce Co.,Ltd. 100.0
Opentide China Co., Ltd. OpenTide Marketing Service Co., Ltd. 100.0
iMarket Asia Co., Ltd. iMarket China Co., Ltd. 80
Samsung Petrochemical Samsung Petrochemical (Shanghai) Co., Ltd. 100
Samsung Fine Chemicals Samsung Fine Chemicals Trading (Shanghai) Co., Ltd 100.0
Samsung Securities Samsung Securities (America), Inc. 100.0
Samsung Securities Samsung Securities (Europe) Limited. 100.0
Samsung Securities Samsung Securities (Asia) Limited. 100.0
Samsung SDS Samsung SNS Europe, Ltd. 100.0
Samsung SDS iMarket Asia Co., Ltd. 40.6
Samsung SDS Samsung SDS America, Inc. 100.0
Samsung SDS Samsung SDS Europe Ltd. 100.0
Samsung SDS Samsung SDS Global SCL Netherland Cooperatief U.A 100.0
Samsung SDS Samsung SDS Asia Pacific Pte. Ltd. 100.0
Samsung SDS Samsung SDS India PVt. Ltd. 100.0
Samsung SDS Samsung SDS China, Ltd. 100.0
Samsung SDS Samsung SDS Latin America, Ltd. 99.7

Miracom Inc. MIRACOM ASIA PACIFIC 100.0
Samsung SDS America, Inc. Samsung SDS Latin America, Ltd 0.3
Samsung SDS America, Inc. Samsung SDS Mexico, S.A. DE C. 99.0
Samsung SDS Europe Ltd. Samsung SDS Global SCL Hungary 100.0
Samsung SDS Europe Ltd. Samsung SDS Global SCL Slovakia 100.0
Samsung SDS Europe Ltd. Samsung SDS Global SCL Netherland Cooperatief U.A 0.0
Samsung SDS Europe Ltd. SAMSUNG SDS Global SCL Egypt C 100.0
Samsung SDS Europe Ltd Samsung SDS Global SCL Rus Lim 100.0 Samsung SDS Global SCL Netherland Cooperatief U.A Samsung SDS Global SCL Rus Lim 0.0
Samsung SDS Asia Pacific Pte. Samsung SDS GSCL Vietnam Co Ltd 51
Samsung SDS Asia Pacific Pte. PT. Samsung SDS Global SCL Indonesia 100.0
Samsung SDS Asia Pacific Pte. Samsung SDS Global SCL Philippines Co., Ltd. 100.0
Samsung SDS Asia Pacific Pte. Samsung SDS Global SCL Thailand Co.,Ltd 100.0
Samsung SDS Asia Pacific Pte. Samsung SDS Global SCL Malaysia SDN.BHD. 100.0
Samsung SDS Asia Pacific Pte. Samsung SDS Global SCL Hong Kong Ltd 100.0
Samsung SDS China, Ltd. Samsung SDS Global Development 100.0
Samsung SDS China, Ltd. Samsung SDS Global SCL Beijing Co., Ltd 100.0
MIRACOM ASIA PACIFIC MIRACOM CHINA 100.0
Samsung Engineering Offshore 1 consulting Corporation 49.0
Samsung Engineering Samsung Engineering America Inc. 100.0
Samsung Engineering Samsung Engineering Magyarorszag Kft 100.0
Samsung Engineering Samsung Engineering (Malaysia) SDN. BHD. 100.0
Samsung Engineering PT Samsung Engineering Indonesia Co., Ltd. 100.0
Samsung Engineering Samsung Thai Engineering Co., Ltd. 81.0
Samsung Engineering Samsung Engineering India Private Ltd. 100.0
Samsung Engineering Samsung Engineering Vietnam Co 100.0
Samsung Engineering Samsung Engineering Construction(Shanghai) Co., Ltd 100.0
Samsung Engineering Samsung Saudi Arabia Ltd. 95.0
Samsung Engineering Muharraq Wastewater Services Company W.L.L. 64.8
Samsung Engineering Muharraq STP Company B.S.C. 5.1
Samsung Engineering Muharraq Holding Company 1 Limited 45.0
Samsung Engineering Samsung INGENIERIA MEXICO S.A DE C.V. 99.7
Samsung Engineering Samsung Ingenieria Minatitlan, S.A. De C.V. 99.9
Samsung Engineering Samsung Engineering Trinidad Co., Ltd. 100.0
Samsung Engineering Samsung Ingenieria Manzanillo, S.A. De C.V. 99.9
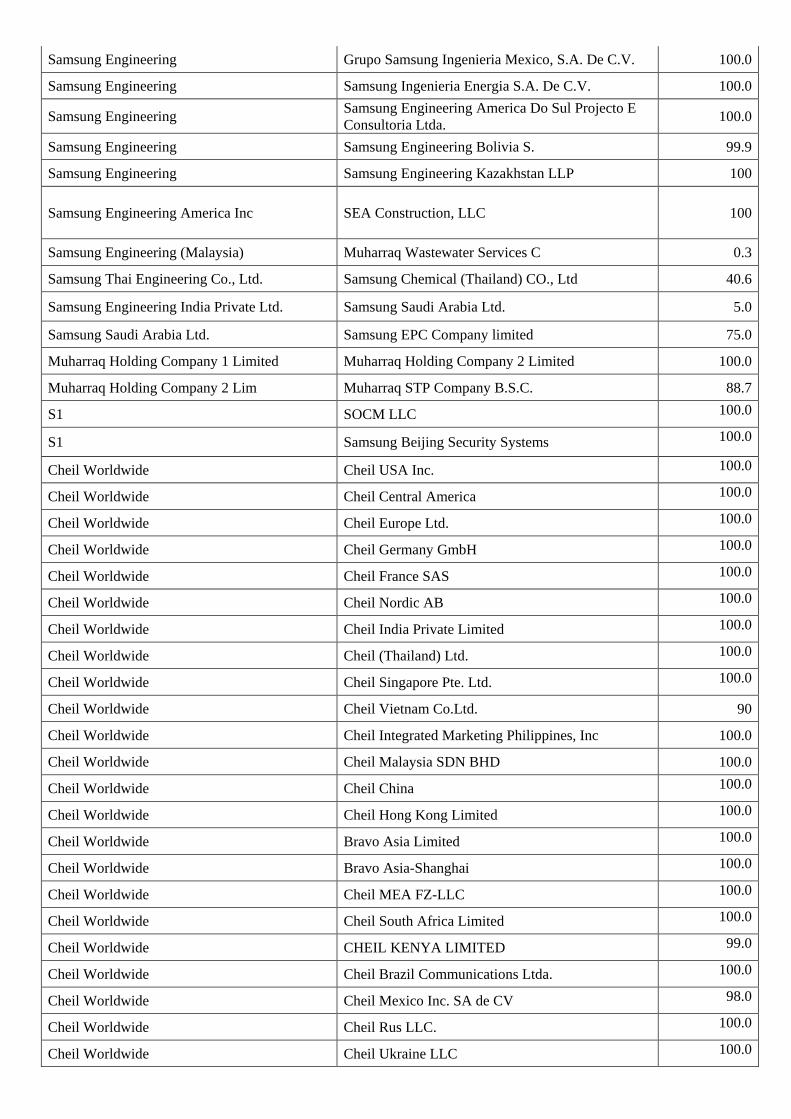
Samsung Engineering Grupo Samsung Ingenieria Mexico, S.A. De C.V. 100.0
Samsung Engineering Samsung Ingenieria Energia S.A. De C.V. 100.0
Samsung Engineering Samsung Engineering America Do Sul Projecto E Consultoria Ltda. 100.0
Samsung Engineering Samsung Engineering Bolivia S. 99.9
Samsung Engineering Samsung Engineering Kazakhstan LLP 100
Samsung Engineering America Inc SEA Construction, LLC 100
Samsung Engineering (Malaysia) Muharraq Wastewater Services C 0.3
Samsung Thai Engineering Co., Ltd. Samsung Chemical (Thailand) CO., Ltd 40.6
Samsung Engineering India Private Ltd. Samsung Saudi Arabia Ltd. 5.0
Samsung Saudi Arabia Ltd. Samsung EPC Company limited 75.0
Muharraq Holding Company 1 Limited Muharraq Holding Company 2 Limited 100.0
Muharraq Holding Company 2 Lim Muharraq STP Company B.S.C. 88.7
S1 SOCM LLC 100.0
S1 Samsung Beijing Security Systems 100.0
Cheil Worldwide Cheil USA Inc. 100.0
Cheil Worldwide Cheil Central America 100.0
Cheil Worldwide Cheil Europe Ltd. 100.0
Cheil Worldwide Cheil Germany GmbH 100.0
Cheil Worldwide Cheil France SAS 100.0
Cheil Worldwide Cheil Nordic AB 100.0
Cheil Worldwide Cheil India Private Limited 100.0
Cheil Worldwide Cheil (Thailand) Ltd. 100.0
Cheil Worldwide Cheil Singapore Pte. Ltd. 100.0
Cheil Worldwide Cheil Vietnam Co.Ltd. 90
Cheil Worldwide Cheil Integrated Marketing Philippines, Inc 100.0
Cheil Worldwide Cheil Malaysia SDN BHD 100.0
Cheil Worldwide Cheil China 100.0
Cheil Worldwide Cheil Hong Kong Limited 100.0
Cheil Worldwide Bravo Asia Limited 100.0
Cheil Worldwide Bravo Asia-Shanghai 100.0
Cheil Worldwide Cheil MEA FZ-LLC 100.0
Cheil Worldwide Cheil South Africa Limited 100.0
Cheil Worldwide CHEIL KENYA LIMITED 99.0
Cheil Worldwide Cheil Brazil Communications Ltda. 100.0
Cheil Worldwide Cheil Mexico Inc. SA de CV 98.0
Cheil Worldwide Cheil Rus LLC. 100.0
Cheil Worldwide Cheil Ukraine LLC 100.0

Hotel Shilla Samsung Hospitality America 100.0
Hotel Shilla New Jersey Int'l M.C.Inc. 100.0
Hotel Shilla SAMSUNG HOSPITALITY U.K. Limited 100.0
Hotel Shilla Shilla Travel Retail Pte.Ltd 100.0
Hotel Shilla Shilla Limited 100.0
Hotel Shilla Samsung Shilla Business Service Beijing Co., Ltd. 100.0
Hotel Shilla SHILLA LIMITED 100.0
SVIC#22 RT SV CO-INVEST, LP 99.9
Cheil USA Inc. The Barbarian Group, LLC 75.6
Cheil USA Inc. McKinney Ventures LLC. 100.0
Cheil USA Inc. Cheil India Private Limited 0.0
Cheil USA Inc. Cheil Mexico Inc. SA de CV 2.0
Samsung Hospitality America Samsung Hospitality Europe 100.0
Cheil Europe Ltd. Beattie McGuinness Bungay Limited 75.3
Cheil Europe Ltd. CHEIL ITALIA S.R.L. 100.0
Cheil Europe Ltd. CHEIL SPAIN S.L 100.0
Cheil Europe Ltd. CHEIL BENELUX B.V. 100.0
Cheil Germany GmbH CHEIL AUSTRIA GMBH 100.0
Cheil Singapore Pte. Ltd. Opentide Greater China Co., Ltd. 95.0
Cheil Hong Kong Limited Opentide Greater China Co., Ltd. 3.1
Cheil MEA FZ-LLC One Agency FZ LLC 100.0
Cheil MEA FZ-LLC One Agency Istanbul Advertisement, Communication &Production LLC 0.0
Cheil South Africa Pty., Ltd. CHEIL KENYA LIMITED 1.0
One Agency FZ LLC One Agency Istanbul Advertisement, Communication &Production LLC 100.0
One Agency FZ LLC One Agency Interior Design LLC 100.0
One Agency FZ LLC One Agency Printing LLC 100.0

□ Equity Investments in Other Companies
As of end-1Q 2014, Samsung Electronics’ equity investments in other companies amounted to KRW45,172,500,000,000 and such investments were made for business purpose, etc.
(As of March 31, 2014) (K shares, million won, %)
Account Company name
Date of purchase Purpose
Initial acquisition cost
Year-beginning balance Increase/decrease Year-end balance Financial status
Note
No. of hares
Stake
Book value
No. of
shares
Cost for
acquisition (or disposa
l)
No. of shares
Stake
Book value
Total asset Net profit
Dom
estic
Available for sale securities
Listed Samsung SDI 1977.01
Participation in
management, etc.
304 9,283 20.38 874,079 0 0 9,283 20.
38 874,079 10,555,671 147,916
Listed SEMCO 1977.01
Participation in
management, etc.
250 17,693 23.69 445,244 0 0 17,693 23.
69 445,244 7,185,343 345,692
Listed Samsung Card 1988.12
Participation in
management, etc.
10,000 43,393 37.45
1,455,485 0 0 43,393 37.
45 1,455,4
85 16,560,
926 273,232
Listed Samsung Techwin 1977.12
Participation in
management, etc.
336 13,527 25.46 235,638 0 0 13,527 25.
46 235,638 3,434,224 133,039
Unlisted STECO 1995.06 Business purpose 24,000 2,448 51 32,724 0 0 2,448 51 32,724 91,556 3,188
Unlisted SEMES 1992.12 Business purpose 1,000 2,167 91.
3 70,817 6 1,087 2,173 91.54 71,904 669,23
2 38,062 Acquisition
Unlisted SERI 1991.05
Participation in
management, etc.
320 3,576 29.8 24,942 0 0 3,576 29.
8 24,942 123,875 5,014
Unlisted Samsung SDS 1992.07
Participation in
management, etc.
6,160 17,472 22.58 560,827 0 0 17,472 22.
58 560,827 5,300,100 325,983
Unlisted Samsung Lions 1986.08
Participation in
management, etc.
240 55 27.5 -102 0 0 55 27.
5 -102 65,889 -12,166
Unlisted Samsung
Electronics Service
1998.01 Business purpose 30,000 6,000 99.
33 48,121 0 0 6,000 99.33 48,121 335,58
8 4,363
Unlisted MEMC Korea 1991.12
Participation in
management, etc.
36,000 3,440 20 35,286 0 0 3,440 20 35,286 266,963 5,418
Unlisted Living Plaza 2000.12 Business
purpose 3,100 1,767 100 247,523 0 0 1,767 100 247,523 564,361 4,425
Unlisted Samsung
Electronics Logitech
1999.04 Business purpose 76 1,011 100 46,669 0 0 1,011 100 46,669 140,73
3 3,185
Unlisted SSLM 2012.04 Participati
on in management, etc.
52,296 4,378 19.99 0 0 0 4,378 19.
99 0 191,164 -64,194
Unlisted Samsung Display 2012.04 Business
purpose 16,009,
547 221,96
9 84.78
18,509,307 0 0 221,96
9 84.78
18,509,307
35,754,894 2,400,779
Unlisted SVIC #6 2005.07 Business purpose 26,800 1 99 2,277 0 0 1 99 2,277 37,284 -10,041
Unlisted SVIC #14 2009.05 Business purpose 18,000 0 99 0 0 0 0 99 0 55,465 -1,882
Unlisted SVIC #21 2011.11 Business purpose 19,800 0 99 81,180 0 55 0 99 81,235 61,384 -11,804 Invest
ment

Unlisted SVIC #22 2011.11 Business purpose 19,800 0 99 102,633 0 16,088 0 99 118,721 93,554 -4,497 Invest
ment
Unlisted World Cyber Games
2003.12 Business purpose 1 450 47.
6 0 0 0 450 47.6 0 2,234 486
Unlisted Samsung BlueWings 2008.12 Business
purpose 2,000 400 100 2,000 0 0 400 100 2,000 4,115 -26
Unlisted Samsung Medison 2011.02 Business
purpose 286,38
4 87,350 68.45 477,648 0 0 87,350 68.
45 477,648 309,321 28,856
Unlisted Samsung Biologics 2011.04
Participation in
management, etc.
30,000 5,058 42.55 244,665 2,09
1 84,700 7,149 44.49 329,365 653,42
6 -140,762
Captial
Increase
Unlisted Intellectual Discovery 2011.05
Participation in
management, etc.
5,000 1,784 15.71 5,241 0 0 1,784 15.
71 5,241 48,125 12,619
Listed Samsung
Heavy Industries
1977.09
Participation in
management, etc.
125 40,676 17.61
1,547,708 0 0 40,676 17.
61 1,295,5
19 17,427,
147 632,205 Evaluation
Listed Samsung
Fine Chemicals
1995.05
Participation in
management, etc.
1,346 2,165 8.39 96,449 0 0 2,165 8.3
9 105,867 1,900,118 3,340 Evalu
ation
Listed Hotel Shilla 1979.12
Participation in
management, etc.
252 2,005 5.11 133,314 0 0 2,005 5.1
1 172,606 1,712,071 10,810 Evalu
ation
Listed Cheil Worldwide 1988.09
Participation in
management, etc.
185 2,999 2.61 82,465 0 0 2,999 2.6
1 71,819 1,704,531 102,269 Evalu
ation
Listed A-TECH
SOLUTION
2009.11
Participation in
management, etc.
26,348 1,592 15.92 9,568 0 0 1,592 15.
92 10,237 181,148 -1,340 Evalu
ation
Listed iMarket Korea 2000.12
Participation in
management, etc.
1,900 647 1.8 16,668 0 0 647 1.8 21,264 791,733 38,557 Evalu
ation
Listed KT Skylife 2001.12
Participation in
management, etc.
3,344 240 0.5 7,092 0 0 240 0.5 5,724 684,444 72,724 Evalu
ation
Unlisted Samsung
Petrochemical
1978.01
Participation in
management, etc.
100 514 12.96 80,347 0 0 514 12.
96 80,347 883,798 -42,180
Unlisted Samsung General
Chemicals 1988.07
Participation in
management, etc.
1,500 1,914 3.91 80,653 0 0 1,914 3.9
1 80,653 1,597,400 205,314
Unlisted KihyupTec
hnology Banking
1995.01
Participation in
management, etc.
5,000 1,000 17.24 5,000 0 0 1,000 17.
24 5,000 85,615 691
Unlisted PUSAN
NEWPORT
1997.09
Participation in
management, etc.
590 1,135 0.98 5,677 0 0 1,135 0.9
8 5,677 682,137 35,726
Unlisted The Korea Economic
Daily 1987.05
Participation in
management, etc.
150 72 0.39 365 0 0 72 0.3
9 365 221,876 12,938
Unlisted Brooks
Automation Asia
1999.06
Participation in
management, etc.
1,097 219 19 368 0 0 219 19 368 4,279 294
Unlisted
Samsung Venture
Investment Corporatio
n
1999.11
Participation in
management, etc.
4,900 980 16.33 7,021 0 0 980 16.
33 7,021 64,049 2,575

Unlisted Cyber Bank 2000.12
Participation in
management, etc.
8,000 1,083 7.46 0 0 0 1,083 7.4
6 0 0 0
Unlisted Fine Chips 2001.12
Participation in
management, etc.
10 2 3.81 10 0 0 2 3.8
1 10 3,231 361
Unlisted SK Telink 2010.11
Participation in
management, etc.
4,357 15 1.13 4,357 0 0 15 1.1
3 4,357 253,332 16,093
Unlisted Inkel 2006.11
Participation in
management, etc.
130 0 0 0 0 0 0 0 0 153,629 974
Unlisted Yongpyong Resort 2007.05
Participation in
management, etc.
1,869 400 1.05 1,869 0 0 400 1.0
5 1,869 734,627 12,019
Unlisted SCOM 2007.12
Participation in
management, etc.
0 0 0.01 0 0 0 0 0.0
1 0 14,329 -7,482
Unlisted Trigem Computer 2012.09
Participation in
management, etc.
0 0 0.01 0 0 0 0 0.0
1 0 37,940 1,467
Unlisted iCube
Investment Union #1
2009.12
Participation in
management, etc.
4,000 0 16.23 4,000 0 0 0 16.
23 4,000 24,399 97
Unlisted KT WiBro Infra 2010.07
Participation in
management, etc.
60,000 600 24.2 60,000 0 0 600 24.
2 60,000 262,713 3,169
Unlisted Shinsung 2010.07
Participation in
management, etc.
1 1 0.01 0 0 0 1 0.0
1 0 61,878 3,281
Unlisted Woobang 2010.07
Participation in
management, etc.
0 1 0 0 0 0 1 0 0 171,444 1,109
Unlisted HeeHoon D&G 2010.07
Participation in
management, etc.
0 2 0.02 0 0 0 2 0.0
2 0 42,516 -8,168
Unlisted
Daewoo Developme
nt Co.,Ltd.-
Engineering &
Construction
2012.12
Participation in
management, etc.
0 0 0.02 0 0 0 0 0.0
2 0 153,402 -51,563
Unlisted
Daewoo SD
Development
2012.12
Participation in
management, etc.
0 9 0.02 0 0 0 9 0.0
2 0 1,217,768 -267,694
Unlisted ZYLE Motor Sales
2012.12
Participation in
management, etc.
0 1 0 0 0 0 1 0 0 318,071 -369
Unlisted JNT
(semiconductor fund)
2011.02 Equity
investment, etc.
1,800 0 24 3,360 0 0 0 24 3,360 13,647 -310
Unlisted SV
(semiconductor fund)
2011.02 Equity
investment, etc.
1,850 0 14.8 3,403 0 0 0 14.
85 3,403 19,873 -1,730
Unlisted Seoul
Investment Partners
2011.1 Equity
investment, etc.
1,550 0 19.4 3,047 0 -175 0 19.
4 2,872 15,778 1,257 Work out

Unlisted
Daishin-Aju IB
(Semiconductor fund)
2011.08 Equity
investment, etc.
258 0 3 2,277 0 -155 0 3 2,123 68,934 2,235 Work out
Unlisted TS
(semiconductor fund)
2011.11 Equity
investment, etc.
1,700 0 20.48 3,400 0 -718 0 20.
32 2,682 17,032 745 Work out
Unlisted IMM
(semiconductor fund)
2011.11 Equity
investment, etc.
760 0 7.6 2,489 0 684 0 7.6 3,173 34,792 1,512 Investment
Unlisted L&S
(semiconductor fund)
2012.07 Equity
investment, etc.
848 0 8.1 1,687 0 164 0 7.5 1,851 23,610 1,871 Investment
Unlisted Taewon Electric 2012.04
Participation in
management, etc.
16,544 9 15 17,072 36 0 45 15 17,072 82,347 5,386 Dividend
Unlisted Pantech 2013.06 Business purpose 53,000 53,000 10.
03 53,053 0 0 53,000 10.03 53,053 714,09
7 -619,909
Unlisted
KTCNP-GC(semico
nductor fund)
2013.12 Business purpose 960 0 3.5
6 960 0 0 0 3.56 960 25,578 -1,591
Listed Wonik IPS 2013.12 Business purpose 31,625 3,610 4.4
8 30,975 0 0 3,610 4.48 32,203 590,14
2 37,354 Evaluation
Unlisted Postech Venture Capital
2013.12 Business purpose 600 0 10 600 0 0 0 10 600 118,61
3 3,514
Unlisted Hi Pioneer Investment
Trust #1 2011.09 Business
purpose 29,244 0 100 19,470 0 0 0 100 19,470 19,189 -303
Overseas
Available for sale securities
Unlisted SECA 1992.08
Establishment of overseas foothold
3,823 0 100 90,922 0 0 0 100 90,922 522,775 48,920
Unlisted SEA 1978.07
Establishment of overseas foothold
59,362 492 100 4,861,334 0 0 492 100 4,861,3
34 11,316,
048 56,864
Unlisted SELA 1989.04
Establishment of overseas foothold
319 40 100 86,962 0 0 40 100 86,962 375,274 -26,800
Unlisted SEM 1995.07
Establishment of overseas foothold
3,032 3,173 63.58 111,697 0 0 3,173 63.
58 111,697 1,554,638 10,689
Unlisted SEASA 1996.06
Establishment of overseas foothold
4,696 21,854 98 6,779 0 0 21,854 98 6,779 49,454 6,353
Unlisted SEDA 1994.01
Establishment of overseas foothold
13,224 62,816,336
87.04 577,483 0 0 62,816,
336 87.04 577,483 3,429,1
36 914,548
Unlisted SECH 2002.12
Establishment of overseas foothold
597 0 4.1 597 0 0 0 4.1 597 492,709 28,128
Unlisted Nvelo, Inc. 2012.12
Establishment of overseas foothold
42,892 100 100 42,892 0 0 100 100 42,892 1,519 246
Unlisted CMLA LLC 2008.02
Participation in
management, etc.
654 0 25 4,115 0 0 0 25 4,115 10,084 -728
Unlisted SESA 1989.01
Establishment of overseas foothold
3,276 8,021 100 142,091 0 0 8,021 100 142,091 783,438 57,386
Unlisted SENA 1992.03
Establishment of overseas foothold
392 1,000 100 69,372 0 0 1,000 100 69,372 533,252 39,394

Unlisted SEH 1991.05
Establishment of overseas foothold
1,954 753 100 650,157 0 0 753 100 650,157 1,249,691 103,658
Unlisted SEP 1982.09
Establishment of overseas foothold
204 1,751 100 37,616 0 0 1,751 100 37,616 132,631 8,139
Unlisted SEF 1991.08
Establishment of overseas foothold
230 2,700 100 234,115 0 0 2,700 100 234,115 1,157,900 127,155
Unlisted SEUK 1995.07
Establishment of overseas foothold
33,908 109,546 100 433,202 0 0 109,54
6 100 433,202 1,393,507 92,969
Unlisted SEHG 1982.02
Establishment of overseas foothold
28,042 0 100 354,846 0 0 0 100 354,846 886,338 122,818
Unlisted SEAG 2002.01
Establishment of overseas foothold
40 0 100 32,162 0 0 0 100 32,162 323,756 17,845
Unlisted SEI 1993.05
Establishment of overseas foothold
862 677 100 143,181 0 0 677 100 143,181 1,004,423 70,337
Unlisted SEBN 1995.07
Establishment of overseas foothold
236 500,285,383 100 860,716 0 0 500,28
5,383 100 860,716 1,290,124 25,233
Unlisted SELS 1991.05
Establishment of overseas foothold
18,314 1,306 100 24,288 0 0 1,306 100 24,288 1,903,892 7,613
Unlisted SEPOL 1996.04
Establishment of overseas foothold
5,462 106 100 78,267 0 0 106 100 78,267 557,370 41,945
Unlisted SSA 1998.12
Establishment of overseas foothold
263 2,000 100 32,622 0 0 2,000 100 32,622 787,562 87,809
Unlisted SESK 2002.06
Establishment of overseas foothold
8,976 0 55.68 263,767 0 0 0 55.
68 263,767 1,764,078 140,825
Unlisted SEEH 2008.01
Establishment of overseas foothold
4,214 0 100 1,304,648 0 0 0 100 1,304,6
48 5,780,3
02 -28,769
Unlisted SEO 1997.01
Establishment of overseas foothold
120 0 100 -10,043 0 0 0 100 -10,043 173,644 -352
Unlisted SRSC 1997.11
Establishment of overseas foothold
707 0 100 8,211 0 0 0 100 8,211 41,567 3,546
Unlisted SERC 2006.01
Establishment of overseas foothold
24,877 0 100 180,079 0 0 0 100 180,079 1,410,054 -11,137
Unlisted SERK 2007.07
Establishment of overseas foothold
4,600 0 100 204,555 0 0 0 100 204,555 1,122,495 69,837
Unlisted SEAU 1987.11
Establishment of overseas foothold
392 53,200 100 111,964 0 0 53,200 100 111,964 578,624 31,998
Unlisted SEMA 1989.09
Establishment of overseas foothold
4,378 16,247 100 153,602 0 0 16,247 100 153,602 277,354 33,000
Unlisted SGE 1995.05
Establishment of overseas foothold
827 0 100 32,836 0 0 0 100 32,836 1,071,694 -13,157
Unlisted SEEG 2012.07
Establishment of overseas foothold
23 0 39 0 0 0 0.05 39 251,86
6 -11,788
Unlisted SEIN 1991.08
Establishment of overseas foothold
7,463 46 99.99 118,909 0 0 46 99.
99 118,909 647,199 141,290
Unlisted SDMA 1995.03
Establishment of overseas foothold
21,876 71,400 75 244,382 0 0 71,400 75 244,382 814,820 70,830

Unlisted SIEL 1995.08
Establishment of overseas foothold
5,414 216,787 100 75,263 0 0 216,78
7 100 75,263 1,924,832 324,171
Unlisted SRI-B 2005.05
Establishment of overseas foothold
7,358 17 100 31,787 0 0 17 100 31,787 147,900 20,316
Unlisted SAVINA 1995.01
Establishment of overseas foothold
5,839 0 100 28,365 0 0 0 100 28,365 175,780 18,173
Unlisted TSE 1988.01
Establishment of overseas foothold
1,390 11,020 91.83 279,163 0 0 11,020 91.
83 279,163 1,476,296 222,389
Unlisted STE 1996.01
Establishment of overseas foothold
4,206 0 49 4,474 0 0 0 49 4,474 23,979 -7
Unlisted SME 2003.05
Establishment of overseas foothold
4,796 17,100 100 7,644 0 0 17,100 100 7,644 814,104 36,427
Unlisted SAPL 2006.07
Establishment of overseas foothold
793 736,269 100 870,623 0 0 736,26
9 100 870,623 2,425,585 674,510
Unlisted SEHK 1988.09
Establishment of overseas foothold
349 274,250 100 79,033 0 0 274,25
0 100 79,033 1,188,620 37,977
Unlisted SET 1994.11
Establishment of overseas foothold
456 27,270 100 112,949 0 0 27,270 100 112,949 1,390,404 30,802
Unlisted SESS 1994.12
Establishment of overseas foothold
18,875 0 100 483,923 0 0 0 100 483,923 660,374 64,362
Unlisted SCIC 1996.03
Establishment of overseas foothold
23,253 0 100 617,941 0 0 0 100 617,941 8,406,438 743,369
Unlisted SEHZ 1992.12
Establishment of overseas foothold
792 0 89.56 255,535 0 0 0 89.
56 255,535 4,599,200 1,012,728
Unlisted SSEC 1995.04
Establishment of overseas foothold
32,128 0 69.06 130,551 0 0 0 69.
06 130,551 645,699 67,668
Unlisted TSEC 1993.04
Establishment of overseas foothold
15,064 0 48.2 138,101 0 0 0 48.
2 138,101 907,752 155,258
Unlisted SSDP 1993.08
Establishment of overseas foothold
4,446 0 87.1 65,319 0 0 0 87.
1 65,319 761,018 94,541
Unlisted TSTC 2001.03
Establishment of overseas foothold
10,813 0 90 490,041 0 0 0 90 490,041 2,939,027 767,822
Unlisted SSTC 2001.11
Establishment of overseas foothold
15,799 0 100 -1,186 0 0 0 100 -1,186 1,411 -4,958
Unlisted SSET 2002.02
Establishment of overseas foothold
6,009 0 60 121,624 0 0 0 95 121,624 88,698 7,122
Unlisted SESC 2002.09
Establishment of overseas foothold
5,471 0 73.7 34,028 0 0 0 73.
7 34,028 846,670 58,194
Unlisted SSS 2001.01
Establishment of overseas foothold
1,200 0 100 19,189 0 0 0 100 19,189 1,310,109 130,082
Unlisted SEHF 2004.04
Establishment of overseas foothold
17,204 0 100 85,088 0 0 0 100 85,088 111,367 -7,855
Unlisted SSCR 2006.09
Establishment of overseas foothold
3,405 0 100 9,332 0 0 0 100 9,332 18,982 1,874
Unlisted TSOE 2010.04
Establishment of overseas foothold
33,837 167,199 82 93,154 0 0 167,19
9 82 93,154 241,957 34,236

Unlisted TSLED 2012.04
Establishment of overseas foothold
119,519 0 100 119,519 0 0 0 100 119,519 457,89
6 15,570
Unlisted SCS 2012.09
Establishment of overseas foothold
111,770 0 100 2,538,8
26 0 0 0 100 2,538,826
3,752,682 -40,537
Unlisted SJC 1975.12
Establishment of overseas foothold
273 1,560 100 370,647 0 0 1,560 100 370,647 1,174,832 2,866
Unlisted SRJ 1992.08
Establishment of overseas foothold
3,120 122 100 117,257 0 0 122 100 117,257 181,723 4,905
Unlisted TSST Japan 2004.03
Participation in
management, etc.
1,639 0 49.03 11,137 0 0 0 49.
03 11,137 169,322 -41,875
Unlisted SDIB 1996.09
Participation in
management, etc.
3,110 586 0.08 0 0 0 586 0.0
8 0 49,372 10,088
Unlisted Semiconductor Portal 2002.12
Participation in
management, etc.
38 0 1.21 10 0 0 0 1.2
1 10 1,724 2,141
Unlisted FTS 2008.12
Participation in
management, etc.
1,952 116 41.5 563 0 0 116 41.
5 563 2,710 406
Unlisted Nanosys,Inc 2010.08
Participation in
management, etc.
4,774 1,747 1.67 2,387 0 0 1,747 1.6
7 2,387 22,159 857
Unlisted ONE
BLUE LLC
2011.07
Participation in
management, etc.
1,766 0 16.67 1,766 0 0 0 16.
67 1,766 33,803 875
Unlisted TidalScale 2013.08
Participation in
management, etc.
1,112 2,882 18.98 1,112 0 0 2,882 18.
98 1,112 1,214 -1,948
Unlisted Mantis Vision 2014.01 Business
purpose 1,594 0 0 0 301 1,594 301 3.53 1,594 3,236 -4,186 Acqui
sition
Listed Rambus 2010.01 Business purpose 185,36
3 4,788 4.34 47,851 0 0 4,788 4.3
4 55,014 752,829 -36,931 Evalu
ation
Listed SEAGATE 2011.12 Business purpose 788,45
4 12,539 3.8 743,161 0 0 12,539 3.8 752,668 9,754,138 2,011,378 Evalu
ation
Total 18,590,973 45,261,
470 2,43
4 103,32
4 45,172,464 45,172,464
※ The cost for acquisition (or disposal) includes increases or decreases in the cost that do not accompany money transactions such as fair value measurement and impairment measurement.

IV. Management and Employees □ Employees (As of March 31, 2014)
(Person, year, million won) Business division No. of employees Average
length of service
Total wage
Average wage per
capita /gender Regular Contract-based Others Total
CE 15,462 537 - 15,999 9.2 2,025,935 21
IM 27,286 416 - 27,702
DS 41,760 303 - 42,063
Others 11,864 759 - 12,623
Total 96,372 2,015 - 98,387
Male 70,808 1,331 - 72,139 9.9 1,625,843 23
Female 25,564 684 - 26,248 7.5 400,092 15
※ The number of employees on a parent-company basis. Four executive directors excluded. ※ Total wage before income tax deduction is based on the earned income payment record submitted
to the competent district tax office in accordance with Article 20 of the Income Tax Law ※ Average wage per capita was calculated based on total average employee figure of 97,563
(male: 71,456 / female: 26,107) □ Remuneration for the Management < Remuneration approved at shareholders’ meeting >
(100 million won) No. of
persons Amount approved at shareholders’
meeting Note
Executive directors
4
480 -
Independent directors
5 -