Embed Size (px)
Citation preview

1Q 2018 RESULTS PRESENTATION
24 April 2018
2
FORWARD-LOOKING STATEMENTS
Forward-looking statements contained in this presentation regrading future events and future results are based on current expectations, estimates, forecasts and projections about the industries in which Saipem S.p.A. (the “Company”) operates, as well as the beliefs and assumptions of the Company’s management. These forward-looking statements are only predictions and are subject to known and unknown risks, uncertainties, assumptions and other factors beyond the Company’ control that are difficult to predict because they relate to events and depend on circumstances that will occur in the future. These include, but are not limited to: forex and interest rate fluctuations, commodity price volatility, credit and liquidity risks, HSE risks, the levels of capital expenditure in the oil and gas industry and other sectors, political instability in areas where the Group operates, actions by competitors, success of commercial transactions, risks associated with the execution of projects (including ongoing investment projects), in addition to changes in stakeholders’ expectations and other changes affecting business conditions. Therefore, the Company’s actual results may differ materially and adversely from those expressed or implied in any forward-looking statements. They are neither statements of historical fact nor guarantees of future performance. The Company therefore caution against relying on any of these forward-looking statements. Factors that might cause or contribute to such differences include, but are not limited to, economic conditions globally, the impact of competition, political and economic developments in the countries in which the Company operates, and regulatory developments in Italy and internationally. Any forward-looking statements made by or on behalf of the Company speak only as of the date they are made. The Company undertakes no obligation to update any forward-looking statements to reflect any changes in the Company’s expectations with regard thereto or any changes in events, conditions or circumstances on which any such statement is based. Accordingly, readers should not place undue reliance on forward-looking statements due to the inherent uncertainty therein. The Financial Reports contain analyses of some of the aforementioned risks. Forward-looking statements neither represent nor can be considered as estimates for legal, accounting, fiscal or investment purposes. Forward-looking statements are not intended to provide assurances and/or solicit investment.

3
TODAY’S PRESENTATION
2 1Q 2018 RESULTS
3 BUSINESS UPDATE
1 OPENING REMARKS
4 CLOSING REMARKS AND 2018 GUIDANCE UPDATE
4
OPENING REMARKS
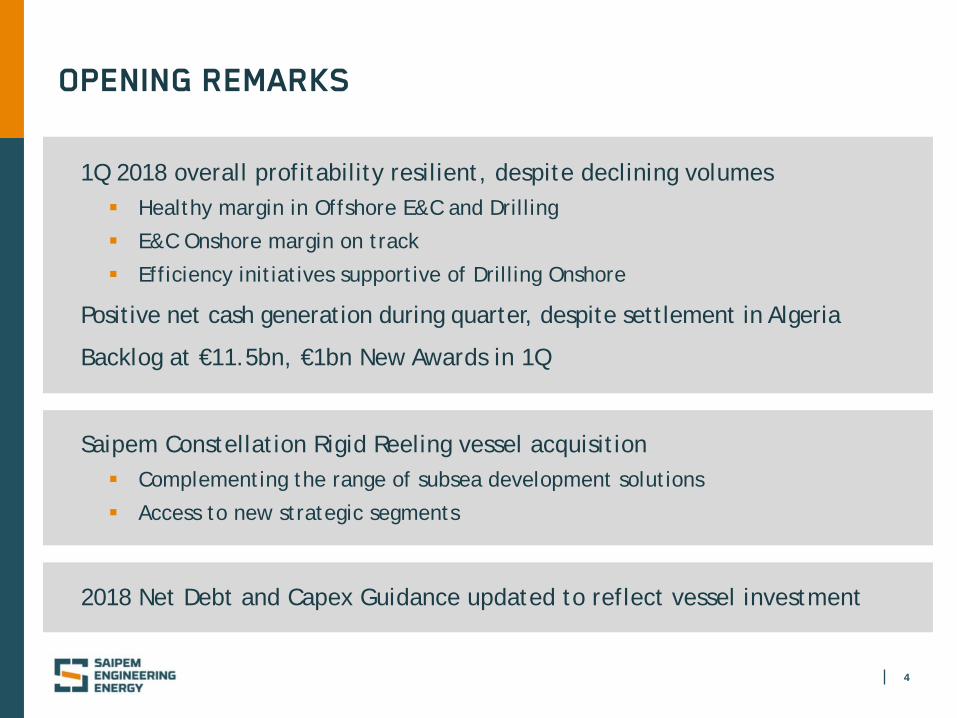
1Q 2018 overall profitability resilient, despite declining volumes Healthy margin in Offshore E&C and Drilling
E&C Onshore margin on track
Efficiency initiatives supportive of Drilling Onshore
Positive net cash generation during quarter, despite settlement in Algeria
Backlog at €11.5bn, €1bn New Awards in 1Q
2018 Net Debt and Capex Guidance updated to reflect vessel investment
Saipem Constellation Rigid Reeling vessel acquisition Complementing the range of subsea development solutions
Access to new strategic segments
1Q 2018 RESULTS

6
1Q 2018 RESULTS YoY COMPARISON (€ mn)
Adjusted EBITDA Revenues Adjusted Net Result
11
54
1Q18 1Q17 1Q18 1Q17 1Q18 1Q17
1,915
2,263
256
214
11.3% 11.2% margin

7
1Q 2018 RESULTS – E&C YoY COMPARISON (€ mn)
(*) E&C Onshore including Floaters business and XSight
1Q18 1Q17 1Q18 1Q17
• Middle East partially offsetting lower activity elsewhere
• Good operational performance delivering solid margin
• Lower activity in Middle East, Far East and West Africa
• Margin on track
1,002 878
1Q18 1Q17 1Q18 1Q17
E&C OFFSHORE E&C ONSHORE*
803
975 10.8% 12.8% margin
103 105
4.4% 3.0% margin
44
26
Adj. EBITDA Revenues Adj. EBITDA Revenues

8
1Q 2018 RESULTS – Drilling YoY COMPARISON (€ mn)
Adj. EBITDA Revenues
• Declining revenues due to higher idleness
• Margin still resilient
Adj. EBITDA Revenues
• Cost saving and higher rig utilization sustaining EBITDA and margin
DRILLING OFFSHORE DRILLING ONSHORE
1Q18 1Q17 1Q18 1Q17
116
162
53
76
124 118
31 32
1Q18 1Q17 1Q18 1Q17
46.9% 45.7% margin 25.0% 27.1% margin

9
1Q 2018 NET DEBT EVOLUTION (€ bn)
Adj. Cash Flow (Adj. N.P.+ D&A)
Capex Net Debt @Dec. 31, 2017
Net Debt @Mar. 31, 2018
Δ Working Capital and
Others*
1.20 (0.13)
0.03
1.30 0.00
Good Cash Flow generation positively impacting Net Debt
(*) Includes payment of Algeria settlement

10
500 500 500 500
23 64 64
75 60 60
60
76
375 75
25 25
62
85
439 139
600 585 560
60
576
286
Liquidity 2018 2019 2020 2021 2022 2023 2024 2025+
Bonds ECA Facilities Bank Facilities Other Debt
CAPITAL STRUCTURE AS OF MARCH 31, 2018 (€ mn)
Debt maturity profile
3,047
Average debt maturity c.4.1 years. Overall financing interest rate c.4% including treasury hedging Undrawn committed cash facilities totalling c.€1.8bn, in addition to c.€0.4bn of uncommitted facilities Available cash and equivalent c. €1.3bn**
1,261
Undrawn RCF*
Undrawn ECA* Facilities (GIEK and Atradius)
1,500
Available Cash and equiv.**
(*) Committed
(**) Not including additional trapped cash c.€0.6bn

BUSINESS UPDATE

12
NEW E&C OFFSHORE ASSET: SAIPEM CONSTELLATION 1/3
Immediate access to Reel-Lay solutions with latest generation vessel (built 2013) Multipurpose “one stop shop”:
800mT tension, for the deepest waters 3000mT mast crane Subsea installation
Less spoolbase dependent, for remote locations
RIGID REEL-LAY AND SUBSEA DEVELOPMENT VESSEL
13
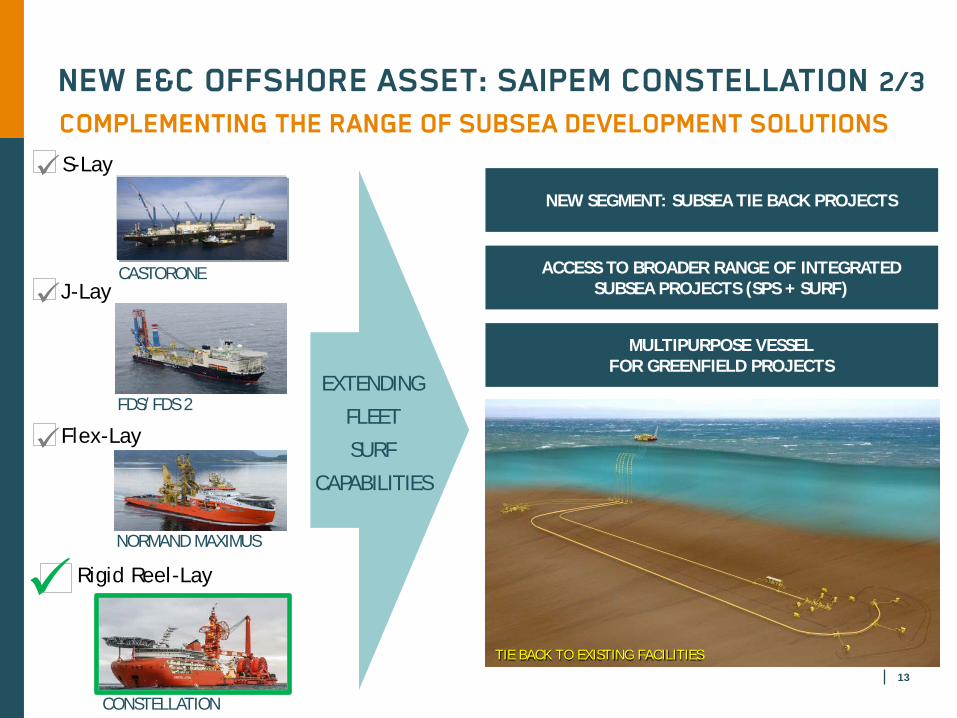
COMPLEMENTING THE RANGE OF SUBSEA DEVELOPMENT SOLUTIONS
NEW E&C OFFSHORE ASSET: SAIPEM CONSTELLATION 2/3
Flex-Lay
Rigid Reel-Lay
CONSTELLATION
NORMAND MAXIMUS
FDS/FDS 2
J-Lay
S-Lay
CASTORONE
NEW SEGMENT: SUBSEA TIE BACK PROJECTS
ACCESS TO BROADER RANGE OF INTEGRATED SUBSEA PROJECTS (SPS + SURF)
MULTIPURPOSE VESSEL FOR GREENFIELD PROJECTS
EXTENDING
FLEET
SURF
CAPABILITIES
TIE BACK TO EXISTING FACILITIES

14
NEW E&C OFFSHORE ASSET: SAIPEM CONSTELLATION 3/3 ACCESSIBLE MARKET
POTENTIAL FOR 2018 DEPLOYMENT ON ONGOING PROJECTS
GOM
COUNTRIES: USA Mexico
POTENTIAL CLIENTS: Anadarko BHP Billiton BP Chevron LLOG Pemex
North Sea
COUNTRIES: Norway UK
POTENTIAL CLIENTS: BP Statoil Chevron Lundin OMV
West Africa
COUNTRIES: Nigeria Senegal
POTENTIAL CLIENTS: Total Woodside
CONSIDERABLE NUMBER OF VISIBLE RIGID REELING INITIATIVES ACCESSIBLE MARKET OF c.$7bn IN 2019-2020

15
DUQM Refinery Package 3
Client: Duqm Refinery and Petrochemical Industries Company Location: Oman Scope of work: EPC works for a new grassroots Crude Tank Farm at Ras Markaz composed
by 8 crude oil tanks with a cumulative volume of 824,000 m3
E&C ONSHORE
Client: ConocoPhillips Location: North Sea - UK sector Scope of work: decommissioning of
marine structures
ConocoPhillips Decommissioning KJO Crude Pipeline
Client: Al Khafji Joint Operations (KJO) Location: Arabian Gulf Scope of work: engineering, construction,
installation and commissioning of a crude pipeline
E&C OFFSHORE
MAIN AWARDS 2018
Scarabeo 8 – North Sea Norwegian sector
Client: Total Location: offshore Norway Terms: 1 well project with start in 4Q18
Scarabeo 8 – North Sea Norwegian sector
Client: AkerBP Location: offshore Norway Terms: 4 wells project + 2 optional wells,
start within the end of 4Q18
OFFSHORE DRILLING
Scarabeo 8 – North Sea Norwegian sector
Client: Shell Location: offshore Norway Terms: option for second well exercised
Saipem TAD - Congo
Client: Total Location: offshore Congo Terms: 5 firm wells + up to 5 optional wells
GOOD VISIBILITY ON NEW OPPORTUNITIES
16
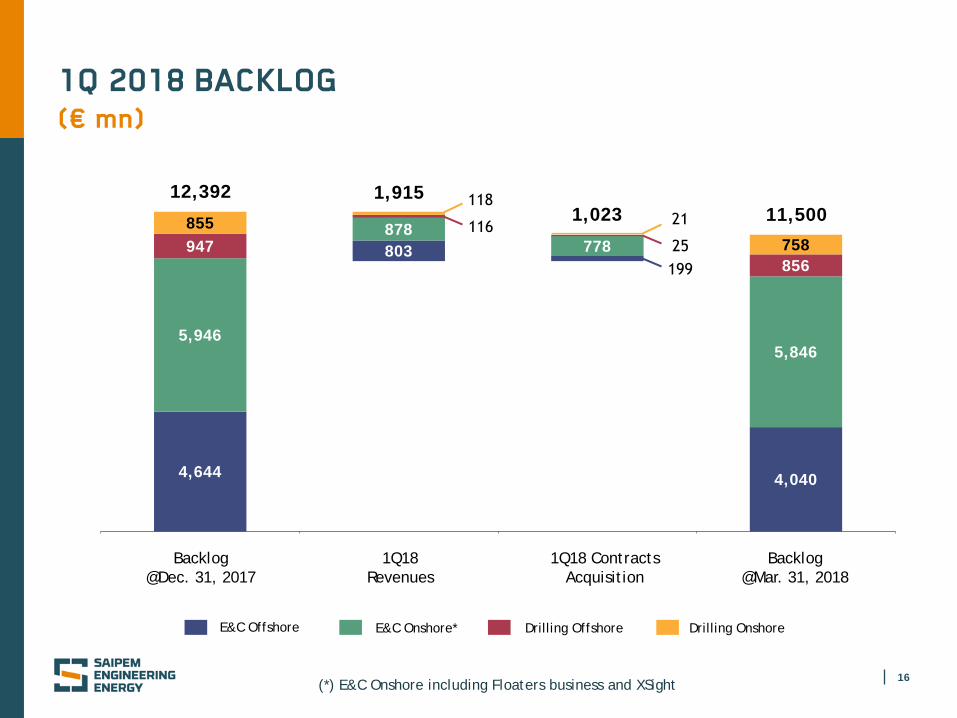
E&C Onshore* Drilling Offshore E&C Offshore Drilling Onshore
Backlog @Mar. 31, 2018
Backlog @Dec. 31, 2017
1Q18 Revenues
1Q18 Contracts Acquisition
1Q 2018 BACKLOG (€ mn)
(*) E&C Onshore including Floaters business and XSight
4,644
803
4,040
5,946
878 778
5,846
947 856
855 758
1,915 11,500 1,023
12,392

17
E&C Onshore* Drilling Offshore E&C Offshore Drilling Onshore
2018 2019 2020+
2,139
1,059 842
2,037
1,795 2,014
304
227 325
319
299 140
3,380 3,321
4,799
1Q 2018 BACKLOG BY YEAR OF EXECUTION (€ mn)
(*) E&C Onshore including Floaters business and XSight

18
OFFSHORE DRILLING FLEET CONTRACTS
* ON STACKING MODE - TOTALLY WRITTEN OFF
Operative Optional period
CLIENT AREA
EniCyprus-Maroc-
Portugal-Mozamb.
Eni Egypt
JV Eni-Partner Black Sea
Shell - Total - AkerBP Norway
Eni Indonesia
- -
NDC UAE
Saudi Aramco Saudi Arabia
Saudi Aramco Saudi Arabia
Petrobel Egypt
- -
TENDER ASSISTED Eni - Total Congo
SHA
LLO
W-W
ATE
R
HI S
PEC
STAN
DAR
D
ULT
RA
D
EEP-
WA
TER
and
H
AR
SH E
NV
.
DEE
P-W
ATE
R
Saipem 12000
Saipem 10000
Scarabeo 9
Scarabeo 8
Scarabeo 7
Scarabeo 5*
Perro Negro 8
Perro Negro 7
Perro Negro 5
Perro Negro 4
Perro Negro 2*
TAD
2018 2019 2020
Preparation for Mozambique
TO 2022>
TO 2024>
New Contracts awarded year-to-date
19
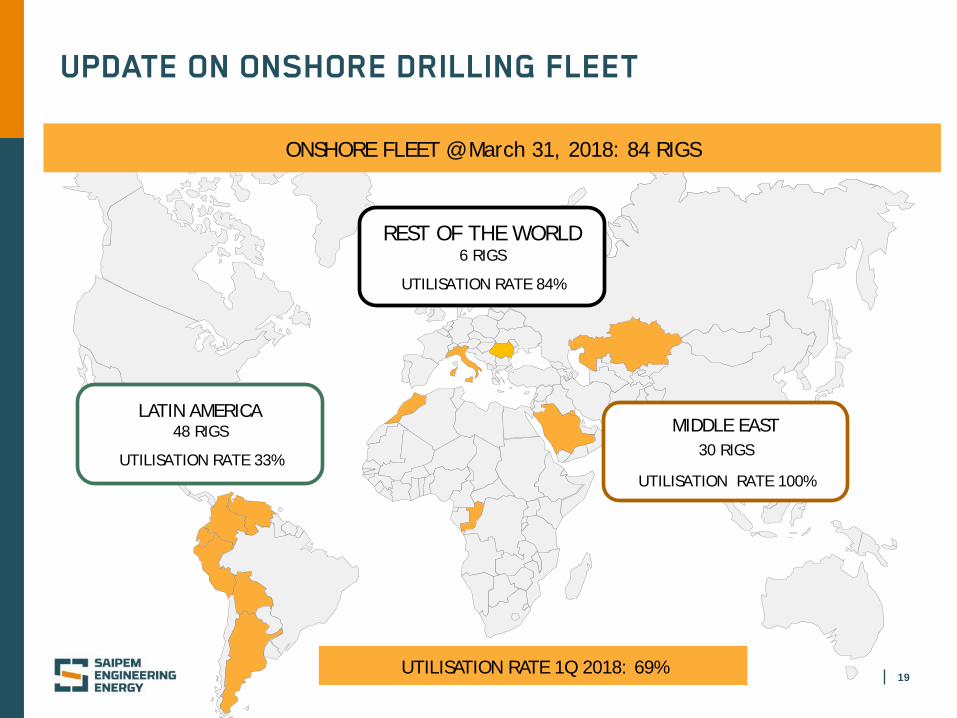
UPDATE ON ONSHORE DRILLING FLEET
ONSHORE FLEET @ March 31, 2018: 84 RIGS
LATIN AMERICA 48 RIGS
UTILISATION RATE 33%
MIDDLE EAST 30 RIGS
UTILISATION RATE 100%
REST OF THE WORLD 6 RIGS
UTILISATION RATE 84%
UTILISATION RATE 1Q 2018: 69%

CLOSING REMARKS AND 2018 GUIDANCE UPDATE

21
2018 GUIDANCE UPDATED
Metrics FY 2018
Revenues
CAPEX *
Net financial position *
EBITDA Adjusted % margin
c. €8bn
>10%
c. €500mn
c. €1.3bn
(*) Updated post vessel acquisition

22
CLOSING REMARKS
GOOD PROJECT EXECUTION DELIVERING SOLID OPERATIONAL MARGINS
ACCESS TO TIE-BACK MARKET, STRENGTHENING SAIPEM GLOBAL SUBSEA OFFERING
POSITIVE CASH GENERATION DRIVING NET DEBT REDUCTION
GOOD VISIBILITY ON NEW PROJECTS - NOT YET REFLECTED IN FIDs / AWARDS

APPENDIX

24
1Q 2018 RESULTS QoQ TREND (€ mn)
Adjusted EBITDA Revenues Adjusted Net Result
(105)
11
1Q18 4Q17 1Q18 4Q17 1Q18 4Q17
1,915
2,126
169
214
7.9% 11.2% margin

25
1Q 2018 RESULTS QoQ TREND (€ mn)
(*) E&C Onshore including Floaters business and XSight
1Q18 4Q17 1Q18 4Q17
Adj. EBITDA Revenues
E&C OFFSHORE
1Q18 4Q17 1Q18 4Q17
E&C ONSHORE*
1Q18 4Q17 1Q18 4Q17
Adj. EBITDA Revenues
DRILLING OFFSHORE
1Q18 4Q17 1Q18 4Q17
DRILLING ONSHORE
1,219
878
(95)
26
116
137
53
81
124 118
27 32
803
646 156
103
Adj. EBITDA Revenues
Adj. EBITDA Revenues
24.1% 12.8% margin (7.8)% 3.0% margin
59.1% 45.7% margin 21.8% 27.1% margin
26
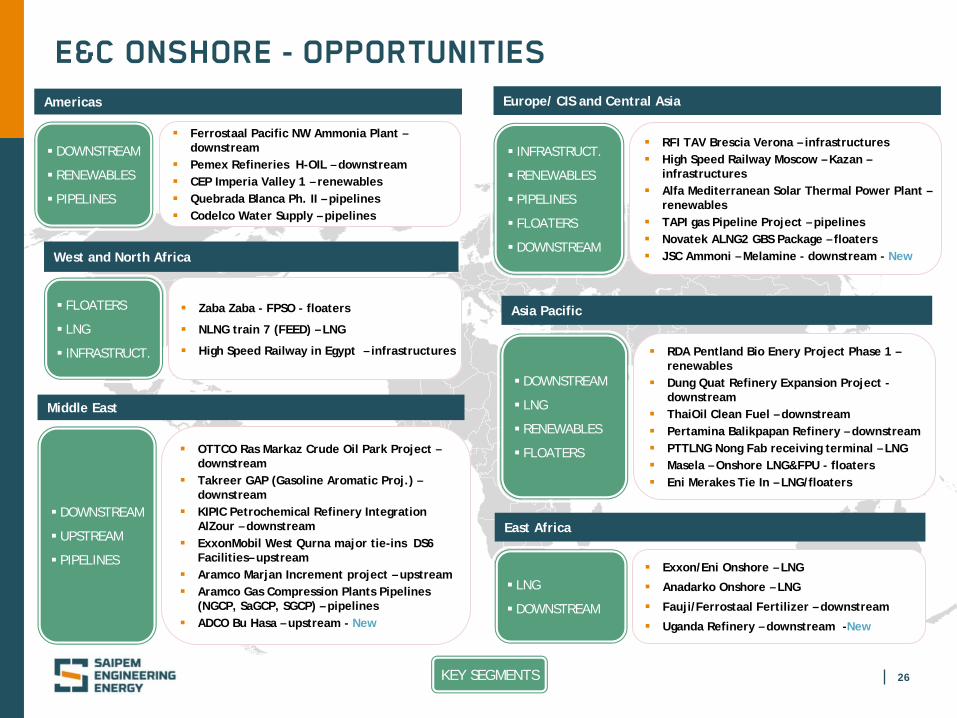
E&C ONSHORE - OPPORTUNITIES
KEY SEGMENTS
DOWNSTREAM
RENEWABLES
PIPELINES
Americas
Ferrostaal Pacific NW Ammonia Plant – downstream
Pemex Refineries H-OIL – downstream CEP Imperia Valley 1 – renewables Quebrada Blanca Ph. II – pipelines Codelco Water Supply – pipelines
West and North Africa
FLOATERS
LNG
INFRASTRUCT.
Zaba Zaba - FPSO - floaters
NLNG train 7 (FEED) – LNG
High Speed Railway in Egypt – infrastructures
East Africa
LNG
DOWNSTREAM
Exxon/Eni Onshore – LNG
Anadarko Onshore – LNG
Fauji/Ferrostaal Fertilizer – downstream
Uganda Refinery – downstream -New
Europe/ CIS and Central Asia
INFRASTRUCT.
RENEWABLES
PIPELINES
FLOATERS
DOWNSTREAM
RFI TAV Brescia Verona – infrastructures High Speed Railway Moscow – Kazan –
infrastructures Alfa Mediterranean Solar Thermal Power Plant –
renewables TAPI gas Pipeline Project – pipelines Novatek ALNG2 GBS Package – floaters JSC Ammoni – Melamine - downstream - New
Middle East
DOWNSTREAM
UPSTREAM
PIPELINES
OTTCO Ras Markaz Crude Oil Park Project – downstream
Takreer GAP (Gasoline Aromatic Proj.) – downstream
KIPIC Petrochemical Refinery Integration AlZour – downstream
ExxonMobil West Qurna major tie-ins DS6 Facilities– upstream
Aramco Marjan Increment project – upstream Aramco Gas Compression Plants Pipelines
(NGCP, SaGCP, SGCP) – pipelines ADCO Bu Hasa – upstream - New
Asia Pacific
DOWNSTREAM
LNG
RENEWABLES
FLOATERS
RDA Pentland Bio Enery Project Phase 1 – renewables
Dung Quat Refinery Expansion Project - downstream
ThaiOil Clean Fuel – downstream Pertamina Balikpapan Refinery – downstream PTTLNG Nong Fab receiving terminal – LNG Masela – Onshore LNG&FPU - floaters Eni Merakes Tie In – LNG/floaters

27
E&C OFFSHORE - OPPORTUNITIES
KEY SEGMENTS
ConocoPhillips Barossa Field Dev. – subsea/pipelines
ONGC KG-98/2 – subsea (URF+SPS)
West Africa and Brazil
Asia Pacific
North of Europe
Arabian/Persian Gulf
East Africa
SUBSEA FIXED
FACILITIES PIPELINES
GOM and NW Atlantic
SUBSEA
MMO
FIXED FACILITIES
PIPELINES
OFFSHORE WIND
FIXED FACILITIES
DECOMMIS-SIONING
PIPELINES SUBSEA
SUBSEA
PIPELINES
Eni Amoca-Mitzon Field – fixed facilities
ExxonMobil Liza future dev. – subsea
Chevron Anchor and Tigris – subsea tiebacks - New
Eni Zabazaba – subsea
CEC Phase 2 Open Cycle – MMO
SNE Development Phase 1 – subsea
Petrobras Libra Developments – subsea
Shell Bonga South West Aparo – subsea
BP Tortue LNG terminal – fixed facilities - New
EDF Fecamp Offshore Windfarm – renewables
EDF Courseulles Offshore Windfarm – renewables
ENGIE Eoliennes en Mer – renewables
Statoil Garantiana– subsea
Chevron Rosebank – subsea tieback - New
Mediterranean, Black and Caspian Sea
SUBSEA
FIXED FACILITIES
PIPELINES
S. Aramco LTA development – fixed facilities
Rasgas Barzan Subsea Pipelines – pipelines
Eni Mamba – subsea
Anadarko Golfinho – subsea
PIPELINES
SUBSEA
Eni Shorouk (Zohr) future dev. – subsea/pipelines
ExxonMobil Neptune – pipelines/subsea
Total Absheron – pipelines - New
28
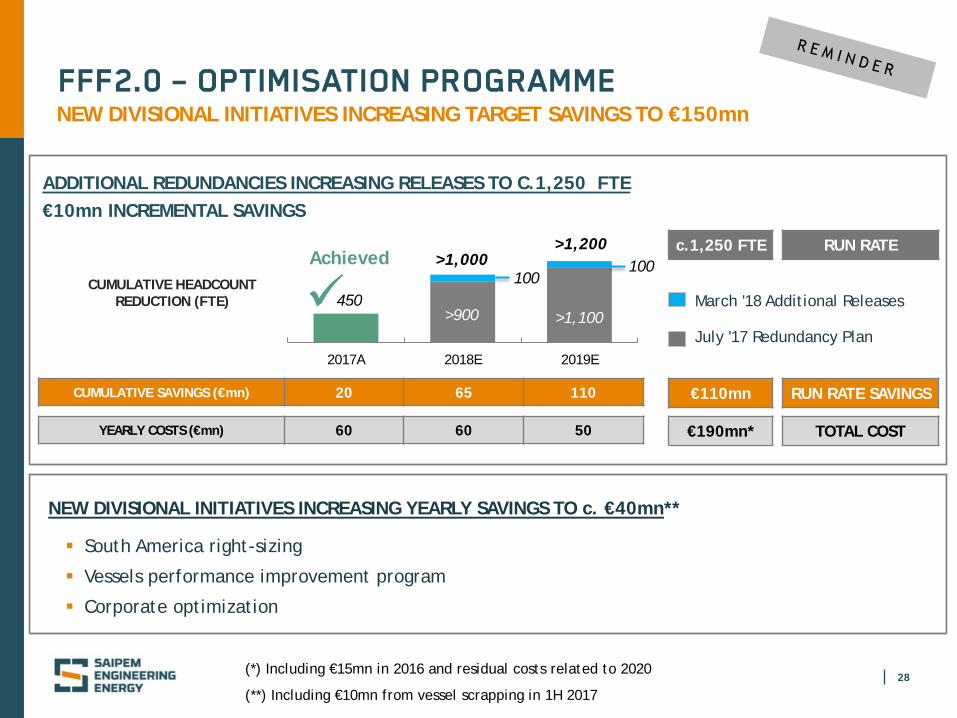
FFF2.0 – OPTIMISATION PROGRAMME
>900
2017A 2018E 2019E
450
>1,000 >1,200
Achieved
March '18 Additional Releases >900 >1,100
ADDITIONAL REDUNDANCIES INCREASING RELEASES TO C.1,250 FTE €10mn INCREMENTAL SAVINGS
CUMULATIVE HEADCOUNT REDUCTION (FTE)
RUN RATE c.1,250 FTE
July '17 Redundancy Plan
YEARLY COSTS (€mn) 60 60 50 €190mn* TOTAL COST
(*) Including €15mn in 2016 and residual costs related to 2020
(**) Including €10mn from vessel scrapping in 1H 2017
NEW DIVISIONAL INITIATIVES INCREASING TARGET SAVINGS TO €150mn
100 100
CUMULATIVE SAVINGS (€mn) 20 65 110 €110mn RUN RATE SAVINGS
NEW DIVISIONAL INITIATIVES INCREASING YEARLY SAVINGS TO c. €40mn**
South America right-sizing
Vessels performance improvement program
Corporate optimization