Embed Size (px)
Citation preview

1H21
Earnings Release
2021.08.06
WEBZEN Inc.

Disclaimer
2
Some contents may reflect forward-looking statements and have been
prepared based on the expectations according to the datas on which
these statements were made.
There can be no assurance that the forward-looking statements used
by WEBZEN are correct as results can differ from expectations.
Therefore, WEBZEN will not be responsible for individual investment
decisions based solely on this material.
WEBZEN disclaims any duty to update the information in this material
to reflect future events or circumstances.
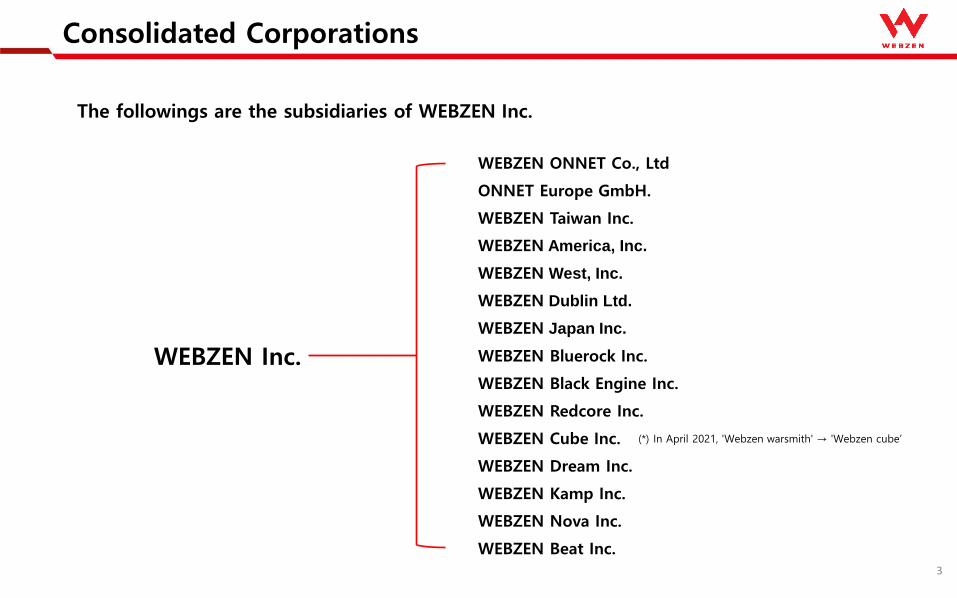
Consolidated Corporations
3
The followings are the subsidiaries of WEBZEN Inc.
WEBZEN ONNET Co., Ltd
ONNET Europe GmbH.
WEBZEN Taiwan Inc.
WEBZEN America, Inc.
WEBZEN West, Inc.
WEBZEN Dublin Ltd.
WEBZEN Japan Inc.
WEBZEN Bluerock Inc.
WEBZEN Black Engine Inc.
WEBZEN Redcore Inc.
WEBZEN Cube Inc.
WEBZEN Dream Inc.
WEBZEN Inc.
WEBZEN Kamp Inc.
WEBZEN Nova Inc.
WEBZEN Beat Inc.
(*) In April 2021, 'Webzen warsmith' → 'Webzen cube’

1H21 Result Analysis
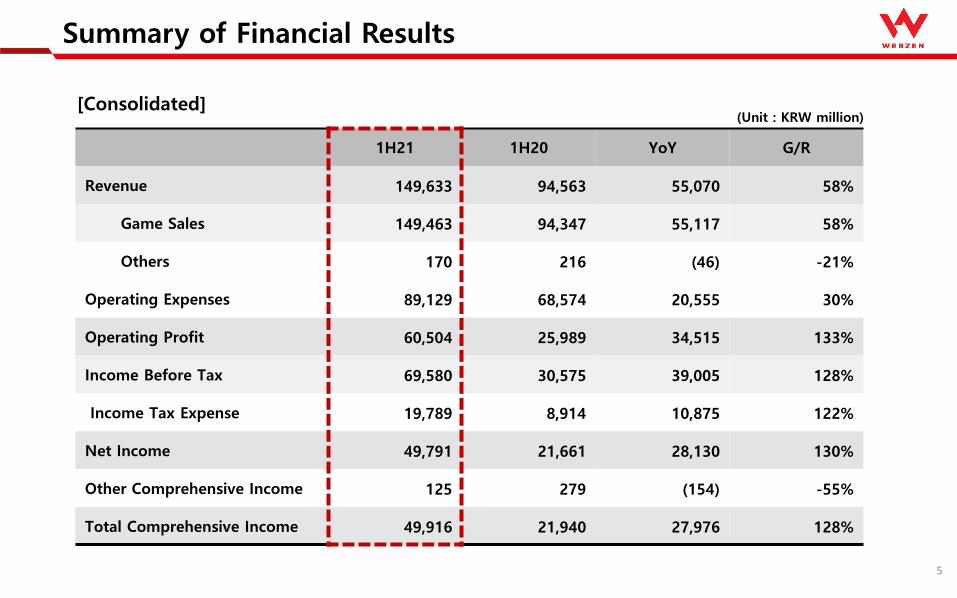
Summary of Financial Results
5
(Unit : KRW million)
1H21 1H20 YoY G/R
Revenue 149,633 94,563 55,070 58%
Game Sales 149,463 94,347 55,117 58%
Others 170 216 (46) -21%
Operating Expenses 89,129 68,574 20,555 30%
Operating Profit 60,504 25,989 34,515 133%
Income Before Tax 69,580 30,575 39,005 128%
Income Tax Expense 19,789 8,914 10,875 122%
Net Income 49,791 21,661 28,130 130%
Other Comprehensive Income 125 279 (154) -55%
Total Comprehensive Income 49,916 21,940 27,976 128%
[Consolidated]
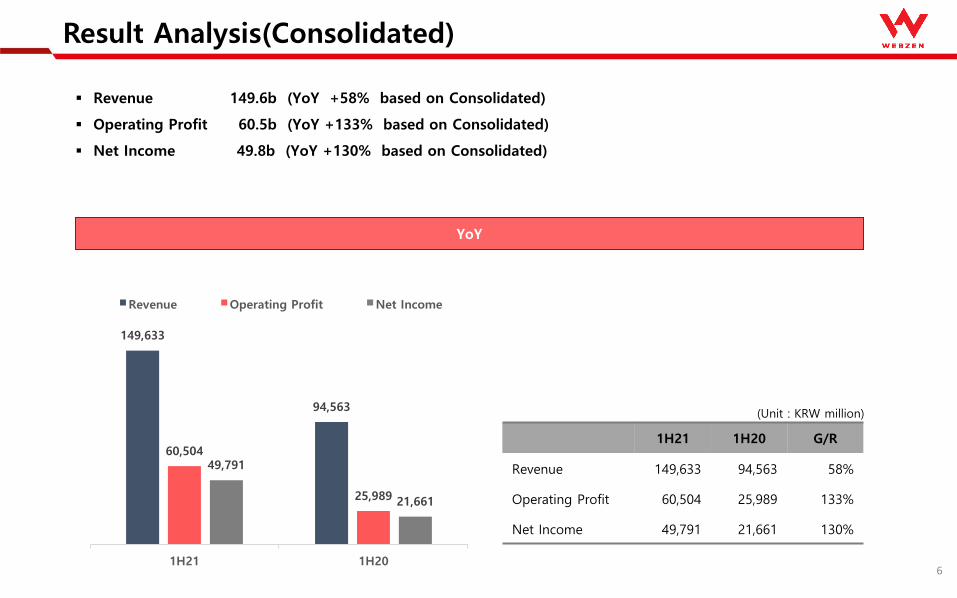
Result Analysis(Consolidated)
6
▪ Revenue 149.6b (YoY +58% based on Consolidated)
▪ Operating Profit 60.5b (YoY +133% based on Consolidated)
▪ Net Income 49.8b (YoY +130% based on Consolidated)
YoY
(Unit : KRW million)
1H21 1H20 G/R
Revenue 149,633 94,563 58%
Operating Profit 60,504 25,989 133%
Net Income 49,791 21,661 130%
149,633
94,563
60,504
25,989
49,791
21,661
1H21 1H20
Revenue Operating Profit Net Income
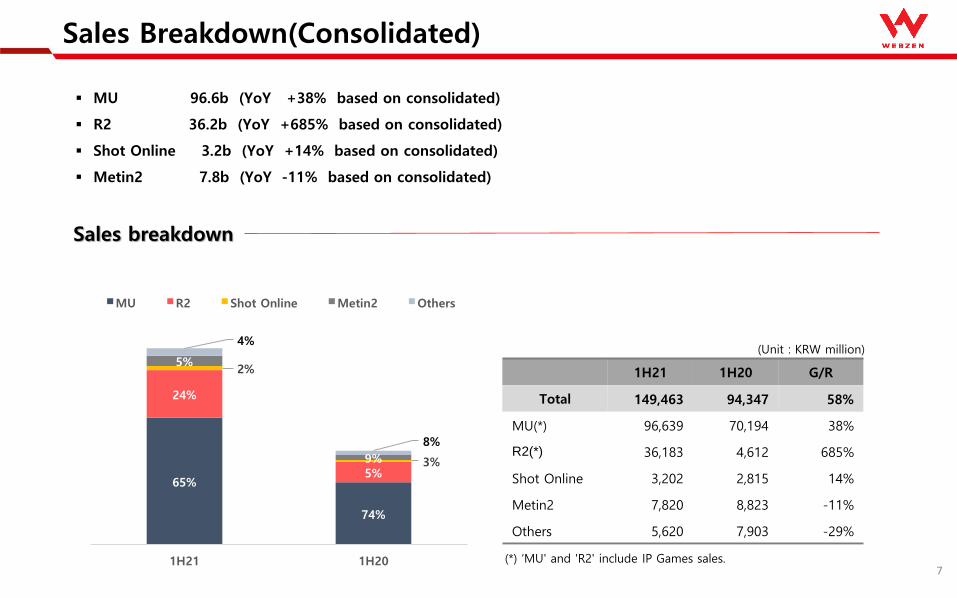
Sales Breakdown(Consolidated)
7
▪ MU 96.6b (YoY +38% based on consolidated)
▪ R2 36.2b (YoY +685% based on consolidated)
▪ Shot Online 3.2b (YoY +14% based on consolidated)
▪ Metin2 7.8b (YoY -11% based on consolidated)
Sales breakdown
(Unit : KRW million)
1H21 1H20 G/R
Total 149,463 94,347 58%
MU(*) 96,639 70,194 38%
R2(*) 36,183 4,612 685%
Shot Online 3,202 2,815 14%
Metin2 7,820 8,823 -11%
Others 5,620 7,903 -29%
(*) ‘MU' and 'R2' include IP Games sales.
65%
74%
24%
5%
2%
3%
5%
9%
4%
8%
1H21 1H20
MU R2 Shot Online Metin2 Others

Sales Breakdown(Consolidated)
8
▪ Domestic Sales 95.0b (YoY +99% based on consolidated)
▪ Overseas Sales 54.5b (YoY +17% based on consolidated)
▪ Portion of Domestic YoY +13%P based on consolidated
Sales breakdown
1H21 1H20 G/R
Total 149,463 94,347 58%
Domestic 95,007 47,754 99%
Overseas 54,456 46,592 17%
(Unit : KRW million)
64%
51%
36%
49%
1H21 1H20
Domestic Overseas

Expenses Breakdown(Consolidated)
9
▪ Operating Expenses 89.1b (YoY +30% based on consolidated)
- Fees 45.3b (YoY +50% based on consolidated)
- Labor 30.7b (YoY +24% based on consolidated)
- Marketing 6.0b (YoY -6% based on consolidated)
Expenses Breakdown
1H21 1H20 G/R
Total 89,129 68,574 30%
Fees 45,272 30,123 50%
Labor 30,715 24,816 24%
Marketing 6,020 6,385 -6%
D&A 2,390 2,940 -19%
Network 596 623 -4%
Tax & Dues 2,776 2,289 21%
Others 1,360 1,398 -3%
(Unit : KRW million)
51%
44%
34%
36%
7%
9%
3%
4%
1%
1%
3%
3%
2%
2%
1H21 1H20
Fees Labor Marketing D&A Network Tax&Dues Others

2Q21 Result Analysis
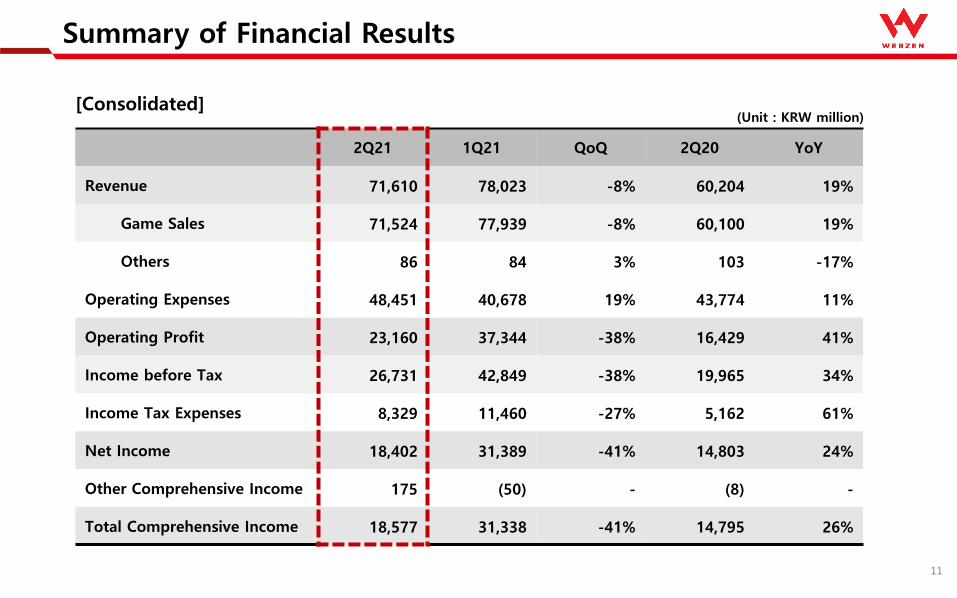
Summary of Financial Results
11
2Q21 1Q21 QoQ 2Q20 YoY
Revenue 71,610 78,023 -8% 60,204 19%
Game Sales 71,524 77,939 -8% 60,100 19%
Others 86 84 3% 103 -17%
Operating Expenses 48,451 40,678 19% 43,774 11%
Operating Profit 23,160 37,344 -38% 16,429 41%
Income before Tax 26,731 42,849 -38% 19,965 34%
Income Tax Expenses 8,329 11,460 -27% 5,162 61%
Net Income 18,402 31,389 -41% 14,803 24%
Other Comprehensive Income 175 (50) - (8) -
Total Comprehensive Income 18,577 31,338 -41% 14,795 26%
(Unit : KRW million)[Consolidated]
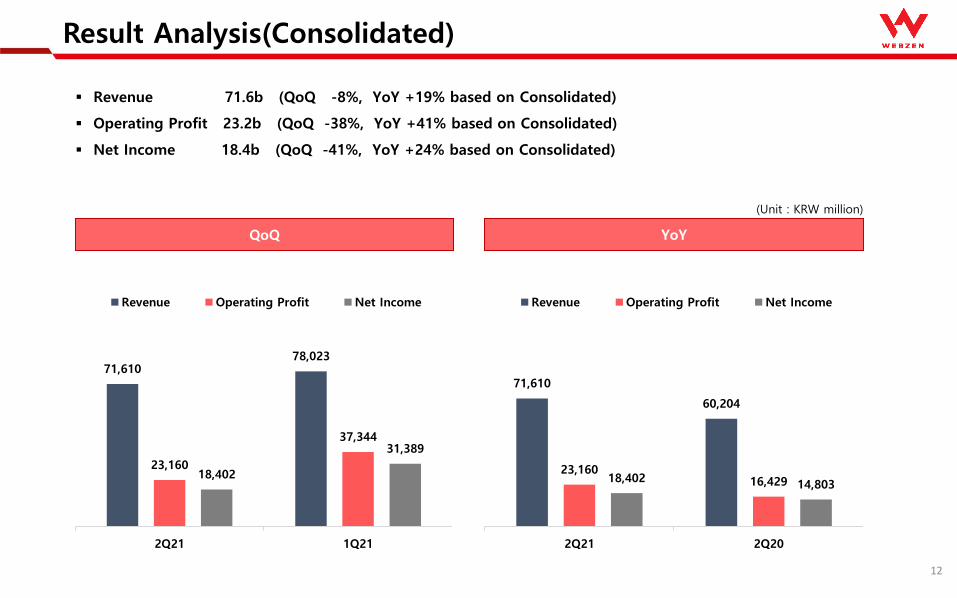
Result Analysis(Consolidated)
12
▪ Revenue 71.6b (QoQ -8%, YoY +19% based on Consolidated)
▪ Operating Profit 23.2b (QoQ -38%, YoY +41% based on Consolidated)
▪ Net Income 18.4b (QoQ -41%, YoY +24% based on Consolidated)
QoQ YoY
(Unit : KRW million)
71,61078,023
23,160
37,344
18,402
31,389
2Q21 1Q21
Revenue Operating Profit Net Income
71,610
60,204
23,16016,42918,402
14,803
2Q21 2Q20
Revenue Operating Profit Net Income
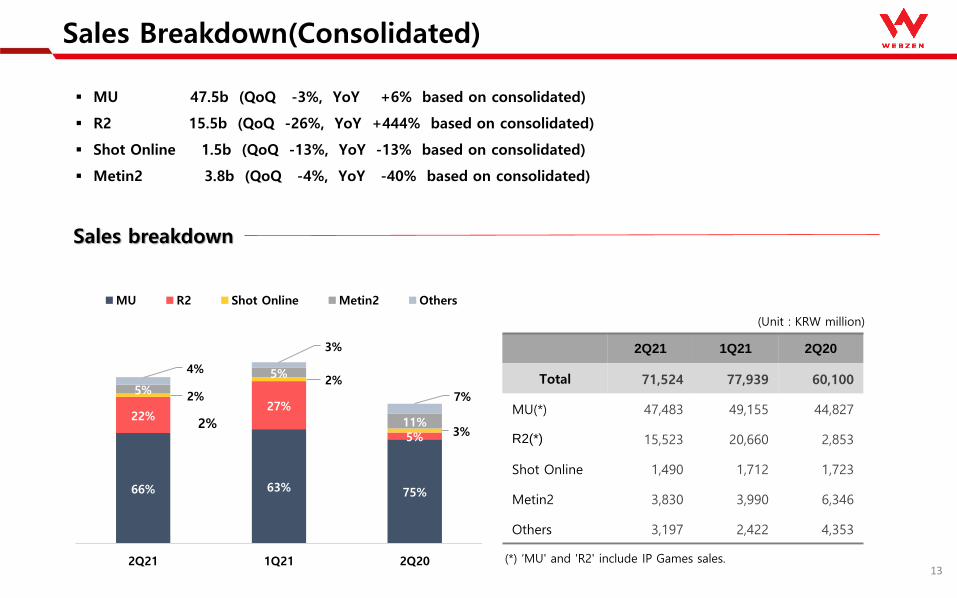
Sales Breakdown(Consolidated)
13
▪ MU 47.5b (QoQ -3%, YoY +6% based on consolidated)
▪ R2 15.5b (QoQ -26%, YoY +444% based on consolidated)
▪ Shot Online 1.5b (QoQ -13%, YoY -13% based on consolidated)
▪ Metin2 3.8b (QoQ -4%, YoY -40% based on consolidated)
Sales breakdown
(Unit : KRW million)
2Q21 1Q21 2Q20
Total 71,524 77,939 60,100
MU(*) 47,483 49,155 44,827
R2(*) 15,523 20,660 2,853
Shot Online 1,490 1,712 1,723
Metin2 3,830 3,990 6,346
Others 3,197 2,422 4,353
2%
(*) ‘MU' and 'R2' include IP Games sales.
66% 63% 75%
22%27%
5%
2%
2%
3%
5%
5%
11%
4%
3%
7%
2Q21 1Q21 2Q20
MU R2 Shot Online Metin2 Others
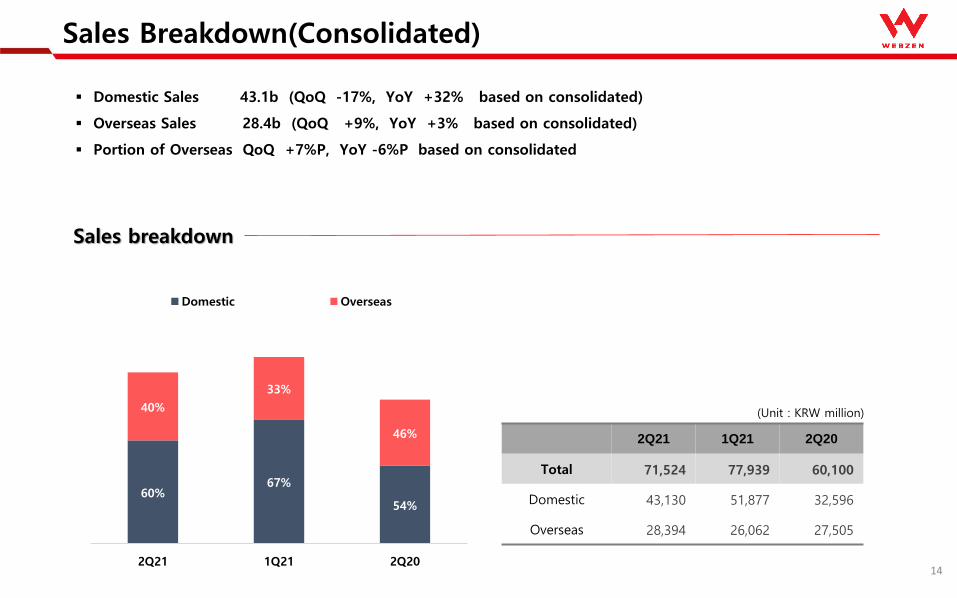
Sales Breakdown(Consolidated)
14
▪ Domestic Sales 43.1b (QoQ -17%, YoY +32% based on consolidated)
▪ Overseas Sales 28.4b (QoQ +9%, YoY +3% based on consolidated)
▪ Portion of Overseas QoQ +7%P, YoY -6%P based on consolidated
Sales breakdown
2Q21 1Q21 2Q20
Total 71,524 77,939 60,100
Domestic 43,130 51,877 32,596
Overseas 28,394 26,062 27,505
(Unit : KRW million)
60%67%
54%
40%
33%
46%
2Q21 1Q21 2Q20
Domestic Overseas

Expenses Breakdown(Consolidated)
15
▪ Operating Expenses 48.5b (QoQ +19%, YoY +11% based on consolidated)
- Fees 22.5b (QoQ -2%, YoY +3% based on consolidated)
- Labor tendencies 16.8b (QoQ +20%, YoY +34% based on consolidated)
- Marketing 5.4b (QoQ +706%, YoY -7% based on consolidated)
Expenses Breakdown
2Q21 1Q21 2Q20
Total 48,451 40,678 43,774
Fees 22,458 22,813 21,774
Labor 16,768 13,947 12,555
Marketing 5,355 665 5,731
D&A 1,165 1,225 1,455
Network 333 263 293
Tax & Dues 1,391 1,385 1,248
Others 980 380 718
(Unit : KRW million)
46% 56% 50%
35% 34% 29%
11%
2% 13%2%
3%3%
1%
1%1%
3%
3%3%
2%
1%2%
2Q21 1Q21 2Q20
Fees Labor Marketing D&A Network Tax&Dues Others
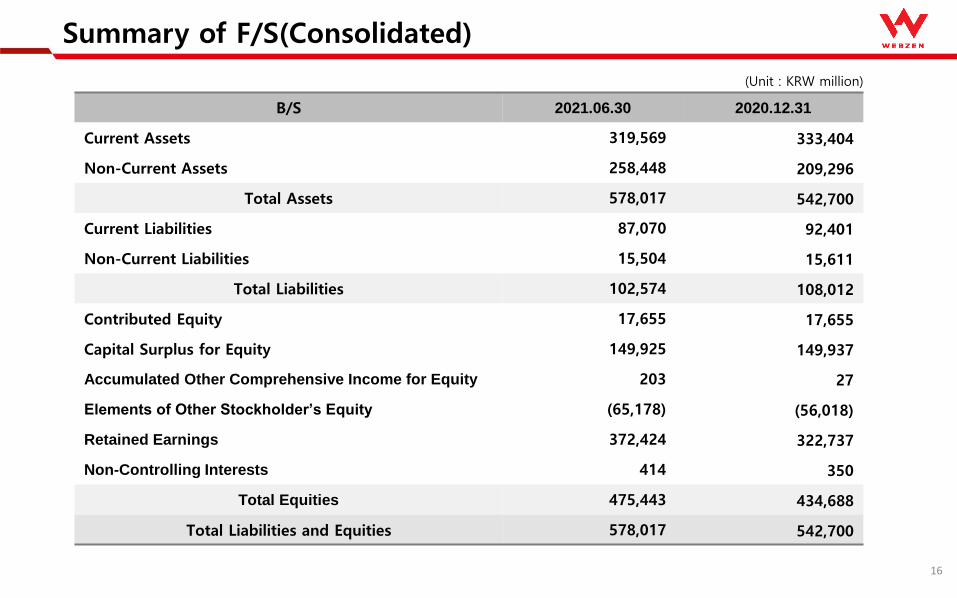
Summary of F/S(Consolidated)
16
(Unit : KRW million)
B/S 2021.06.30 2020.12.31
Current Assets 319,569 333,404
Non-Current Assets 258,448 209,296
Total Assets 578,017 542,700
Current Liabilities 87,070 92,401
Non-Current Liabilities 15,504 15,611
Total Liabilities 102,574 108,012
Contributed Equity 17,655 17,655
Capital Surplus for Equity 149,925 149,937
Accumulated Other Comprehensive Income for Equity 203 27
Elements of Other Stockholder’s Equity (65,178) (56,018)
Retained Earnings 372,424 322,737
Non-Controlling Interests 414 350
Total Equities 475,443 434,688
Total Liabilities and Equities 578,017 542,700
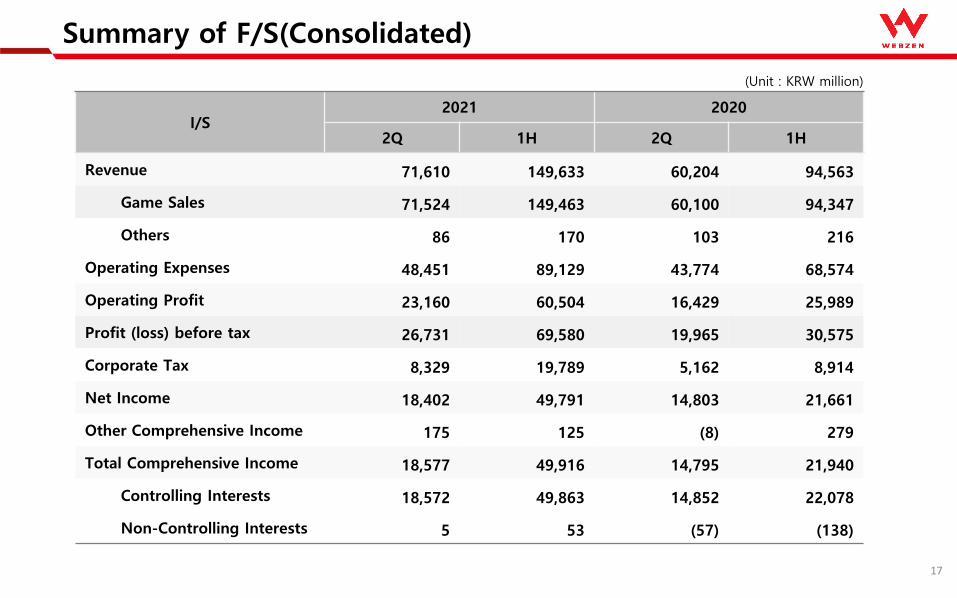
Summary of F/S(Consolidated)
17
I/S2021 2020
2Q 1H 2Q 1H
Revenue 71,610 149,633 60,204 94,563
Game Sales 71,524 149,463 60,100 94,347
Others 86 170 103 216
Operating Expenses 48,451 89,129 43,774 68,574
Operating Profit 23,160 60,504 16,429 25,989
Profit (loss) before tax 26,731 69,580 19,965 30,575
Corporate Tax 8,329 19,789 5,162 8,914
Net Income 18,402 49,791 14,803 21,661
Other Comprehensive Income 175 125 (8) 279
Total Comprehensive Income 18,577 49,916 14,795 21,940
Controlling Interests 18,572 49,863 14,852 22,078
Non-Controlling Interests 5 53 (57) (138)
(Unit : KRW million)

Thank you