Embed Size (px)
Citation preview

April 16, 2015
JIN Co., Ltd.
1H FY08/15 Earnings Presentation
P_2 1H FY08/15 Earnings Presentation © JIN CO., LTD. ALL Rights Reserved.
Disclaimer Forward-looking statements contained within this presentation are based upon assumptions deemed reasonable by the company at the time of writing, and may differ significantly from actual results due to a wide range of factors.

P_3 1H FY08/15 Earnings Presentation © JIN CO., LTD. ALL Rights Reserved. 1H FY08/15 Earnings Results
Sales JPY17.7bn (+0.6%) OP 0.8bn (-8.1%) Comp. store sales -16.8%
(1H average)
(YoY change in parentheses)
1H FY08/15 Highlights
Control

P_4 1H FY08/15 Earnings Presentation © JIN CO., LTD. ALL Rights Reserved.
Comparable Store Sales
既存店増収率
(%)
Comp. store sales (1H FY08/15 average) -16.8%
1H FY08/15 Earnings Results
-7.0%
(30.0)
(20.0)
(10.0)
0.0
10.0
20.0
30.0
40.0
50.0
60.0
70.0
12.8月 13.2月 13.8月 14.2月 14.8月 15.2月
FY08/14 -21.4%
FY08/13 +31.4%
1H FY08/15 -16.8%
Comparable store sales grow
th (%)
Aug. 2012 Feb. 2013 Feb. 2014 Feb. 2015 Aug. 2014 Aug. 2013

P_5 1H FY08/15 Earnings Presentation © JIN CO., LTD. ALL Rights Reserved.
Store Count
267 Stores 275 Stores
As of Aug. 31, 2014 As of Feb. 28, 2015
+3.0%
*Figures are for domestic, directly-managed JINS eyewear stores
1H FY08/15 Earnings Results

P_6 1H FY08/15 Earnings Presentation © JIN CO., LTD. ALL Rights Reserved.
Eyewear Sales Composition
Units Sold
(Units) Prescription/Nonprescription PC/Non-PC
1H FY08/15 Earnings Results
Prescription Prescription Prescription
(Non-PC) Prescription (Non-PC)
Nonprescription
Nonprescription Nonprescription
(Non-PC) Nonprescription (Non-PC)
JINS PC (Prescription)
JINS PC (Prescription)
JINS PC (Packaged)
JINS PC (Packaged)
0
500,000
1,000,000
1,500,000
2,000,000
2,500,000
3,000,000
1H FY08/15 1H FY08/15 1H FY08/14 1H FY08/14

P_7 1H FY08/15 Earnings Presentation © JIN CO., LTD. ALL Rights Reserved.
Eyewear Average Unit Prices
Unit price per set
1H FY08/15 Earnings Results
1H FY08/15 1H FY08/14 ¥0
¥1,000
¥2,000
¥3,000
¥4,000
¥5,000
¥6,000
¥7,000

P_8 1H FY08/15 Earnings Presentation © JIN CO., LTD. ALL Rights Reserved.
Gross Profit Margin
72.0% 74.2%
1H FY08/14 1H FY08/15
+2.2pp
1H FY08/15 Earnings Results

P_9 1H FY08/15 Earnings Presentation © JIN CO., LTD. ALL Rights Reserved.
SG&A-to-Sales Ratio
66.4% 69.2%
+2.8pp
1H FY08/15 Earnings Results
1H FY08/14 1H FY08/15

P_10 1H FY08/15 Earnings Presentation © JIN CO., LTD. ALL Rights Reserved.
Key Changes in SG&A Expenses (Figures in parentheses are versus sales)
1. Advertising expenses
JPY1.8bn (10.3%) JPY0.8bn (4.8%)
YoY change versus sales
-5.5pp
2. Personnel expenses
JPY3.5bn (20.2%) JPY4.0bn (23.1%)
YoY change versus sales +2.9pp
3. Rental expenses
JPY2.3bn (13.3%) JPY2.9bn (16.5%)
YoY change versus sales
+3.2pp
1H FY08/15 Earnings Results
1H FY08/14 1H FY08/15
1H FY08/14 1H FY08/15
1H FY08/14 1H FY08/15

P_11 1H FY08/15 Earnings Presentation © JIN CO., LTD. ALL Rights Reserved.
Operating Profit
JPY0.89bn 1H FY08/15
(-8.1% YoY)
1H FY08/15 Earnings Results

P_12 1H FY08/15 Earnings Presentation © JIN CO., LTD. ALL Rights Reserved.
Key Changes in Financial Position
1. Inventory
JPY2.7bn JPY3.0bn YoY change
+0.9%
2. Net assets
JPY12.4bn JPY12.5bn
+9.4%
YoY change
As of Aug. 31, 2014 As of Feb. 28, 2015
As of Aug. 31, 2014 As of Feb. 28, 2015
1H FY08/15 Earnings Results

P_13 1H FY08/15 Earnings Presentation © JIN CO., LTD. ALL Rights Reserved.
Cash Flows 1H FY08/14 1H FY08/15
Operating cash flow
Investment cash flow
Financial cash flow
-JPY0.35bn JPY1.39bn
-2.63bn -1.87bn
-0.02bn
Cash and equivalents JPY2.51bn JPY3.04bn
YoY change
+1.74bn
+0.75bn
+0.83bn
+0.53bn
-0.86bn
1H FY08/15 Earnings Results

P_14 1H FY08/15 Earnings Presentation © JIN CO., LTD. ALL Rights Reserved.

1H FY08/15
Earnings Presentation
DATABOOK
April 16, 2015
JIN Co., Ltd.

16
1H FY08/15 Earnings Results
(JPYmn, %)
Comments
Amount Vs. sales YoY Vs.estimates Amount Vs. sales Amount Vs. sales
Sales 17,744 100.0 0.6 -0.9 17,632 100.0 17,910 100.0 Eyewear store sales exceeded forecasts, but e-commerce and accessoriessales did not meet targets, causing 1H sales to fall short of plans by 0.9%.
Gross profit 13,172 74.2 3.8 -0.4 12,687 72.0 13,220 73.8 Effects of a weak yen on purchasing were limited due to higher sales ofvalue-added products and fewer bargains. GPM was up by 2.2pp YoY.
SG&A expenses 12,279 69.2 4.8 -2.7 11,715 66.4 12,620 70.5 SG&A-to-sales ratio rose due to lower sales growth. Revenue-linked expenses,delayed expenses, and cost reductions caused a 2.7% reduction vs. plans.
Personnel 4,099 23.1 15.2 -1.1 3,559 20.2 4,144 23.1 A planned increase in personnel spending with the aim of improving storeoperations resulted in a 15.2% YoY increase.
Advertising 845 4.8 -53.4 -1.1 1,816 10.3 855 4.8 Down by half YoY due to the timing of new product introductions.
Rental (excl. company housing) 2,931 16.5 25.3 -3.4 2,340 13.3 3,035 16.9 Up by 25.3% YoY as store openings from the previous year were countedand China operations were consolidated.
Depreciation (incl. retired assets) 922 5.2 26.8 -2.3 727 4.1 944 5.3 Same as above.
Leases paid 326 1.8 25.2 -7.1 260 1.5 351 2.0 Same as above.
Fees paid 1,201 6.8 5.3 -15.2 1,141 6.5 1,417 7.9 A portion of outsourcing expenses will not be booked until 2H, causing a15.2% reduction vs. plans.
Supplies 589 3.3 4.6 9.9 563 3.2 536 3.0
Other 1,364 7.7 4.5 2.0 1,306 7.4 1,338 7.5
Operating profit 893 5.0 -8.1 48.9 972 5.5 600 3.4 Lower sales were covered by higher GPM. Higher than planned due to lower revenue-linked expenses, delayed booking of outsourcing expenses, and cost reductions.
Non-operating profit -50 -0.3 -1.6 151.0 -50 -0.3 -20 -0.1 Foreign exchange losses JPY30mn higher than target due to the yen beingweaker than expected.
Recurring profit 842 4.8 -8.5 45.3 921 5.2 580 3.2
Extraordinary profit -90 -0.5 -19.5 3.3 -112 -0.6 -88 -0.5 Extraordinary losses recorded for store renovations and closings.
Earnings before income taxes 752 4.2 -7.0 52.9 808 4.6 492 2.7
Income taxes 405 2.3 -4.0 74.7 422 2.4 232 1.3
Net income 346 2.0 -10.2 33.3 386 2.2 260 1.5
1H FY08/14Earnings Results
1H FY08/15EarningsEstimates
1H FY08/15Earnings Results

17
Sales
(JPYmn, %)
Amount Composition YoY Amount Composition Amount Composition
Total sales 17,744 100.0 0.6 17,632 100.0 17,910 100.0
Eyewear 16,397 92.4 -0.6 16,500 93.6 16,477 92.0
Stores (JINS) 15,801 89.0 1.6 15,552 88.2 15,787 88.1
E-commerce 596 3.4 -37.1 948 5.4 690 3.9
Accessories 1,347 7.6 19.1 1,131 6.4 1,433 8.0
Women's 566 3.2 11.5 508 2.9 620 3.5
Men's 780 4.4 25.2 622 3.5 813 4.5
Other 0 0.0 26.3 0 0.0 0 0.0
1H FY08/15Earnings Results
1H FY08/14Earnings Results
1H FY08/15Earnings Estimates
18
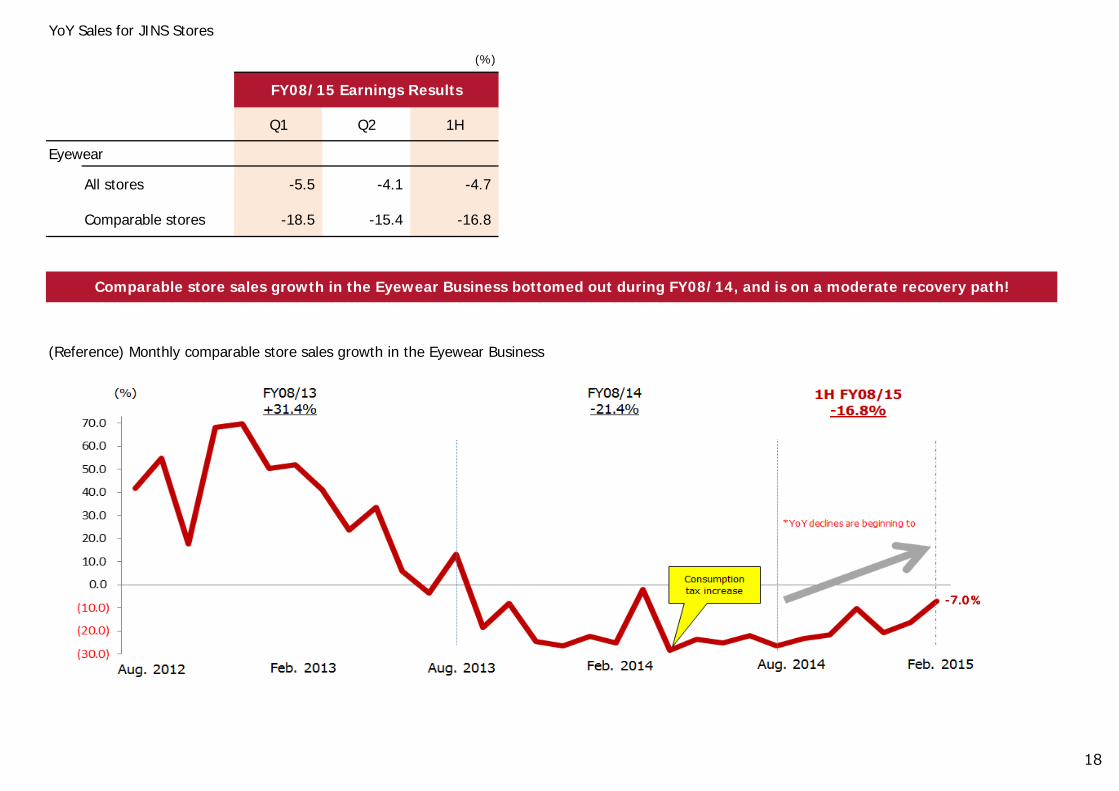
YoY Sales for JINS Stores
(%)
Q1 Q2 1H
Eyewear
All stores -5.5 -4.1 -4.7
Comparable stores -18.5 -15.4 -16.8
(Reference) Monthly comparable store sales growth in the Eyewear Business
Comparable store sales growth in the Eyewear Business bottomed out during FY08/14, and is on a moderate recovery path!
FY08/15 Earnings Results

19
Store Openings and Closings
*Domestic, directly-managed stores (Number of stores)
Openings ClosingsNet
increase(Reference)1H FY08/14
Beginningof year
Q1 Q2 Net increase Year-end
Eyewear 13 5 8 32 267 10 -2 17 25 292
Women's accessories 3 1 2 0 24 1 1 -1 1 25
Men's accessories 3 0 3 1 12 2 1 3 15
Total 19 6 13 33 303 13 0 16 29 332
Capital investment
(JPYmn) (%)
1H ResultsCapital investment amount 985 Results Previous year YoY
New stores (19 stores) 677 *Includes guarantees and deposits Gross profit margins 74.2 72.0 2.2
Renovated (5 stores) 194 Eyewear business 76.2 73.6 2.6
Other 113 Accessories business 50.8 48.1 2.8
Domestic store openings and closings
1H FY08/15 Results
For FY08/15, recovery in comparable store sales of the Eyewear Business is the top priority, and new store openings areplanned to be significantly reduced.
Gross profit margins
1H Results
Quarterly results (net)
2H Estimates

20
Balance Sheet
(JPYmn, %)
Amount Composition Amount Composition
Current assets 9,561 44.6 9,817 47.2 -256
(Cash and equivalents) 3,046 14.2 3,245 15.6 -198
(Accounts receivable) 2,240 10.5 2,459 11.8 -219
(Inventory) 3,047 14.2 2,784 13.4 263
Fixed assets 11,855 55.4 10,970 52.8 884
Tangible fixed assets 6,466 30.2 6,004 28.9 462
Intangible assets 899 4.2 943 4.5 -44
Investments and other 4,489 21.0 4,022 19.3 467
Total assets 21,416 100.0 20,788 100.0 627
Current liabilities 6,346 29.6 6,327 30.4 18
(Accounts payable) 1,204 5.6 845 4.1 359
(Short-term debt) 595 2.8 228 1.1 367
(Current portion of long-term debt 1,268 5.9 1,230 5.9 38
Long-term liabilities 2,535 11.8 2,041 9.8 494
(Long-term debt) 1,384 6.5 1,078 5.2 305
Total liabilities 8,881 41.5 8,369 40.3 512
Net assets 12,534 58.5 12,418 59.7 115
Assets and liabilities total 21,416 100.0 20,788 100.0 627
Key factorsYoYAs of Feb. 28, 2015 As of Aug. 31, 2014
China operations were consolidated, productinventories were up by JPY263mn YoY.
Although assets increased only slightly due torestrictions on new store openings for FY08/15,additional investment in the US caused fixed assetsto increase by JPY884mn.
*See comments for current assets
21
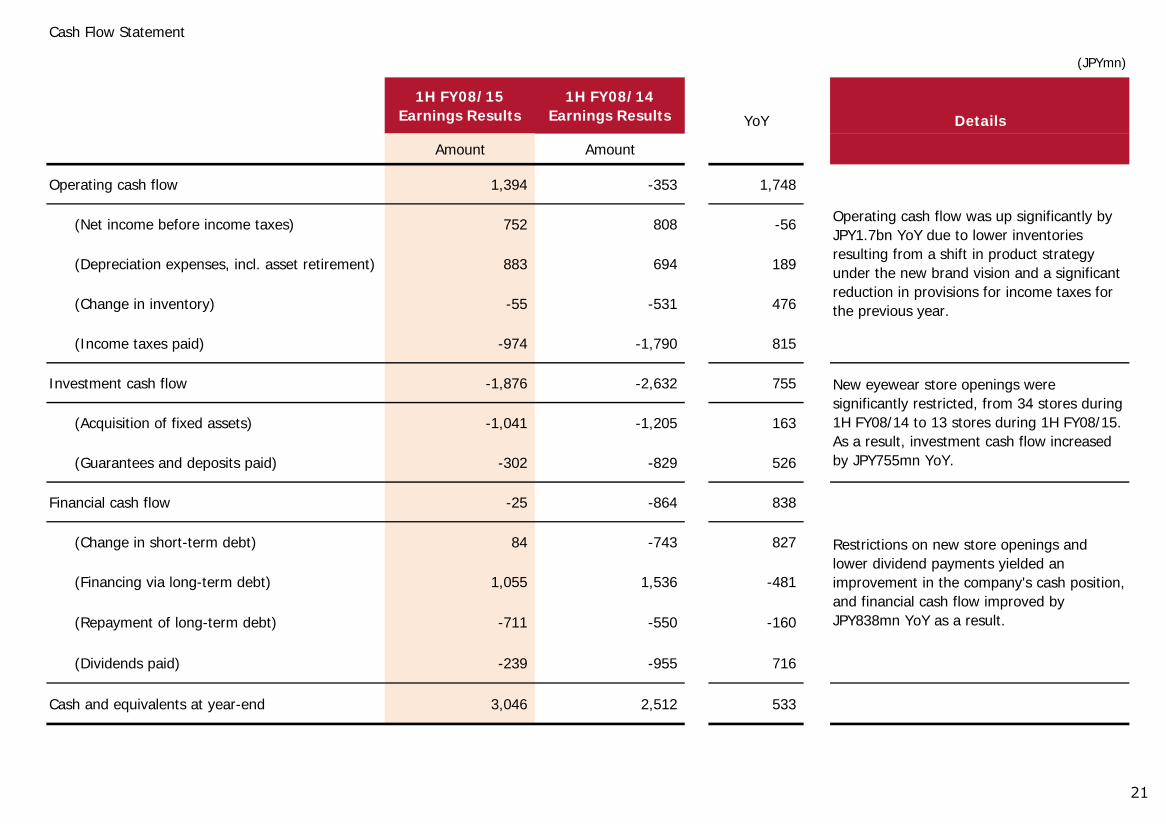
Cash Flow Statement
(JPYmn)
1H FY08/15Earnings Results
1H FY08/14Earnings Results
Amount Amount
Operating cash flow 1,394 -353 1,748
(Net income before income taxes) 752 808 -56
(Depreciation expenses, incl. asset retirement) 883 694 189
(Change in inventory) -55 -531 476
(Income taxes paid) -974 -1,790 815
Investment cash flow -1,876 -2,632 755
(Acquisition of fixed assets) -1,041 -1,205 163
(Guarantees and deposits paid) -302 -829 526
Financial cash flow -25 -864 838
(Change in short-term debt) 84 -743 827
(Financing via long-term debt) 1,055 1,536 -481
(Repayment of long-term debt) -711 -550 -160
(Dividends paid) -239 -955 716
Cash and equivalents at year-end 3,046 2,512 533
DetailsYoY
Operating cash flow was up significantly byJPY1.7bn YoY due to lower inventoriesresulting from a shift in product strategyunder the new brand vision and a significantreduction in provisions for income taxes forthe previous year.
New eyewear store openings weresignificantly restricted, from 34 stores during1H FY08/14 to 13 stores during 1H FY08/15.As a result, investment cash flow increasedby JPY755mn YoY.
Restrictions on new store openings andlower dividend payments yielded animprovement in the company's cash position,and financial cash flow improved byJPY838mn YoY as a result.

22
FY08/15 Earnings Forecasts
(JPYmn, %)
1H Progress Full-year Vs. sales Change Full-year Vs. sales
Sales 17744 43.9 40450 100.0 11.9 36150 100.0
Gross profit 13172 43.9 30000 74.2 14.5 26194 72.5
SG&A expenses 12279 46.2 26600 65.8 14.6 23220 64.2
Personnel 4099 46.8 8751 21.6 22.8 7124 19.7
Advertising 845 43.4 1947 4.8 -34.0 2951 8.2
Rental (excl. company housing) 2931 44.8 6542 16.2 31.8 4964 13.7
Depreciation (incl. retired assets) 922 46.3 1991 4.9 26.8 1570 4.3
Leases paid 326 45.0 725 1.8 27.3 569 1.6
Fees paid 1201 44.4 2704 6.7 16.2 2326 6.4
Supplies 589 51.6 1141 2.8 -2.7 1173 3.2
Other 1364 48.8 2799 6.9 10.2 2540 7.0
Operating profit 893 26.3 3400 8.4 14.4 2973 8.2
Non-operating profit -50 100.4 -50 -0.1 -13.4 -44 -0.1
Recurring profit 842 25.2 3350 8.3 14.4 2929 8.1
Extraordinary profit -90 67.9 -134 -0.3 -78.9 -636 -1.8
Earnings before income taxes 752 23.4 3216 8.0 40.2 2293 6.3
Income taxes 405 30.8 1316 3.3 25.6 1047 2.9
Net income 346 18.2 1900 4.7 52.6 1245 3.4
FY08/15 Full-year Earnings Forecasts FY08/14 Results
The company forecasts consolidated sales of JPY40.5bn and operating profit of JPY3.4bn (OPM of 8.4%).

23
Earnings Forecast Details (1)
(JPYmn, %)
YoY Change
Sales total 100.0 11.9 100.0
Eyewear 92.6 11.1 93.2
Stores (JINS) 88.7 12.3 88.4
E-commerce 3.9 -10.3 4.8
Accessories 7.4 22.4 6.8
Women's 3.2 20.2 3.0
Men's 4.2 24.1 3.8
Other 0.0 - 0.0
(%)
Eyewear
All stores -4.7 13.6 4.4 -2.9Comp. stores -16.8 5.7 -5.7 -21.4
The company forecasts remain unchanged 5.7% YoY loss in full-year comparable storesales.
FY08/14
Sales forecasts remain unchanged, at JPY40.5bn (+11.9% YoY).
All/Comparable Store YoY Sales Forecasts
1H 2H Full-year
FY08/15 Forecasts
1,738
2,451
1,081
0
1,369
0
Sales forecasts by business
FY08/15 Earnings Forecasts
40,450
1,560
1,700
Amount Composition
3,000
1,300
FY08/14 Earnings Results
Amount Composition
37,450
35,890
36,150
33,698
31,959

24
業Earnings Forecast Details (2)
(%)
1H Results2H
ForecastsFull-yearForecasts
Gross profit margin 74.2 74.2 74.2
Eyewear 76.2 76.2 76.2
Accessories 50.8 46.3 48.3
*Domestic, directly-managed stores
(JPY)
Capital investment amount* 985 847 1,833New store openings 677 734 1,412Store renovations 194 112 307Other 113 0 113
EBITDA 1,674 3,532 5,207
Income before taxes 752 2,463 3,216
Depreciation expenses 922 1,068 1,991
(Number of stores)
Openings Closings Net Openings Closings Net Net totalStores atyear-end
Eyewear 13 5 8 17 0 17 25 292Women's accessories 3 1 2 0 1 △ 1 1 25Men's accessories 3 0 3 0 0 0 3 15
Total 19 6 13 17 1 16 29 332
Gross Profit Margin Forecasts
Domestic Store Openings
1H 2H
Capital Investment
1H Results 2H Forecasts Full-year Forecasts
For GPM, higher raw materials costs caused by a weakening yen are offset by product strategy and fewerdiscounted sales.
25
About Forward-looking Statements
Forward-looking statements contained within this presentation are based upon assumptions deemed reasonable by the company at the time of writing, andmay differ significantly from actual results due to a wide range of factors.
Other Assumptions
Figures are rounded down to the nearest million yen; percentages are calculated based on actual values.