Embed Size (px)
Citation preview
1H and13C NMR investigation of the intramolecularstructure of solution and emulsion styrene-methylacrylate copolymersvan Doremaele, G.H.J.; German, A.L.; Vries, de, N.K.; Velden, van der, G.P.M.
Published in:Macromolecules
DOI:10.1021/ma00221a005
Published: 01/01/1990
Document VersionPublisher’s PDF, also known as Version of Record (includes final page, issue and volume numbers)
Please check the document version of this publication:
• A submitted manuscript is the author's version of the article upon submission and before peer-review. There can be important differencesbetween the submitted version and the official published version of record. People interested in the research are advised to contact theauthor for the final version of the publication, or visit the DOI to the publisher's website.• The final author version and the galley proof are versions of the publication after peer review.• The final published version features the final layout of the paper including the volume, issue and page numbers.
Link to publication
General rightsCopyright and moral rights for the publications made accessible in the public portal are retained by the authors and/or other copyright ownersand it is a condition of accessing publications that users recognise and abide by the legal requirements associated with these rights.
• Users may download and print one copy of any publication from the public portal for the purpose of private study or research. • You may not further distribute the material or use it for any profit-making activity or commercial gain • You may freely distribute the URL identifying the publication in the public portal ?
Take down policyIf you believe that this document breaches copyright please contact us providing details, and we will remove access to the work immediatelyand investigate your claim.
Download date: 01. Sep. 2018
4206 Macromolecules 1990,23, 4206-4215
lH and 13C NMR Investigation of the Intramolecular Structure of Solution and Emulsion Styrene-Methyl Acrylate Copolymers
G. H. J. van Doremaele and A. L. German'
Laboratory of Polymer Chemistry, Eindhoven University of Technology, P.O. Box 513, 5600 MB Eindhoven, The Netherlands
N. K. de Vries and G. P. M. van de r Veldent
DSM-Research BV, P.O. Box 18, 6160 MD Geleen, The Netherlands Received March 17, 1989; Revised Manuscript Received February 27, 1990
ABSTRACT The intramolecular structure (triad distribution and tacticity parameter, USM) of homogenous styrene (SI-methyl acrylate (M) copolymers, obtained by low-conversion solution polymerization, has been studied by 'H and NMR. With the set of reactivity ratios rs = 0.73 and rM = 0.19 and classical formulas, based on Alfrey-Mayo (AM) kinetics, it was possible to verify the experimentally obeerved triad distributions. For the methoxy proton region in the 'H NMR spectra it is difficult to make a correct peak assignment. Two different assignments can fit the observed data on triad level. The well-known Ito-Yamashita (I-Y) assignment leads for the random copolymers to a high degree of coisotacticity (UMS = 0.9), contrary to the value obtained for alternating copolymers (um = 0.5). An alternative assignment is possible, which results in am = 0.3. In order to discriminate between the two assignments, three 2D NMR COLOC experiments were carried out in an attempt to establish the connectivity over three bonds of the carbonyl C = O resonances and the protons of the OCHS resonances. However, the correctness of neither of the two 'H assignments of the methoxy resonances could be rigorously proved by means of the 2D NMR COLOC experiments. The cumulative triad fractions and the molar composition of copolymers, obtained up to very high conversion by means of both solution and emulsion batch processes, could be adequately described by models, on the basis of instantaneous distributions according to AM kinetics. In the case of the emulsion copolymerization it is shown that the model for predicting the sequence distribution should account for the monomer partitioning between the oil and water phases. The agreement found between predicted and observed triad distributions was quite satisfactory for both polymerization processes. It was shown that (statistical) emulsion copolymers have the same degree of coisotacticity as the statistical solution copolymers, regardless of whether or not the I-Y assignment is used for the alternative assignment.
Introduction Determination of the intramolecular (triad distribution,
tacticity) and intermolecular (chemical composition and molar mass distribution) copolymer microstructure is generally recognized as a prerequisite, since revealing the molecular microstructure may supply information about the monomer addition process, e.g., about the preference of monomers to add in a (co)iso- or cosyndiotactic configuration.'-3 Moreover, knowledge about the inter- and intramolecular structures is of paramount importance for the understanding of relations between molecular structure and polymer properties.@ Furthermore, the mi- crostructure depends upon the polymerization process and provides information on the reaction mechanisms occurring during polymerization.7*8 NMR methods provide information on the average copolymer composition as well as on the intramolecular ~ t r u c t u r e . ~ ~ ~ However, the majority of publications concerning the elucidation of in- tramolecular microstructure of copolymers deal with well- defined low-conversion (<15 % ) bulk or solution copolymers. Several examples in the field of styrene- (meth)acrylate copolymers can be found in t h e literat~re.~-'S Far less attention has been paid to the determination of the microstructure of copolymers obtained by high-conversion solution p roce~ses '~~ '5 or high- conversion emulsion p r o c e s s e ~ , ~ ~ - ~ ~ even though high conversion is of great technological importance. In the case of high-conversion solution copolymerization of styrene (SI and methyl methacrylate (MMA), it has also been shown that the inter- and intramolecular structure could
t Present address: DSM Kunstatoffen BV, P.O. Box 604,6160 AP Geleen, The Netherlands.
0024-929719012223-4206$02.50/0
be successfully predicted, on the basis of the integrated Alfrey-Mayo (AM) model, by using kinetic parameters obtained for low-conversion data.lw2' Similar results were obtained by our group on the styrene (@-ethyl meth- acrylate (EMA) system.13J5 However, due to the overlap of OCH3 or OCH2 resonances (in the S-MMA and S-EMA systems, respectively) and the methine main-chain backbone resonances in the 'H NMR spectra of the above- mentioned systems,11J3 as already put forward by H a r ~ o o d , ~ still problems may occur with the correct quantitative analysis of the sequence assignment of the acrylate-centered triads; see, e.g., a recent publication of Kale et al. on the S-MMA system.22 Therefore, we have studied the styrene-@) methyl acrylate (M) system, because (i) no overlap occurs between the OCH3 resonances and the other main-chain resonance^,^^ (ii) mixed configurational and compositional sequence effects are reported to occur for the OCH3 'H NMR resonance^,^^-^^ and (iii) the polymer statistics can be rigorously tested via an analysis of the I3C carbonyl carbons.2'+28 Contrary to S-MMA or S-EMA systems,13 the 13C chemical shifts of these carbons in the S-M system are only influenced by compositional sequence effects.28 For low-conversion (<20%) solution S-M copolymers we have measured the reactivity ratios, and the set of r values, together with the assumed AM model, has been used to test the validity of this model (via an interpretation of the '3C NMR data). Moreover, we have tried to distinguish between on the one hand Ito's earlier peak assignmentB (tentatively based on the same assignment order for S-MMA copolymersg), which results in an extremely high coisotacticity (UMS = 0.8-0.9), and on the other hand an alternative assignmentB apparently resulting in a much lower UMS. In an attempt
0 1990 American Chemical Society

Macromolecules, Vol. 23, No. 19, 1990
to achieve this goal, 2D NMR COLOC experiments30 were performed on three well-defined homogeneous low- conversion copolymers, thus trying to correlate the lH NMR OCH3 region and the 13C NMR carbonyl region. Related 2D NMR techniques have been performed very recently on the alternating S-MMA system.31 On the basis of triads only (with the influence of pentads neglected), the quantitative NMR results of the alternating S-MMA copolymers were approximately consistent with the I-Y assignment. However, no expansion was given of the 2D spectrum in the methoxy region of the random copolymer.
We also analyzed the microstructure of some high- conversion solution S-M copolymers and compared i t t o model calculations using the integrated AM model.15 Even more challenging is the microstructure of high-conversion emulsion copolymers, because emulsion copolymerization is a heterogeneous process. Therefore, models describing the emulsion copolymer microstructure are necessarily more complex. The model that we use for S-M copolymers takes into account this heterogeneity by calculating the monomer partitioning between the three pha~es.~7JgJ2 With use of the AM equations in combination with local mono- mer concentrations, together with numerical integration over conversion, the sequence distribution of the emulsion copolymer has been calculated and a comparison is made between the experimentally determined and the calculated triad fractions.
Experimental Section The monomers styrene and methyl acrylate (Merck) were
distilled at reduced pressure under nitrogen. The middle fraction of the distillate was collected and used. The free-radical initiator AIBN (Fluka p.a.1 was recrystallized once from methanol. The solution-synthesized copolymers were prepared in a 1-L glass vessel. The total monomer concentration was 3 mol/dm3 in toluene. The conversion of both monomers was determined by means of GLC. The temperature was 335 K, and the initial initiator concentration was 8 mmol/dmg. To isolate and purify the copolymer, samples of the reaction mixture were poured out in a 15-fold excess of cold hexane. The final products were dried at 328 K in a vacuum stove for at least 6 h a t 10-1 Torr and finally for 8 h at loa Torr.
The emulsion copolymers were prepared in a 1-L glass vessel. The monomers (86.3 g of styrene and 214.0 g of methyl acry- late) in which 1.24 g of n-dodecyl mercaptan was dissolved were preemulsified by adding them to the soap solution (2.00 g of sodium lauryl sulfate (Fluka) in 580 g of water, distilled twice). Subsequently, the initiator solution (0.201 g of potassium per- sulfate in 20 g of water) was added to the monomer emulsion, thermostated at 323 f 0.5 K. The monomer ratio was monitored by means of on-line GLC as described elsewhere." Total weight conversion was determined by solid content analysis. These samples were used for recording the NMR spectra.
lH NMR spectra were recorded with a 400-MHz (Bruker AM 400) spectrometer a t 298 K, by using CDCl3 as the solvent and locking agent. Generally the spectra were obtained by using a spectral width of 6024 Hz, an acquisition time of 1.4 s, a flip angle of 45O, and a pulse delay of 5 s. Spectra were obtained after accumulating 64 scans, by using a sample concentration of 1 % (w/v). The digital resolution amounted to 0.18 Hz, corresponding to a data length of 32K. 13C NMR were recorded at 100 MHz (Bruker AM 400) a t 298 K. The sample concentration was 9% (w/v) CDCls. Spectra were obtained by using WALTZ-16 de- coupling and a pulse delay of 5 s, accumulating 2000 scans with a digital resolution of 0.4 Hz/point, corresponding to a spectral width of 25 000 Hz and a data length of 64K. The flip angle and acquisition time were 90' and 1.3 s, respectively. Monomer sequence placements were determined by comparing the relative peak areas of the proton or carbon atoms involved. In performing quantitative NMR measurements via compositional or configurational sequence placementa, one must take into account differences in nuclear Overhauser effects (NOE) and spin-
lH and 13C NMR Investigation of S-M Copolymers 4207
7 5 0 700 650 600 550 5 0 0 450 400 350 300 250 200 1 5 0 100 50 0 0 -50
Figure 1. 400-MHz lH NMR spectrum of a low-conversion solution styrene (S)-methyl acrylate (M) copolymer in CDCls at 25 "C. The mole fraction of styrene (Fs) is indicated on the left.
lattice relaxation times (TI). No NOE or TI values have been determined, but one additional 13C NMR experiment was performed on a copolymer with FM = 0.43 with a much longer delay (15 s) and gating off the decoupler to remove the NOE. The results are identical with those obtained via 13C NMR with the standard method. Implicitly we assumed that no differential Tis are present for different stereoisomeric (mm, mr, and rr) triads or compositional triads (MMM, MMS, SMS, SSS, etc.) in the lH or lSC NMR spectra. No differential lH NO& were considered to occur. Within these limits relative peak areas are proportional to the numbers of proton and carbon atoms involved. Peak areas were determined via electronic integration methods or planime- ter methods (after truncation of overlapping spectral regions).
The COLOC experiments" have been used for the observation of long-range couplings between C=O 13C NMR carbon atoms and methoxy protons. On concentrated samples (25% w/v in CDCl3) 250 scans were accumulated per tl value with a recycle delay of 1 s on the AM 400 spectrometer. The initial data matrix was 2000 Hz (1K) and 800 Hz (128 tl values). Before Fourier transformation, double zero filling was used in the F1 dimension. Moreover, shifted sine-bell window functions u/4 and r / 8 were applied for the F1 and F2 domains, respectively. Delay times (Dl and D2) were both set to 25 ms.
Results and Discussion
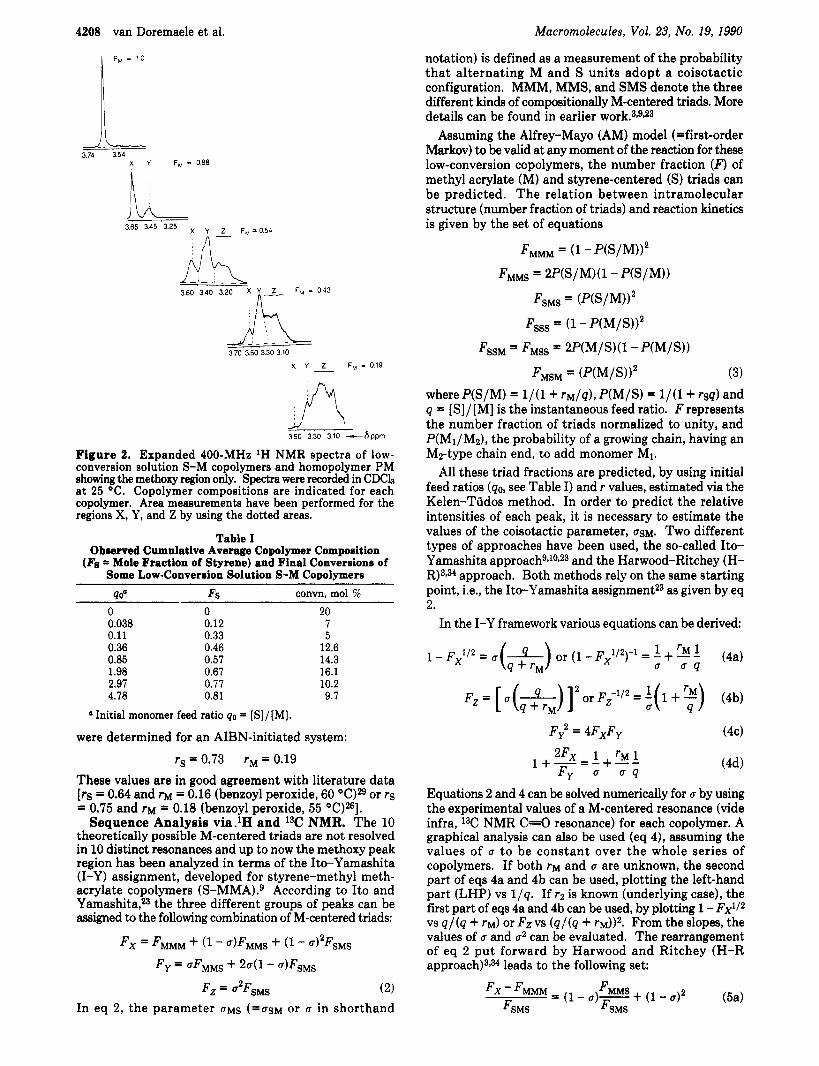
Low-Conversion Solution Copolymers. 'H NMR Spectra. Determination of Copolymer Composition and of r Values. Figure 1 depicts as a typical example the 400-MHz 1H NMR spec t rum of a low-conversion solution S-M copolymer dissolved in CDCla at 25 "C, whereas in Figure 2 expanded 400-MHz spectra are shown for four copolymers and poly(methy1 acrylate) (PM). Expansions of t h e methoxy region are shown since in particular this region displays additional fine splittings due to combined configurational (=tacticity) and compositional sequence ef fech23 T h e average copolymer composition (mole fraction styrene, Ps) can be readily obtained by using
where A1 a n d A2 represent t h e total peak areas of t h e aromatic and methoxy proton resonances, respectively. The in i t i a l f eed ( 4 0 = [ S ] / [ M ] ) , t h e average copolymer composition, and the conversion are summarized in Table I.
With use of t he well-known Kelen-Tudos low-conversion method and t h e data, presented in Table I, t h e r values
4208 van Doremaele et al. Macromolecules, Vol. 23, No. 19, 1990
notation) is defined as a measurement of the probability tha t alternating M and S units adopt a coisotactic configuration. MMM, MMS, and SMS denote the three different kinds of compositionally M-centered triads. More details can be found in earlier ~ o r k . ~ - ~ * ~ ~
Assuming the Alfrey-Mayo (AM) model (=first-order Markov) to be valid a t any moment of the reaction for these low-conversion copolymers, the number fraction (F) of methyl acrylate (M) and styrene-centered (S) triads can be predicted. The relation between intramolecular structure (number fraction of triads) and reaction kinetics is given by the set of equations
FMMM = (1 - P(S/M))'
FMMS = WS/M)(1 -P(S/M))
FsMs = (P(S/M))'
FSss = (1 -P(M/S))'
FssM = FMss = WM/S) (1 -P(M/S))
FMsM = (P(M/S))' (3) where P(S/M) = 1/(1+ rM/q), P(M/S) = 1/(1+ rsq) and q = [S]/[M] is the instantaneous feed ratio. F represents the number fraction of triads normalized to unity, and P(MI/Mz), the probability of a growing chain, having an Mz-type chain end, to add monomer MI.
All these triad fractions are predicted, by using initial feed ratios (qo, see Table I) and r values, estimated via the Kelen-Tudos method. In order to predict the relative intensities of each peak, it is necessary to estimate the values of the coisotactic parameter, USM. Two different types of approaches have been used, the so-called Ito- Yamashita a p p r o a ~ h ~ J ~ ~ ~ ~ and the Harwood-Ritchey (H- R)3934 approach. Both methods rely on the same starting point, i.e., the Ito-Yamashita assignmentz3 as given by eq 2.
In the I-Y framework various equations can be derived:
I F, = 1 0
370 350330310 X Y _t FM = 019
A 350 ' 330 ' 3 10 t h ppm
Figure 2. Expanded 400-MHz 'H NMR spectra of low- conversion solution S-M copolymers and homopolymer PM showing the methoxy region only. Spectra were recorded in CDCls at 25 "C. Copolymer compositions are indicated for each copolymer. Area measurements have been performed for the regions X, Y, and Z by using the dotted areas.
Table I Obrerved Cumulative Average Copolymer Composition (Fa = Mole Fraction of Styrene) and Final Conversions of
Some Low-Conversion Solution S-M Copolymers Po0 Fs convn, mol o/c
0 0 20 0.038 0.12 I 0.11 0.33 5 0.36 0.46 12.6 0.85 0.57 14.3 1.98 0.67 16.1 2.91 0.11 10.2 4.18 0.81 9.1
OInitial monomer feed ratio qo = [S]/[M].
were determined for an AIBN-initiated system:
rs = 0.73 rM = 0.19 These values are in good agreement with literature data [rs = 0.64 and r M = 0.16 (benzoyl peroxide, 60 OC)B or rs = 0.75 and r M = 0 . 1 8 (benzoyl peroxide, 55 oC)26]. Sequence Analysis via.lH and 13C NMR. The 10
theoretically possible M-centered triads are not resolved in 10 distinct resonances and up to now the methoxy peak region has been analyzed in terms of the Ito-Yamashita (I-Y) assignment, developed for styrene-methyl meth- acrylate copolymers (S-MMA).g According to Ito and Yama~hi ta?~ the three different groups of peaks can be assigned to the following combination of M-centered triads:
Fx = FMMM + (1 - u)FMMs + (1 - u)'FsMs F y = uFMMS + 2 ~ ( l - u ) F ~ M ~
Fz = u2FSMS (2) In eq 2, the parameter OMS ( = O S M or u in shorthand
F: = 4FxFy (44
Equations 2 and 4 can be solved numerically for u by using the experimental values of a M-centered resonance (vide infra, l3C NMR C=O resonance) for each copolymer. A graphical analysis can also be used (eq 4), assuming the values of u t o be constant over the whole series of copolymers. If both rM and u are unknown, the second part of eqs 4a and 4b can be used, plotting the left-hand part (LHP) vs l / q . If r z is known (underlying case), the first part of eqs 4a and 4b can be used, by plotting 1 - FX'/~ vs q/(q + rM) or FZ vs (q/(q + rM)I2. From the slopes, the values of u and u2 can be evaluated. The rearrangement of eq 2 put forward by Harwood and Ritchey (H-R a p p r ~ a c h ) ~ ~ ~ ~ leads to the following set:
Fx - FMMM = (1 - u)%?! + (1 - u ) 2 ( 5 4 FSMS FSMS

Macromolecules, Vol. 23, No. 19, 1990
(5b)
(54
The left-hand part of eqs 5a-c either can be plotted via F M M S / F S ~ , assuming for the whole range of polymers a to be constant, or alternatively can be numerically solved for a for each polymer, by using experimental values for F x , F y , a n d F z a n d theoret ical ly calculated or experimentally observed values for F m , F m , and F s ~ s (13C NMR).
If the interpretation of the OCH3 resonances is correct, the graph should be linear and slopes and intercepts should be consistent with a single value of u.
Figure 3 depicts the 100-MHz 13C NMR spectra of poly- (methyl acrylate) and four copolymers recorded at room temperature in CDCl3. These spectra only show the car- bonyl region and the C1 ipso region (aromatic C1 carbon), because sequence splittings are observed and have been assigned tentatively by other ~ o r k e r s . l ~ * ~ ~ ~ Remarkably the methoxy carbon resonance of all copolymers (contrary to the methoxy proton resonance) is observed as a sin- glet. Although the pattern of the C1 ipso resonances is not well understood and the signals are not as resolved as the C=O signal, we tentatively have truncated this spectral region in three areas, which have been assigned to SSS, SSM, and MSM triad sequence placements in a manner analogous to the truncation, executed by Ramirez- Marquez.lg In Table I1 the three theoretically calculated triad fractions (using AM statistics) and the experimentally observed values (both M- and S-centered triads) are presented. There is a good agreement between the relative resonance areas and the calculated triad fractions. This reconfirms the findings of Tanabe et a1.26128 that the car- bonyl carbon patterns are only sensitive tQ sequence effects and that AM statistics hold. Similar arguments (although with considerably less certainty) hold for the S-centered triads.
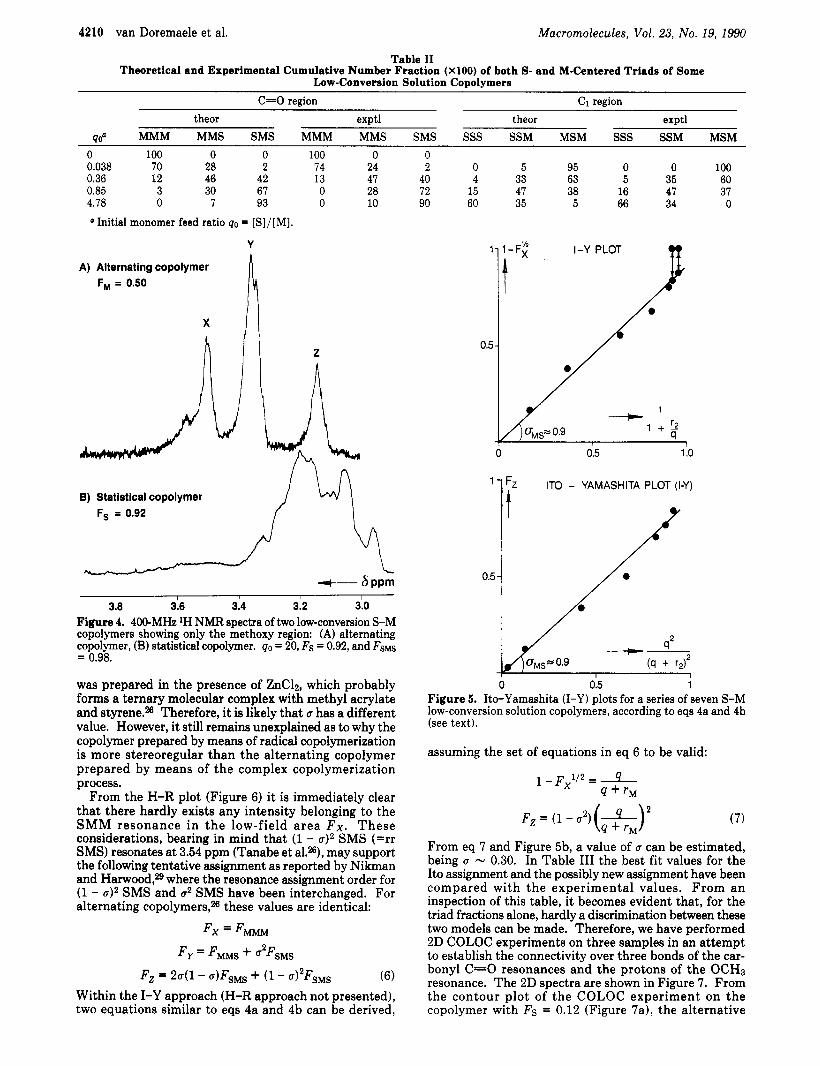
Considering the lH NMR methoxy resonances in greater detail for our statistical copolymers (see Figure 2), it is evident, that no tacticity-induced splittings appear for PM, i.e., (mm, mr, rr) MMM all resonate a t 3.64 ppm. However, from recent work of Tanabe et al.%*B on alternating S-M copolymers it is evident that a 3-fold splitting is observed for the OCH3 resonance. The resonance assignments are 3.54 (rr), 3.39 (mr) and 3.21 (mm) ppm. The calculated coisotacticity parameter for these copolymers amounts to UMS = 0.5 (UMS = [mm/(mm + 2mr + rr) SMSI1l2. In Figure 4 are depicted two 400-MHz lH NMR spectra of an alternating S-M copolymer (synthesized in our laboratory according t o a procedure, described by Tanabe2s-2s) and a statistical copolymer, containing the largest amount of SMS triads (in our case qo = 20, Fs = 0.92, F s ~ s = 0.98). From this figure i t is evident that similar chemical shifts are observed for the alternating copolymer, as observed by Tanabe et a1.,26 and also that the QSM parameter is equal to 0.5. Nevertheless, the spectrum of the statistical copolymer is much more complicated than that of the alternating copolymer. However, it is immediately clear that the u value for this copolymer is much larger than 0.5, because the fractional area intensity of the rr SMS triad (at -3.50 ppm) is very small. The chemical shift regions belonging to X, Y, and Z are somewhat dependent on the copolymer composition and increase, e.g., for X, from 3.66-3.55 for high FM copolymers to 3.62-3.48 for low FM copolymers (see Figure 2). The truncations, used for the determination of the
-- F y - O F U S + 2a( l - a)
-=a Fz 2
FSMS FSMS
FSMS
1H and l3C NMR Investigation of S-M Copolymers 4209
FM = 0.54 SMS AMMS
FM = 0.43 fr
FM = 0.88 r
177 176 175 1 74 147 145 143 141
Figure 3. Expanded 100-MHz I3C NMR spectra of four low- conversion solution S-M copolymers and poly(methy1 acry- late), showing only the carbonyl region (174-177 ppm) and the quaternary aromatic carbon region C1 ipso (141-147 ppm). Spectra were recorded in CDC18 at 25 "C. Copolymer compositions are indicated on the left. Area measurements have been performed on the indicated regions.
experimental Fx, Fy, and FZ values, are indicated in Figure 2. In Figure 5 two examples of I-Y plots are shown, by using the experimentally observed values for Fx, etc., collected in Table I11 and the experimentally observed values for r2 and QO, respectively, Fz versus ( q / ( q + and 1 - Fx112 versus (1 + rM/q)-l (cf. eqs 4a and 4b). For the first plot experimentally reliable values for Fz can be expected mainly a t low FM values; for the second plot reliable values for FX can be found at high FM values. In both cases CTMS values, being -0.9, have been calculated from the slopes. For two copolymers, with Fs being 0.77 and 0.81, two limiting values have been indicated in Figure 4b, somewhat dependent on the fact of whether the tiny area at -3.50 ppm has to be assigned to F x or completely neglected (Fx = 0, 1 - Fx112 = 1) and in fact assigned to Fy (rr SMS). The LHP of the H-R equations (see eq 5 ) has been plotted in Figure 6 versus F m / F s m . Calculated triad fractions for FMMS and FSMS (Mayo-Lewis model is valid) and experimentally observed values for Fx, Fy, and FZ have been used. From these plots, it is immediately clear that extremely high values of a are found (u 1 0.9), also in disagreement with the results obtained for alternating copolymers (a = 0.50). However, mutual agreement exists between the two different approaches (I- Y) and (H-R). Furthermore, the alternating copolymer
4210 van Doremaele et al. Macromolecules, Vol. 23, No. 19, 1990
Table I1 Theoretical and Experimental Cumulative Number Fraction (XlOO) of both S- and M-Centered Triads of Some
Low-Conversion Solution Copolymers
C=O region C1 region theor exptl theor exptl
qoa MMM MMS SMS MMM MMS SMS SSS SSM MSM SSS SSM MSM 0 100 0 0 100 0 0.038 70 28 2 74 24 0.36 12 46 42 13 47 0.85 3 30 67 0 28 4.78 0 7 93 0 10
Initial monomer feed ratio qo = [S]/[M].
Y n A) Alternating copolymer F, = 0.50
X I I
B) Statistical copolymer F, = 0.92
3.8 3.6 3.4 3.2 3.0 Figure 4. 400-MHz 'H NMR spectra of two low-conversion S-M copolymers showing only the methoxy region: (A) alternating Copolymer, (B) statistical copolymer. qo = 20, FS = 0.92, and FSMS = 0.98.
was prepared in the presence of ZnC12, which probably forms a ternary molecular complex with methyl acrylate and styrene.% Therefore, it is likely that u has a different value. However, it still remains unexplained as to why the copolymer prepared by means of radical copolymerization is more stereoregular than the alternating copolymer prepared by means of the complex copolymerization process.
From the H-R plot (Figure 6) it is immediately clear that there hardly exists any intensity belonging to the SMM resonance in the low-field area F x . These considerations, bearing in mind that (1 - a)2 SMS (=rr SMS) resonates a t 3.54 ppm (Tanabe et al.%), may support the following tentative assignment as reported by Nikman and Harwood,29 where the resonance assignment order for (1 - SMS and u2 SMS have been interchanged. For alternating copolymers,26 these values are identical:
Fx = FMMM
F y = FMMS + u2FsMs
F , = 2 u ( l - u)FsMS + (1 - a)2FsMs (6) Within the I-Y approach (H-R approach not presented), two equations similar to eqs 4a and 4b can be derived,
0 2 0 5
40 4 33 72 15 47 90 60 35
1- 1-Fg
t 0.5-
95 0 0 100 63 5 35 60 38 16 47 37 5 66 34 0
0 0.5 1 .o
IT0 - YAMASHITA PLOT (I-Y) '17 I ' x
i/ ,-* i/ ,-* 0 0.5 1
Figure 5. Ito-Yamashita (I-Y) plots for a series of seven S-M low-conversion solution copolymers, according to eqs 4a and 4b (see text).
assuming the set of equations in eq 6 to be valid:
(7)
From eq 7 and Figure 5b, a value of u can be estimated, being u - 0.30. In Table I11 the best fit values for the It0 assignment and the possibly new assignment have been compared with the experimental values. From an inspection of this table, it becomes evident that, for the triad fractions alone, hardly a discrimination between these two models can be made. Therefore, we have performed 2D COLOC experiments on three samples in an attempt to establish the connectivity over three bonds of the car- bonyl C=O resonances and the protons of the OCH3 resonance. The 2D spectra are shown in Figure 7. From the contour plot of the COLOC experiment on the copolymer with FS = 0.12 (Figure 7a), the alternative

Macromolecules, Vol. 23, No. 19, 1990 1H and 13C NMR Investigation of S-M Copolymers 4211
Table I11 Observed and Normalized Area Intensities (XlOO) of Peaks X, Y, and ZRepresenting the Oxymethylene Region and the
Calculated Values of X, Y, and ZUsing Ito's Assignment (Equation 2) (See Text) and an Alternative Assignment (Equation 6) (See Text) of Some Low-Conversion Solution Copolymers
qoo X Y Z X Y Z X Y Z exptl Ito's assignt (u = 0.92) alt assignt ( u = 0.32)
0 0.038 0.11 0.36 0.85 1.98 2.97 4.78
100 70 38 19 10 4 2 1
0 27 49 47 40 25 21 15
0 100 3 73 13 45 34 16 50 7 71 3 77 2 84 2
Initial monomer feed ratio QO = [S]/[M].
9, L.H.P. Hawood. Ritchey Plot ( H - R ) p
7 61'
2 il /
/ Fx - FMMM 0 :-
FSMS
F 0 :y
FSMS
FZ A ;- FSMS
* h_ F..s (talc)
FSMS I , - , I I I I
0 1 2 3 4 5 6 7 6 9 1 0
Figure 6. Harwood-Ritchey (H-R) plot of the left-hand part (LHP) of eqs 5a-c vs F M M S / F S M S for a series of seven low- conversion solution copolymers.
assignment has to be rejected in favor of the earlier I-Y assignment, because of the presence of the peak that correlates the X peak in the 'H NMR spectrum with the MMS peak in the 13C NMR spectrum. Moreover, as depicted in the COLOC contour plots of the copolymers with Fs = 0.46 and Fs = 0.57, the X peak correlates with part of the SMS peak and the MMS peak in the 13C NMR spectrum. This also favors Ito's assignment and would reject the alternative assignment. However, in case of FS = 0.46 the MMM peak correlates clearly with the Y peak instead of correlating with the X peak, which would be expected on the grounds of the lH NMR spectrum of meth- yl acrylate homopolymer. The influence of pentads could probably explain the unexpected difference. The MMMMM pentad resonates a t 3.64 ppm, and the SMMMM and SMMMS pentads possibly resonate a t higher field. Although the COLOC experiments do not fully discriminate between the two assignments and therefore the correct assignment of the methoxy proton region is still unknown, it is still possible to use lH NMR to determine the M-centered triads of S-M copolymers using either of the assignmenta. Although the problems involved in a proper assignment deserve further attention in further investigations, the present situation remains undecided. Therefore , on behalf of t h e present interpretations, the I-Y assignment will be used in the following, in order to remain compatible with earlier literature.
High-Conversion Solution Copolymers. In Table IV a comparison is made between on the one side the experimentally observed values of the copolymer composition, triad fractions, and the fractional intensities
0 25 44 48 39 29 26 23
0 2 10 35 54 68 72 77
100 69 40 12 3 1 0 0
0 28 48 50 37 24 20 17
0 3 12 38 60 75 79 83
of peaks X, Y, and Z representing the methoxy proton region and on the other side the predicted values using the integrated form of the Alfrey-Mayo (AM) model,15 CY = 0.9, and r values obtained from the low-conversion compositional data (rs = 0.73, FM = 0.19).15
Both calculated and experimentally determined values are therefore average (cumulative) number fractions of the high-conversion copolymers. Taking into account the poor peak resolution of the C1 ipso region, it can be concluded from the data in Table IV that the solution copolymer microstructure can be described according to the integrated AM model until high conversion.
Emulsion Copolymers. Emulsion copolymerization is a heterogeneous process. Therefore, a model describing emulsion copolymerization and emulsion copolymer mi- crostructure is necessarily more complex and contains more parameters as compared with a model that describes a homogeneous process like solution copolymerization.
The average copolymer composition and the sequence distribution of the emulsion copolymers were calculated by using a computer simulation program based on a comprehensive model description of the emulsion copolymerization and copolymer structure. In this article, only the basic concepts of this model, required t o understand how the predicted emulsion copolymer mi- crostructures were obtained, will be presented. A more detailed discussion on the model and its predictive properties will be published ~ e p a r a t e l y . ~ ~
The model used takes into account the monomer partitioning between the three phases in the system, i.e., monomer droplets, water phase, and latex ~ar t ic les . l~*~ With use of the local monomer feed ratio inside the latex particles in combination with the r values, determined for solution copolymerization, the instantaneous copolymer composition as well as the instantaneous triad fractions can be calculated assuming first-order Markov (Le., Mayo- Lewis) kinetics to be valid. Numerical integration provides the cumulative average copolymer composition and cumulative triad fractions. We have assumed in our model that all copolymer is formed inside latex particles, i.e., any possible solution polymerization in the water phase is being neglected. This condition may not be completely met, especially at the very beginning of the r e a c t i 0 n , 7 ~ ~ ~ ~ ~ since methyl acrylate is moderately water soluble.
However, the obtained experimental data (Figures 8 and 9) of the experiment described are in very good agreement with model calculations and give no evidence of any significant water-phase polymerization. The monomer partitioning between latex particles, water phase, and monomer droplets in stages I and I1 of the emulsion polymerization is calculated by using the set of equilibrium equations (eq 8), the molar mass balance equations (eq 91,

4212 van Doremaele et al.
and eq 12 (the iteration process).
Macromolecules, Vol. 23, No. 19, 1990
IMb1w = kbXb (8) In eq 8 [Malp and [MJW are the molar concentrations of monomer a in, respectively, the swollen latex particles and the water phase (mol/L); K,, Kb, k,, and kb are equilibrium constants (mol/L) and X a (=1 - Xb) is the molar fraction of monomer a inside the monomer droplets
[MbIpupN~ + Vw[MbIw + MM = (1 - Xb)Mt,o (9) where Mad = content of monomer a in monomer droplets per liter of emulsion (mol/L), Vw = volume ratio of water phase per liter of emulsion, up = volume of a single swollen latex particle (L), X, = molar conversion of monomer a, Ma0 = amount of initial monomer a per liter of emulsion (mol/L), and NT = total number of latex particles per liter of emulsion ( l /L) . During stage I11 of the emulsion copolymerization, when no monomer droplets are present, eq 10-12 are used:
Styrene and methyl acrylate both swell their (co)polymers very well but differ strongly in water solubility. I t is assumed that the monomer ratio inside the latex particles equals the monomer ratio inside the monomer droplets; i.e., Ka = Kb.19332337
The swollen latex particle volume, up, is calculated by using eq 12 assuming volume additivity of each component
where Pa = density of monomer a (g/L), Mto = M,o + Mbo = total monomer content a t the beginning of the reaction per liter of emulsion (mol/L), Xt = total conversion (mol fraction), pp = average copolymer density (g/L), Ma = molar mass of monomer a (g/mol), Mp = FaMa + F&fb = average molar mass of the monomer units of the cumulative copolymer (g/mol), and NT = number of particles per liter of emulsion (l /L). The number of latex particles may vary during reaction but has little or no influence on the instantaneous and Cumulative average copolymer composition and sequence distribution.
Under the conditions that K, = Kb and that Ka and Kb are independent of the latex particle volume, only the total organic phase/water volume ratio determines the local monomer feed ratio inside the latex particles. Therefore, a t a certain conversion the value of NT only influences the particle volume and does not affect the organic phase/ water volume ratio or the local monomer feed ratio inside the latex particles. The simulation has to be initiated at very low conversion (e.g., Xt, = 0.001 mol fraction) with a certain copolymer composition, representative of the emulsion system (e.g., FS = 0.5).
Table IV Experimentally Observed Cumulative Triad Fractions,
Molar Fraction S (Fs), and Functional Area Intensities (X, Y, 2) for Two High-Conversion Solution Copolymersa
40 = 0.85 qo = 5.7 convn = 92 mol 7% convn = 99 mol %
exptl model exptl model l3C NMR
MMM 10.1 9.5 0 0 MMS 38.6 40.5 7 7 SMS 51.3 50.0 93 93 sss 13.0 12.0 78 68 SSM 41.8 38.0 22 28 MSM 45.2 50.0 0 4
Fs 0.53 0.5 0.88 0.85 X ( u = 0.9) 14.4 14.5 0 2 Y 44.5 44.0 14 23 z 41.1 41.5 86 15
lH NMR
Theoretically calculated values for all experimentally observed values are also depicted.
Table V Numerical Values of Constants Used in Figures 8 and 9
Showing Model Calculations Describing the Course of the Cumulative Triad Fractions and Copolymer Composition as
a Function of Conversion K. = 5 mol/L Xm = 0.001
Fm = 0.5 dXt = 0.001
K b = 5 mol/L k , = 0.6 mol/L k b = 0.003 mOl/L Pa = 0.9 x 10³ g/L
p p = 1.1 x 10³ g/L NT = 3 x 10¹⁷ + 1.2 x 1 0 1 7 ~ ~ I /L
Pb = 0.95 x io3 g/L
a = styrene b = methyl acrylate
At any conversion increment (e.g., dXT = 0.001 mol fraction) the monomer concentrations inside the latex particles, water phase, and monomer droplets then can be calculated. The instantaneous and cumulative copolymer composition and sequence distribution are calculated assuming no change in monomer feed concentrations inside the latex particles during each small conversion increment. In Figure 8 the predicted and experimentally observed cumulative copolymer compositions have been plotted. In Figure 9 the theoretically predicted triad fractions are shown together with the measured triad fractions using the well-known peak assignment of the carbonyl and the C1 ipso region of the l3C NMR spectra (respectively, representative for M- and S-centered triads) and the meth- oxy region in the 1H NMR spectra described above. The model predictions have been calculated by using the set of parameters shown in Table V.
The excellent agreement between experimental and model predictions in both cases strongly supports the validity of the assumptions made in the emulsion polymerization model.
For comparison and in order to prove the necessity of a heterogeneous model, the average cumulative chemical composition together with the triad fractions has been calculated by using a homogeneous model (Figures 10 and 11). According to Ramirez-Marquez et al.,w who calculated apparent r values for the S-M emulsion copolymerization as a function of the monomer water ratio using a similar model, the apparent r values are r's = 0.88 and r ' ~ = 0.13 at a monomer water ratio of 0.5 (g/g). Figures 10 and 11 show that the average chemical composition and the S-centered triad fractions as a function of conversion are predicted very well when apparent r values are used.

Macromolecules, Vol. 23, No. 19, 1990 1H and 13C NMR Investigation of S-M Copolymers 4213
2-0 COLOC 8p.ctrum x., I 0.12 P
X,,, I 0.46
i
X.,, I 0.57
1 3 3
1 3 4
135
I 136
7- - - -PPM 1765 1760 1755 1750 1745
SHS
rl
J' L
Figure 7. Contour plot from three 2D NMR COLOC experiments, of low-conversion solution copolymers (Fs = 0.12, 0.46, and 0.57), showing long-range correlation between car- bonyl l9C atoms and protons of the methoxy group.
However, the M-centered triads are not well predicted by the homogeneous model. This proves the necessity of using the heterogeneous model based on local monomer concen- trations and "real" r values, in emulsion copolymerization.
0 : exp ( lH N M R ) - : model calculation
50 100 Figure 8. Cumulative emulsion copolymer composition versus conversion. Initial monomer feed ratio S/M 0.33 (mol/mol). Initial monomer/water ratio M/W = 0.5 (g/g).
S-centered triads
0 50 1 10 <onv tot (mol%)
Fsss A FMSS F M S M ~
M-centered triads
f ' " l l
0 , . . . .
50 100 --econv tot (mol%)
* FMMM - 0 - F M M S ..&... FsMs Figure 9. Cumulative emulsion copolymer triad fractions as a function of conversion. Initial monomer feed ratio S/M 0.33 (mol/ mol). Initial monomer/water ratio M/W = 0.5 (g/g). (a) S-centered triads. (b) M-centered triads.
The combination of the moderate water solubility of M and the very low water solubility of S has a strong influence on the composition drift during the batch emulsion copolymerization.
In this particular experiment, at ca. 60 mol % conversion all styrene already has polymerized, and hereafter almost pure poly(methy1 acrylate) (PM) is being formed, resulting in a strong increase of the cumulative MMM and a strong decrease of the cumulative MMS and SMS triad fractions. Because almost no styrene is present after 60 mol ?&

4214 van Doremaele et al. Macromolecules, Vol. 23, No. 19, 1990
copolymers provide sequence distribution information only in terms of the M-centered triad fractions.
The M-centered triad fractions calculated from the (T
values determined for solution copolymers showed an excellent agreement with the theoretical M-centered triad fractions.
4 . " 0 50 100
----e-conv. tot (mol%)
0 : exp ('H NMR) - : model calculation
Figure 10. Experimental cumulative emulsion copolymer composition versus conversion compared with the homogeneous model calculation using apparent r values and overall concentrations. - 0 50 100
,---+- conv tot (mol%)
A Fsss - + - FMSS FMSM
M-centered triads
0 50 100 +conv tot (mol%)
-O-- FMMM - -D- FMMs ---Am-- FSMS
Figure 11. Experimental cumulative emulsion copolymer triad fractions as a function of conversion compared with the homogeneous model using apparent r values and overall concentrations. Initial monomer feed ratio S / M 0.33 (mol/ mol). Initial monomer/water ratio M / W = 0.5 (g/g). (a) S-centered triads. (b) M-centered triads.
conversion, the cumulative styrene triad fractions remain constant. Moreover, it is shown in Figure 9 that lH NMR is also useful in determining the values of the M-centered triads of emulsion copolymers.
When Ito's23 earlier peak assignment of the methoxy proton region is used, the 'H NMR spectra of the emulsion
Conclusions I t can be concluded that composition and sequence
distribution of solution S-M copolymers can be described according to the integrated Alfrey-Mayo model.
The experimental sequence distribution, in terms of triad fractions of emulsion S-M copolymers determined by means of 13C NMR, confirms the validity of the model calculations used.
Moreover, a comparison between the 'H NMR spectra of the emulsion copolymers and the model calculations of the triad fractions, demonstrates that, under the described experimental conditions, the coisotacticity parameter of S-M copolymers is independent of the polymerization process used (i.e., solution or emulsion polymerization); Le., UMS = 0.9, provided the I-Y assignment is correct or UMS = 0.3 provided the alternative assignment is correct.
Acknowledgment. We express our gratitude to Prof. H. R. Harwood and Prof. R. Chtijo for valuable discussions and suggestions. This investigation was supported by The Netherlands Foundation for Chemical Research (SON) with financial aid from The Netherlands Organization for Scientific Research (NWO).
References and Notes Koenig, J. L. Chemical Structure of Polymer Chins; John Wiley and Sons: New York, 1980. Tacx, J. C. J. F. Ph.D. Thesis, Eindhoven University of Tech- nology, Eindhoven, The Netherlands, 1986. Harwood, H. J. Problems in Aromatic Copolymer Structures. In Natural and Synthetic High Polymers; Diehl, P., et al., Ed.; Springer Verlag: Berlin, 1970; Vol. 4. Pichot, C. H.; Llauro, M. F.; Pham, Q. J . Polym. Sci., Polym. Chem. Ed. 1981,19,2619. Mathot, V. B. F.; Pijpers, M. F. J. Polym. Bull. 1984,11, 297. Hirooka, M.; Kato, T. J . Polym. Sci., Polym. Lett. Ed. 1974, 12, 31. Nomura, M.; Satpathy, U. S.; Kouno, Y.; Fujita, K. J . Polym. Sci., Part C: Polym. Lett. 1988, 26, 385. Van Doremaele, G. H. J.; Van Herk, A. M.; Ammerdorffer, J. L.; German, A. L. Polym. Commun. 1988,29,299. Ito, K.; Yamashita, Y. J. Polym. Sci., Part B , Polym. Lett. Ed. 1965,3, 625; 1965,3,631. Ito, K.; Iwase, S.; Umehara, K.; Yamashita, Y. J . Macromol. Sci., Chem. 1967, I , 891. Uebel, J. J.; Dinan, F. J. J . Polym. Sci., Polym. Chem. Ed. 1983, 21,1773; 1983,21,2427. San Romh, J.; Madruga, E. L.; Del Puerto, M. A. Angew. Mak- romol. Chem. 1979, 78, 129. Tacx, J. C. J. F.; van der Velden, G. P. M.; German, A. L. J . Polym. Sci., Polym. Chem. Ed. 1988,26, 1939. Yamashita, Y.; Ito, K. Appl. Polym. Symp. 1969, 8, 245. Tacx, J. C. J. F.; van der Velden, G. P. M.; German, A. L. Polymer 1988,29, 1675. Johnston, J. E.; Basset, D. R.; MacRury, T. B. ACS Symp. Ser., 1981, 165. Llauro, M. F.; Pichot, C.; Guillot, J.; Rios, L.; Cruz, M. A.; Guz- man, C. Polymer 1986,27,889. Llauro, M. F.; Spitz, R.; Pichot, C. J . Macromol. Sci., Chem. 1983, 19 (6), 881. Ramirez-Marquez, W. Ph.D. Thesis, University Claude Ber- nard, Lyon, France, 1987. Ito, K.; Yamashita, Y. J . Polym. Sci., Part B, Polym. Lett. Ed. 1968, 6, 227. O'Driscoll. K. F.: Kale. L. T.: Garcia Rubio. L. H.: Reillv. P. M.
- 1
J . Polym.'Sci., Polym: Chem. Ed. 1984, 22, 2777. Kale, L. T.; O'Driscoll, K. F.; Dinan, F. J.; Uebel, J. J. J . Polym. Sci., Polym. Chem. Ed. 1986, 24, 3145.
Macromolecules, Vol. 23, No. 19, 1990
(23) Ito, K.; Yamashita, Y. J. Polym. Sci., Part B, Polym. Lett. Ed. 1965,3,637.
(24) Koinuma, H.; Tanabe, T.; Hirai, H. Makromol. Chem. 1980,181, 383.
(25) Tanabe, T.; Koinuma, H.; Hirai, H. Makromol. Chem. 1980,181, 931.
(26) Tanabe, T.; Koinuma, H.; Hirai, H. J. Polym. Sci., Polym. Chem. Ed. 1981, 19, 3293.
(27) Kandil, S. H.; El-Gamal, M. A. J. Polym. Sci., Polym. Chem. Ed. 1986,24, 2765.
(28) Koinuma, H.; Tanabe, T.; Hirai, H. Macromolecules 1981,14, 883.
(29) Niknam, M. K. Ph.D. Dissertation, University of Akron, Akron, OH, 1985. Diss. Abstr. Znt. B. 1985, 46 (4), 1196 (available through University Microfh , Internal Order No. DA 85 13339).
(30) Kessler, H.; Griesinger, C.; Zarbock, J.; Loosli, H. R. J. Magn. Reson. 1984,57, 331.
1H and 13C NMR Investigation of S-M Copolymers 4215
(31) Heffner, S. A.; Bovey, F. A.; Verge, L. A.; Mirau, P. A.; Tonelli, A. E. Macromolecules 1986,19, 1628.
(32) Guillot, J. In Polymer Reaction Engineering; Reichert, K. M., Geiseler, W., Us.; Huthig and Wepf Verlag: Basel, Switzerland, 1986; p 147.
(33) van Doremaele, G. H. J.; van Herk, A. M.; German, A. L., in preparation.
(34) Harwood, H. J.; Ritchey, W. M. J. Polym. Sci. B 1965, 3,419. (35) van Doremaele, G. H. J.; van Herk, A. M.; German, A. L., in
preparation.
1 1 . 25. (36) Nomura, M.; Fujita, K. Makromol. Chem., Suppl. 1985, IO/
- - 7
(37) Ramirez-Marquez, W.; Guillot, J. Makromol. Chem. 1988,189,
(38) Ramirez-Marquex, W.; Guillot, J. Makromol. Chem. 1988,189, 361.
379.
Registry No. (MAHS) (copolymer), 25036-19-5.