Embed Size (px)
Citation preview

1Epidemiologic investigation
Foodborne Disease Outbreak Investigation Team Training:
Module 5 – Epidemiologic Investigation
2Epidemiologic investigation
Module Learning ObjectivesAt the end of this module, you will be able to
1.Compare a case series, a cohort study, and a case-control study.
2. Interpret the measure of association for a cohort and a case-control study.
3.Explain what is meant by the term “statistically significant.”
4. Identify potential problem areas in the conduct of an epidemiologic study which might impact the findings.
> Learning objectives
3Epidemiologic investigation
Epidemiologic Activities
• Perform descriptive epidemiology• Conduct hypothesis-generating interviews• Undertake analytic studies
– Case series– Cohort studies– Case-control studies
4Epidemiologic investigation
Case Series
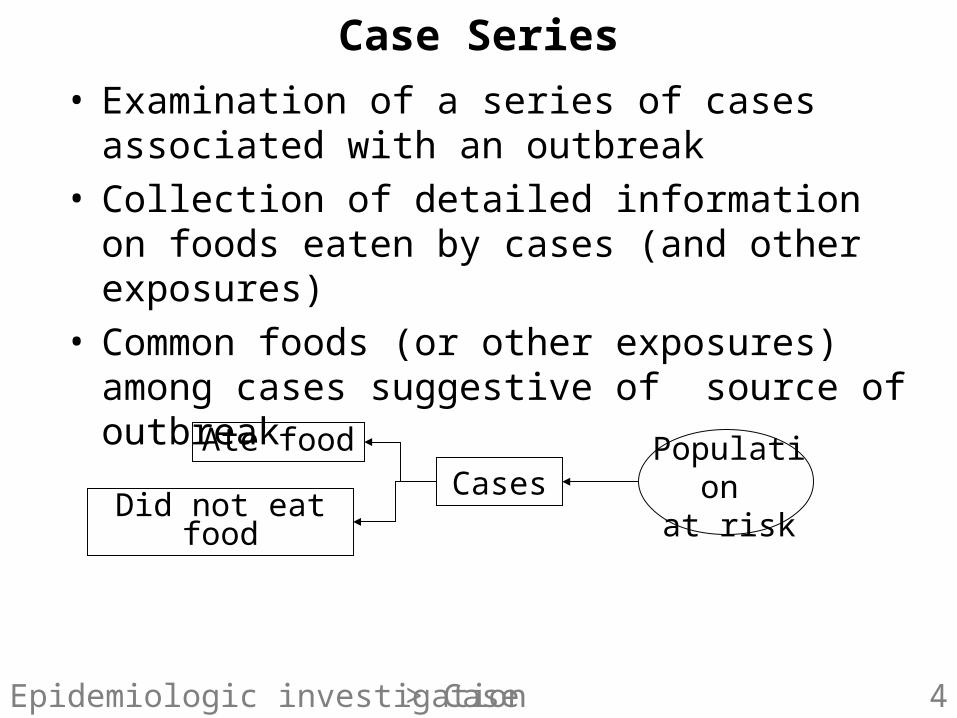
• Examination of a series of cases associated with an outbreak
• Collection of detailed information on foods eaten by cases (and other exposures)
• Common foods (or other exposures) among cases suggestive of source of outbreak
> Case series
Ate food
Did not eat foodCases Population
at risk
5Epidemiologic investigation
Outbreak of Salmonella Enteriditis
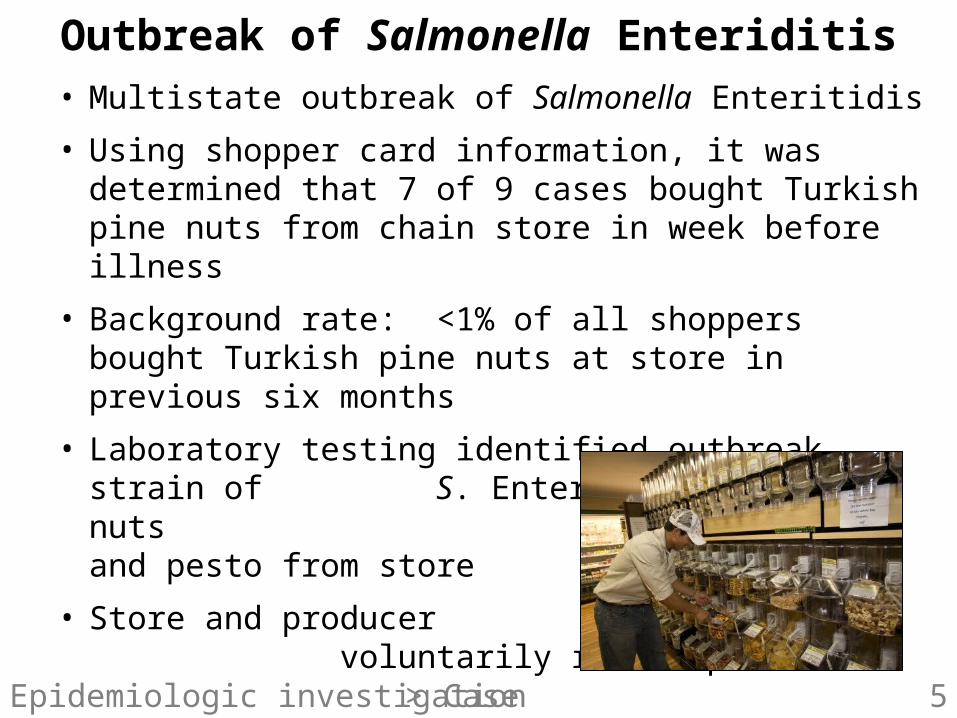
• Multistate outbreak of Salmonella Enteritidis
• Using shopper card information, it was determined that 7 of 9 cases bought Turkish pine nuts from chain store in week before illness
• Background rate: <1% of all shoppers bought Turkish pine nuts at store in previous six months
• Laboratory testing identified outbreak strain of S. Enteritidis in pine nuts and pesto from store
• Store and producer voluntarily recall pine nuts
> Case series

6Epidemiologic investigation
The Need for a Comparison Group
• Commonalities among cases: – Reflective of population at large? – A chance happening? – Related to some unknown factor that is the
true source of the outbreak? (confounders)
• Comparison (control) group needed to put findings into perspective
> Case series

7Epidemiologic investigation
Illness
Did not eat food
No illness
Illness
No illness
Cohort Study
• Well-defined group in which outbreak occurs• Compare attack rates among people who ate and
did not eat certain food(s)• Higher attack rates among people eating a food
(compared to those not eating it) suggest the food might be associated with illness
Ate food
Well defined group
> Cohort studies

8Epidemiologic investigation
Outbreak of Salmonellosis at Hospital X• Over 200 cases of salmonellosis occurred among nurses (a well-defined group) at Hospital X following
the Nurse’s Appreciation Day Luncheon• Cohort study of nurses at hospital
– 736 nurses and nursing students responded– 195 (34%) of 571 persons who attended luncheon became ill– 8 (5%) of 165 persons who did not attend luncheon became ill
> Cohort studies
9Epidemiologic investigation
Relative Risk (RR)
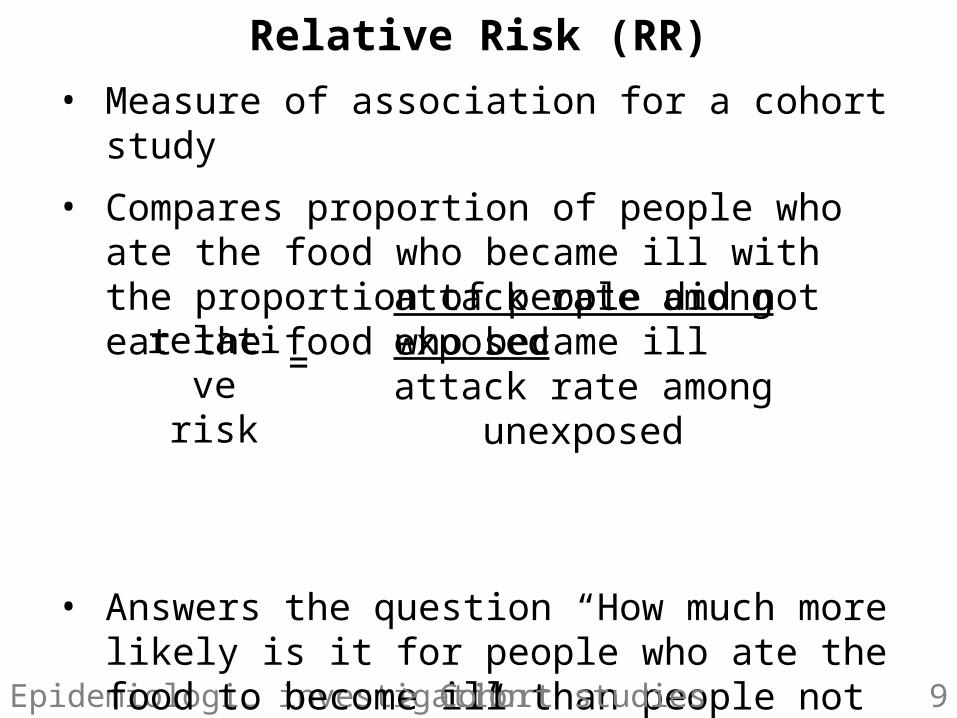
• Measure of association for a cohort study
• Compares proportion of people who ate the food who became ill with the proportion of people did not eat the food who became ill
• Answers the question “How much more likely is it for people who ate the food to become ill than people not eating the food?”
> Cohort studies
attack rate among exposed
attack rate among unexposed
relative risk
=
10Epidemiologic investigation
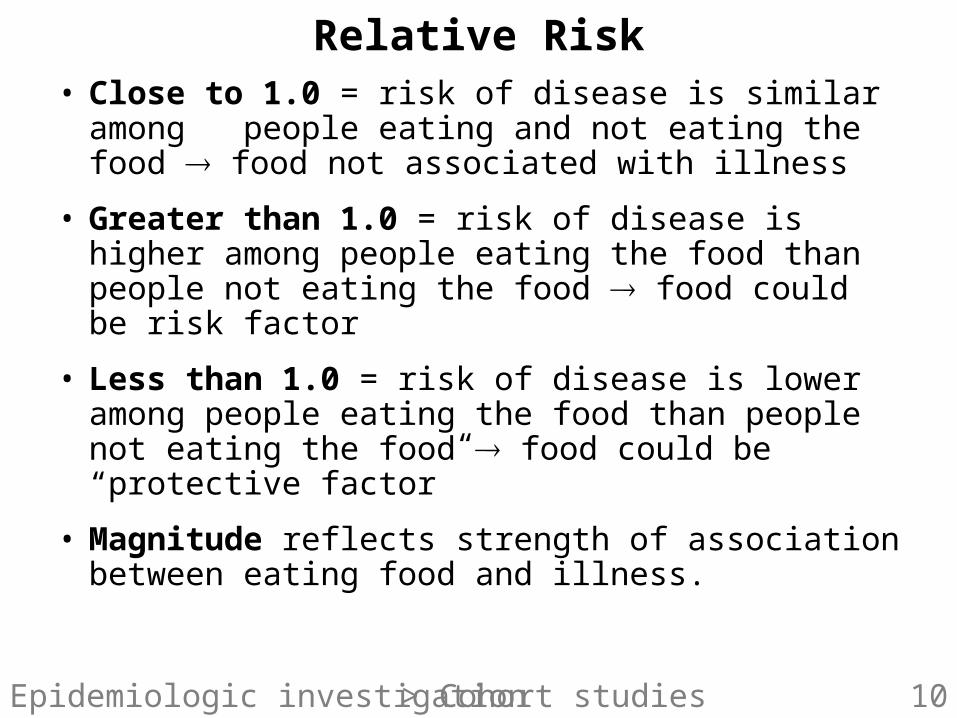
Relative Risk• Close to 1.0 = risk of disease is similar among
people eating and not eating the food food not associated with illness
• Greater than 1.0 = risk of disease is higher among people eating the food than people not eating the food food could be risk factor
• Less than 1.0 = risk of disease is lower among people eating the food than people not eating the food food could be “protective factor”
• Magnitude reflects strength of association between eating food and illness.
> Cohort studies
11Epidemiologic investigation
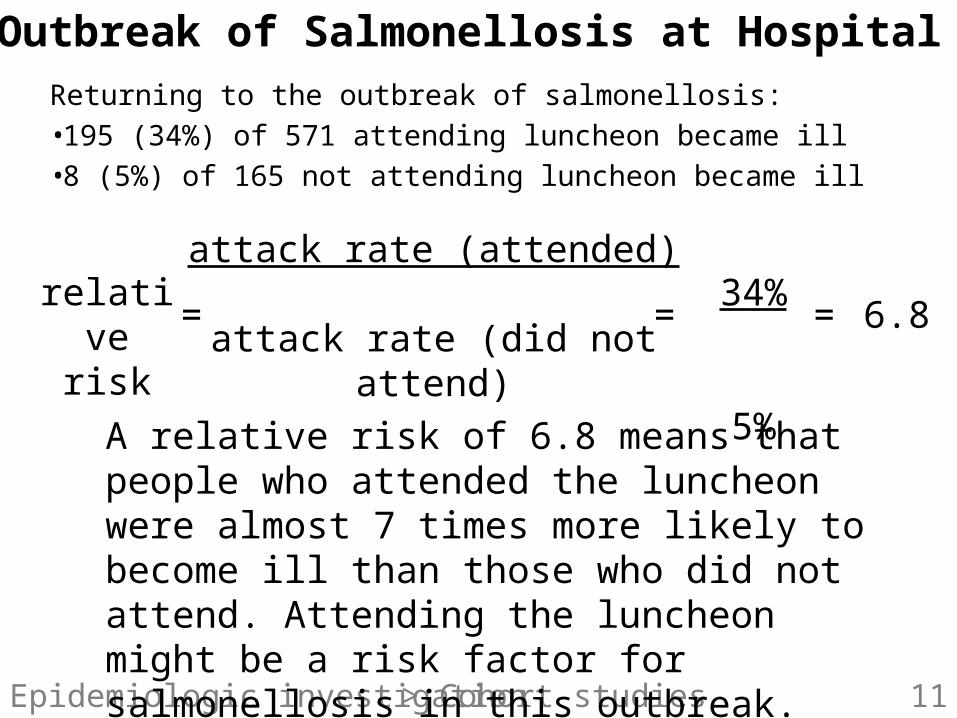
Outbreak of Salmonellosis at Hospital X
Returning to the outbreak of salmonellosis:•195 (34%) of 571 attending luncheon became ill•8 (5%) of 165 not attending luncheon became ill
attack rate (attended) attack rate (did not attend)
relative risk
= =34% 5%
= 6.8
> Cohort studies
A relative risk of 6.8 means that people who attended the luncheon were almost 7 times more likely to become ill than those who did not attend. Attending the luncheon might be a risk factor for salmonellosis in this outbreak.

12Epidemiologic investigation
Class QuestionLooking only at the nurses who attended the Nurse’s Appreciation Day Luncheon•14 (18%) of 78 eating tuna salad became ill•172 (40%) of 431 not eating tuna salad became ill•Relative risk = 0.45
What does this relative risk mean?
Answer: Persons eating tuna salad sandwiches were half as likely to develop illness as those not eating tuna salad sandwiches. Eating tuna salad could be “protective” in this outbreak.
> Cohort studies
13Epidemiologic investigation
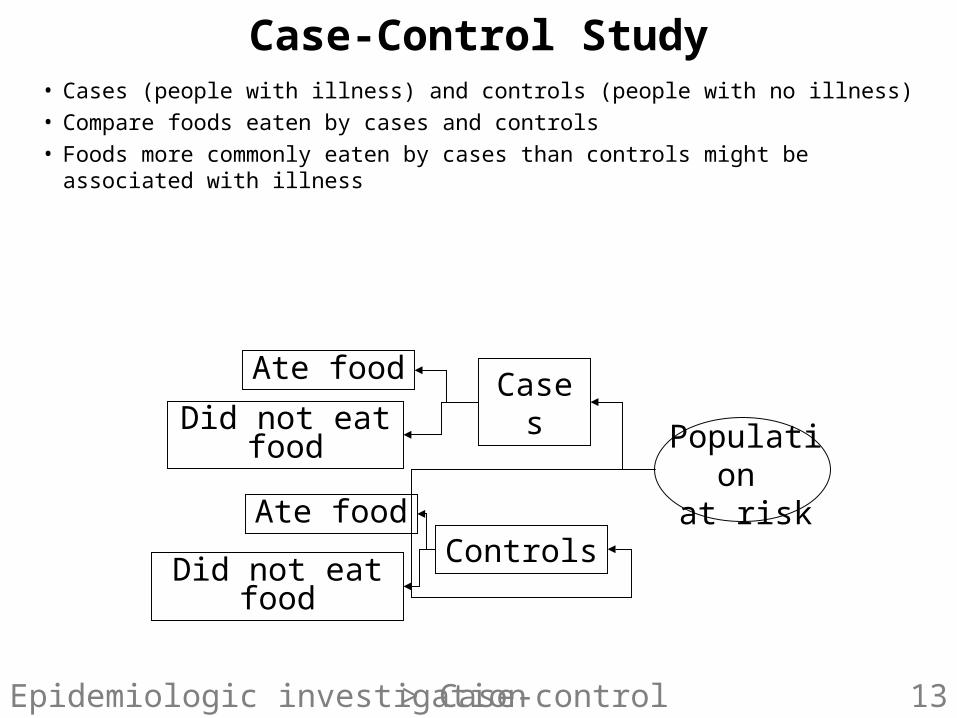
Case-Control Study• Cases (people with illness) and controls (people with no illness)
• Compare foods eaten by cases and controls
• Foods more commonly eaten by cases than controls might be associated with illness
Controls
Ate food
Ate food
Did not eat food
Did not eat food
Cases
> Case-control studies
Population at risk
14Epidemiologic investigation
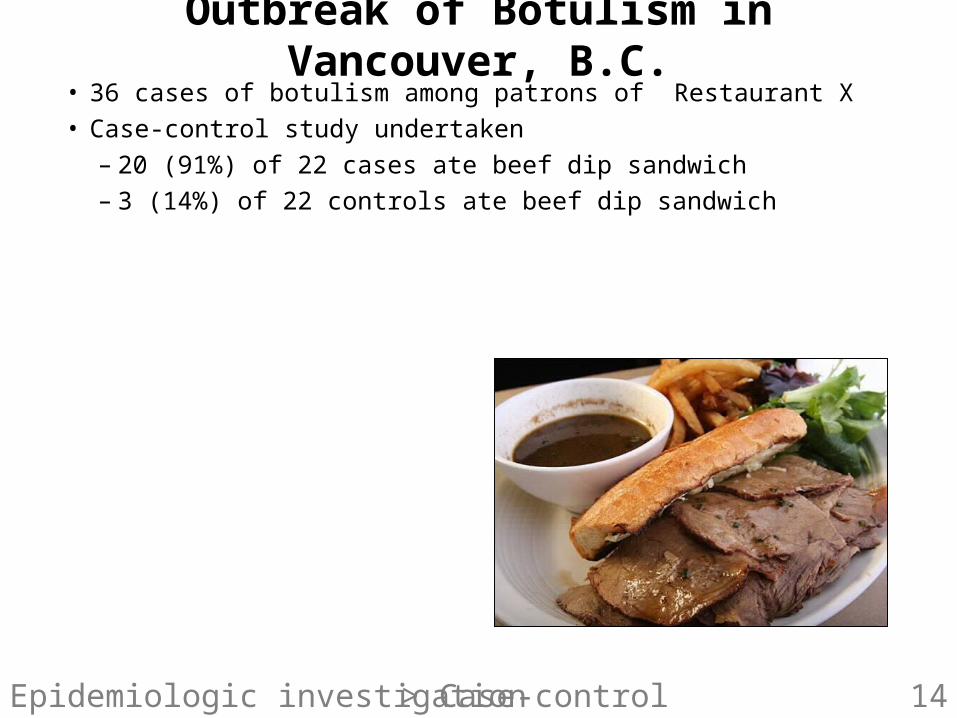
Outbreak of Botulism in Vancouver, B.C.• 36 cases of botulism among patrons of Restaurant X• Case-control study undertaken
– 20 (91%) of 22 cases ate beef dip sandwich– 3 (14%) of 22 controls ate beef dip sandwich
> Case-control studies

15Epidemiologic investigation
Odds Ratio (OR)
• Measure of association for a case-control study
• Compares odds of cases having eaten a certain food to odds of controls having eaten the food
• Answers the question “How much higher is the odds of eating the food among cases than controls?”
> Case-control studies
odds of eating food among cases odds of eating food among controlsodds ratio =

16Epidemiologic investigation
Odds Ratio• Close to 1.0 = odds of eating food is similar
among cases and controls no association between food and illness
• Greater than 1.0 = odds of eating food among cases is higher than among controls food could be risk factor
• Less than 1.0 = odds of eating food among cases is lower than among controls food could be “protective factor”
• Magnitude reflects strength of association between illness and eating the food.
> Case-control studies
17Epidemiologic investigation
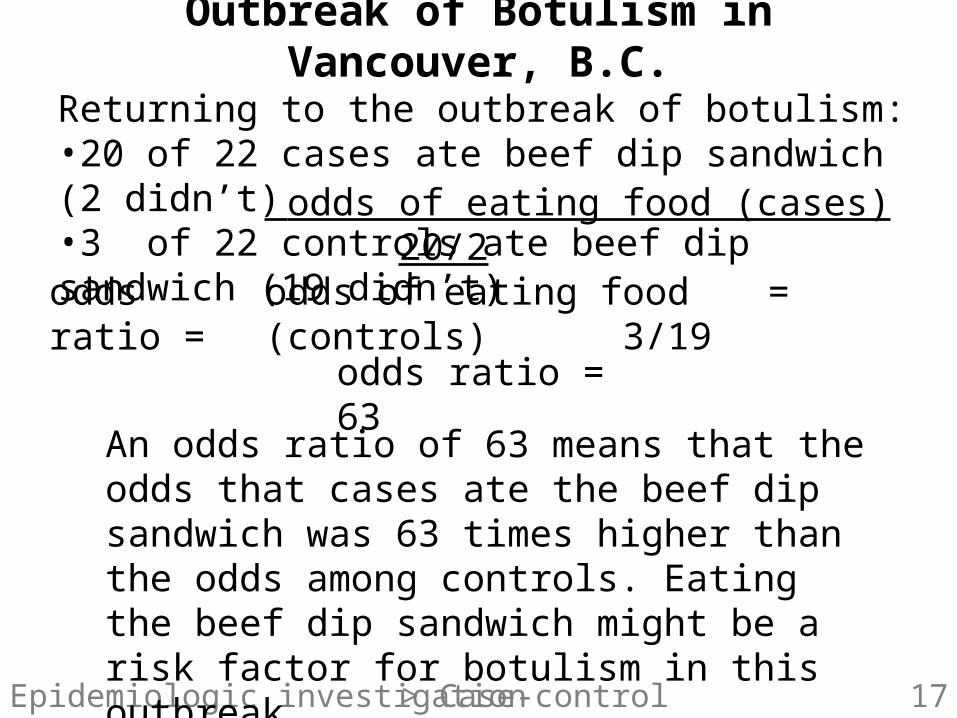
Outbreak of Botulism in Vancouver, B.C.
Returning to the outbreak of botulism:•20 of 22 cases ate beef dip sandwich (2 didn’t)•3 of 22 controls ate beef dip sandwich (19 didn’t)
odds of eating food (cases) 20/2odds of eating food (controls) 3/19
odds ratio = =
odds ratio = 63
> Case-control studies
An odds ratio of 63 means that the odds that cases ate the beef dip sandwich was 63 times higher than the odds among controls. Eating the beef dip sandwich might be a risk factor for botulism in this outbreak.

18Epidemiologic investigation
Class Question• Outbreak of cyclosporiasis in New Jersey not
associated with particular event/establishment• Case-control study undertaken
– 21 (70%) of 30 cases ate raspberries– 4 (7%) of 60 controls ate raspberries– Odds ratio = 32.7
What does this odds ratio mean?
Answer: Odds of eating raspberries is 33 times higher among cases than controls. Eating rasp-berries could be a risk factor for cyclosporiasis. The association between raspberries and illness is strong.
> Case-control studies
19Epidemiologic investigation
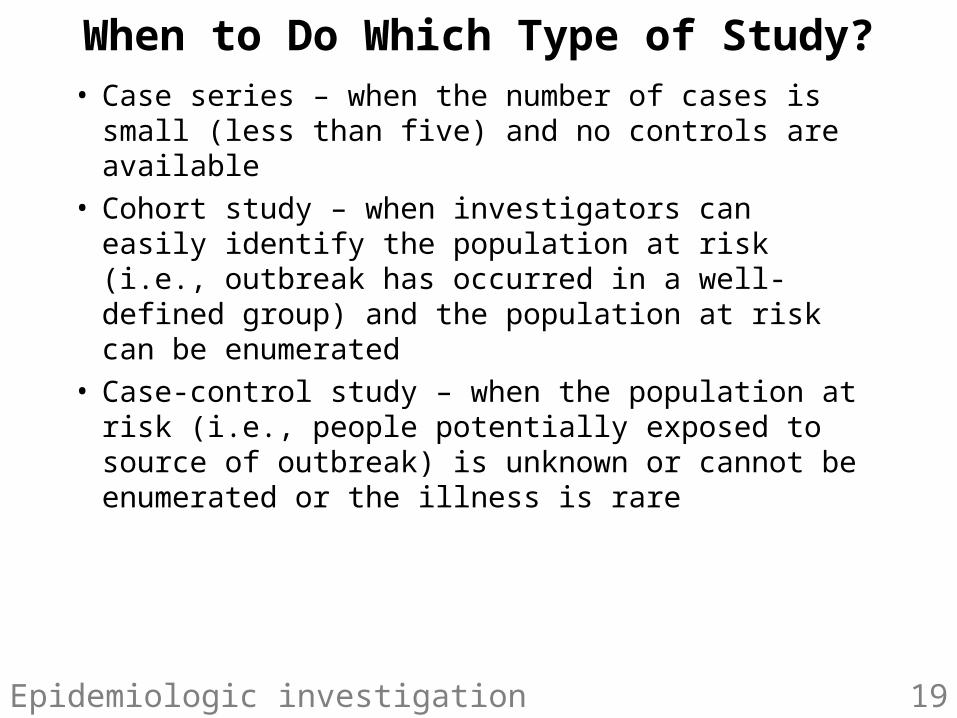
When to Do Which Type of Study?• Case series – when the number of cases is
small (less than five) and no controls are available
• Cohort study – when investigators can easily identify the population at risk (i.e., outbreak has occurred in a well-defined group) and the population at risk can be enumerated
• Case-control study – when the population at risk (i.e., people potentially exposed to source of outbreak) is unknown or cannot be enumerated or the illness is rare
20Epidemiologic investigation
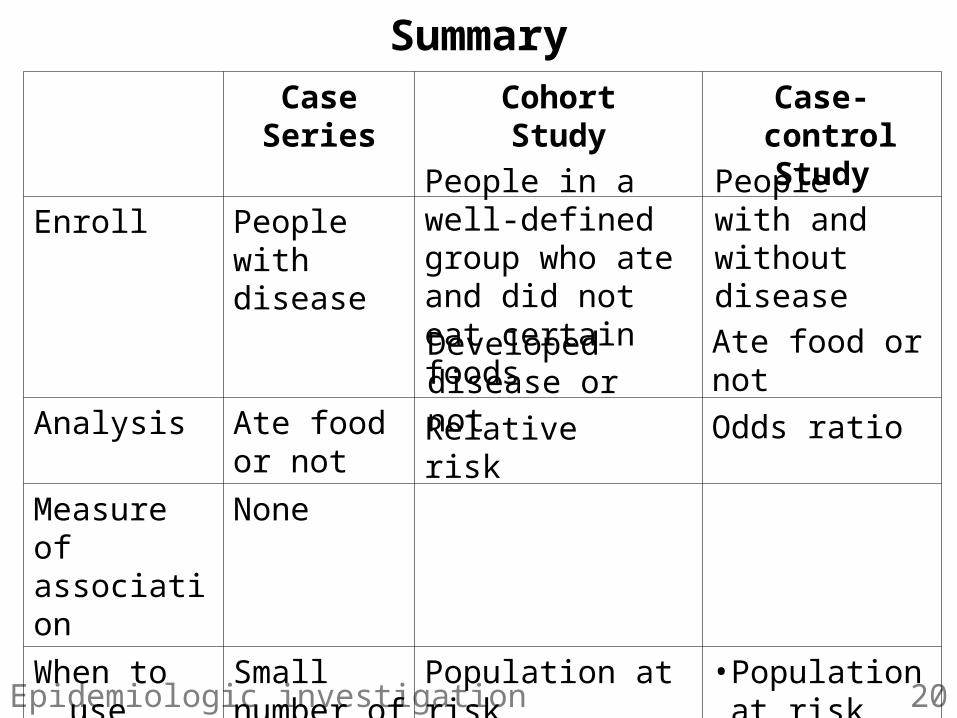
SummaryCase
SeriesCohortStudy
Case-control Study
Enroll People with disease
Analysis Ate food or not
Measure of association
None
When to use Small number of cases
Population at risk •Easily identified •Can be enumerated
• Population at risk unknown
• Rare disease
People in a well-defined group who ate and did not eat certain foods
People with and without disease
Developed disease or not
Odds ratioRelative risk
Ate food or not
21Epidemiologic investigation
Role of Chance
22Epidemiologic investigation
Role of Chance
• Things do just happen by coincidence!
• Odds ratios and relative risks are estimates• Observed results could be due to chance alone• Role of chance explored through
– p-value– Confidence interval (CI)
> Statistical significance

23Epidemiologic investigation
p-value
• Probability that findings due to chance alone
• Ranges from 0 to 1 (0% to 100%)
– Closer to 1.0 (100%) high probability findings due to chance
– Closer to 0.0 (0%) low probability findings due to chance
• Example:
p-value = 0.02
finding occurred by chance 2 in 100 times
> Statistical significance
24Epidemiologic investigation
p-value
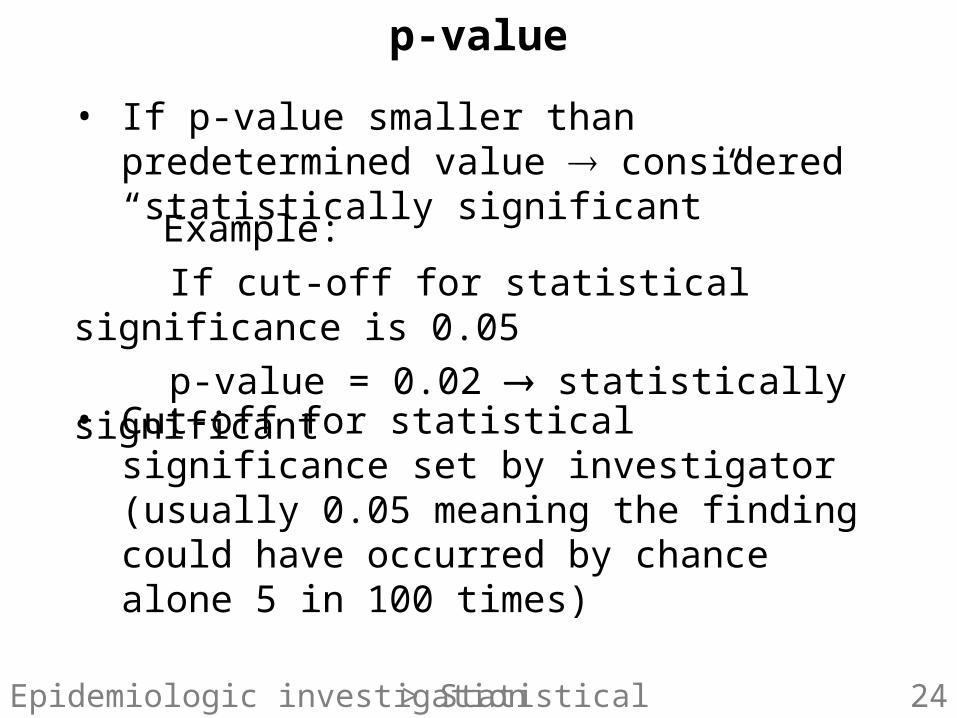
Example:
If cut-off for statistical significance is 0.05
p-value = 0.02 statistically significant
• If p-value smaller than predetermined value considered “statistically significant”
• Cut-off for statistical significance set by investigator (usually 0.05 meaning the finding could have occurred by chance alone 5 in 100 times)
> Statistical significance
25Epidemiologic investigation
Confidence Intervals (CI)
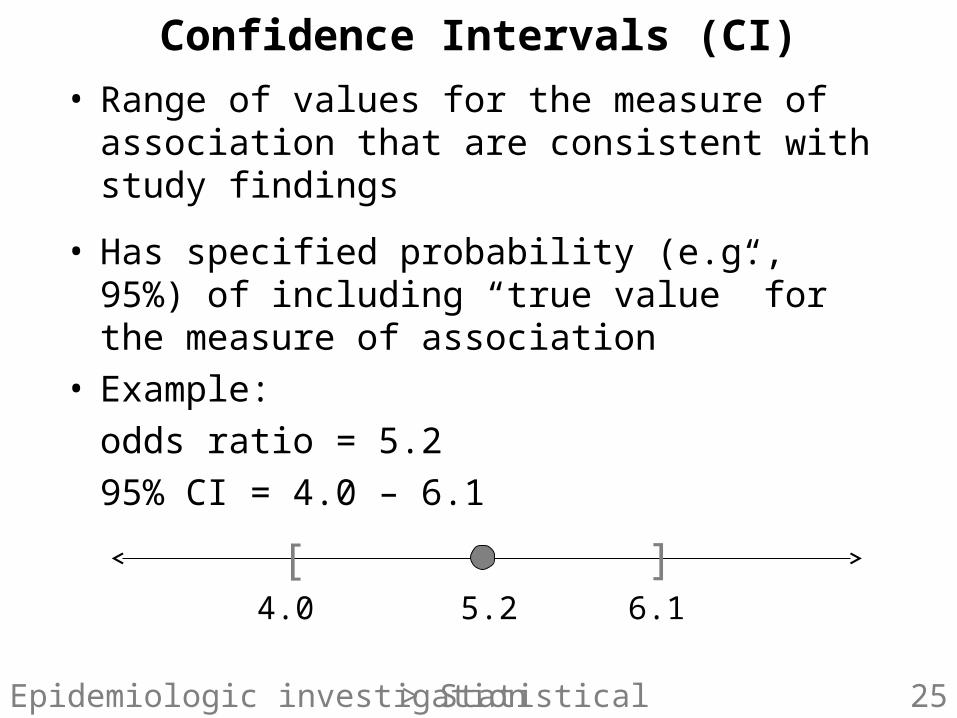
• Range of values for the measure of association that are consistent with study findings
• Has specified probability (e.g., 95%) of including “true value” for the measure of association
• Example:
odds ratio = 5.2
95% CI = 4.0 – 6.1
5.2
[ ]4.0 6.1
> Statistical significance
26Epidemiologic investigation
Confidence Intervals (CI)
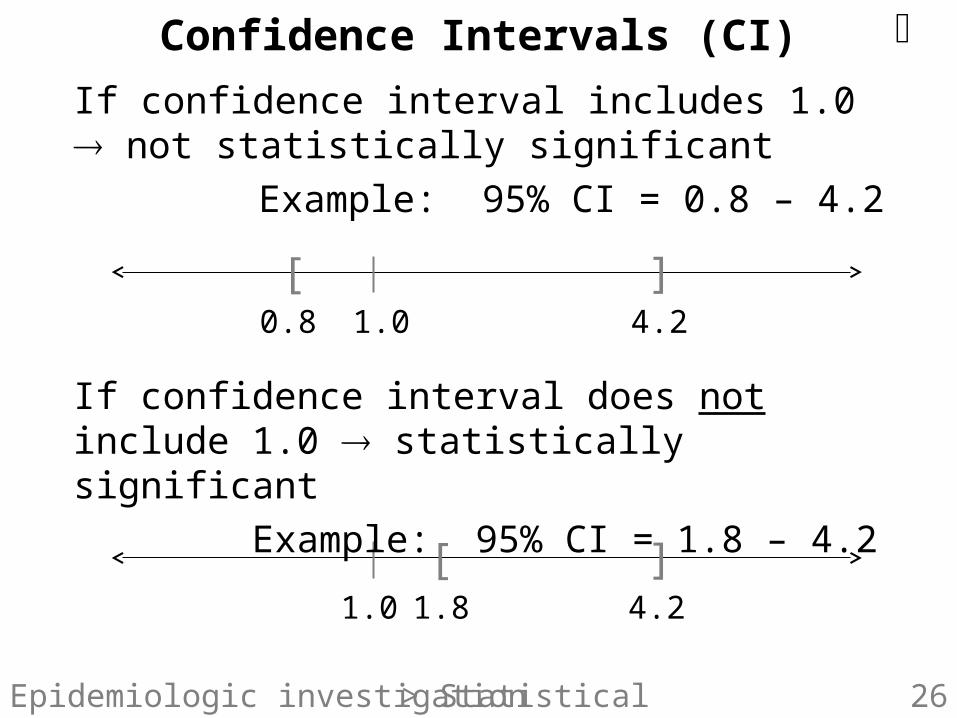
If confidence interval includes 1.0 not statistically significant
Example: 95% CI = 0.8 – 4.2
1.0
[ ]0.8 4.2
1.0
[ ]1.8 4.2
If confidence interval does not include 1.0 statistically significant
Example: 95% CI = 1.8 – 4.2
> Statistical significance

27Epidemiologic investigation
Class Question• An outbreak of Salmonella Typhi in Tajikistan• Case-control study undertaken• Exposures in 30 days before illness for cases (or before interview for controls)• Results analyzed using a p-value of 0.05 as the cut-off
for statistical significance
> Statistical significance

28Epidemiologic investigation
Odds ratio for eating food from street vendor greater than 1.0 suggesting could be risk factor. But p-value > 0.05 and confidence interval includes 1.0. Finding is likely to be due to chance.
No
Class Question
ExposureOdds ratio p-value 95% CI
Statistically significant
Eating street vendor food
1.5 0.3 0.9−5.6
Eating apples 0.2 0.03 0.04−0.9
Drinking un- treated water
9.6 0.0005 2.7−34
Which odds ratios are statistically significant?
Odds ratio for eating apples less than 1.0 suggesting possible protective factor. p-value < 0.05 and confidence interval does not include 1.0. Finding is unlikely to be due to chance.
Yes
Yes
Odds ratio for drinking untreated tap water is greater than 1.0 suggesting possible risk factor. p-value < 0.05 and confidence interval does not includes 1.0. Finding unlikely to be due to chance.
> Statistical significance
29Epidemiologic investigation
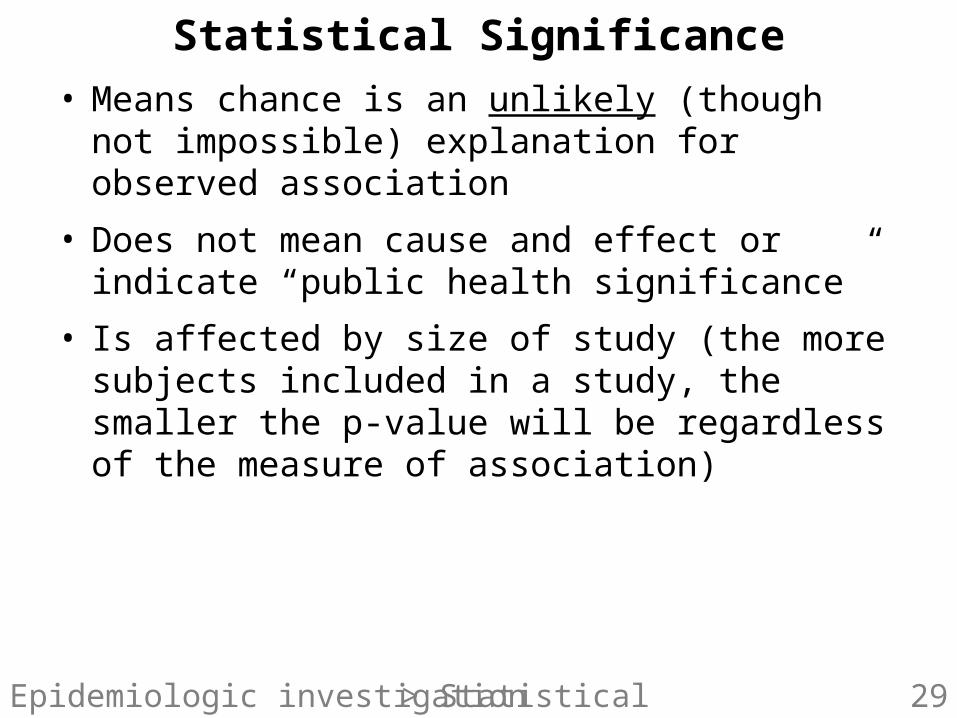
Statistical Significance
• Means chance is an unlikely (though not impossible) explanation for observed association
• Does not mean cause and effect or indicate “public health significance”
• Is affected by size of study (the more subjects included in a study, the smaller the p-value will be regardless of the measure of association)
> Statistical significance
30Epidemiologic investigation
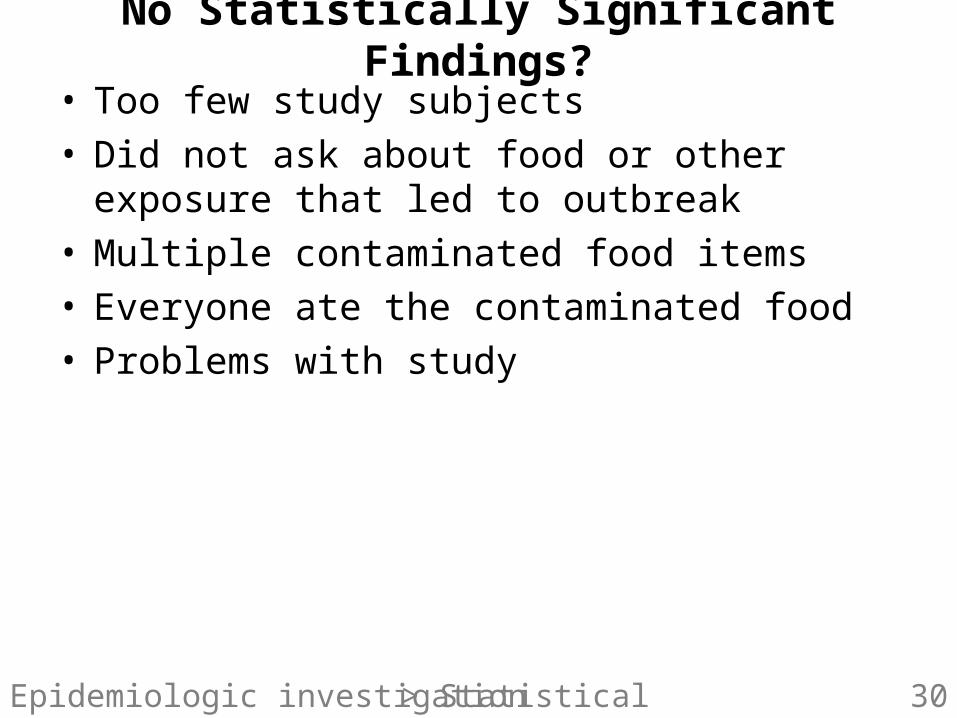
No Statistically Significant Findings?
• Too few study subjects• Did not ask about food or other exposure that
led to outbreak• Multiple contaminated food items• Everyone ate the contaminated food• Problems with study
> Statistical significance
31Epidemiologic investigation
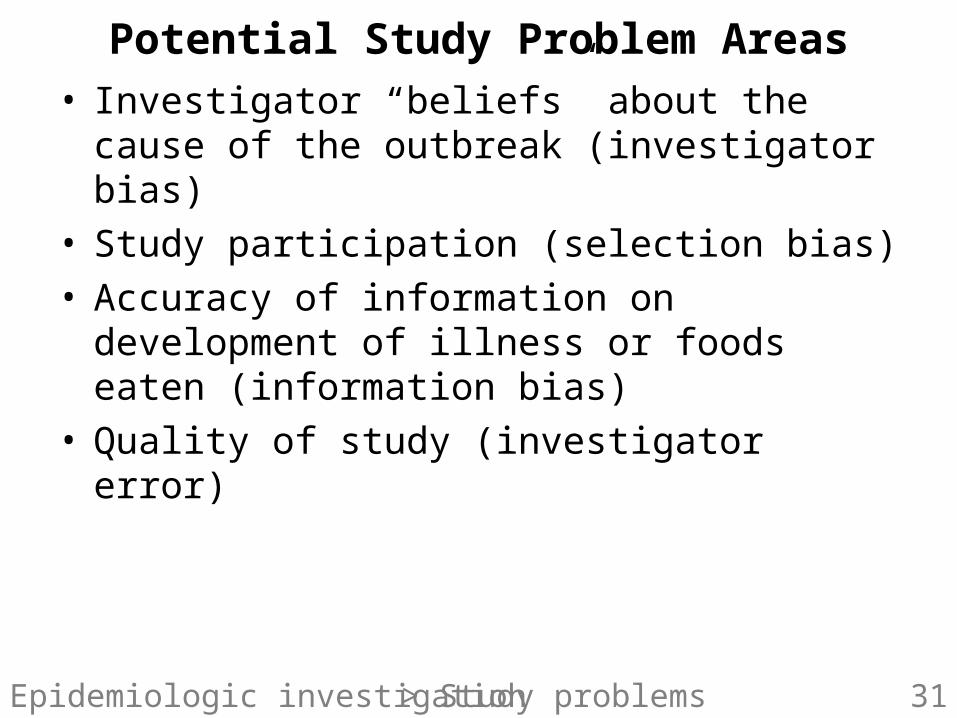
Potential Study Problem Areas• Investigator “beliefs” about the cause of the
outbreak (investigator bias)• Study participation (selection bias)• Accuracy of information on development of
illness or foods eaten (information bias) • Quality of study (investigator error)
> Study problems
32Epidemiologic investigation
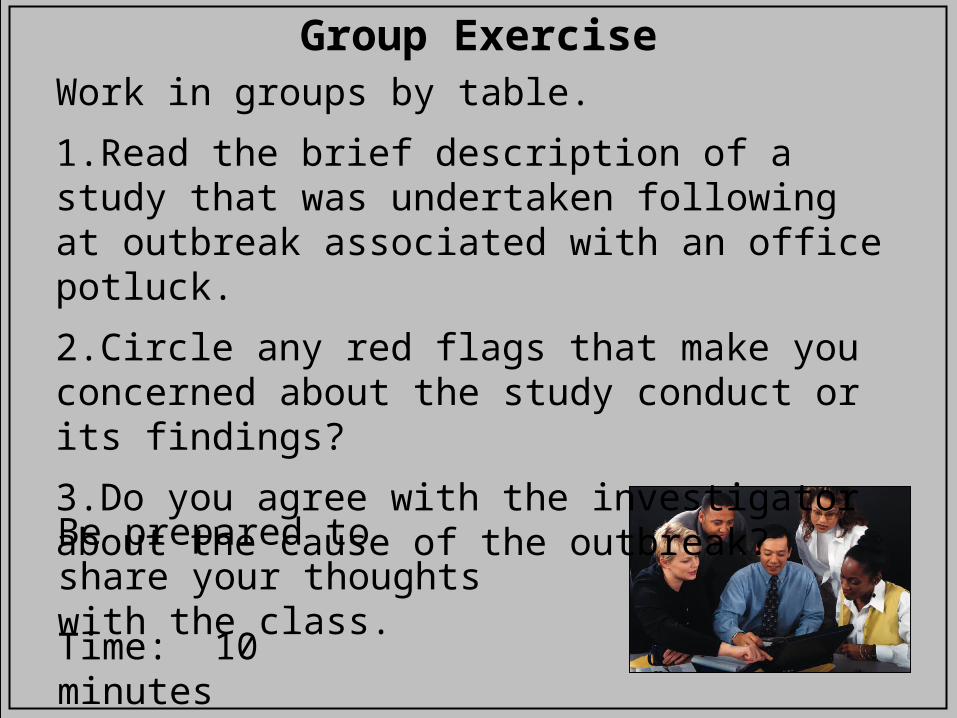
Group Exercise
Time: 10 minutes
Work in groups by table.
1.Read the brief description of a study that was undertaken following at outbreak associated with an office potluck.
2.Circle any red flags that make you concerned about the study conduct or its findings?
3.Do you agree with the investigator about the cause of the outbreak?
Be prepared to share your thoughts with the class.
33Epidemiologic investigation
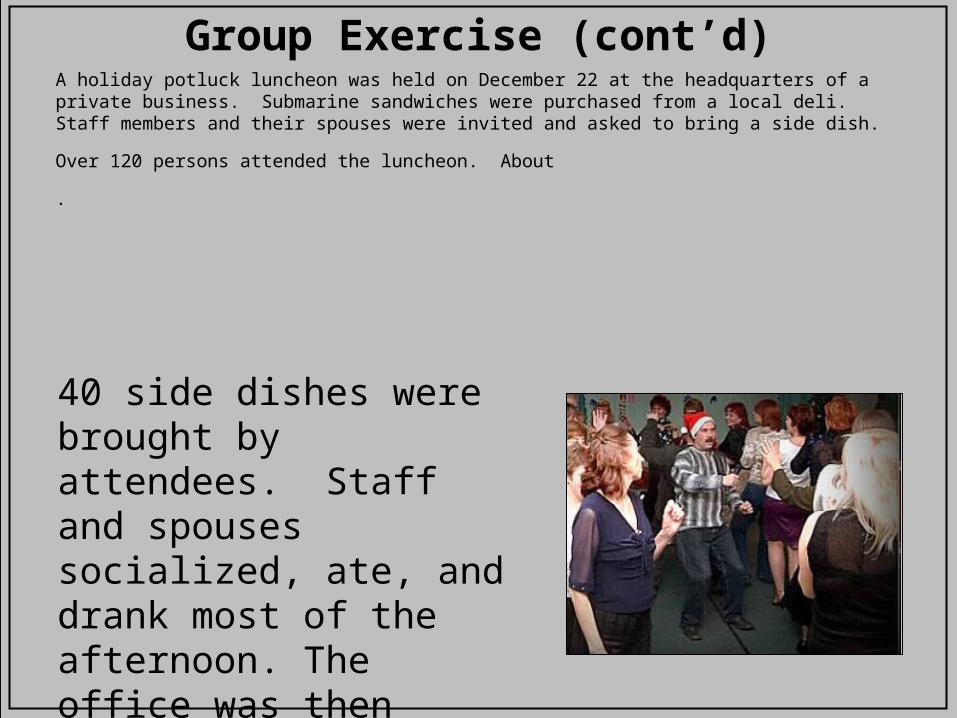
Group Exercise (cont’d)A holiday potluck luncheon was held on December 22 at the headquarters of a private business. Submarine sandwiches were purchased from a local deli. Staff members and their spouses were invited and asked to bring a side dish.
Over 120 persons attended the luncheon. About
.
40 side dishes were brought by attendees. Staff and spouses socialized, ate, and drank most of the afternoon. The office was then closed for the holidays.
34Epidemiologic investigation
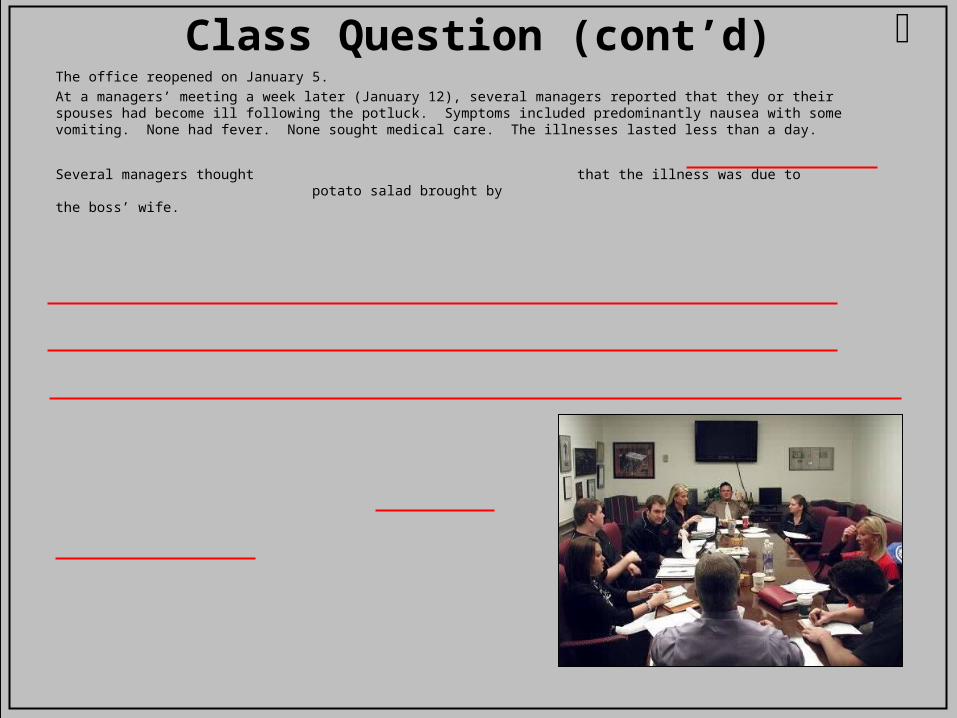
Class Question (cont’d)The office reopened on January 5.
At a managers’ meeting a week later (January 12), several managers reported that they or their spouses had become ill following the potluck. Symptoms included predominantly nausea with some vomiting. None had fever. None sought medical care. The illnesses lasted less than a day.
Several managers thought that the illness was due to potato salad brought by the boss’ wife.
35Epidemiologic investigation
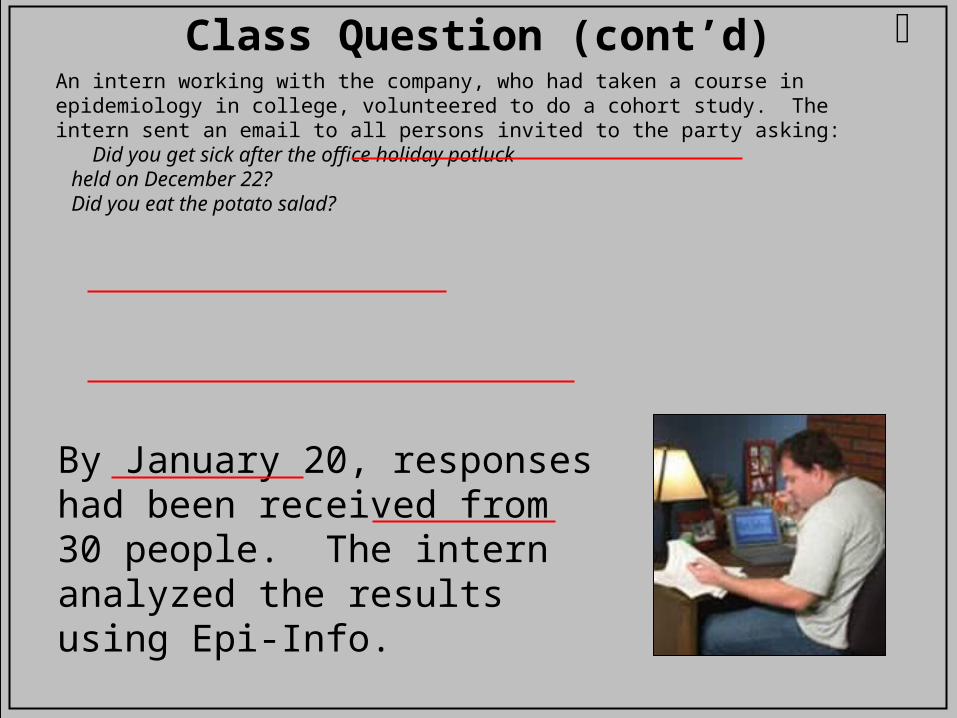
Class Question (cont’d)An intern working with the company, who had taken a course in epidemiology in college, volunteered to do a cohort study. The intern sent an email to all persons invited to the party asking: Did you get sick after the office holiday potluck held on December 22? Did you eat the potato salad?
By January 20, responses had been received from 30 people. The intern analyzed the results using Epi-Info.

36Epidemiologic investigation
Class Question (cont’d)The intern reported his findings to the boss: Fourteen people who attended the potluck said they had been ill. 15 said they had not been ill. Ten of the 14 ill were managers or their spouses. The 10 ill managers or spouses said they all had eaten potato salad made by the boss’ wife.
The intern shared these calculations:•10 (64%) of 14 ill people ate potato salad.•4 (25%) of 16 well people ate potato salad.
odds ratio=10 p-value = 0.04 95% CI = 2.2-8.0

37Epidemiologic investigation
Class Question (cont’d)The intern reported to the boss that the outbreak was caused by his wife’s potato salad and that he was not surprised because it tasted terrible.
The intern was reassigned to the file storage room in the basement.

38Epidemiologic investigation
ALWAYS SCRUTINIZE STUDY RESULTS!
> Study problems
39Epidemiologic investigation
Quick Quiz
40Epidemiologic investigation
Quick Quiz
1. A case series includes a comparison group.
A. True
B. False
41Epidemiologic investigation
Quick Quiz
2. What is the measure of association for a case-control study?
A. Odds ratio
B. Relative risk
C. p-value
D. Confidence interval

42Epidemiologic investigation
Quick Quiz
3. In a cohort study, the relative risk for drinking apple cider is 4.9. Which interpretation is correct?
A. Apple cider is the cause of the outbreak.
B. People who drank apple cider were almost 5 times more likely to become ill than those who did not.
C. Apple cider is protective.
D. The association between apple cider and illness is statistically significant.
43Epidemiologic investigation
Quick Quiz
4. Which of the following is a true statement about the p-value?
A. The p-value cut-off for statistical significance is always 0.05.
B. The p-value indicates the public health significance of an association between a food and an illness.
C. The p-value is not affected by study size.
D. A p-value of 0.05 means that there is a 5 in 100 probability that the observed association between the food and illness is due to chance alone.
44Epidemiologic investigation
Quick Quiz
5. Only epidemiologists should interpret results from epidemiologic studies.
A. True
B. False
45Epidemiologic investigation
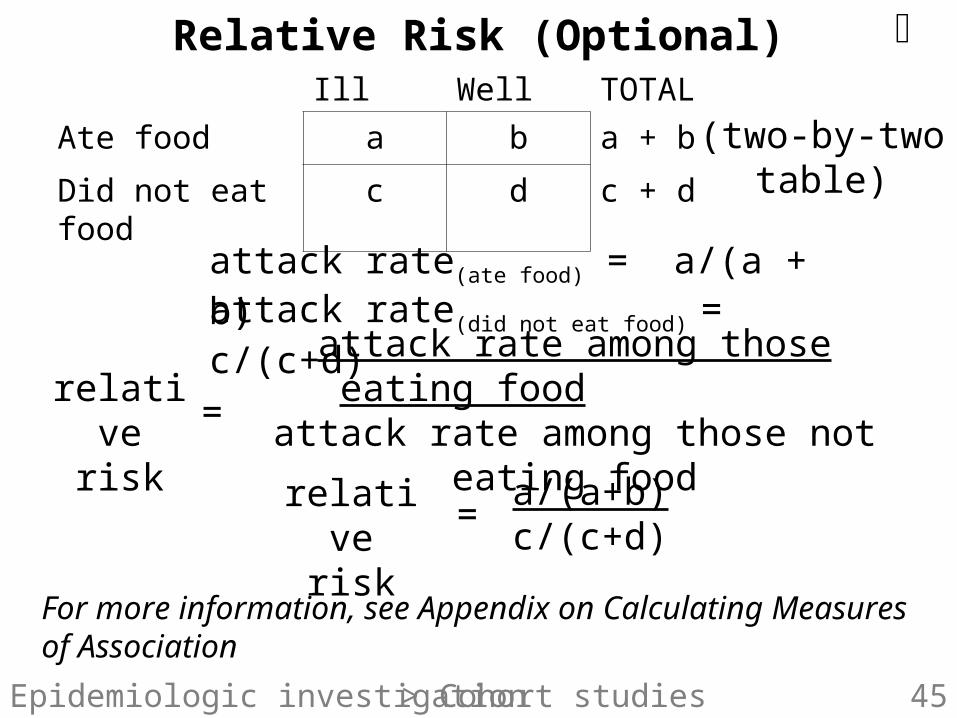
Relative Risk (Optional)Ill Well TOTAL
Ate food a b a + b
Did not eat food c d c + d
attack rate among those eating food
attack rate among those not eating food
relative risk =
a/(a+b) c/(c+d)
=relative
risk
attack rate(ate food) = a/(a + b)
(two-by-two table)
attack rate(did not eat food) = c/(c+d)
> Cohort studies
For more information, see Appendix on Calculating Measures of Association
46Epidemiologic investigation
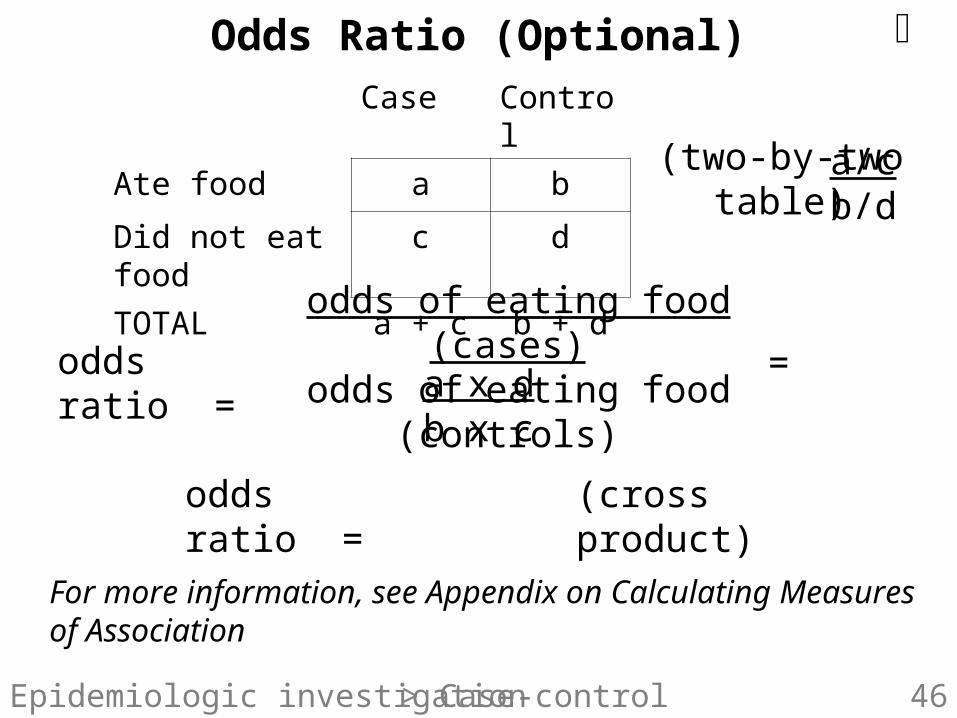
Odds Ratio (Optional)Case Control
Ate food a b
Did not eat food c d
TOTAL a + c b + d
odds of eating food (cases) odds of eating food (controls)
odds ratio = =
a/cb/d
odds ratio =
a x db x c
(cross product)
(two-by-two table)
> Case-control studies
For more information, see Appendix on Calculating Measures of Association