Embed Size (px)
Citation preview

1Developing a System-Level Monitoring Instrument for UV-Curing Systems
Dr. Peyman H. Dehkordi, James L. Riner, and Douglas E. Ingram Applied Computing Technology, Inc.
1010D Commerce Park Drive Oak Ridge, TN 37830 Phone: 865-220-0777 Fax: 865-220-2030
http://www.applied-computing.com ABSTRACT The concept of reliability-centered maintenance has been around since the 1930’s. Maintenance has evolved from the “fix it when it is broken” mode of operation to a philosophy of maintenance where technology and expectations meet in an effort to improve operation, reduce operating costs and increase equipment longevity. Monitoring has also progressed from the processing of sensor information installed on a piece of machinery, to developing custom inspection, test and measurement systems that provide extremely useful diagnostic information on manufacturing processes themselves. This trend is taking reliability-centered maintenance to the next level and requiring more complex system-level development efforts. The pharmaceutical manufacturing industry identified the need for improved maintenance and more complex system-level monitoring of their UV curing process that can be used for other industrial applications. This resulted in the development of a new spectrometer-based monitoring instrument that would meet that need. This paper will discuss the challenges involved in developing a spectrometer-based monitoring instrument, and its associated software, for use in evaluating the operation and maintenance of ultraviolet curing systems. It will also briefly summarize the customer benefits the instrument provides in calibrating and/or optimizing the curing systems used, to show the correlation between the quality of the curing process and the diagnostic capability now available to engineering personnel. INTRODUCTION Ultraviolet (UV) curing is defined as the hardening of a liquid film or coating as the result of exposure to ultraviolet light. The uses for UV curing technology are growing at an astounding rate. A few of the industries where UV curing are used include: adhesives, graphic arts, metal coatings, building materials, electronics, footwear, leather, textiles and medical. Since cure kinetics are sensitive to the intensity and wavelength of the radiation, it is critical that the exposure be the same throughout the production cycle. This requires a spectral intensity consistency along axis of each cure lamp as well as among all the cure lamps. As UV curing technology has grown, so has the need for improved maintenance and more complex system-level monitoring. A typical UV monitoring radiometer supplied on the market is typically a single channel instrument that usually records total energy, or provides minimum/maximum snapshots of the UV energy within a fixed UV band. These monitoring devices may be used in spot curing or more complex cure tunnels. The monitoring and diagnostic system described in this paper resulted from the need for a more complex spectroradiometeric-based system that could be used to more thoroughly evaluate the curing tunnel 1 Reprint from ASC-2000 conference

energy level at a spectral range of interest. An instrument was needed that was small enough to be able to travel through the curing tunnel on the standard conveyor system, and complex enough to empower the customer to monitor the spectral intensity output at each component position throughout the pre-cure and/or cure stations of a manufacturing line. In addition, it was desirable to download and analyze the acquired data to properly evaluate the spectral output at each exposure position within the tunnel. The ultimate objective of this development project was to provide an instrument that would provide an electronic signature for a given curing system. This instrument then can be used to periodically monitor, calibrate, and optimize the operation of the curing system. For most UV curing systems are considered new equipment for manufacturers, and the employees that must run and maintain the equipment are not familiar with the comprehensive preventive maintenance necessary. An ultraviolet curing system preventive maintenance program is one that will encompass a total evaluation of the entire curing process. In most manufacturing operations today, lost production time is costly. More attention is being paid to the UV curing recipe (consistent spectral output and energy), due to its critical nature, and bulb life, due to their high cost. As an example, bulb maintenance is a major engineering issue in curing systems for the following reasons: 1. Bulb usage logs do not reflect high power versus low power times, but only the amount of time
that current has passed through the lamp. They also do not reflect starts, another critical component of bulb life. Therefore, time logs do not providing the information desired relating to bulb replacement frequency.
2. It is possible for a bulb’s spectral output to change over time, a variable that must be controlled
by the manufacturer because of the result, producing products that are either uncured or partially uncured. Spectral output effect is what we like to call the curing recipe, a critical item in curing system efficiency.
3. The level of energy produced by the bulb may change over time effecting a production run of the
product being cured. In many ink, coating, or adhesive curing applications, total energy determines the degree of polymerization. If each lamp operates at different levels, then it is possible to have portions of the production run cured at different energy levels.
4. Particles or foreign material on the bulb causes additional heat generation, which darkens the thin
film on the surface and reduces the amount of energy, which can be transmitted by the bulb. 5. When curing problems are found, reflectors should also be evaluated. Reflectors focus the light
energy from the ultraviolet lamps to the product being exposed. They lose their reflecting properties over time due to a variety of factors.
Proponents of UV curing emphasize the following advantages it possesses: 1. UV curing is energy efficient when compared to other forms of drying or curing and can result in
lower production costs. 2. UV curing has found a number of new applications in recent years that enable manufacturers to
cut costs and reduce production time. 3. UV curing has created floor space savings since a holding area is no longer necessary, or is
greatly reduced, to house products that require drying or curing time.
4. UV curing is an environmentally sound practice, as it does not release contaminants into the air,
which may have adverse health effects. 5. UV curing has improved the quality of products manufactured due to its uniformity. 6. The acceptance of UV curing technology has resulted in technological improvements in the
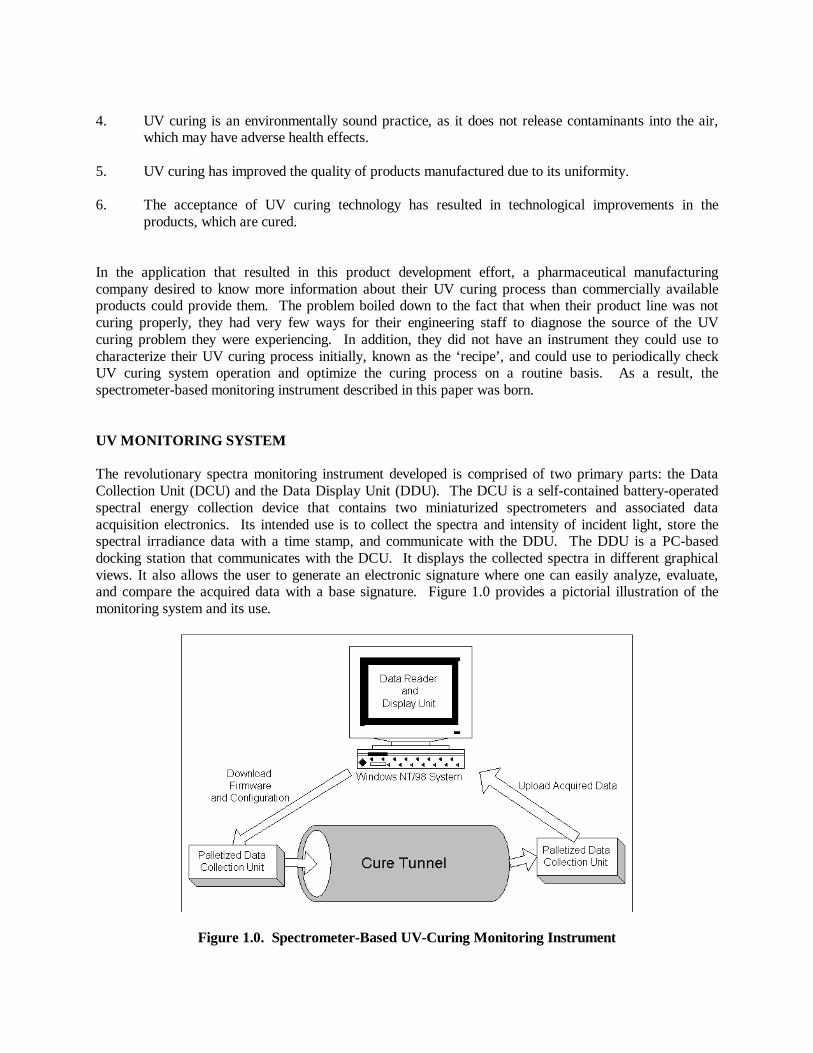
products, which are cured. In the application that resulted in this product development effort, a pharmaceutical manufacturing company desired to know more information about their UV curing process than commercially available products could provide them. The problem boiled down to the fact that when their product line was not curing properly, they had very few ways for their engineering staff to diagnose the source of the UV curing problem they were experiencing. In addition, they did not have an instrument they could use to characterize their UV curing process initially, known as the ‘recipe’, and could use to periodically check UV curing system operation and optimize the curing process on a routine basis. As a result, the spectrometer-based monitoring instrument described in this paper was born. UV MONITORING SYSTEM The revolutionary spectra monitoring instrument developed is comprised of two primary parts: the Data Collection Unit (DCU) and the Data Display Unit (DDU). The DCU is a self-contained battery-operated spectral energy collection device that contains two miniaturized spectrometers and associated data acquisition electronics. Its intended use is to collect the spectra and intensity of incident light, store the spectral irradiance data with a time stamp, and communicate with the DDU. The DDU is a PC-based docking station that communicates with the DCU. It displays the collected spectra in different graphical views. It also allows the user to generate an electronic signature where one can easily analyze, evaluate, and compare the acquired data with a base signature. Figure 1.0 provides a pictorial illustration of the monitoring system and its use.
Figure 1.0. Spectrometer-Based UV-Curing Monitoring Instrument

Through the use of an optical sensor, the pallet-based test device is placed on a conveyor system where it acquires a synchronized spectrum in the customer process, converts the raw spectrogram into a calibrated spectrogram for each wavelength, displays the spectrum on the computer screen, and uses ACT’ proprietary desktop software to evaluate the spectral data acquired from one test to another. This product enables the customer to acquire important spectral information about their process. The new product developed by ACT is called SPECTRALYZE, as seen in Figure 2.0. This single-channel instrument may be used for position-sensitive or time-sensitive measurements. An important capability of the instrument is its ability to map the energy levels acquired by the data collection unit over time. An innovative post-acquisition display of the data is available to allow for easy comparison of the spectral output from each position measured over time. This feature enables the user to analyze and optimize their operations based on the data acquired.
Figure 2.0 SPECTRALYZE Monitoring Instrument
As a position-sensitive or time-sensitive instrument, the Spectralyze desktop software enables the user to configure the monitoring instrument in a manner which provides the most information about the customers curing process. The configuration screen seen in Figure 3.0 is divided into three parts: General, Acquisition Start and Acquisition Stop. The General section of the configuration screen enables the user to set integration time and sample time in milliseconds, and whether you desire a high gain option. Integration time is how much data is taken for each sample. The minimum integration time is 22 milliseconds and the maximum value is roughly 18 seconds. Sample time is defined at the frequency at which data is taken in the curing tunnel. The minimum sample time is 66 millisecond plus the amount of integration time, while the maximum value is roughly 18 seconds. The High Gain option is a high sensitivity option which allows the user to set a shorter exposure or integration time when the high gain option is place, to get a better representative picture of the UV bulbs in the curing tunnel.

Since the user wants to be able to thoroughly evaluate the data acquired, a method of setting when data acquisition is started and stopped is necessary. How the user configures the instrument is dependent on whether they are looking for position-sensitive or time-sensitive information. If a position-sensitive measurement is desired, then acquisition will be based on an irradiance level in percent. If a time-sensitive measurement is desired, then acquisition will be based on a time measurement in seconds, or the time it takes to go through the curing tunnel.
Figure 3.0. SPECTRALYZE Configuration Screen Technical specifications for the Spectralyze monitoring system include the following:
Table 1.0
DATA COLLECTION UNIT
Physical dimensions: 120mm x 60 mm x 20 mm (4.75 in. x 2.40 in. x 0.80 in.) Spectral range: 380-750 nm standard (range can be specified by the customer) Spectral resolution: 7 nm Minimum scan time 22 ms Collection capacity: 1024 full range spectra
Integration time Sample time Start-of-acquisition method: threshold (percentage of total signal) or delay time (specified in seconds).
Downloadable parameters:
Stop-of-acquisition method: threshold (percentage of total signal) or total acquire time (specified in seconds).

Table 2.0
DATA DISPLAY UNIT
Operating platform: Windows 98/NT Software package: Spectralyze desktop software
Absolute Energy vs. Wavelength Absolute Energy vs. Time (one wavelength, selectable by user) Accumulated Energy vs. Time
Display views:
Relative spectral energy Mathematical operations: Add, Subtract, Average, and Divide Customize graphs: Ability to zoom into any area of both the X and Y axis. Data Analysis: Minimum, maximum, average, standard deviation, and sum of
the spectra region of interest. Archival: Storage of acquired spectra in files with long file names and a
hierarchical folder topology. In this case, the customer felt they wanted to look in the visible light range, in addition to the ultraviolet light range, hence the wider-range spectrometer chosen. They surmised that a portion of the curing ‘recipe’ for their product occurs in the visible range as well. Their engineering staff desired to acquire information in a broader spectral range as a result. In discussing various applications with manufacturers involved in UV curing, the size of the instrument and the range of the spectrometer are the critical features of interest. Although the size and spectrometer range shown above are for a particular application, this instrument can easily be modified to change its size and the range of its spectrometer. RESULTS The monitoring instrument developed provides a tremendous amount of information about the customers curing process. Since the instrument can be used for both position-sensitive and time-sensitive measurements, the process and R&D engineering staff now has the capability to thoroughly evaluate their curing system, characterize their curing process, diagnose problems which occur in the process, and optimize the curing process on a regular basis. In evaluating the data, customers have the ability to view the information acquired in a variety of ways: energy vs. wavelength, energy vs. time, and accumulated energy vs. time. The energy vs. wavelength view shows the Y-axis as spectral irradiance and the X-axis as wavelength (Figure 4.0). This is a common spectrograph view used often to examine the spectrograph curve for peaks and valleys. In this view, multiple spectra taken over time will be displayed overlapped. Using the plus key, the user may select different spectra of focus, of which its statistics will be displayed to the right.

Figure 4.0. Energy vs. Wavelength Graph
The energy vs. time view will show a graph with the Y-axis as spectral irradiance and the X-axis as time (Figure 5.0). The graph is displayed for only one wavelength, showing how the irradiance at that particular wavelength changes over time. Using the plus key, the user may select different wavelengths to display.
Figure 5.0. Energy vs. Time Graph The accumulated energy vs. time view will display a graph with the Y-axis as spectral irradiance and the X-axis as time (Figure 6.0), much like the energy vs. time view. The difference is that the energies over time are summed to graph a total energy dose as delivered to the spectrometer. The graph is displayed for only one wavelength. Using the plus key, the user may select different wavelengths to display.

Figure 6.0. Accumulated Energy vs. Time Graph Although the data can be manipulated and displayed in a variety of ways, the views shown above provide the information engineering personnel typically desire about their process. That information can be used by the engineering staff to initially characterize and periodically evaluate their UV curing systems to provide for a more thorough maintenance program. CASE STUDY In the following example of monitoring and quality control, the Spectralyze instrument is passed through a cure tunnel several times over the course of one week. As the data for this particular example will show, a cure lamp within the tunnel is degrading and emitting less energy, as detected at 420 nm, until the lamp is exhausted and emitting no light at all. While the human eye could not detect the subtle changes in irradiance, the Spectralyze instrument can allow the operator to detect the problem early and replace the curing lamp before quality issues arise. Figures 7.0 through 13.0 show the energy vs. time graphs of the passes made through the cure tunnel as the lamp degraded.

Figure 7.0. Pass Number 12
Figure 8.0. Pass Number 15

Figure 9.0. Pass Number 18
Figure 10.0. Pass Number 21

Figure 11.0. Pass Number 24
Figure 12.0. Pass Number 27

Figure 13.0. Pass Number 28
CONCLUSION With a need for a more technology-based approach to UV curing system diagnostics, this new instrument provides engineering personnel with a tool that can be used to optimize and evaluate the UV curing process. As experience with this spectrometer-based instrument grows, additional applications will be found with a need to improve system operation, reduce operating costs and increase equipment longevity. In the development of this instrument, technology and information have come together to meet a manufacturing need to create more complex system-level monitoring capabilities for plant engineering and R&D personnel. BIBLIOGRAPHY 1. Moubray, John, Reliability-Centered Maintenance, ISBN number 0831130784, TWI Press Inc.,
Terre Haute, Indiana, 1997. 2. Panico, Louis R., Current Developments in Pulsed Light or “Flash” Curing Technology, Xenon
Corporation, white paper. 3. Siegel, Stephen B., Ultraviolet Curing System and Process, UV Process Supply, Inc. white paper. 4. Siegel, Stephen B., The Maintenance of UV Curing Equipment, Radiation Curing, Volume VII,
Number 1, February, 1980.