Embed Size (px)
Citation preview

Document2 05/26/00 1
SEATTLE PUBLIC UTILITIES ANDITS WHOLESALE PURVEYORS
1999 WATER CONSERVATION SURVEY
Final Report
Prepared for:
Seattle Public Utilities and Its Wholesale Purveyors
Prepared by:
Linda Dethman
DETHMAN & TANGORA LLC
1719 Bigelow Ave. N.
Seattle, WA 98109
April 2000

Document2 05/26/00 1
SEATTLE PUBLIC UTILITIES AND ITS WHOLESALE PURVEYORS
1999 WATER CONSERVATION SURVEY
Final Report
April 2000
Table of Contents
EXECUTIVE SUMMARY ............................................................................................ i
Study Purposes ....................................................................................................... i
Methods................................................................................................................... i
Key Findings............................................................................................................ i
Demographics and Household Characteristics ................................................... ii
Attitudes About Water Conservation ................................................................... ii
Motivations to Save Water ................................................................................. iii
Water Conservation Knowledge and Behaviors................................................. iv
Summary of Changes in Attitudes and Behaviors Since 1994 ........................... vi
Customer Information Sources ......................................................................... vii
Profiles of Key Customer Segments .................................................................viii
Conclusions and recommendations......................................................................viii
CHAPTER ONE – BACKGROUND, METHODS, AND DEMOGRAPHICS...............1
Study Background and Purposes ...........................................................................1
Study Methods........................................................................................................1
Approach.............................................................................................................1
Comparisons With Prior Survey Data..................................................................2
Table and Figure Notes.......................................................................................2
Demographic and Household Characteristics.........................................................3
Summary.............................................................................................................3

SPU and Purveyor Water Conservation Survey – Final Report Table of Contents
Document2 05/26/00 2
CHAPTER TWO – BASIC VIEWS ABOUT WATER AND ENVIRONMENTALISSUES ......................................................................................................................6
Q1: How concerned are you that your community may face major water supplyproblems over the next five years? .....................................................................6
Q2: Why do you give that rating?.......................................................................7
Q3: Do you believe the actions of individual households like yours can greatlyaffect whether we have enough water to meet the future demands of our region,somewhat affect whether we have enough water, or have little effect on whetherwe have enough water? ......................................................................................8
Q4: How important is it for your household to actively conserve water? ............9
Q5: How much more could you realistically do to save water in your home?...11
Q6: If you knew that the same rivers that salmon depend on for survival alsosupply your water, and that if all households saved water we would haveenough water for salmon and people, how likely would you be to take steps tosave water at home?.........................................................................................12
Q7. If you knew you could save 5-10% on your water and sewer bills by cost-effectively saving water, how likely would you be to take steps to save water athome? ...............................................................................................................12
Q8. Our region may be able to delay the development of new and more costlywater supplies if every household reduced the amount of water it uses by 1%each year for 10 years. Knowing this, how likely would you be to take steps tosave water at home?.........................................................................................12
Q9. If you knew that it would help protect the environment for now and futuregenerations, how likely would you be to take steps to save water at home? ....12
Q10. Which is the single most important reason you would take steps to savewater? 1) Saving water for salmon. 2) Saving water to save money on yourbill. 3) Saving water to delay new, more costly water supplies. OR 4) Savingwater to help protect the environment? .............................................................14
CHAPTER THREE – INDOOR WATER USE ..........................................................16
Largest Uses ........................................................................................................16
Q11. Inside their homes, people mostly use water to wash their clothes, takebaths and showers, and flush toilets. Of these three ways to use water, whichtwo do you think are the largest uses in your home? ........................................16
Showerheads and Showers..................................................................................18
Q12: In 1992, your household should have received a low-flow showerheadfrom your water utility. Was this showerhead installed in your home? ..............18

SPU and Purveyor Water Conservation Survey – Final Report Table of Contents
Document2 05/26/00 3
Q13: Is it still there, did you put your old showerhead back in, or did youreplace it with a new showerhead at a later date? ............................................18
Q14: Have you installed a new showerhead in your home since 1993? ..........18
Q15: Do most showers in your household last 5 minutes or less, or do they lastmore than five minutes?....................................................................................19
Toilets ...................................................................................................................20
Q16. Do you usually flush the toilet with every use, or do you often allow two ormore uses before flushing?...............................................................................20
Q17. How many toilets do you have in your home?..........................................20
Q18. In the past year, have you checked any of your toilets for leaks? ...........20
Q19. How many toilets have you replaced or installed new in the past 7 years –that is, since 1993? ...........................................................................................24
Q20. How satisfied are you with the new toilet?...............................................24
Q21. Within the next two years, how likely will you be to replace any toilet inyour home that is in good working order?. ........................................................24
Q22. Will you replace this toilet because you plan to remodel, because you’dlike to save water, because you’d like to save money on your water and sewerbill, or for some other reason? ..........................................................................24
Q23. How likely would you be to spend about $100 to replace a working toilet inyour home with a new low-flow, 1.6 gallon per flush model, if you could recoveryour cost through lower water and sewer bills in less than 2 years?.................27
Washing Machines ...............................................................................................28
Q24: Have you ever heard of tumble action or horizontal-axis washing machinesthat are designed to save water and energy? ...................................................28
CHAPTER FOUR – OUTDOOR WATER USE ........................................................30
Incidence of Yards and Lawns..............................................................................30
Q25: Do you have a yard? ...............................................................................30
Q26: Of the yard around your home that’s planted with lawn and garden, howmuch of it is lawn?.............................................................................................31
Lawn Care Preferences and Practices .................................................................32
Q27: How important is it for you to have a green lawn as part of yourlandscaping?.....................................................................................................32
Q28: How willing would you be to have a natural lawn if a natural lawn is alighter green color, has a few weeds, and is mowed a little higher than you’reused to? ............................................................................................................32

SPU and Purveyor Water Conservation Survey – Final Report Table of Contents
Document2 05/26/00 4
Lawn Watering......................................................................................................35
Q29: About how often do you water your lawn during a typical summer?.........35
Use and Maintenance of Automatic Sprinkling Systems.......................................36
Q30: Do you use an automatic sprinkling system to water your lawn? .............36
Q31: During the watering season, do you adjust the automatic system so that itwaters less when it’s cooler and more when it’s hotter? ...................................36
Q32: Do you inspect your automatic system for leaks at least once a year? ....36
Lawn Care ............................................................................................................38
Do you . . ..........................................................................................................38
Q33. Usually mow your lawn with a mulching mower? ....................................38
Q34. Usually leave your grass clippings on your lawn? ...................................38
Q35. Usually use an organic or slow release fertilizer on your lawn? ..............38
Q36. Usually use a “weed ‘n’ feed” type product on your lawn? ......................38
Q37. Usually use pesticides to control crane flies?..........................................38
Q38. Usually aerate and over-seed your lawn? ...............................................38
Lawn Removal and Replacement .........................................................................40
Q39: In the past five years, since 1994, have you removed any of your lawn?40
Q40: Did you replace your lawn with garden areas with plants and shrubs,including rockeries, or something else like a patio, deck, or garage? ...............40
Other Yard Care Practices....................................................................................41
Q41. Do you mostly maintain your own yard, mostly hire a professional yardservice to maintain it, or do you do both?..........................................................41
Q42. Do you use any low volume watering methods in your garden such as dripirrigation? ..........................................................................................................42
Q43. Do you usually mulch your planting beds? ..............................................42
Q44. Do you usually improve your soil with compost or other organicamendments? ...................................................................................................42
CHAPTER FIVE – COMMUNICATING ABOUT WATER RESOURCE ISSUES.....44
Q45: Where would you most likely get information about lawn and gardencare? .................................................................................................................44
Q46: Where would you most likely get information about appliances such asshowerheads, toilets and washing machines? ..................................................45

SPU and Purveyor Water Conservation Survey – Final Report Table of Contents
Document2 05/26/00 5
Q47: And where would you get information about water supply andenvironmental issues such as restoring salmon runs, preventing pollution, andmanaging garbage? ..........................................................................................46
Q48: Which one of the following six words would you most like to see or hear ina message about how you could help to manage our resources: sustainable;conservation; environmental; natural; naturally, and salmon friendly. ..............47
Q49: Please complete this sentence. “It’s important for people in our area tomanage our resources because. . . ..................................................................49
CHAPTER SIX – PROFILES OF KEY CUSTOMER SEGMENTS...........................50
Attitudinal Segments.............................................................................................50
Importance Of Conserving ................................................................................50
How Much More Water Can You Save? ...........................................................51
Indoor Use Segments ...........................................................................................51
Installing Low-Flow Showerheads.....................................................................51
Toilets: Awareness Of Water Used In Flushing.................................................52
Toilets: Multiple Uses Before Flushing, Checking For Leaks, Replacements ..52
Toilets: Future Replacements ...........................................................................53
Outdoor Use Segments ........................................................................................55
General Yard and Garden Practices .................................................................55
Incidence And Size Of Lawn .............................................................................56
Importance Of Having A Green Lawn ...............................................................56
Frequency of Watering......................................................................................57
Lawn Removal ..................................................................................................58
Traditional and Environmentally Friendly Lawn Care Practices ........................58
Watering Practices............................................................................................59
List of Tables
Table 1 - Water Conservation Areas of Change and Stability ................................... vi
Table 2 - Where Customers Go to Get Information.................................................. vii
Table 3 - Summary Table of Demographics (Q51-57) ...............................................4
Table 4 - Level of Concern About Water Supply Problems (Q1) ................................7
Table 5 - Reasons for Concern or Lack of Concern About Water Supply (Q2) ..........7

SPU and Purveyor Water Conservation Survey – Final Report Table of Contents
Document2 05/26/00 6
Table 6 - How Conserving Can Affect The Water Supply (Q3) ..................................9
Table 7 - Importance of Conserving (Q4) .................................................................10
Table 8 - Two Largest Uses of Water Indoors (Q11)................................................17
Table 9 - Checked toilet for leaks? (Q18).................................................................23
Table 10 - Reasons to Replace Toilet in the Next Two Years (Q22) ........................27
Table 11 - Amount of Lawn in the Yard (Q26)..........................................................32
Table 12 - Importance of Green Lawn (Q27)............................................................33
Table 13 - How Often Lawn is Watered (Q29) .........................................................36
Table 14 - Use of Automatic Watering Systems.......................................................37
Table 15 - Removed any Lawn? (Q39) ....................................................................41
Table 16 - Most Important Reason To Conserve (Q 10) By Importance OfConservation (Q4).............................................................................................51
Table 17 - Toilet Replacement Under Various Conditions........................................54
Table 18 - Importance Of A Green Lawn (Q27) By Conservation Attitudes .............56
Table 19 - Likelihood Of A Natural Lawn by (Q28) By Conservation Attitudes.........57
Table 20 - Frequency of Watering by Income Levels ...............................................57
List of Figures
Figure 1 - Single Most Important Reason To Save Water......................................... iii
Figure 2 - Level of Concern About Water Supply Problems (Q1)...............................6
Figure 3 - How Much Individual Actions Can Affect Having Enough Water (Q3) .......8
Figure 4 - Importance of Conserving Water (Q4) .....................................................10
Figure 5 - Doing More to Save Water in the Home (Q5) ..........................................11
Figure 6 - Reasons to Take Steps to Save Water (Q6-9).........................................13
Figure 7 - Single Most Important Reason to Save Water (Q10) ...............................15
Figure 8 - Two Largest Uses of Water Indoors (Q11) ..............................................17
Figure 9 - Use of Low-flow Showerheads in Home (Q12-14) ...................................18
Figure 10 - Length of Most Showers (Q15) ..............................................................20
Figure 11 - How Often Toilet Is Flushed (Q16).........................................................21
Figure 12 - Number of Toilets in the Home (Q17) ....................................................22
Figure 13 - Toilets Checked For Leaks (Q18) ..........................................................23
Figure 14 - Number of Toilets Replaced Since 1993 (Q19)......................................24

SPU and Purveyor Water Conservation Survey – Final Report Table of Contents
Document2 05/26/00 7
Figure 15 - How Satisfied With New Toilet (Q20).....................................................25
Figure 16 - Likelihood of Replacing Good Working Order Toilet (Q21) ....................26
Figure 17 - How Likely to Replace Toilet With Low-Flow Model (Q23) ....................28
Figure 18 - Knowledge of Water- and Energy-Saving Washing Machines (Q24).....29
Figure 19 - Respondents Who Have A Yard (Q25) ..................................................30
Figure 20 - Amount of Lawn Area in Yard (Q26) ......................................................31
Figure 21 - Importance of Having a Green Lawn (Q27) ...........................................33
Figure 22 - Likelihood of Having a Natural Lawn (Q28) ...........................................34
Figure 23 - How Often Lawn Is Watered During a Typical Summer (Q29)...............35
Figure 24 - Use Of Automatic Sprinkler System (Q30 - Q32)..................................37
Figure 25 - Lawn Care Practices (Q33-38)...............................................................39
Figure 26 - Replacement of Lawn in the Yard (Q39-40)...........................................40
Figure 27 - How Yard is Maintained (Q41) ...............................................................41
Figure 28 - Use of Low-Volume Watering (Q42), Mulching (Q43), and Composting(Q44) Methods ..................................................................................................42
Figure 29 - Information about Lawn and Garden Care (Q45)...................................45
Figure 30 - Information About Appliances (Q46) ......................................................46
Figure 31 - Information About Water Supply and Environmental Issues (Q47) ........47
Figure 32 - “Message” Words Regarding Managing Resources (Q48) ....................48
Appendices
Appendix A: Questionnaire

SPU and Purveyor Water Conservation Survey – Final Report Executive Summary
Document2 05/26/00 i
EXECUTIVE SUMMARY
Study Purposes
This study is part of an ongoing effort by Seattle Public Utilities and its wholesalePurveyors to understand, track, and address the needs of residential customers withregard to water conservation. The goals of the 1999 research were to:
Ø Identify and evaluate changes in perceptions, attitudes, and behaviors ofresidential customers toward water conservation
Ø Help guide effective programs to foster and achieve conservation amongresidential customers
Residential customers account for over half of SPU’s total water consumption. Witha mandate to step up water conservation efforts in the coming years, understandingand serving residential consumers is central to meeting conservation goals.
Methods
Seattle Public Utilities hired Dethman & Tangora LLC, a market research firm inSeattle, to conduct the research. Telephone interviews with a randomly selected,representative sample of 603 residential customers from Seattle and 620 residentialcustomers from Purveyor service areas were conducted during October, 1999. Thefollowing margins of error and confidence intervals apply:
Ø Overall Population Sample = 1223. This sample has been weighted to reflect therelative proportions of Seattle (45%) and Purveyor (55%) populations. A sample of thissize carries a +/– 2.9% margin of error with 95% confidence.
Ø Seattle Sample = 603, carries a +/– 4.1% margin of error with 95% confidence.
Ø Purveyor Sample = 620, carries a +/– 4.1% margin of error with 95% confidence.
The 1999 survey represents all residential households, both single family and multi-family. To show changes in customer views and behavior over time, this reportcompares 1994 survey data, which included only single family households, to 1999single family household data.
Key Findings
Key population findings, as well as notable differences between Seattle andPurveyor customers, are highlighted in this section. More detailed information canbe found in the main body of the report and the appendices.

SPU and Purveyor Water Conservation Survey – Final Report Table of Contents
Document2 05/26/00 ii
Demographics and Household Characteristics
Ø The vast majority of customers are homeowners, living in single family homes,Caucasian, and at least 35 years of age, as these statistics show:
• Three quarters (75%) are homeowners, although Seattle customers are morelikely to rent than Purveyor customers are.
• 78% live in single family dwellings, with Seattle customers more often living inmulti-family dwellings.
• 61% live in 1 or 2 person households.
• 80% are 35 years of age or older.
• 83% are Caucasian, with Seattle having a slightly higher minority population.
Ø Income is more varied, with just over half of customers (53%) having annualfamily incomes between $25,000 and $50,000, a quarter having incomes over$75,000, and a fifth having incomes below $25,000. Purveyor customers havesomewhat higher incomes than Seattle customers do.
Ø Two-thirds of customers (67%) who live in single family homes report their lotsare 10,000 square feet or less.
• Purveyor customers are much more likely to live on lots of ¼ acre or moreand are more likely to have yards than Seattle customers.
Attitudes About Water Conservation
Ø Customers are generally concerned about water supply and conservation, andbelieve that their actions can help solve water supply problems.
• 62% of customers are very or somewhat concerned that major water supplyproblems will face their communities over the next 5 years, due to populationgrowth and finite water supplies. However, they are significantly lessconcerned than in the 1994 survey, when they had recently experienceddrought conditions (84% very or somewhat concerned).
• 87% of customers feel their individual actions can greatly affect (42%) orsomewhat affect (45%) whether we have enough water.
• 91% believe it’s important for their households to actively conserve water(49% very important, 42% somewhat important).
• 15% of all customers feel they can save a great deal more water (over 10%)in their households more, while 29% feel they can save somewhat more (5-10%). Seattle customers feel they can save a little more than Purveyorcustomers.

SPU and Purveyor Water Conservation Survey – Final Report Table of Contents
Document2 05/26/00 iii
Motivations to Save Water
Ø Protecting the environment appears as the strongest component in customermotivations to save water. Although customers rated all four of the followingmotivations quite highly, they still discriminated among them:
• 66% said they would be very likely to conserve water if they knew it wouldprotect the environment
• 60% said delaying the development of more costly supplies would bevery likely to motivate them.
• 55% said they were motivated by having enough water for people andsalmon
• 52% said that saving money on their water bills would very likely affecttheir behavior
Ø When asked to choose the single most important reason to conserve water, thevast majority (61%) chose protecting the environment (see Figure 1).
Figure 1 - Single Most Important Reason To Save Water
Ø When asked about what one word among six read to them they would like to seeor hear in messages about managing resources, they chose familiar terms most
Which one is the single most important reason for taking steps to save water? (N=1223)
Protect environment
61%
None are important
1%
Have enough for salmon
11%
Save money15%
Delay development
10%
DK2%

SPU and Purveyor Water Conservation Survey – Final Report Table of Contents
Document2 05/26/00 iv
often: environmental (22%) and conservation (25%), and natural (13%) ornaturally (10%). Only 15% said “sustainable” and 9% said “salmon friendly.”
Ø When asked to put in their own words why they should save, protecting the earthfor future generations, environmental stewardship, and, simply, “the environment”were all strongly mentioned.
Water Conservation Knowledge and Behaviors
Indoor Water Use
Ø While two-thirds (67%) of customers report they have installed low-flowshowerheads, only half (52%) report they take showers of 5 minutes or less.
Ø Less than half (48%) of customers are aware that toilet flushing is one of twolargest indoor water uses.
• Seattle customers chose this as a top use significantly more often thanPurveyor customers (52% to 45%).
Ø About a third of customers have one toilet 35%, while 37% have two, and 25%have three.
• Purveyor customers have significantly more toilets than Seattle customers.
Ø 60% generally flush the toilet with every use
• Purveyor customers are significantly more likely to flush with every use (67%)than Seattle customers (52%).
Ø 64% of customers check their toilets for leaks
• Seattle customers are significantly less likely to check their toilets for leaks(57%) than Purveyor customers (71%).
Ø Less than a (29%) third of households report they have replaced 1 or more toiletssince 1993 (when the plumbing code changed to require low-flow toilets).
Ø Most customers (81%) have been satisfied with their new toilets.
Ø 8% of customers say they’re very likely to replace a toilet in good working orderover the next two years.
• Those who intend to replace their toilets most often say it’s because they willremodel (51%), but 24% say it’s because they want to save water.
Ø 18%, however, say they would very likely spend $100 to replace a working toiletwith a low low-flow model if they knew they could recoup the cost within 2 yearsthrough lower bills.
Ø 52% have some awareness of resource efficient washing machines.

SPU and Purveyor Water Conservation Survey – Final Report Table of Contents
Document2 05/26/00 v
Outdoor Water Use (applies only to customers with yards)
Ø 77% of all customers have yards, while 23% do not.
• Purveyor customers are significantly more likely to have yards (80%) thanSeattle customers (74%), probably indicating a higher proportion of singlefamily homes in Purveyor areas.
Ø Among the 77% of customers who have yards:
• 75% do their own maintenance.
• 66% improve their soil with compost or other organic amendments.
• 54% mulch their planting beds
• 29% use some type of low-volume watering method.
• 9% report they have no lawn areas, the same as in the 1994 survey (8%).
Ø Among the 70% of customers who have lawns:
• 46% have planted half or more of their yard area in lawn.
• 69% water their lawns during the summer but 30% do not water and 48%water once a week or less.
• 13% use pesticides to some degree, with Purveyor customers saying theyused pesticides more than Seattle customers (18% to 8%).
• 34% use “weed and feed” type products, with Purveyor customers more oftenusing these products than Seattle customers (40% to 26%).
• 29% aerate and over-seed their lawns, with Purveyor customers more likelyto do this than Seattle customers (34% to 21%).
• 29% have removed part of their lawns in the past 5 years.
• 70% of those removing lawn have replaced them with garden areas.
• 41% use organic fertilizers
• 43% use mulching mowers.
• 52% leave grass clippings on their lawns, with Seattle customers more likelyto do this than Purveyor customers (55% to 50%).
• 46% think it’s at least somewhat important to have a green lawn, withPurveyor customers more likely to find a green lawn important (52%) thanSeattle customers (37%).
• The importance of a green lawn has clearly diminished since the 1994survey, when 61% said it was at least somewhat important.

SPU and Purveyor Water Conservation Survey – Final Report Table of Contents
Document2 05/26/00 vi
• 72% respond favorably to the notion of a Natural Lawn, with Seattlecustomers more positive than Purveyor customers (77% to 69%).
Ø Of the 48% of all customers who water their lawns:
• 21% use automatic sprinkling systems. Of those using automatic systems:
• 59% adjust them according to temperature
• 74% inspect them for leaks at least once a year.
Summary of Changes in Attitudes and Behaviors Since 1994
One of the major purposes of this study was to track changes in water conservationattitudes and behaviors over time. The data show a number of gains forconservation: more customers feel they can affect water supplies, fewer customersfind a green lawn important, and customers are watering less. These gainscorrespond to programmatic efforts, and occurred despite a notable decrease incustomer concern about impending water supply problems. In addition, customerratings of the importance of conservation have remained stable.
Some areas of change have been less positive, and these changes appearassociated with less programmatic effort. The role of toilets in conservation activitiesseems less important in consumers’ minds, both in terms of how much water theyuse and keeping them in good repair. Also, the amount of yard covered with lawnappears on the rise since 1994.
The table below first lists the positive changes, followed by the areas of stability,and, finally, the areas where slippage has occurred. The numbers are for singlefamily homes only, since that was the population of the 1994 survey.
Table 1 - Water Conservation Areas of Change and Stability
Areas of Conservation Gains(Single family households only; N of respondents varies)
1994 Survey%
1999 Survey%
Can Individuals Make Supplies Last Longer?
Greatly affect/Make supplies last a lot longer 28 42
How Important is a Green Lawn?
Very important 22 16
Somewhat important 39 29
Not too important 27 28
Not at all important 12 26
How Often Do You Water Your Lawn? 1991 1994 1999
Never water 15 23 30
Twice a month or less 14 17 35
Once a week 26 35 35

SPU and Purveyor Water Conservation Survey – Final Report Table of Contents
Document2 05/26/00 vii
Table 1, continued 1991 1994 1999
Every three days 45 37 21
Every other day 14 9 7
Every day 2 2 2
Areas of Stability 1994 1999
How Important is Conserving Water?
Very important 53 50
Somewhat important 42 41
Areas of Conservation SlippageWhat Are Two Largest Indoor Water Uses?
Flushing Toilets (Note: Small loss but worth nothing since clotheswashing is up from 49% to 66% as one of the top 2.)
49 46
Toilets Checked for Leaks in Past Year?
Yes 79 68
How Much of Yard is Lawn?
No lawn 8 9
Up to ¼ of yard area 27 19
¼ to ½ 32 25
½ to ¾ 24 27
Over ¾ of yard area 8 20
Don’t know - 1
Customer Information Sources
Ø Customers clearly depend upon different information sources to gather differenttypes of information, as shown in Table 2 below. Newspapers are the bestcross-over source.
Table 2 - Where Customers Go to Get Information
Where customersgo to getinformation on . . .
Lawn & Garden
%
Appliances
%
Water supply &Environment
%
Local Nurseries 30 - -
Books and magazines 21 14 -
Newspapers 14 11 40
Appliance stores - 49 -
Government/utilities - - 24

SPU and Purveyor Water Conservation Survey – Final Report Table of Contents
Document2 05/26/00 viii
• They obtain lawn and garden care information from local nurseries (30%),books and magazines (21%), and the newspaper (14%).
• They get appliance information from home improvement, hardware, orappliance stores (49%), books and magazines (14%), and newspapers(11%).
• They go to newspaper articles and columns (40%) and governments orutilities (24%) for information about water supply and environmental issues.
Profiles of Key Customer Segments
Ø Chapter 6 profiles key customer segments that will be useful in planningconservation efforts (e.g., a profile of those who would be likely to spent $100 toreplace their toilets if the payback in bill savings is two years or less). Thevarious segments are characterized by the demographics, householdcharacteristics, attitudes, and behaviors that distinguish them. The reader isreferred to Chapter 6 for more details.
Conclusions and recommendations
Four conclusions emerge from findings in this study:
1. Customer characteristics, attitudes, and behaviors across the region aremore similar than different, and have become more similar over time.
While some demographic, attitudinal, and behavioral differences do exist betweenSeattle and Purveyor customers, these customer groups tend to be more similarthan different along most dimensions. In addition, the congruence of these twopopulations has increased over time. The consistency in the population bodes wellfor the success of conservation programs that are delivered on a regional basis.
However, it is also important to remember that a considerable amount of variationexists within the population and that all conservation efforts do not suit all populationsegments equally well. For instance, customers in multi-family dwellings canprobably do more to conserve indoors or in common outdoor areas, while singlefamily home dwellers have opportunities both inside and outside.
2. Environmentalism is the single most important motivator for saving water.
As suggested by the specific key findings listed above, protecting the environmentappears as the strongest component in customer motivations to save water. Theenvironmental umbrella is also useful for discussing issues that cut across resources– for instance, salmon recovery and restoration. Although customers rated all fourmotivations (protecting the environment, saving money, having enough water forsalmon, and delaying the development of more costly sources of supply) quitehighly, and all can be used to motivate customers, protecting the environment was atthe top of the list.

SPU and Purveyor Water Conservation Survey – Final Report Table of Contents
Document2 05/26/00 ix
Since the notion of “the environment” also tends to become abstract, it will beimportant to find ways to connect environmental protection with specific stepscustomers can take and the consequences – either positive or negative – of takingthose steps.
3. Changes in attitudes and behaviors have occurred and are linked to utilityefforts.
The good news is that there seems to be a direct relationship between utilityprogram emphasis and changes over time in awareness, attitudes, and behavior.However, this relationship cuts in both positive and negative directions. Clearly, allthe emphasis on less lawn watering and deflating the necessity and image of havinga green lawn has engendered water saving behaviors and attitudes.
On the other hand, we can see that the behaviors and attitudes that received lessattention have eroded over time (e.g., checking for toilet leaks). It even appears thatprograms can have mixed results for customer understanding. A good deal ofattention over the past few years has been paid to resource efficient washersthrough the WashWise program. No doubt this has increased customer awarenessof these washers. However, it may also have “mislead” customers into assumingthat the water used in washing clothes is usually greater than the water used influshing toilets.
4. Good opportunities for more conservation exist.
The data strongly reveal that more progress in water conservation can be made.Not only do customers support further conservation, many also agree there is moreto do and that they could realistically save more:
Ø 15% say they can save 10% or more water in their homes
Ø 29% say they can save somewhat more (5-10%).
Ø 32% say they can save a little more (1-5%)
Several important opportunities for knowledge, attitudinal, and behavioral changesstill exist among residential customers, all of which can be effectively placed in thecontext of environmental protection. Major opportunities include:
Ø Increasing awareness of taking shorter showers
Ø Encouraging even more showerhead replacements
Ø Increasing awareness of resource efficient washers
Ø Increasing awareness of water savings through toilet use and through promotingthe benefits of low-flow toilets. Awareness should be increased in these areas:
• toilets are the largest use of water indoors
• flushing less saves significant water

SPU and Purveyor Water Conservation Survey – Final Report Table of Contents
Document2 05/26/00 x
• installing low flow toilets is environmentally responsible, cost-effective, andcustomers are satisfied with these toilets
• checking for leaks is important
Ø Increasing awareness and use of natural lawn behaviors, including no watering
Ø Increasing lawn “downsizing”
Ø Increasing water saving and environmentally friendly lawn practices
Ø Further use of customer identified preferred methods of disseminatinginformation – nurseries, newspapers, utilities, hardware and appliance stores
SPU and Purveyor Water Conservation Survey – Final Report
Document2 05/26/00 1
CHAPTER ONE – BACKGROUND, METHODS, ANDDEMOGRAPHICS
Study Background and Purposes
Seattle Public Utilities (SPU) provides water to over 1.14 million people in theSeattle-King County area. A little under half (45%) of customers – mostly thoseliving within the Seattle city limits – receive their water directly from SPU. Theremaining 55% of customers receive water through twenty-seven wholesalepurveyors.
Over the years, SPU and its purveyors have systematically conducted quantitativeand qualitative market research to:
a) Assess consumer attitudes and behavior towards water conservation and to helpdesign public information campaigns
b) Track changes in attitudes and behaviors to gauge the effectiveness of publicinformation campaigns
c) Design and evaluate programs targeted to specific market segments
The goals of the current research are to:
Ø Identify, and evaluate changes in, perceptions, attitudes, and behaviors ofresidential customers toward water conservation
Ø Help guide effective programs to foster and achieve conservation amongresidential customers
Residential customers account for well over half of SPU’s and Purveyor’s total waterconsumption. Thus, with a new regional initiative to step up water conservationefforts in the coming years, understanding and serving this group of consumers isimportant for achieving conservation goals.
Study Methods
Approach
Seattle Public Utilities hired Dethman & Tangora LLC, a market research firm inSeattle, to conduct the research, and to oversee Market Data Research Corporation,a survey fielding firm in Tacoma, in collecting and processing the data. Telephoneinterviews with a randomly selected, representative sample of 603 residentialcustomers from Seattle and 620 residential customers from Purveyor service areaswere conducted during the first two weeks of October, 1999. Interviews lasted about15 minutes and were conducted using a computer assisted interviewing system.Data were analyzed using standard data reduction and statistical methods.

SPU and Purveyor Water Conservation Survey – Final Report
Document2 05/26/00 2
The sample was drawn to provide adequate numbers for a separate analysis ofSeattle and Purveyor customers, as well as to provide reliable overall populationproportions. The following margins of error and confidence intervals apply:
Ø Overall Population Sample = 1223. This sample has been weighted to reflectthe population proportions of Seattle (45%) and Purveyor (55%) populations.This sample size carries a + or – 2.9% margin of error with 95% confidence.
Ø Seattle Sample = 603, carries a + or – 4.1% margin of error with 95%confidence
Ø Purveyor Sample = 620, carries a + or – 4.1% margin of error with 95%confidence
Comparisons With Prior Survey Data
Given the changing household profile of the area and the desire to broaden theconservation ethic to all consumers, the current survey covered all residentialhouseholds, both single family and multi-family. Thus, overall population figuresrepresent all households in Seattle and Purveyor service areas.
This report also compares results, where similar questions were asked, to a SPU’s1994 Home Water Use Survey and 1991 Summer Water Conservation Study, bothof which polled single family households only. To draw an accurate picture ofchanges between the 1991, 1994 and 1999 data, only the statistics of single familyhouseholds are compared.
Table and Figure Notes
Throughout the main body of this report, three types of data may be presented foreach question:
1. A pie chart that shows the overall weighted population proportions for 1999.
2. A table that compares 1999 Seattle and Purveyor households for that question.These samples represent each geographic area and are not weighted. Ifsignificant differences exist between Seattle and Purveyor customers, it isindicated by Significance (Sig) = <.05, meaning that the differences only had a5% chance of occurring by chance. If no significant differences were present, thetable is labeled Not Significant (N.S.).
3. A table that compares 1994 and 1999 survey results (only for single familyhouseholds). In both cases, data have been weighted to reflect populationproportions.

SPU and Purveyor Water Conservation Survey – Final Report
Document2 05/26/00 3
Demographic and Household Characteristics
Summary
Demographic and household characteristics of the population, Seattle and Purveyorhouseholds, and 1994 and 1999 single family households are shown in Table 3.These findings show that:
Ø Most customers (75% overall) own their homes, but that significantly morecustomers own their homes in Purveyor areas (80%) than in Seattle (68%). Asimilar pattern follows for single family versus multi-family dwellings.
Ø Lot sizes are significantly larger in Purveyor areas, where 41% of single familyhomes are on ¼ acre or more, compared to 12% in Seattle.
Ø Average household size is about 2.5 people, with no significant differencebetween Seattle and Purveyor customers and no difference between 1994 and1999 single family homes.
Ø Most (58%) customers are 45 or older.
Ø Seattle has a slightly, but statistically significant, greater ethnic population (14%)than Purveyor areas (9%). Overall, population proportions by ethnicity are fairlyconsistent with U.S. Census Bureau statistics for King County.
Ø Purveyor households are more likely than Seattle households to have incomesabove $75,000, while Seattle households are more likely to have incomes of$25,000 or below.
Ø Little has changed in the demographics of single family households since 1994.

SPU and Purveyor Water Conservation Survey – Final Report
Document2 05/26/00 4
Table 3 - Summary Table of Demographics (Q51-57)
Home Ownership vs.Renting (Q53) Sig. = <.05
Seattle%
Purveyor%
Population%*
1994 SingleFamily %
1999 SingleFamily %
Own 68 80 75 90 89
Rent 31 19 24 9 11
Don’t Know/Refused 1 1 1 1 1
Type of Dwelling (Q51)Sig. = <.05
Seattle%
Purveyor%
Population%*
1994 SingleFamily %
1999 SingleFamily %
Single dwelling 74 82 78
Multi-dwelling 26 17 21
Don’t Know/Refused - 1 1
Not Applicable
Lot Size (Q52) Sig. = <.05 Seattle%
Purveyor%
Population%*
1994 SingleFamily %
1999 SingleFamily %
Small (less than 5,000 sq.ft.)
36 16 24 19 24
Average (5,000 to 10,000sq. ft.)
49 39 43 51 44
¼ acre to ½ acre 10 24 18 17 18
More than ½ acre 2 17 11 9 11
Don’t Know/Refused 3 4 4 4 3
Number in Household(Q54) N.S.
Seattle%
Purveyor%
Population%*
1994 SingleFamily %
1999 SingleFamily %
1 28 16 22 17 16
2 38 40 39 41 39
3 17 18 17 16 19
4 10 15 13 17 15
5 or more 6 11 8 9 9
Don’t Know/Refused - - - - 1
Average 2.3 2.7 2.52 2.69
Age (Q55) N.S. Seattle%
Purveyor%
Population%*
1994 SingleFamily %
1999 SingleFamily %
18-24 5 4 5 1 3
25-34 14 12 13 11 11
35-44 20 23 22 24 24
45-54 19 19 19 22 21
55-64 11 15 13 15 15
65 or older 28 24 26 25 25
Don’t Know/Refused 2 2 2 2 2

SPU and Purveyor Water Conservation Survey – Final Report
Document2 05/26/00 5
Ethnicity (Q56) Sig. =<.05
Seattle%
Purveyor%
Population%* **
1994 SingleFamily %
1999 SingleFamily %
Caucasian 82 84 83 84 84
Asian/Pacific Islander 7 3 5 7 5
African-American 3 2 2 1 2
Latino/Hispanic 2 2 2 1 2
Native American 1 1 1 - 1
Other 1 1 1 2 1
Don’t Know/Refused 4 6 5 5 5
Household Income (Q57)Sig. = <.05
Seattle%
Purveyor%
Population%*
1994 SingleFamily %
1999 SingleFamily %
Less than $15,000 8 3 5 7 4
$15,000 to $25,000 12 6 9 11 7
$25,000 to $50,000 23 21 22 28 21
$50,000 – $75,000 15 14 14 20 15
$75,000 - $100,000 8 11 9 11 10
Over $100,000 7 11 9 10 11
Don’t Know/Refused 27 34 31 13 32
Gender Sig. = < .05 Seattle%
Purveyor%
Population%*
1994 SingleFamily %
1999 SingleFamily %
Female 50 56 54
Male 50 44 46
Not Applicable
N = 603 620 1223 2505 1223
Notes:*Population percentages are weighted to reflect population proportions
**1998 U.S. Census estimates for King County by ethnic group show Caucasian = 78%; Asian = 11%;African American = 6%; Hispanic (of any race) = 4%; American Indian = 1%; and Other = <1%.

SPU and Purveyor Water Conservation Survey – Final Report
Document2 05/26/00 6
CHAPTER TWO – BASIC VIEWS ABOUT WATER ANDENVIRONMENTAL ISSUES
Q1: How concerned are you that your community may face major watersupply problems over the next five years?
Respondents were first asked how concerned they were about their communitiesfacing major water supply problems over the next five years. As shown in Figure 2,over half (62%) of all respondents are either very (24%) or somewhat (38%)concerned. However, 36% say they are not too (23%) or not at all concerned (13%).The level of concern is the same among Seattle and Purveyor customers. However,those saying they are very or somewhat concerned dropped substantially amongsingle family homeowners since1994 – from 84% to 63% (see Table 4).
Figure 2 - Level of Concern About Water Supply Problems (Q1)
Regional Comparison N.S. Seattle%
Purveyor%
Very concerned 22 25
Somewhat concerned 42 36
Not too concerned 21 25
Not at all concerned 13 12
DK 2 2
N= 603 620
How concerned are you that your commmunity will face major water supply problems in the next 5
years? (N=1223)
Very concerned
24%
Somewhat concerned
38%
Not too concerned
23%
Not at all concerned
13%
DK2%

SPU and Purveyor Water Conservation Survey – Final Report
Document2 05/26/00 7
Table 4 - Level of Concern About Water Supply Problems (Q1)
Over Time Comparison: Concern AboutSupply*
1994%
1999%
Very concerned 42 25
Somewhat concerned 42 38
Not too concerned 13 23
Not at all concerned 3 13
DK 2
Reminder: Single Family Households Only N = 2505 959
Q2: Why do you give that rating?
Customers who were concerned about future water supplies (62% of the population)most often said it was due to “population growth,” and other development concerns(16%), as shown in Table 5. Other reasons for concern included finite watersupplies and shortages (13%), the need for good water (13%), and water quality andhealth concerns (10%). Respondents who were not concerned (36% of thepopulation) most often said they believe there’s enough water (38%) or they don’tbelieve a problem exists (33%). Seattle and Purveyor customers gave similarreasons, and customer reasons have not changed much between 1994 and 1999.
Table 5 - Reasons for Concern or Lack of Concern About Water Supply (Q2)
Reason Concerned or Not Concerned%
Population growth/over-development 16
Finite water supply/shortages 13
Good water is important/necessary 13
Health/general water quality 10
People don’t care/conserve enough 6
Water management problems 6
Environmental/global issues 3
Increased media coverage 3
Rising water rates 3
There’s enough water 38
Don’t believe there is a problem 33
Never thought of, not informed 9
Trust the utilities/water system 2
Don’t know 3
N= 1198

SPU and Purveyor Water Conservation Survey – Final Report
Document2 05/26/00 8
Q3: Do you believe the actions of individual households like yours can greatlyaffect whether we have enough water to meet the future demands of ourregion, somewhat affect whether we have enough water, or have little effect onwhether we have enough water?
Respondents were asked how much individual households could affect whether wehave enough water. Figure 3 shows that almost all customers (87%) thinkindividuals can either greatly (42%) or somewhat (45%) affect how much water wehave. Only 10% said their actions could have little effect. No differences surfacedbetween Seattle and Purveyor customers.
However, customer viewpoints seem dramatically different since 1994, as shown inTable 6. Although the questions differ somewhat, only 28% in 1994 feltconservation could make supplies “last a lot longer” compared to 42% in 1999saying their actions can “greatly affect water supplies.”
Figure 3 - How Much Individual Actions Can Affect Having Enough Water (Q3)
How much do you believe individual actions can affect whether we have enough water? (N=1223)
Greatly affect42%
Somewhat affect45%
Affect very little10%
DK3%

SPU and Purveyor Water Conservation Survey – Final Report
Document2 05/26/00 9
Regional Comparison N.S. Seattle%
Purveyor%
Greatly affect 45 40
Somewhat affect 42 47
Affect very Little 10 10
DK 2 3
N = 603 620
Table 6 - How Conserving Can Affect The Water Supply (Q3)
Over Time Comparison
1994 Survey%
(Extend watersupply)
1999 Survey %
(Affect watersupply)
Greatly affect/Make supplies last a lot longer 28 42
Somewhat affect/Last somewhat longer 64 46
Affect very little/Not help 8 10
DK - 2
N= 2465 959
Q4: How important is it for your household to actively conserve water?
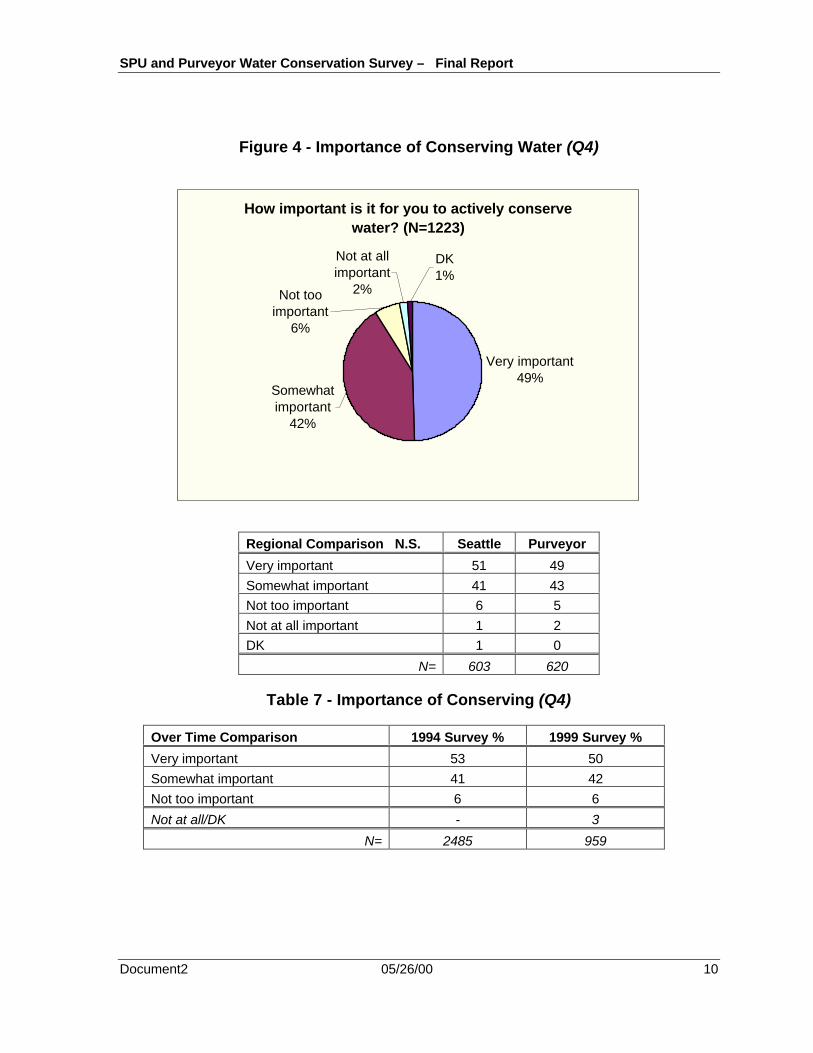
As shown in Figure 4 below, nearly half (49%) of all respondents thought it was veryimportant to conserve water and another 42% thought it was somewhat important,indicating the high value customers place on conservation. Only 8% thoughtconservation was not too (6%) or not at all (2%) important. Seattle and Purveyorcustomers did not differ. And, as shown in Table 7, attitudes about the importanceof conserving have not changed since 1994: about half still think it’s very important,with less than 7% saying it’s not important, and the rest saying it’s somewhatimportant.
SPU and Purveyor Water Conservation Survey – Final Report
Document2 05/26/00 10
Figure 4 - Importance of Conserving Water (Q4)
Regional Comparison N.S. Seattle Purveyor
Very important 51 49
Somewhat important 41 43
Not too important 6 5
Not at all important 1 2
DK 1 0
N= 603 620
Table 7 - Importance of Conserving (Q4)
Over Time Comparison 1994 Survey % 1999 Survey %
Very important 53 50
Somewhat important 41 42
Not too important 6 6
Not at all/DK - 3
N= 2485 959
How important is it for you to actively conserve water? (N=1223)
Very important49%
Not too important
6%
Not at all important
2%
DK1%
Somewhat important
42%

SPU and Purveyor Water Conservation Survey – Final Report
Document2 05/26/00 11
Q5: How much more could you realistically do to save water in your home?
When asked how much more they could realistically do to save water in their home,both outdoors and indoors (see Figure 5), 15% said a great deal more (10% or more),and another 29% said somewhat more (5 to 10% more). About a third (32%) thoughtthey could do a little more (1 to 5% more) and one in five (21%) said they could notsave any more than they do now. Seattle customers are slightly more likely to feelthey could save more than Purveyor customers.
Figure 5 - Doing More to Save Water in the Home (Q5)
Regional Comparison Sig. = <.05 Seattle%
Purveyor%
A great deal more 15 14
Somewhat more 30 28
A little more 30 34
Not any more 21 22
DK 4 1
N= 603 620
How much more could you realistically do to save water in your home? (N = 1223)
A great deal more15%
Somewhat more29%
A little more32%
Not any more21%
DK3%

SPU and Purveyor Water Conservation Survey – Final Report
Document2 05/26/00 12
Q6: If you knew that the same rivers that salmon depend on for survival alsosupply your water, and that if all households saved water we would haveenough water for salmon and people, how likely would you be to take steps tosave water at home?
Q7. If you knew you could save 5-10% on your water and sewer bills by cost-effectively saving water, how likely would you be to take steps to save water athome?
Q8. Our region may be able to delay the development of new and more costlywater supplies if every household reduced the amount of water it uses by 1%each year for 10 years. Knowing this, how likely would you be to take steps tosave water at home?
Q9. If you knew that it would help protect the environment for now and futuregenerations, how likely would you be to take steps to save water at home?
Respondents were asked the four questions above to gauge what would be mostlikely to motivate them to take steps to save water at home. As shown in Figure 6,all four reasons resonated very strongly with over half of respondents. Still,protecting the environment was the most compelling motivation (66% very likely totake steps to save water at home).
Between Seattle and Purveyor customers, the only significant difference inmotivations was saving water to protect salmon runs, with Seattle customers findingthis reason a little more motivating than Purveyor customers.

SPU and Purveyor Water Conservation Survey – Final Report
Document2 05/26/00 13
Figure 6 - Reasons to Take Steps to Save Water (Q6-9)
Regional Comparison – For SalmonSig. = <.05
Seattle%
Purveyor%
Very likely 58 52
Somewhat likely 31 32
Not too likely 4 7
Not at all likely 4 5
DK 3 3
Regional Comparison – Save Money N.S.
Seattle Purveyor
Very likely 51 53
Somewhat likely 32 32
Not too likely 7 7
Not at all likely 3 4
DK 6 3
How l ikely would you be to take steps to save water i f you could… (N = 1223)
26%30%
31%32%
2 % 3 % 3 % 4 %4 %5 %3 %3 %
7 %6 %4 %3 %
66%
60%55%
52%
0 %
10%
20%
30%
40%
50%
60%
70%
80%
90%
100%
Protectenvironment
Delaydevelopment
Have enoughfor salmon
Save money onbill
Very likely
Somewhat l ikely
Not too likely
Not at all likely
D K

SPU and Purveyor Water Conservation Survey – Final Report
Document2 05/26/00 14
Regional Comparison – DelayDevelopment N.S.
Seattle Purveyor
Very likely 62 59
Somewhat likely 28 32
Not too likely 4 4
Not at all likely 3 4
DK 3 2
Regional Comparison – ProtectEnvironment. N.S.
Seattle Purveyor
Very likely 68 65
Somewhat likely 23 28
Not too likely 3 3
Not at all likely 2 3
DK 3 1
N= 603 620
Q10. Which is the single most important reason you would take steps to savewater? 1) Saving water for salmon. 2) Saving water to save money on yourbill. 3) Saving water to delay new, more costly water supplies. OR 4) Savingwater to help protect the environment?
Respondents were then asked to select the single most important reason for takingsteps to save water at home. As shown in Figure 7, a strong majority ofrespondents (61%) selected protecting the environment as the most importantreason to save water. Substantially fewer respondents selected the other threereasons. Saving money did become more prominent, moving from last place in theoverall ratings to second place (15%), while delaying the cost of new developmentdropped from second into last place (10%), just behind saving salmon (11%). Nosignificant differences exist between Seattle and Purveyor customers.

SPU and Purveyor Water Conservation Survey – Final Report
Document2 05/26/00 15
Figure 7 - Single Most Important Reason to Save Water (Q10)
Comparison-single most N.S. Seattle%
Purveyor%
Enough for Salmon 12 10
Save Money 13 16
Delay development 10 9
Protect Environment 62 61
None 1 1
DK 2 2
N= 603 620
Which one is the single most important reason for taking steps to save water? (N=1223)
Protect environment
61%
None are important
1%
Have enough for
salmon11%
Save money on bills
15%
Delay development
10%
DK2%

SPU and Purveyor Water Conservation Survey – Final Report
Document2 05/26/00 16
CHAPTER THREE – INDOOR WATER USE
Largest Uses
Q11. Inside their homes, people mostly use water to wash their clothes, takebaths and showers, and flush toilets. Of these three ways to use water, whichtwo do you think are the largest uses in your home?
Respondents were asked to choose which of three uses – washing clothes, takingbaths and showers, or flushing toilets – were the two largest uses of water in theirhomes. As shown in Figure 8, customers are most likely to believe “taking baths orshowers” (75%) and “washing clothes” (63%) are the two largest uses of waterindoors.
Based upon SPU’s metering in single family homes, toilets use the greatest amountof water, while showers and baths (combined) and clothes washing use a nearlyequal amount. (Note: Since multi-family homes often don’t have clothes washers,and this study included multi-family homes, clothes washing would likely be a moreclear “third place” if all household types were metered.) Thus, there is significantopportunity to improve customer knowledge about what indoor uses are the largest.Seattle customers were significantly more likely than Purveyor customers to select“flushing toilets” as one of the top two uses, but still selected baths and showers andclothes washing more often.
Table 8 shows that while the proportions choosing “baths and showers” and“flushing toilets” remained about the same between 1994 and 1999, those choosing“washing” clothes appeared to go up sharply. Although the two questions werephrased somewhat differently, another reason for the rise could be a recent regionalemphasis on promoting resource efficient washers and little emphasis upon toiletsas a high consumer of water.

SPU and Purveyor Water Conservation Survey – Final Report
Document2 05/26/00 17
Figure 8 - Two Largest Uses of Water Indoors (Q11)
Regional Comparison-largestuse Sig. = <.05
Seattle%
Purveyor%
Take baths/showers 75 75
Wash clothes 59 66
Flush toilets 52 45
DK 4 7
N= 603 620
Table 8 - Two Largest Uses of Water Indoors (Q11)
Comparison1994
Survey%
1999Survey
%
Taking baths and showers 76 73
Washing clothes 49 66
Flushing toilets 48 46
Other 3 NA
Don’t know 3 6
N= 2452 959
W h ich two are the largest uses of water indoors? (N = 1223)
48%
6%
63%
75%
0%
20%
40%
60%
80%
100%
Take baths/showers
W ash clothes Flush toilets DK

SPU and Purveyor Water Conservation Survey – Final Report
Document2 05/26/00 18
Showerheads and ShowersQ12: In 1992, your household should have received a low-flow showerheadfrom your water utility. Was this showerhead installed in your home?
Q13: Is it still there, did you put your old showerhead back in, or did youreplace it with a new showerhead at a later date?
Q14: Have you installed a new showerhead in your home since 1993?
When asked if they had installed the low-flow showerhead they received from theirutility in 1992, just over half (51%) of all respondents said yes, while 25% said noand 24% didn’t know. Using the data in Figure 9, we can conclude:
Ø 67% of households are using low-flow showerheads: 41% are still using theoriginal low-flow showerhead provided by their utility (41%), and 26% haveinstalled a new low-flow showerhead since 1992 (when regulations went intoeffect requiring them).
Ø 33% of households don’t have (27%) or don’t know if they have (6%) low-flowshowerheads.
Figure 9 - Use of Low-flow Showerheads in Home (Q12-14)
Was the low-flow showerhead you received in 1992 installed in your home? (N = 1223)
Yes51%
No25%
DK24%
Bought a new one since 1993? (N=600)
Yes39%
No55%
DK6%
Is it still there? (N=623) Put old
back in2%
Still there81%
Put in new14%
DK3%

SPU and Purveyor Water Conservation Survey – Final Report
Document2 05/26/00 19
Some differences do exist between Seattle and Purveyor customers. Of most noteis that more Purveyor than Seattle customers have bought and installed newshowerheads on their own since 1993 – 44% compared to 34%. The 67% overallfigure of all households having low-flow showerheads is consistent with the 70%figure of single family households in 1994 that reported they installed the utility-provided low-flow showerheads.
Regional Comparison-ShowerheadInstalled? Sig. = <.05
Seattle%
Purveyor%
Yes 50 52
No 22 27
DK 28 21
N= 603 620
Regional Comparison- Still There?N.S.
Seattle%
Purveyor%
Yes, still there 82 81
Put in new one 15 13
Put old one back in 1 2
DK 3 4
N= 301 321
Regional Comparison- InstalledNew One Since 1993? Sig. = <.05
Seattle%
Purveyor%
Yes 34 44
No 58 51
DK 8 5
N= 302 299
Q15: Do most showers in your household last 5 minutes or less, or do theylast more than five minutes?
All respondents were asked how long most showers in their household lasted --either 5 minutes or less or more than 5 minutes. As shown in Figure 10 below, justover half of respondents (52%) said their showers lasted 5 minutes or less, while44% said they lasted more than 5 minutes, and 4% said they don’t know. Althoughthe differences between Seattle and Purveyor customers are small, the statisticsshow that Seattle customers are significantly more likely to take shorter showers.

SPU and Purveyor Water Conservation Survey – Final Report
Document2 05/26/00 20
Figure 10 - Length of Most Showers (Q15)
Regional Comparison- Length ofmost showers Sig. = <..05
Seattle%
Purveyor%
5 min or less 54 51
More than 5 min. 40 47
DK 6 3
N= 603 620
Toilets
Q16. Do you usually flush the toilet with every use, or do you often allow twoor more uses before flushing?
Q17. How many toilets do you have in your home?
Q18. In the past year, have you checked any of your toilets for leaks?
Respondents were asked a series of questions about their household toilets. Whenasked if they either usually flush the toilet with every use or allow multiple usesbefore flushing, the majority of respondents (60%) said they flush with every use(see Figure 11). Still, 39% do allow two or more uses before flushing. Seattlecustomers are much more likely than Purveyor customers to allow two or more usesbefore they flush (46% vs. 32%)
How long do most showers in your household last?
5 minutes or less52%
More than 5 minutes
44%
DK4%

SPU and Purveyor Water Conservation Survey – Final Report
Document2 05/26/00 21
Figure 11 - How Often Toilet Is Flushed (Q16)
Regional Comparison- How OftenFlush? Sig. = <.05
Seattle%
Purveyor%
Every use 52 67
2 or more uses 46 32
DK 2 1
N= 603 620
As shown in Figure 12, just over one third (35%) of all respondents have only onetoilet in their home. Another 37% have 2 toilets, 25% have 3 toilets, and 3% have 4or more toilets. Significant differences appear between Seattle and Purveyorsamples. Many more Seattle homes than Purveyor homes have only one toilet(46% vs. 26%). And, many more Purveyor than Seattle homes have three toilets(33% vs. 16%). 37% of respondents in both groups have two toilets.
How often do you usually flush the toilet? (N=1223)
Flush with every use
60%
Allow two or more uses
39%
DK1%

SPU and Purveyor Water Conservation Survey – Final Report
Document2 05/26/00 22
Figure 12 - Number of Toilets in the Home (Q17)
Regional Comparison- How Many Toilets Sig.= <.05
Seattle%
Purveyor%
1 toilet 46 26
2 toilets 37 37
3 toilets 16 33
4 toilets 2 4
N= 603 620
A majority of respondents (64%) report they have checked their toilets for leaks inthe past year, as shown in Figure 13, but about one third (34%) said they had notand 2% didn’t know. Significantly more Purveyor than Seattle customers report theyhave checked their toilets for leaks (71% to 57%). The proportion of householdschecking for leaks in the last year has declined from 79% in 1994 to 68% in 1999.
How many toilets do you have in your home? (N = 1223)
135%
237%
325%
4 or more3%

SPU and Purveyor Water Conservation Survey – Final Report
Document2 05/26/00 23
Figure 13 - Toilets Checked For Leaks (Q18)
Regional Comparison- ToiletsChecked for Leaks Sig. = <.05
Seattle%
Purveyor%
Yes 57 71
No 40 28
DK 2 1
N= 603 620
Table 9 - Checked toilet for leaks? (Q18)
Over Time Comparison –Toilets Checked for Leaks?
1994Survey
%
1999Survey
%
Yes 79 68
No 21 30
Don’t know - 1
N= 2505 959
In the past year, have you checked any of your toilets for leaks? (N = 1223)
Yes64%
No34%
DK2%

SPU and Purveyor Water Conservation Survey – Final Report
Document2 05/26/00 24
Q19. How many toilets have you replaced or installed new in the past 7 years– that is, since 1993?
Q20. How satisfied are you with the new toilet?
Q21. Within the next two years, how likely will you be to replace any toilet inyour home that is in good working order?.
Q22. Will you replace this toilet because you plan to remodel, because you’dlike to save water, because you’d like to save money on your water and sewerbill, or for some other reason?
Respondents were asked how many toilets they had replaced or installed new in thepast 7 years (since 1993, when the regulations were changed). As shown inFigure 14, 29% said they had replaced between 1 and 4 of their toilets in the pastseven years, whereas 69% had not replaced any, and 2% didn’t know.
Figure 14 - Number of Toilets Replaced Since 1993 (Q19)
How many toilets have you replaced since 1993? (N = 1203)
None69%
120%
4 or more1% DK
2%2
6%
32%

SPU and Purveyor Water Conservation Survey – Final Report
Document2 05/26/00 25
Regional Comparison – ToiletsReplaced Since 1993 N.S.
Seattle%
Purveyor%
None 68 70
1 21 19
2 7 6
3 2 2
4 1 1
N= 588 614
Those respondents who had replaced any toilets since 1993 (N=374) were thenasked how satisfied they were with the new toilet. As shown in Figure 15, mostcustomers (81%) were either very (58%) or somewhat (23%) satisfied with the newtoilet. The remaining 19% were either not very (9%) or not at all (10%) satisfied.
Figure 15 - How Satisfied With New Toilet (Q20)
Regional Comparison—HowSatisfied with New Toilet N.S.
Seattle%
Purveyor%
Very 57 57
Somewhat 26 20
Not very 5 12
Not at all 11 10
DK 0 1
N= 189 186
How satisfied are you with the new toilet? (N =374)
Not very satisfied
9%
Not at all satisfied
10%
Very satisfied58%Somewhat
satisfied23%

SPU and Purveyor Water Conservation Survey – Final Report
Document2 05/26/00 26
Respondents were asked how likely they would be to replace any toilet in their homewithin the next two years that was in good working order. As shown in Figure 16,most respondents (81%) said they were not likely to replace a working toilet.However, 8% said they were very likely and 8% said they were somewhat likely toreplace a toilet in good working order within two years. (Note: these would be“voluntary” replacements, not replacements of malfunctioning toilets.)
Figure 16 - Likelihood of Replacing Good Working Order Toilet (Q21)
Regional Comparison- How Likely toReplace Toilet In Next 2 Years N.S.
Seattle%
Purveyor%
Very 7 8
Somewhat 8 7
Not too 80 82
DK 5 2
N= 189 186
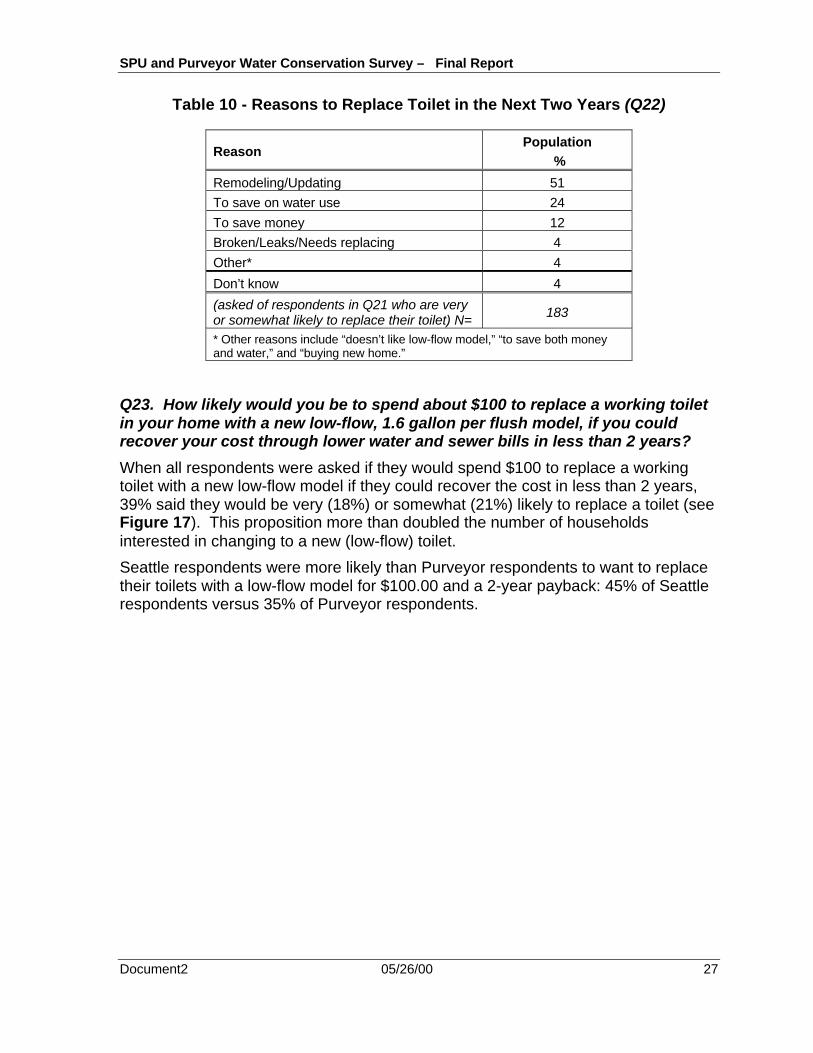
Respondents who were likely to replace a toilet in the next two years (16% of thepopulation) were then asked if they planned to change their toilet because theywanted to remodel, wanted to save water, wanted to save money on their bill, or forsome other reason? As shown in Table 10, just over half (51%) of this group saidthey planned to remodel. Nearly a quarter (24%) said it was to save on water use,and 12% said it was to save money on their water bill.
Within the next 2 years, how likely will you be to replace any toilet that is in good working order?
(N=1203)
Very likely8%
Somewhat likely8%
Not too likely81%
DK3%
SPU and Purveyor Water Conservation Survey – Final Report
Document2 05/26/00 27
Table 10 - Reasons to Replace Toilet in the Next Two Years (Q22)
ReasonPopulation
%
Remodeling/Updating 51
To save on water use 24
To save money 12
Broken/Leaks/Needs replacing 4
Other* 4
Don’t know 4
(asked of respondents in Q21 who are veryor somewhat likely to replace their toilet) N= 183
* Other reasons include “doesn’t like low-flow model,” “to save both moneyand water,” and “buying new home.”
Q23. How likely would you be to spend about $100 to replace a working toiletin your home with a new low-flow, 1.6 gallon per flush model, if you couldrecover your cost through lower water and sewer bills in less than 2 years?
When all respondents were asked if they would spend $100 to replace a workingtoilet with a new low-flow model if they could recover the cost in less than 2 years,39% said they would be very (18%) or somewhat (21%) likely to replace a toilet (seeFigure 17). This proposition more than doubled the number of householdsinterested in changing to a new (low-flow) toilet.
Seattle respondents were more likely than Purveyor respondents to want to replacetheir toilets with a low-flow model for $100.00 and a 2-year payback: 45% of Seattlerespondents versus 35% of Purveyor respondents.

SPU and Purveyor Water Conservation Survey – Final Report
Document2 05/26/00 28
Figure 17 - How Likely to Replace Toilet With Low-Flow Model (Q23)
Comparison – How Likely to ReplaceToilet With Low-Flow Model Sig. = <.05
Seattle%
Purveyor%
Very 22 15
Somewhat 23 20
Not too* 49 60
DK 6 4
* “not too” and “not at all” combined 603 620
Washing Machines
Q24: Have you ever heard of tumble action or horizontal-axis washingmachines that are designed to save water and energy?
The final question to respondents on indoor water used revealed that a little over half(53%) of all respondents said they had heard of resource efficient horizontal-axiswashing machines that are usually loaded from the front instead of from the top. Asshown in Figure 18 below, 45% said they had not heard of these water- and energy-
Would you spend $100 to replace your toilet with a low-flow model if payback is 2 years? (N = 1223)
Very likely18%
Somewhat likely21%
Not too likely18%
Not at all likely38%
DK5%

SPU and Purveyor Water Conservation Survey – Final Report
Document2 05/26/00 29
saving washing machines and 2% didn’t know. No differences surfaced betweenSeattle and Purveyor customers.
Figure 18 - Knowledge of Water- and Energy-Saving Washing Machines (Q24)
Comparison – Heard ofHorizontal Axis Washer? N.S.
Seattle%
Purveyor%
Yes 55 52
No 43 47
DK 2 1
* “not too” and “not at all” combined 603 620
Have you heard of the washing machines designed to save water and energy? (N = 1223)
Yes53%
No45%
DK2%

SPU and Purveyor Water Conservation Survey – Final Report
Document2 05/26/00 30
CHAPTER FOUR – OUTDOOR WATER USE
Incidence of Yards and Lawns
Q25: Do you have a yard?
To help filter respondents through the outdoor water section of the interview,respondents were first asked if they had a yard. As shown in Figure 19 below, overtwo-thirds (77%) do have yards, while 23% do not. Data comparisons show thatsignificantly more Purveyor respondents have yards than Seattle respondents (80%vs. 74%).
Figure 19 - Respondents Who Have A Yard (Q25)
Regional Comparison – Have yard?Sig. = <.05
Seattle%
Purveyor%
Yes 74 80
No 26 20
N= 603 620
Do you have a yard? (N = 1223)
Yes77%
No23%

SPU and Purveyor Water Conservation Survey – Final Report
Document2 05/26/00 31
Q26: Of the yard around your home that’s planted with lawn and garden, howmuch of it is lawn?
To further filter respondents through this outdoor section, respondents with yards(77% of the total population) were then asked if any part of their yard was plantedwith lawn. As shown in Figure 20, 9% report their yards have no lawn. Theremaining yards are fairly evenly divided between those where up to ¼ of their yardarea is lawn (20%), ¼ to ½ of their yard area is lawn (24%), ½ to ¾ of the yard areais lawn (26%), and over ¾ of the yard area is lawn (20%). No significant differencesemerged between Seattle and Purveyor customers. However, given that Purveyoryards tend to be larger than Seattle yards, the amount of lawn per customer is likelylarger in Purveyor areas.
Figure 20 - Amount of Lawn Area in Yard (Q26)
How much of your yard is lawn area? (N = 945)
Up to 1/4 is lawn20%
Between 1/4 and 1/2
24%
Between 1/2 and 3/4
26%
Over 3/4 is lawn20%
DK1% No lawn
9%

SPU and Purveyor Water Conservation Survey – Final Report
Document2 05/26/00 32
Regional Comparison – Amount of lawnN.S.
Seattle%
Purveyor%
None 8 10
Up to ¼ 21 19
¼ to ½ 26 23
½ to ¾ 28 24
Over ¾ 16 23
N= 445 497
Although the proportion of yards with no lawns has remained stable, it appears lawncoverage has risen since 1994. In 1994, 32% of respondents reported they hadlawn planted on ½ or more of their yards; in 1999, 47% report that ½ or more of theiryards are planted in lawn.
Table 11 - Amount of Lawn in the Yard (Q26)
Over Time Comparison –Amount of Lawn
1994 Survey%
1999 Survey%
No lawn 8 9
Up to ¼ of yard area 27 19
¼ to ½ 32 25
½ to ¾ 24 27
Over ¾ of yard area 8 20
Don’t know - 1
N= 2421 900
Lawn Care Preferences and PracticesQ27: How important is it for you to have a green lawn as part of yourlandscaping?
Q28: How willing would you be to have a natural lawn if a natural lawn is alighter green color, has a few weeds, and is mowed a little higher than you’reused to?
The 860 respondents (70% of the total population) who had at least part of their yardas lawn were asked how important it was to have a green lawn. As shown inFigure 21 below, nearly half (46%) said it was either very (16%) or somewhat (30%)important, while the other half (52%) said it was either not too (28%) or not at all(26%) important to have a green lawn.

SPU and Purveyor Water Conservation Survey – Final Report
Document2 05/26/00 33
Purveyor customers place a higher value on having a green lawn, with 52% saying itwas important, compared to 37% of the Seattle population. Notably, the importanceof a green lawn has decreased appreciably since 1994, from 61% saying it wasimportant in 1994 to 45% in1999. (See Table 12)
Figure 21 - Importance of Having a Green Lawn (Q27)
Regional Comparison – Importance of a GreenLawn Sig. = <.05
Seattle%
Purveyor%
Very important 11 19
Somewhat important 26 33
Not too important 30 26
Not at all important 32 22
N= 410 448
Table 12 - Importance of Green Lawn (Q27)
Over Time Comparison—Importance of a Green Lawn
1994 Survey%
1999 Survey%
Very important 22 16
Somewhat important 39 29
Not too important 27 28
Not at all important 12 26
Don’t know -
Single Family Homes N= 2255 821
How important is it for you to have a green lawn? (N = 860)
Very important
16%
Not too important
28%
Not at all important
26%
Somewhat important
30%

SPU and Purveyor Water Conservation Survey – Final Report
Document2 05/26/00 34
Respondents with lawns were then asked how willing they would be to have a“natural lawn” (lighter green color, with few weeds and if mowed a little higher thanusual). Nearly three-fourths (72%) said they would be either very (43%) orsomewhat (29%) amenable to having a natural lawn, as shown in Figure 22 below.Twenty-four percent (24%) said they would be either not too (13%) or not at all likely(11%) to have a natural lawn, and 4% didn’t know.
Seattle customers are significantly more likely to be willing to have a natural lawnthan Purveyor respondents, with 77% of the Seattle customers saying they would bevery or somewhat likely compared to 69% of Purveyor customers.
Figure 22 - Likelihood of Having a Natural Lawn (Q28)
Regional Comparison- Willingness toHave a Natural Lawn Sig. = < .05
Seattle%
Purveyor%
Very likely 48 40
Somewhat likely 29 29
Not too likely 8 16
Not at all likely 10 13
N= 410 448
How likely would you be to have a "natural lawn?" (N=860)
Very likely43%
Somewhat likely29%
Not too likely13%
Not at all likely11%
DK4%

SPU and Purveyor Water Conservation Survey – Final Report
Document2 05/26/00 35
Lawn Watering
Q29: About how often do you water your lawn during a typical summer?
When asked how often they watered their lawn during a typical summer, nearly athird (30%) of customers with lawns said they never water it. About a quarter (24%)water twice a month or less, or once a week;14% water every 3 days; 5% waterevery other day; and 2% water every day (Figure 23). No significant differencesexist between Seattle and Purveyor customers.
As shown in Table 13, the trend toward never watering and watering less is on therise. From 1991 to 1999, the percentage of single family households who neverwater has gone from 15% to 30% and the frequency of watering has dropped aswell. For example, in 1991 the percent of customers watering their lawn twice amonth or less was 14% compared to 35% in the 1999 survey.
Figure 23 - How Often Lawn Is Watered During a Typical Summer (Q29)
Regional Comparison—HowOften Water? N.S.
Seattle%
Purveyor%
Never 36 27
Twice a month 23 24
Once a week 21 25
Every third day 14 15
Every other day 3 6
Every day 2 2
N= 410 448
How often do you water your lawn in a typical summer? (N=860)
Never water30%
Twice a month or less24%
Once a week24%
Every third day14%
DK1%
Every day2%Every other
day5%

SPU and Purveyor Water Conservation Survey – Final Report
Document2 05/26/00 36
Table 13 - How Often Lawn is Watered (Q29)
Over Time Comparison – HowOften Water Lawn?
1991Survey
%
1994Survey
%
1999Survey
%
Never water 15 23 30
Twice a month or less 14 17 35
Once a week 26 35 35
Every three days 45 37 21
Every other day 14 9 7
Every day 2 2 2
(Single family households whohave a lawn) N =
Notavailalble
2232 821
Use and Maintenance of Automatic Sprinkling Systems
Q30: Do you use an automatic sprinkling system to water your lawn?
Q31: During the watering season, do you adjust the automatic system so thatit waters less when it’s cooler and more when it’s hotter?
Q32: Do you inspect your automatic system for leaks at least once a year?
Lawn waterers were then asked if they used an automatic sprinkler system. While79% of households do not use automatic sprinklers, 21% do, as shown in Figure 24.In addition, over half (59%) report they adjust the system for temperature changes,and 74% say they have the system inspected for leaks at least once a year (see callout boxes in Figure 24). No significant differences exist between Seattle andPurveyor customers, and no change occurred between the 1994 and 1999 surveys.

SPU and Purveyor Water Conservation Survey – Final Report
Document2 05/26/00 37
Figure 24 - Use Of Automatic Sprinkler System (Q30 - Q32)
Comparison-automatic systems YES NO
All N.S. Seattle%
Purveyor %
Seattle%
Purveyor%
Use a system? (N = 594) 19 23 81 77
Adjusted for temperature? (N = 125) 47 66 47 30
Inspected? (N = 125) 63 80 29 12
Table 14 - Use of Automatic Watering Systems
Over Time Comparison1994
Survey%
1999Survey
%
Use automatic watering system 18 21
N= 1594 594
Do you use an automatic sprinkler system to water your
lawn?
Yes21%
No79%
Is it adjusted or reprogramed?
Yes59%
No36%
DK5%
Is it inspected for leaks once a year?
Yes74%
No18%
DK8%

SPU and Purveyor Water Conservation Survey – Final Report
Document2 05/26/00 38
Lawn Care
Do you . . .
Q33. Usually mow your lawn with a mulching mower?Q34. Usually leave your grass clippings on your lawn?Q35. Usually use an organic or slow release fertilizer on your lawn?Q36. Usually use a “weed ‘n’ feed” type product on your lawn?Q37. Usually use pesticides to control crane flies?Q38. Usually aerate and over-seed your lawn?
All respondents with lawns (70% of the population) were asked a series of questionsabout the methods they use to care for their lawns (see Figure 25 below). Just overhalf (52%) report they leave grass clippings on their lawns, 43% use a mulchingmower, 41% use organic or slow release fertilizer, and 29% aerate and over-seedtheir lawns – all water saving, environmentally friendly practices. However, 34% saythey use a weed-n-feed type product and 13% said they use pesticides to controlcrane flies – both less environmentally sound.
Some significant differences do surface between Seattle and Purveyor customers.While they are equally likely to use a mulching mower and organic fertilizer, Seattlecustomers more likely leave grass clippings on the lawn, while Purveyor customersmore likely aerate and over-seed their lawns. Purveyor customers are also morelikely to use weed ‘n’ feed type products and pesticides to control crane flies.

SPU and Purveyor Water Conservation Survey – Final Report
Document2 05/26/00 39
Figure 25 - Lawn Care Practices (Q33-38)
Regional Comparison- Lawn CarePractices
YES NO
Seattle%
Purveyor%
Seattle%
Purveyor%
Leave grass clippings Sig. = < .05 55 50 41 49
Use mulching mower N.S. 41 45 50 50
Use organic fertilizer N.S. 37 43 48 42
Use weed n feed Sig. = < .05 26 40 65 52
Aerate and over seed Sig. = <.05 21 34 73 61
Use pesticides 8 18 87 77
N= 410 448 410 448
In caring for your lawn, do you usually…(N=860)
7%15%
8%
45%50%
44% 58% 66%
81%
52%43% 41%
34% 29%
13%
3% 5% 5%0%
10%
20%
30%
40%
50%
60%
70%
80%
90%
100%
Leave grassclippings
Usemulchingmower
Use organicfertilizer
Use weed-n-feed
Aerate andover seed
Usepesticides
Yes
No
DK

SPU and Purveyor Water Conservation Survey – Final Report
Document2 05/26/00 40
Lawn Removal and ReplacementQ39: In the past five years, since 1994, have you removed any of your lawn?
Q40: Did you replace your lawn with garden areas with plants and shrubs,including rockeries, or something else like a patio, deck, or garage?
Respondents were asked if they had removed any of their lawn in the past fiveyears. Nearly 3 in 10 (29%) said they had, as shown in Figure 26. When askedwhat they are replaced the lawn with, 70% said they had replaced it with gardenareas, and the remaining 30% replaced it with something else. Table 15 suggeststhere may be a slight decrease in single family households removing lawn between1994 and 1999.
Figure 26 - Replacement of Lawn in the Yard (Q39-40)
Regional Comparison---Removed Lawn? N.S.
Seattle%
Purveyor%
Yes 32 27
No 66 71
N= 410 448
If Yes: Replaced with garden? 77 64
Replaced with something else? 23 36
N= (yes above) 132 120
In the past 6 years have your removed any of your lawn?
(N=860)
Yes29%
No69%
DK2%
What did you replace your lawn with? (N = 251)
Something else30%
Garden areas70%

SPU and Purveyor Water Conservation Survey – Final Report
Document2 05/26/00 41
Table 15 - Removed any Lawn? (Q39)
Over Time Comparison –Removed Any Lawn?
1994 Survey%
1999 Survey%
Yes 35 30
No 65 69
N= (those who have a lawn) 1517 821
Other Yard Care Practices
Q41. Do you mostly maintain your own yard, mostly hire a professional yardservice to maintain it, or do you do both?
Most respondents (75%) maintain their own yards while 13% use a yard service and11% do both (Figure 27). Seattle and Purveyor customers do not differ on thisquestion.
Figure 27 - How Yard is Maintained (Q41)
How do you maintain your yard? (N=945)
Maintain myself75%
Use yard service
13%
Do both11%
DK1%

SPU and Purveyor Water Conservation Survey – Final Report
Document2 05/26/00 42
Regional Comparison – WhoMaintains Yard? N.S.
Seattle%
Purveyor%
Self 73 77
Service 14 12
Both 11 11
Dk 1 0
N= 445 497
Q42. Do you use any low volume watering methods in your garden such asdrip irrigation?
Q43. Do you usually mulch your planting beds?
Q44. Do you usually improve your soil with compost or other organicamendments?
As shown in Figure 28 below, respondents show little use of low-volume watering(69% say they don’t), but over half (54%) usually mulch and two-thirds (66%) usuallyuse compost. Seattle and Purveyor customers do not differ.
Figure 28 - Use of Low-Volume Watering (Q42), Mulching (Q43), andComposting (Q44) Methods
Do you use any of these methods in your yard? (N=945)
31%43%
69%
66%54%
29%
3% 3% 2%0%
10%
20%
30%
40%
50%
60%
70%
80%
90%
100%
Use compost Usually mulch Low-volumewatering

SPU and Purveyor Water Conservation Survey – Final Report
Document2 05/26/00 43
Regional Comparison-doyou. . .? All N.S.
YES NO
Seattle%
Purveyor%
Seattle%
Purveyor%
Use compost 66 65 32 30
Usually mulch 56 53 42 43
Low-volume water 31 27 66 71
N= 445 497 445 497

SPU and Purveyor Water Conservation Survey – Final Report
Document2 05/26/00 44
CHAPTER FIVE – COMMUNICATING ABOUT WATER RESOURCEISSUES
Q45: Where would you most likely get information about lawn and gardencare?
As shown in Figure 29, about a third of all customers (30%) go to local nurseries orgarden centers when they need information about lawn and garden care. Another21% use books and magazines; 14% read newspaper articles, columns and ads, 6%surf the internet, and another 6% get information from radio and TV shows or ads.Other sources include friends and family (3%), professionals and organizations(3%), their own experience (2%) and mail or other printed matter (2%). Nine percent(9%) said they don’t seek lawn and garden care information and 4% didn’t know.
Although the statistics indicate there may be differences between Seattle andPurveyor in terms of where they get their lawn and garden information, only smallpercentage differences occurred, with the largest difference between them being4%.

SPU and Purveyor Water Conservation Survey – Final Report
Document2 05/26/00 45
Figure 29 - Information about Lawn and Garden Care (Q45)
Q46: Where would you most likely get information about appliances such asshowerheads, toilets and washing machines?
Respondents were also asked where they were most likely to get information aboutappliances, such as showerheads, toilets, and washing machines. As shown inFigure 30 below, nearly half (49%) go to home improvement, hardware, orappliance stores. Another 15% utilize books and magazines; 11% read newspaperarticles, columns and ads, 6% surf the internet, and 4% get information from radioand TV shows or ads.
Other sources include friends and family, professionals and organizations, ownexperience, and mail or other printed matter (2% each). Six percent (6%) said theydon’t seek appliance information and 3% didn’t know. No significant differencesoccurred between Seattle and Purveyor customers.
Where do you usually go to get information about lawn and garden care?(N=1223)
Media-Radio/TV
6%
DK4%
Other *10%
Newspaper articles/ads
14%
None-don't get information
9%
Internet6%
Local nursery/ garden center
30%
Books and magazines
21%

SPU and Purveyor Water Conservation Survey – Final Report
Document2 05/26/00 46
Figure 30 - Information About Appliances (Q46)
Q47: And where would you get information about water supply andenvironmental issues such as restoring salmon runs, preventing pollution,and managing garbage?
Respondents were next asked where they were most likely to get information aboutwater supply and environmental issues such as restoring salmon runs, preventingpollution, and managing garbage. As shown in Figure 31, the most popular source(selected by 40% of respondents) was newspaper articles and columns. Twenty-four percent (24%) go to government or utility sources; 12% get information fromradio and TV shows or ads; 7% surf the internet; and 6% utilize books andmagazines.
Other sources included “all of the above” (2%), “word of mouth” (1%), andexperience, school, phone books, and environmental groups received less than 1%each. Four percent (4%) didn’t know and 3% said they don’t seek information aboutwater supply and environmental issues. Again, Seattle and Purveyor customers usesimilar sources.
Where do you usually go to get information about appliances? (N = 1223)
Books and magazines
14%
Newspaper articles/ads
11%
Internet6%
None-don't get information
6%
Media-Radio/TV4%
Other *7%DK
3%
Home improvement, hardware, or
appliance store49%

SPU and Purveyor Water Conservation Survey – Final Report
Document2 05/26/00 47
Figure 31 - Information About Water Supply and Environmental Issues (Q47)
Q48: Which one of the following six words would you most like to see or hearin a message about how you could help to manage our resources:sustainable; conservation; environmental; natural; naturally, and salmonfriendly.
To help in developing a public information campaign on managing resources,respondents were asked to choose one of six words they would most like to see orhear in a message about how to help to manage our resources. As Figure 32 belowshows, the two most popular words were “conservation” (selected by 25% ofrespondents) and “environmental” (selected by 22%) – two old familiar standbys. Indescending order, the remaining choices were “sustainable” (15%), “natural” (13%),“naturally” (10%) and “salmon friendly” (9%). Six percent (6%) didn’t know.
Where do you usually go to get information about water supply and environmental issues? (N = 1223)
Newspaper articles and
columns40%
Government or Utility24%
Radio, TV shows/PSAs
12%
Internet7%
Books and Magazines
6%
Other *4%
DK4%
None-don't get information
3%

SPU and Purveyor Water Conservation Survey – Final Report
Document2 05/26/00 48
Both Seattle and Purveyor customers put conservation and environmental at thetops of their lists, but further down the list, Seattle respondents tended to favorsustainable a bit more than Purveyor respondents, and Purveyor respondentstended to favor natural a little more than Seattle respondents.
Figure 32 - “Message” Words Regarding Managing Resources (Q48)
What one word would you most like to see or hear in a message about how you could help to manage our
resources? (N = 1223)
Conservation25%
Environmental22%
Sustainable15%
Natural13%
Naturally10%
Salmon Friendly9%
DK6%

SPU and Purveyor Water Conservation Survey – Final Report
Document2 05/26/00 49
Regional Comparison –Message Word Sig. = <.05
Seattle%
Purveyor%
Conservation 24 27
Environmental 23 22
Sustainable 18 13
Natural 10 15
Naturally 10 10
Salmon friendly 9 8
DK 6 6
N= 603 620
Q49: Please complete this sentence. “It’s important for people in our area tomanage our resources because. . . .
This question was designed to gather insights about how customers think andexpress their views about the importance of cozening our resources. It’s value is inits qualitative, rather than quantitative nature, so that communication tools can bedeveloped that resonate with customers. However, several major categoriesemerged about why the efficient use of resources is important to people in the PugetSound area, listed below. (The categories are listed according to how frequentlythey occurred, from most to least.)
At the top of the list are two strong themes: protecting the welfare of those who willinhabit the earth in the future, and personal responsibility (If we don’t, who will? oneperson asked).
Ø We need to save for future generations
Ø We’re the stewards; it’s our responsibility
Ø We don’t want to run out
Ø We have limited resources; it’s all we have
Ø We need to protect the earth, the environment, our health, our survival
Ø We have a growing population and have to support it
Ø It’s important, the right thing to do, common sense
Ø We’ll have damage, waste, problems if we don’t
Ø It’s expensive if we don’t; not to save would be costly
Ø Government isn’t doing a good enough job

SPU and Purveyor Water Conservation Survey – Final Report
Document2 05/26/00 50
CHAPTER SIX – PROFILES OF KEY CUSTOMER SEGMENTS
This chapter further “slices” the survey data to profile consumer segments of interestto SPU and its Purveyors. Key questions were crosstabulated by demographics(e.g., income), attitudes, and behaviors to discover if significant differencesemerged. These differences help define which customer segments are alreadyconserving and which segments provide opportunities for more conservation.(Please note that considerable overlap may exist for certain variables; for instance,93% of homeowners live in single family homes, and 65% of renters live in buildingswith three or more units.)
Crosstabulations where the Chi Square statistic was equal to <.05 are highlighted inthis chapter; this statistic means there was less than a 5% probability that thedifferences across groups occurred by chance. Customer segments related toattitudes are presented first, followed by segments for indoor and outdoor wateruses. For Seattle/Purveyor comparisons, please see the previous chapters. Forfurther specific statistics, please refer to the set of data tables, or the electronic datafile, on file with SPU.
Attitudinal Segments
Importance Of Conserving
Those who believe in the importance of conserving water have different attributesthan those who feel conserving in not important. Those who feel conservation isvery important more often:
Ø Live on small to average size lots. Those who say it’s not important to conservetend to live on larger lots of ¼ acre or more.
Ø Have incomes below $75K. Those who say conserving is not important moreoften have incomes above $75K.
Ø Are women (59%) rather than men (41%). Those who feel conserving is notimportant are more likely to be men (58%) rather than women (42%).
Ø Are more concerned about future water supplies and feel their individual actionscan greatly affect water supplies.
Ø Are most motivated to conserve for environmental reasons (65%), as shown inTable 16. While the environment is an important motivator for all groups, savingthe environment becomes a less strong motivator and money becomes astronger motivator as the importance of conservation decreases.

SPU and Purveyor Water Conservation Survey – Final Report
Document2 05/26/00 51
Table 16 - Most Important Reason To Conserve (Q 10) By Importance OfConservation (Q4)
How important toconserve. . .?
Very Important%
Somewhat Important%
Not Important%
Saving salmon 12 11 4
Saving money 12 16 24
Saving on new supplies 9 10 10
Saving the environment 65 59 50
N = 606 517 93
How Much More Water Can You Save?
Those who say their households can realistically save at least somewhat more wateralso differ from those who say they can’t save more. Those that think they can saveat least 5% more water are more likely to:
Ø Live in households with three or more occupants. Of those who say they can’tsave more water, 73% live in one and two person households.
Ø Be between 18 and 55 years of age. Of those who say they can’t save any morewater, 59% are above age 55.
Ø Have incomes above $50K per year. 68% of those who say they cannot savemore water have household incomes less than $50K.
Ø Believe their individual actions can affect supplies and that conserving water is atleast somewhat important.
Indoor Use Segments
Installing Low-Flow Showerheads
In 1992, Seattle and Purveyor utilities distributed low-flow showerheads to theircustomers. In this survey, we asked consumers if they installed this showerheadand 51% overall said yes. Data show that certain consumer segments were muchmore likely to install the showerheads than others:
Ø The older the respondent, the more likely they were to report the showerheadhad been installed, with younger respondents (18-34 years of age) much lesslikely than any other age group to report it had been installed (32% versus morethan 50% for every other age group).
Ø The more importance consumers place on conserving, the more likely they wereto report having installed the showerheads (56% among those who said it was
SPU and Purveyor Water Conservation Survey – Final Report
Document2 05/26/00 52
very important to conserve, compared to 29% among those who said it was nottoo important to conserve).
Ø No significant differences for showerhead installation emerged by ethnicity,income, gender, level of concern about water supply, and the most importantmotivation to conserve.
Toilets: Awareness Of Water Used In Flushing
The population data revealed that many consumers are not aware that toilet flushingis one of the top two uses of water indoors in most people’s homes. However,certain groups of consumers are more aware of this than others, including:
Ø Significantly more multi-family than single family dwellers chose toilet flushing asa top use (54% to 46%). This is likely due to the lower proportion of clotheswashers in multi-family homes.
Ø The smaller the household size, the more likely respondents were to pick toiletflushing as a top use (1 person = 62%; 2 persons = 48%; 3 persons = 41%).
Ø Older respondents were much more likely to choose toilet flushing (54% for those65+ versus 43% for those 18-34).
Ø No differences emerged by ethnicity, income, gender, level of concern aboutwater supply, the importance of conserving, or the most important motive toconserve.
Toilets: Multiple Uses Before Flushing, Checking For Leaks, Replacements
The number of toilets consumers have in their homes appears to be related tohousehold size and type rather than any attitudes about conservation. However, theuse, maintenance, and replacement of toilets vary by a number of factors.
Households who allow multiple uses before flushing the toilet (39% of thepopulation), those who check their toilets for leaks (65%), and those who havereplaced their toilets in the last seven years (29%) are already saving water as aresult of these behaviors. Characteristics of households taking these conservationsteps, and those that are not, are described below.
Those Who Allow (And Don’t Allow) Multiple Uses Before Flushing
Ø One person households are more likely to flush less than those in largerhouseholds (1 person = 42% allowing multiple flushes; 2 persons = 37%; 3+persons = 39%).
Ø Those above 35 are likely to flush less than consumers in the youngest agegroup (18-34 years) where only 29% allow more than one use before flushing .

SPU and Purveyor Water Conservation Survey – Final Report
Document2 05/26/00 53
Ø As income decreases, so does the tendency to flush with each use. Consumersin the highest income group ($100K+) are least likely to allow two or more usesbefore flushing (30%).
Ø Individuals who are concerned about future water supply and those who say it isvery important for their household to conserve water are more likely to allowmultiple uses before flushing.
Those Who Check For Toilet Leaks And Those Who Don’t
Ø Homeowners are much more likely than renters to have checked their toilets forleaks, as are those living in single family homes compared to those living in multi-family homes.
Ø Older consumers are also much more likely to have checked for leaks thanyounger consumers (75% of those 55-64 compared to 46% of those 18-34).
Ø Men check for leaks much more often than women (69% to 61%).
Ø Consumers who believe it is very important to conserve have checked for toiletleaks more often (69% compared to 58% of those who say it’s not too importantto conserve).
Those Who Have Replaced Toilets In The Past Seven Years
Ø Those living in larger households are much more likely to have replaced a toiletin the past seven years.
Ø Consumers between 45 and 54 are the most likely to have replaced a toilet(34%) in that time frame.
Ø Those with the highest incomes ($100K and above) are more likely than anyother income category to have changed out a toilet (35%).
Ø No differences emerged by gender, level of concern about supply, theimportance of conserving, or the most important motivation to conserve.
Toilets: Future Replacements
A toilet replacement program is currently being planned for residential customers.This section describes those who already plan to replace a toilet in working order intheir home within the next two years (8%), and those who would likely do so if theycould do it for $100.00 and knew they would be paid back within two years throughreduced water and sewer bills (18%). (Note: These groups are not mutuallyexclusive.)
Those Who Will Likely Replace A Toilet On Their Own
Ø As household size increases, so does the likelihood of toilet replacement (10%for single person households; 19% for 3+ member households).

SPU and Purveyor Water Conservation Survey – Final Report
Document2 05/26/00 54
Ø The plan to replace a toilet does not appear related to customer income, age,ethnicity, gender, or most attitudes about conservation (e.g., importance ofconserving). Indeed, customers are most strongly motivated to replace theirtoilets by the desire to remodel their bathrooms.
Ø Still, those who think they can do more to save water are significantly more likelyto say they will replace a toilet. And, consumers did give saving on water useand the water bill as a secondary reasons for toilet replacement. Saving waterand saving on the bill more strongly motivate single family homeowners thanother groups.
Those Who Will Spend $100.00 To Replace A Toilet If Payback Is Two Years
Ø As household size increases, so does the likelihood of replacing a toilet underthis scenario (14% for single person households; 21% for 3+ memberhouseholds).
Ø Those aged 45-54 are the most likely to change out a toilet under this scenario(25%), while those who are 55+ are the least likely.
Ø As income rises, so does the interest in spending $100 to replace a toilet (15%very likely for those households earning less than $25K compared to 25% forthose households with $100K annual income).
Ø Among those who say they have a great deal more water to save, only 8% saythey plan to replace a working toilet on their own. However, when presented withthe scenario of spending $100 and getting a two year payback, 24% say theywould be very likely to replace their toilets. This scenario motivates allconsumers, no matter how much they have to save, but those who think theyhave the most to save are the most motivated, as shown in the table below:
Table 17 - Toilet Replacement Under Various Conditions
Save GreatDeal More
Save SomeMore
Save a LittleMore
Save No More
How Likely to Install. . . OnOwn
Spend$100
OnOwn
Spend$100
OnOwn
Spend$100
OnOwn
Spend$100
% % % % % % % %
Very Likely 8 24 9 22 6 16 6 13
Somewhat Likely 9 24 10 25 6 24 5 12
N = 178 180 363 357 362 390 256 263
Ø As people feel it’s more important to conserve, they’re also more likely to saythey will replace their toilet (22% who say it’s very important to conserve are also

SPU and Purveyor Water Conservation Survey – Final Report
Document2 05/26/00 55
very likely to replace; only 9% of those who say it’s not important to conserve arevery likely to replace).
Ø Those who chose “saving salmon” as the most important motive to conserve arealso the most likely, by far, to say they would likely change (29% very likely,compared to 19% who were most motivated by preserving the environment, and12% each for those who were most motivated by saving on the bill and bywanting to delay the cost of new supplies).
Outdoor Use Segments
General Yard and Garden Practices
Who Maintains The Yard?
Most consumers (75%) maintain their own yards, but there is variation bydemographics as described below.
Ø Owners more often maintain their own yards than renters (77% vs. 63%), andrenters more often use a yard service (22% vs. 12% for owners).
Ø Members of larger households more often maintain their own yards (86% forhouseholds of 3+ vs. 55% for single-person households), and single-personhouseholds more often use a yard service (29% vs. 7% for households of 3+).
Ø People 65 years and older are much less apt to maintain their own yards (63%vs. 75% for the population), and are more apt to use a yard service (23% vs.13% for the population).
Ø Gender and attitudes toward conservation have no affect on whether or notindividuals maintain their own yards.
Who Mulches Planting Beds And Uses Compost?
While demographics affect these two behaviors, attitudes about conservation andthe environment are probably the strong determinants.
Ø Owners are more likely than renters to mulch their beds and use compost.
Ø Larger households and households with more land tend to compost more.
Ø The youngest age group of consumers (18-34 years) is significantly less likely tomulch their planting beds or use compost than older consumers.
Ø Caucasians are far more likely than other ethnic groups to improve their soil withorganic amendments (68% compared to 34% for African Americans and 56% forAsians).
Ø The highest income group (100K+) is more likely to mulch their beds (64% vs.54% for the population).

SPU and Purveyor Water Conservation Survey – Final Report
Document2 05/26/00 56
Ø Individuals who say it is very important for their household to conserve water;who feel their households’ actions can greatly affect whether future waterdemands are met; who feel it’s very important to conserve; and who are mostmotivated by saving the environment and salmon are also more likely to mulchbeds and add organic amendments to soil.
Incidence And Size Of Lawn
The presence of and size of lawn are primarily affected by demographics and aremostly common sense (e.g., single family homes and those with larger lots are morelikely to have larger lawns). Interestingly, size of lawn does not appear to beaffected by individuals’ attitudes towards water supply or conservation. Forinstance, those who feel it’s very important to conserve do not have significantlysmaller amounts of lawn in their yards.
Importance Of Having A Green Lawn
Customers were asked how important a green lawn was as part of their landscaping(36% overall say it’s important) and how likely they would be to have a natural lawn(43% very likely). Some demographic characteristics (such as homeownership andincome) affected preferences, and attitudes about conserving water had a consistentand strong effect.
Ø Owners more often say that a green lawn is important compared to renters (48%vs. 33%), and renters more often say that a green lawn is not at all importantcompared to owners (39% vs. 25%).
Ø Households where it is very important to conserve water are more likely to say agreen lawn is not at all important (31%). But in households where conserving isnot important, fewer feel lawns are not important (17%). A similar pattern holdstrue in comparing households that feel they can greatly affect future supplies bytheir individual actions versus those that feel individuals actions have little affecton future supplies, as shown in Table 18 below:
Table 18 - Importance Of A Green Lawn (Q27) By Conservation Attitudes
Effect of Individual Actions Importance of Conserving
Import of Green Lawn Great%
Some%
Little%
Very%
Somewhat%
Not%
Very Important 14 16 24 14 16 21
Not At All Important 34 19 27 31 22 17
N = 365 391 82 437 361 58

SPU and Purveyor Water Conservation Survey – Final Report
Document2 05/26/00 57
Ø Individuals between 45 and 54 years are most likely to want a natural lawn (52%say very likely). Individuals 65 years or older are least likely to want a naturallawn (32% say not too or not at all likely compared to 24% in the population).
Ø The highest income groups ($100K and over) are least likely to want a naturallawn (38% very likely), and 16% say they are not at all likely to have a naturallawn compared to 11% in the population.
Ø Individuals who say it is very important for their household to conserve water andthose who feel their households’ actions can greatly affect whether future waterdemands are met are most likely to want a natural lawn, as shown in Table 19below.
Table 19 - Likelihood Of A Natural Lawn by (Q28) By Conservation Attitudes
Effect of Individual Actions%
Importance of Conserving%
Likelihood of NaturalLawn
Great%
Some%
Little%
Very%
Somewhat%
Not%
Very Likely 51 36 41 48 41 25
Not At All Likely 10 10 15 12 9 17
N = 365 391 82 437 361 58
Frequency of Watering
Frequency of lawn watering is affected by some demographics (such as homeownership and income) and by individuals’ attitudes towards conserving water.
Ø Renters are significantly more likely than homeowners to never water their lawns(42% to 30%).
Ø As income levels rise, so does the frequency of watering, as shown in the Table20 below.
Table 20 - Frequency of Watering by Income Levels
Under$25K
%
$25-$50K
%
$50K-$75K
%
$75-$100K
%
$100K& above
%Waters twice a month or less(includes never water)
66 60 56 51 48
Waters once a week or more 33 38 43 48 51
N = 85 183 130 91 98

SPU and Purveyor Water Conservation Survey – Final Report
Document2 05/26/00 58
Ø Individuals who say it is very important for their household to conserve water andthose who feel their households’ actions can greatly affect future water supplyare most likely to never water.
Lawn Removal
Removing lawn is one method for usually reducing use; 29% of the populationoverall have done so. The characteristics of those most likely to have removed partof their lawn are described below.
Ø Not surprisingly, single family homeowners are most likely to have removed partof their lawn.
Ø Those with the largest lots (1/4-1/2 acre and ½ acre or more) are least likely tohave removed lawn (24% and 22%, respectively).
Ø Larger households are more apt to have removed lawn (33% for households of3+ compared to 17% for single-person households).
Ø Individuals between 45 and 54 years are most likely to have removed lawn(39%), and those 65 years and older are least likely to have removed lawn(15%).
Ø Attitudes towards water conservation appear to have no effect on removal oflawn.
Traditional and Environmentally Friendly Lawn Care Practices
The findings suggest that there are two types of lawn care approaches.Unfortunately, they share some of the same demographic characteristics.
1. The non-environmentally friendly, “traditional” approach that picks up theirlawn clippings, uses non-organic fertilizers, weed-n-feed, and pesticides.This group is also more likely to over-seed and aerate their lawns. They donot tend to be motivated by conservation attitudes, since those who followthese procedures are more likely to water often and less likely to neverwater.
2. The environmentally friendly approach that uses a mulching mower and/orleaves their grass clipping on the lawn, organic fertilizers, no weed-n-feedand no pesticides. This group uses over-seeding and aerating less than thegroup above, but they do water less often and are motivated by the need toconserve.
Ø Those with two or more people in the household are much more likely to use amulching mower (45% to 33% for single person households) and leave grassclippings on the lawn. However, larger households are also more likely to aerateand over-seed, and use pesticides.

SPU and Purveyor Water Conservation Survey – Final Report
Document2 05/26/00 59
Ø Unlike a variety of other findings, the youngest consumers (18-34) are also themost likely to use a mulching mower (54% compared to 43% in the generalpopulation) and leave on grass clippings. Older consumers are much more likelyto use fertilizer (organic or otherwise) and weed-n-feed type products.
Ø Those households with the highest incomes are more likely than those with lowerincomes to use fertilizer, weed-n-feed, aerate and over-seed, and use pesticides.
Ø Those who are more concerned about conservation are more likely to use fewerchemical products on their lawns.
Watering Practices
Who Uses Low Volume Watering?
Ø Those with lots over ½ acre in size are more likely to use low volume wateringmethods (38% vs. 29% for the population).
Ø Owners are more likely to use low volume watering methods (30% vs. 13% forrenters).
Ø Use of low volume water methods increases steadily with age (17% for those 18-34 years old and 35% for those 55-64 years); however, use of low water methodsfalls off slightly among those 65 years and older to 29%.
Ø Individuals who say it is very important for their household to conserve water andthose who feel their households’ actions can greatly affect whether future waterdemands are met are more likely to use low volume watering methods.
Ø Those with low volume water systems are more likely to have removed lawn.
Who Uses Automatic Sprinkler Systems?
Ø Owners are more likely to use a sprinkler system than renters (22% vs.14%).
Ø Individuals living on lots over ½ acre are more likely to use sprinkler systems(33% compared to 21% for the population).
Ø As income increases, there is a steady increase in the use of sprinklers: 33% ofindividuals in the top income bracket ($100K and over) use sprinklers while 8% ofthose making less than 25K use them.
Ø Individuals who say it is not important for their households to conserve water aremost likely to use an automatic sprinkler system (29% compared to 21% for thepopulation). While automatic sprinkling systems can be the most efficient if usedproperly, this is probably not the reason people install them (i.e., for convenience,not conservation).