Embed Size (px)
Citation preview
©1999 Addison Wesley Longman Slide 1.1
BusinessProcesses
3
©1999 Addison Wesley Longman Slide 1.2
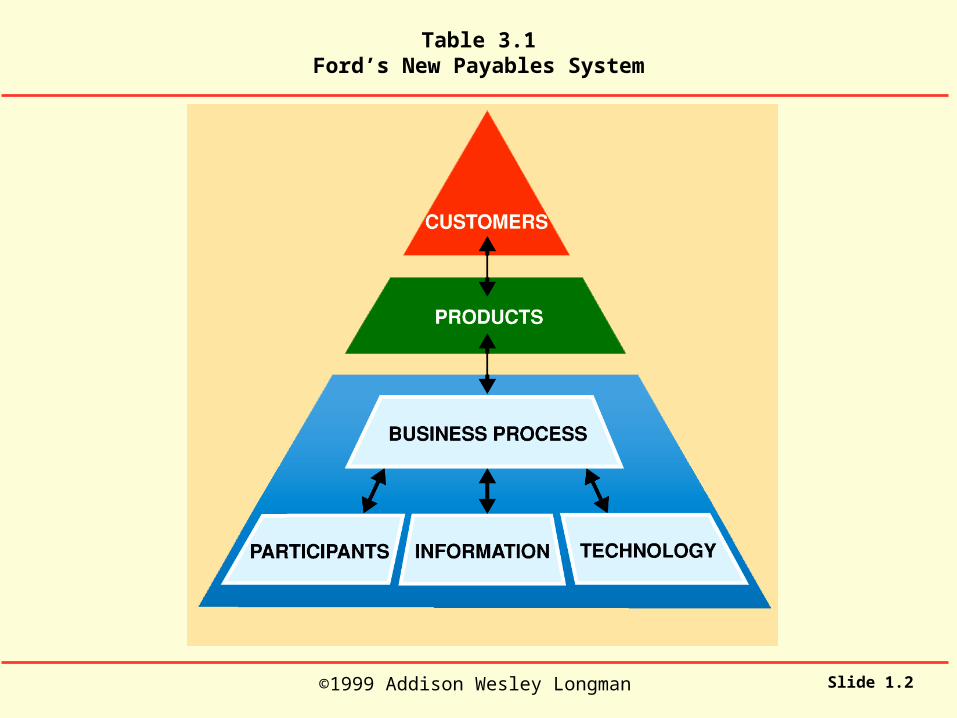
Table 3.1Ford’s New Payables System

©1999 Addison Wesley Longman Slide 1.3
Table 3.1Ford’s New Payables System
CUSTOMER
Ford’s suppliers
Ford’s manufacturing and purchasing departments
©1999 Addison Wesley Longman Slide 1.4
Table 3.1Ford’s New Payables System
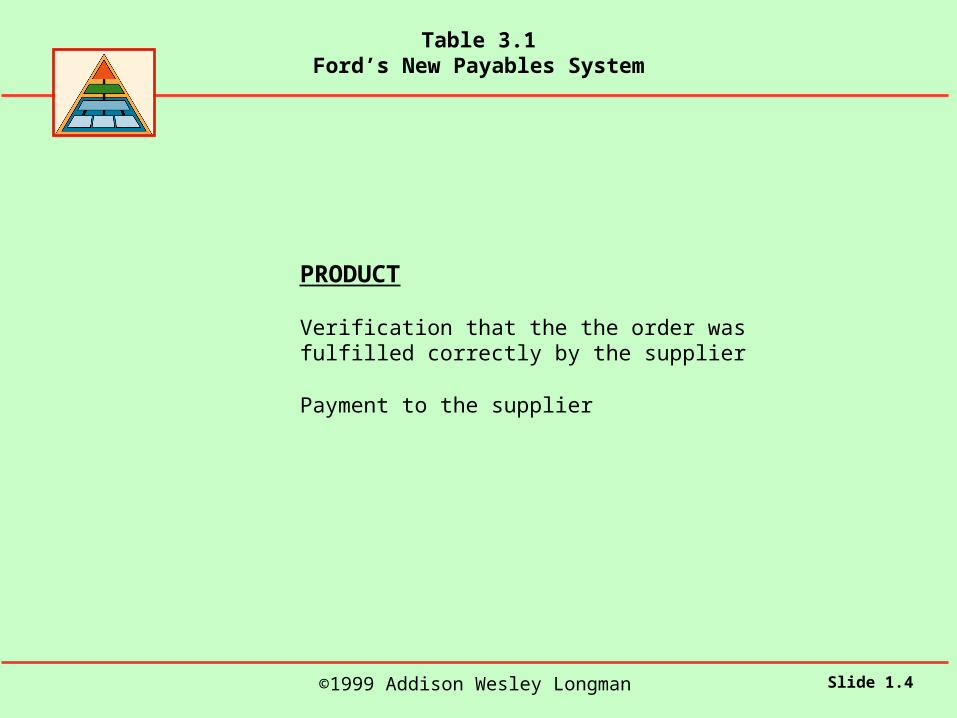
PRODUCT
Verification that the the order was fulfilled correctly by the supplier
Payment to the supplier
©1999 Addison Wesley Longman Slide 1.5
Table 3.1Ford’s New Payables System
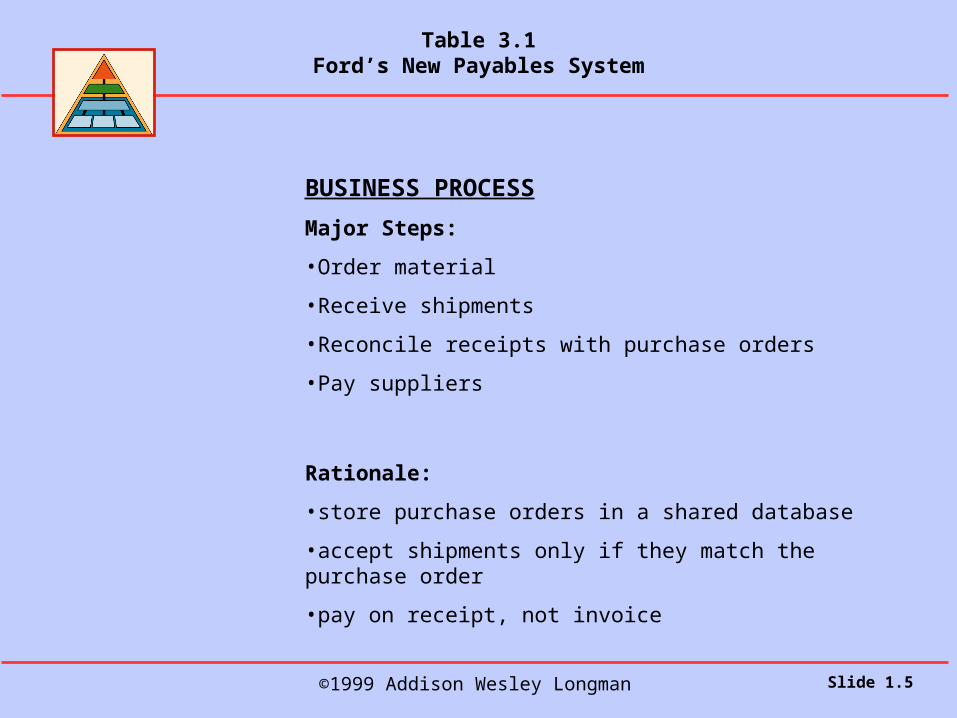
BUSINESS PROCESS
Major Steps:
•Order material
•Receive shipments
•Reconcile receipts with purchase orders
•Pay suppliers
Rationale:
•store purchase orders in a shared database
•accept shipments only if they match the purchase order
•pay on receipt, not invoice
©1999 Addison Wesley Longman Slide 1.6
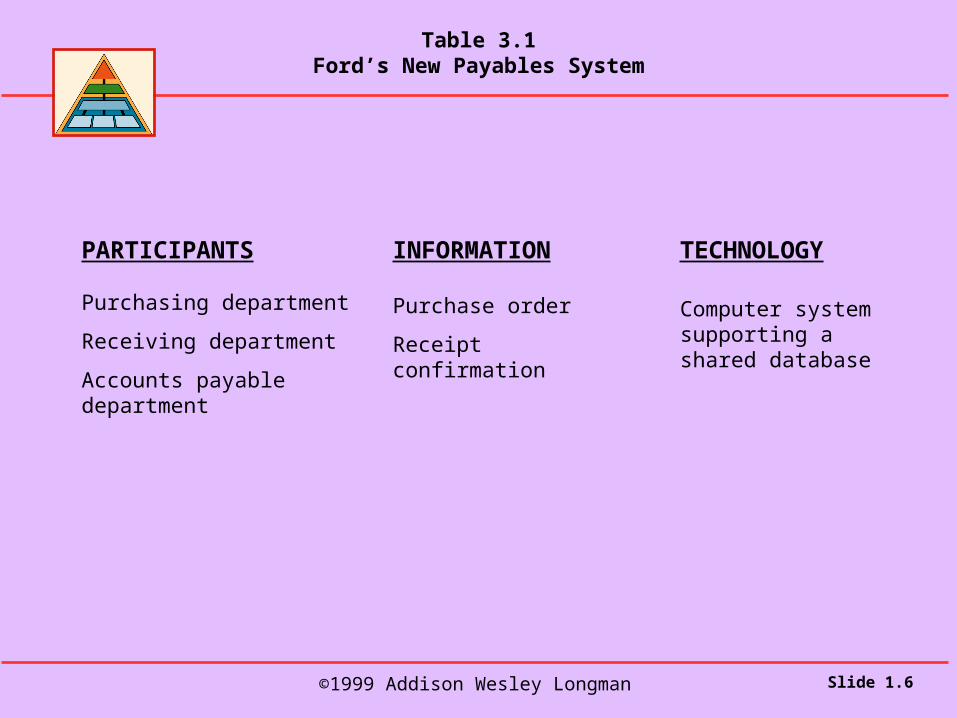
Table 3.1Ford’s New Payables System
PARTICIPANTS
Purchasing department
Receiving department
Accounts payable department
INFORMATION
Purchase order
Receipt confirmation
TECHNOLOGY
Computer system supporting a shared database
©1999 Addison Wesley Longman Slide 1.7
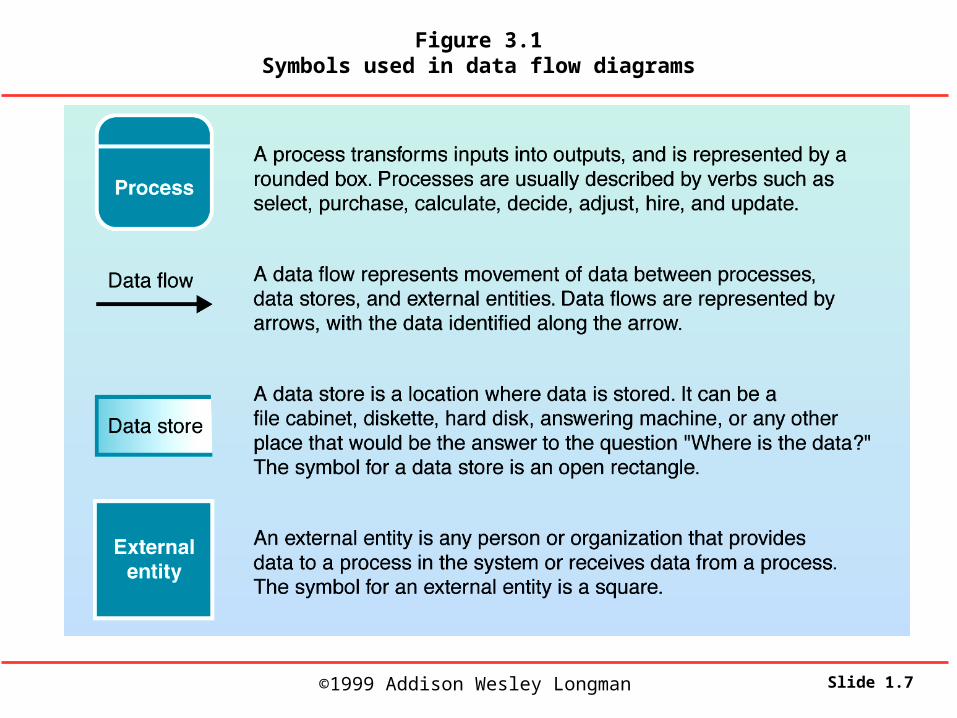
Figure 3.1Symbols used in data flow diagrams
©1999 Addison Wesley Longman Slide 1.8
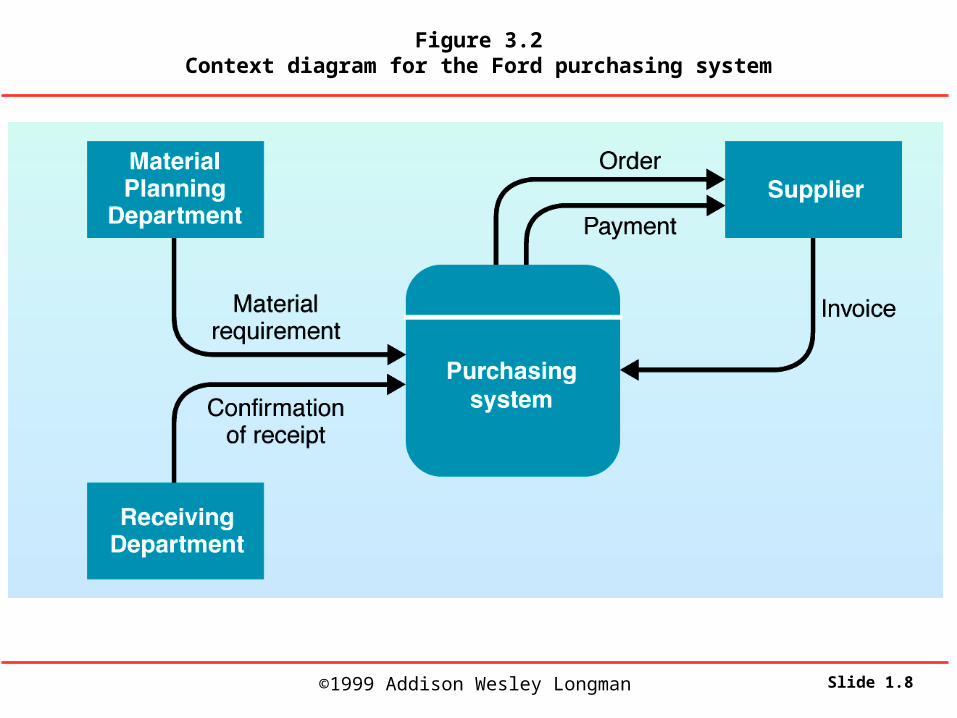
Figure 3.2Context diagram for the Ford purchasing system

©1999 Addison Wesley Longman Slide 1.9
Figure 3.3Data flow diagram showing the main processes in Ford’s original purchasing system
©1999 Addison Wesley Longman Slide 1.10
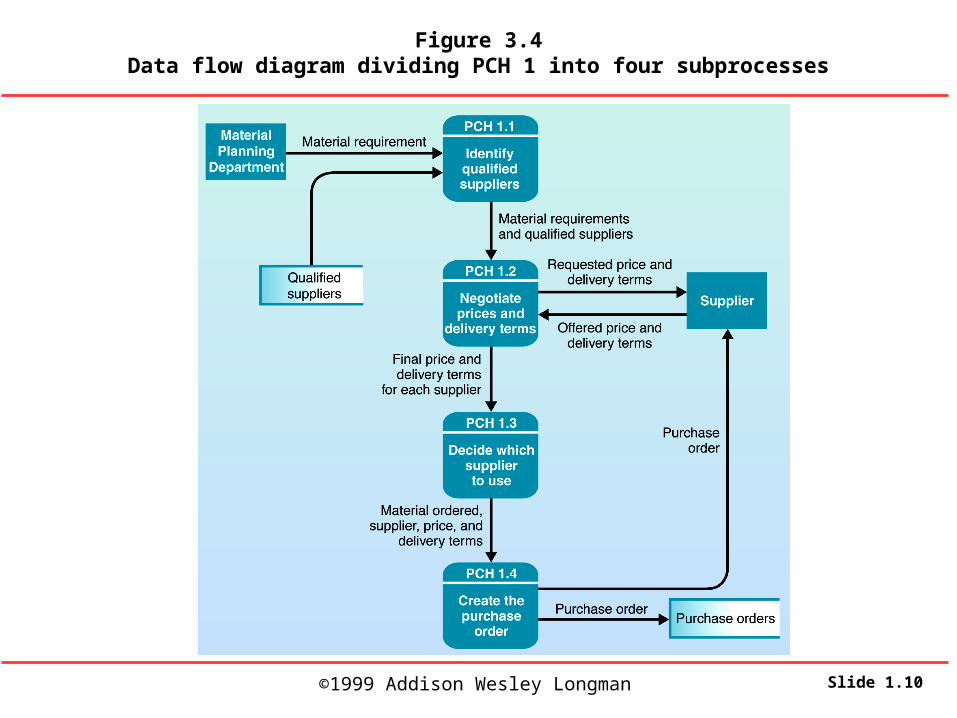
Figure 3.4Data flow diagram dividing PCH 1 into four subprocesses
©1999 Addison Wesley Longman Slide 1.11
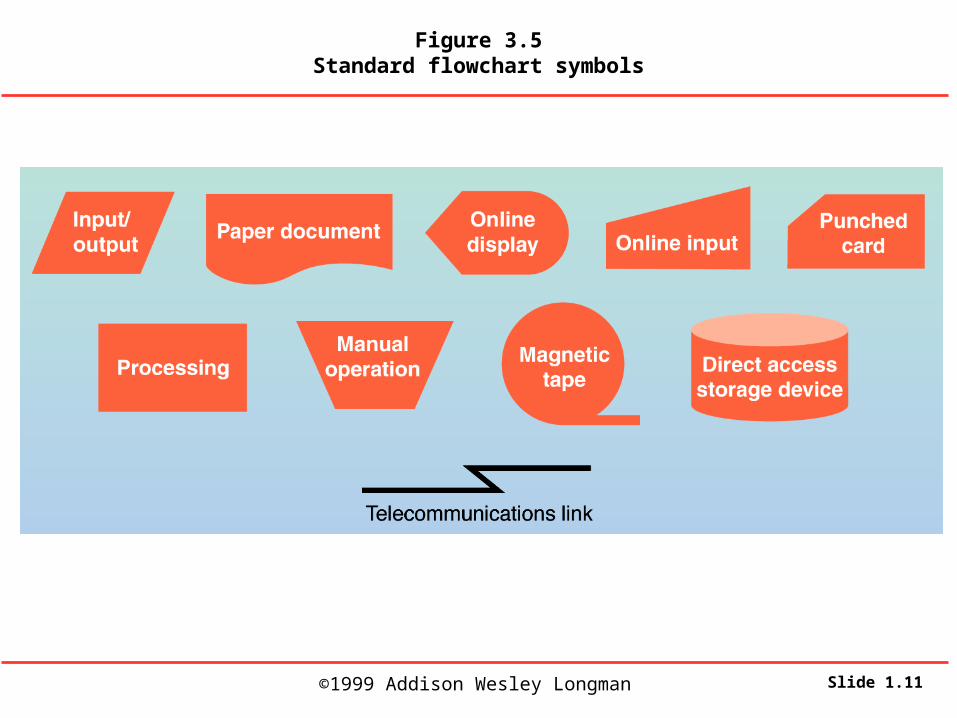
Figure 3.5Standard flowchart symbols
©1999 Addison Wesley Longman Slide 1.12
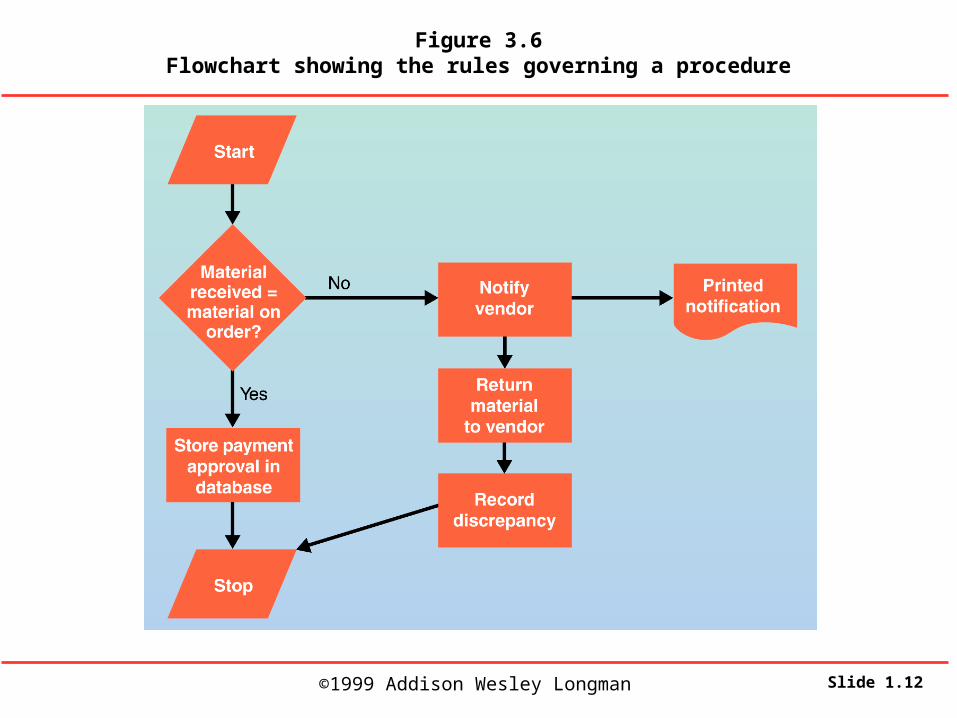
Figure 3.6Flowchart showing the rules governing a procedure
©1999 Addison Wesley Longman Slide 1.13
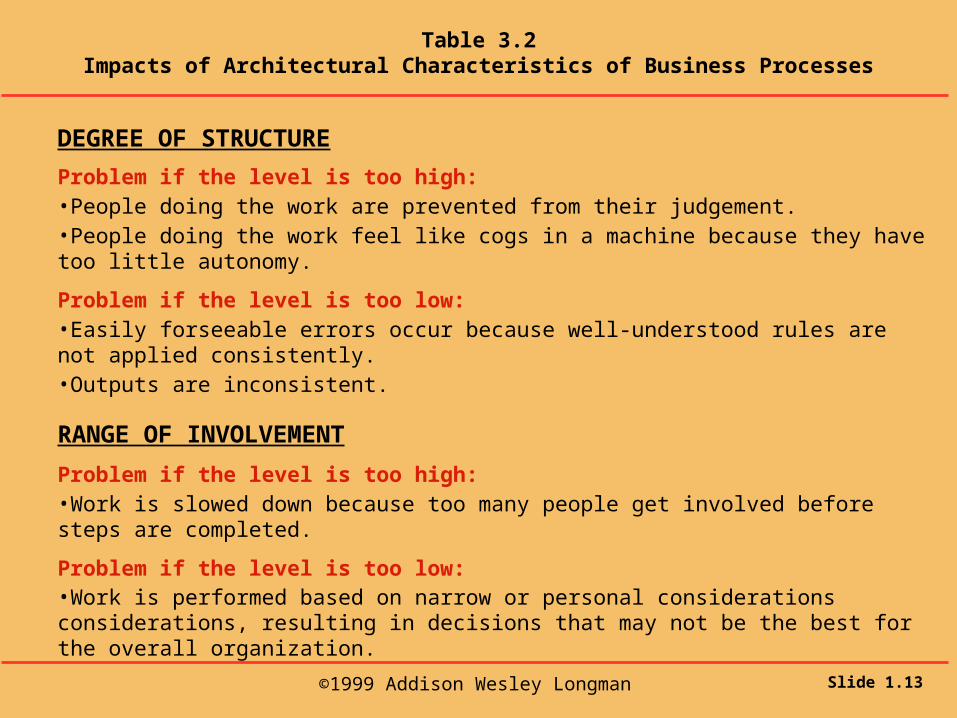
Table 3.2Impacts of Architectural Characteristics of Business Processes
DEGREE OF STRUCTURE
Problem if the level is too high: •People doing the work are prevented from their judgement.•People doing the work feel like cogs in a machine because they have too little autonomy.
Problem if the level is too low:•Easily forseeable errors occur because well-understood rules are not applied consistently.•Outputs are inconsistent.
RANGE OF INVOLVEMENT
Problem if the level is too high: •Work is slowed down because too many people get involved before steps are completed.
Problem if the level is too low: •Work is performed based on narrow or personal considerations considerations, resulting in decisions that may not be the best for the overall organization.
©1999 Addison Wesley Longman Slide 1.14
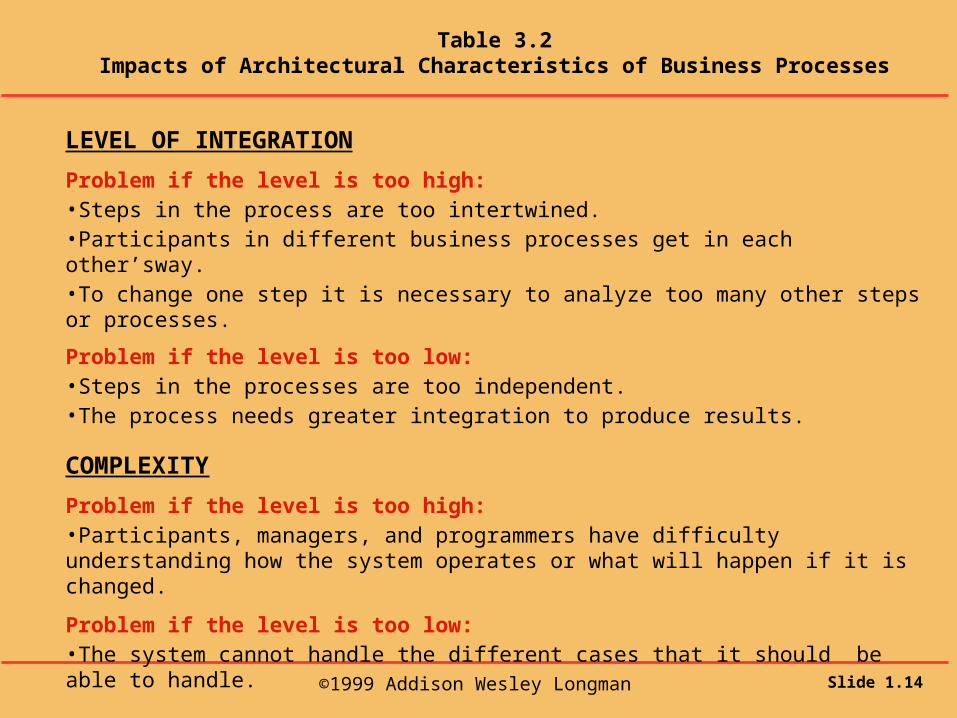
Table 3.2Impacts of Architectural Characteristics of Business Processes
LEVEL OF INTEGRATION
Problem if the level is too high: •Steps in the process are too intertwined. •Participants in different business processes get in each other’sway. •To change one step it is necessary to analyze too many other steps or processes.
Problem if the level is too low: •Steps in the processes are too independent. •The process needs greater integration to produce results.
COMPLEXITY
Problem if the level is too high: •Participants, managers, and programmers have difficulty understanding how the system operates or what will happen if it is changed.
Problem if the level is too low: •The system cannot handle the different cases that it should be able to handle.
©1999 Addison Wesley Longman Slide 1.15
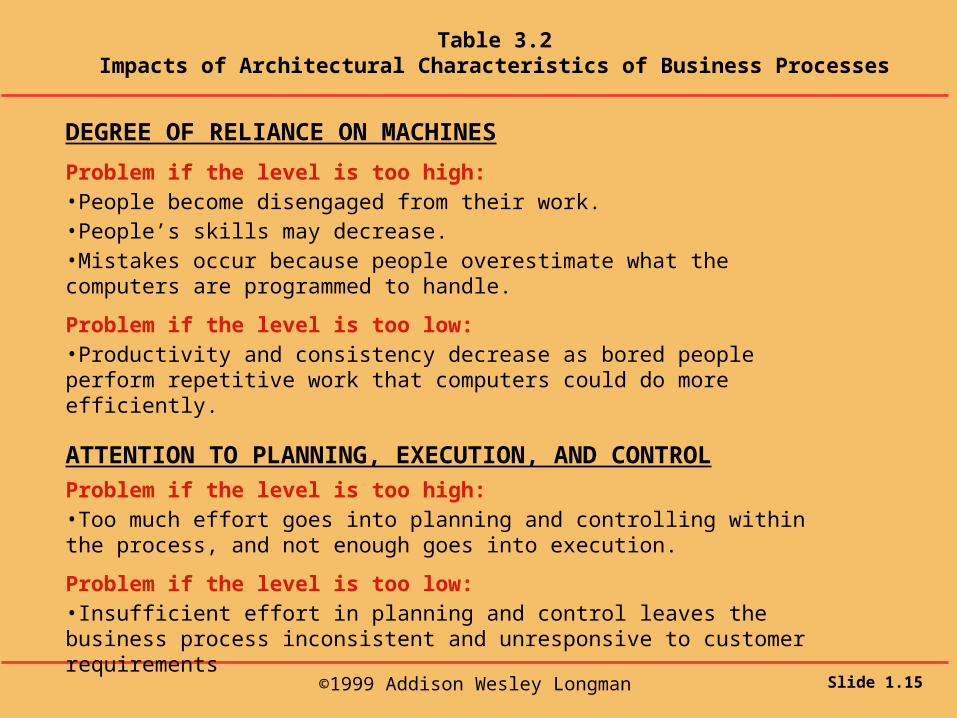
Table 3.2Impacts of Architectural Characteristics of Business Processes
DEGREE OF RELIANCE ON MACHINES
Problem if the level is too high:•People become disengaged from their work.•People’s skills may decrease. •Mistakes occur because people overestimate what the computers are programmed to handle.
Problem if the level is too low: •Productivity and consistency decrease as bored people perform repetitive work that computers could do more efficiently.
ATTENTION TO PLANNING, EXECUTION, AND CONTROL
Problem if the level is too high: •Too much effort goes into planning and controlling within the process, and not enough goes into execution.
Problem if the level is too low: •Insufficient effort in planning and control leaves the business process inconsistent and unresponsive to customer requirements
©1999 Addison Wesley Longman Slide 1.16
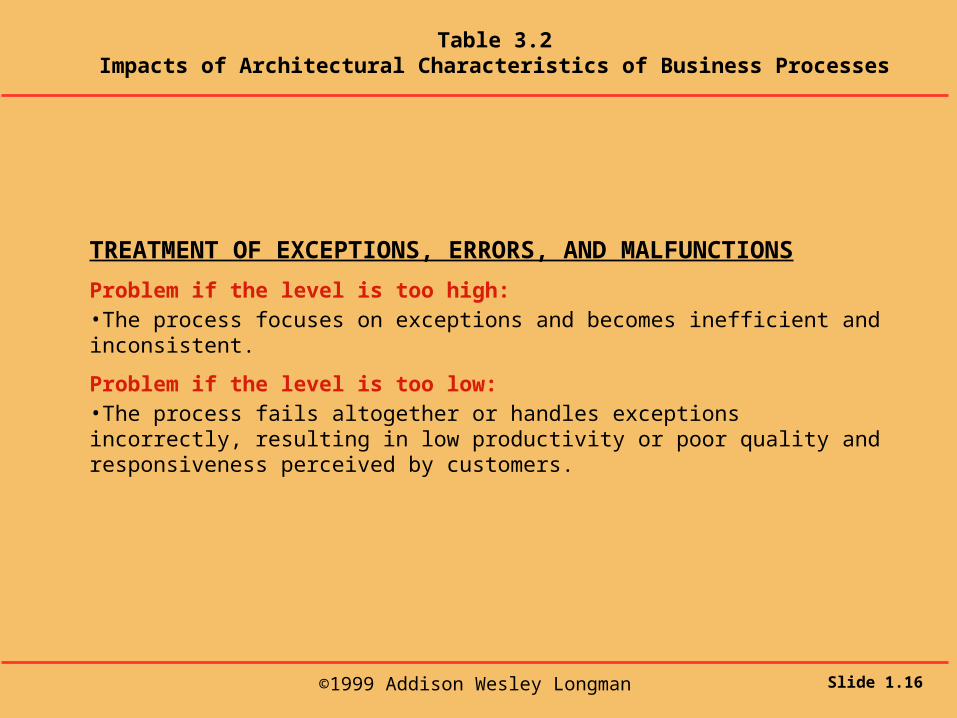
Table 3.2Impacts of Architectural Characteristics of Business Processes
TREATMENT OF EXCEPTIONS, ERRORS, AND MALFUNCTIONS
Problem if the level is too high: •The process focuses on exceptions and becomes inefficient and inconsistent.
Problem if the level is too low: •The process fails altogether or handles exceptions incorrectly, resulting in low productivity or poor quality and responsiveness perceived by customers.
©1999 Addison Wesley Longman Slide 1.17
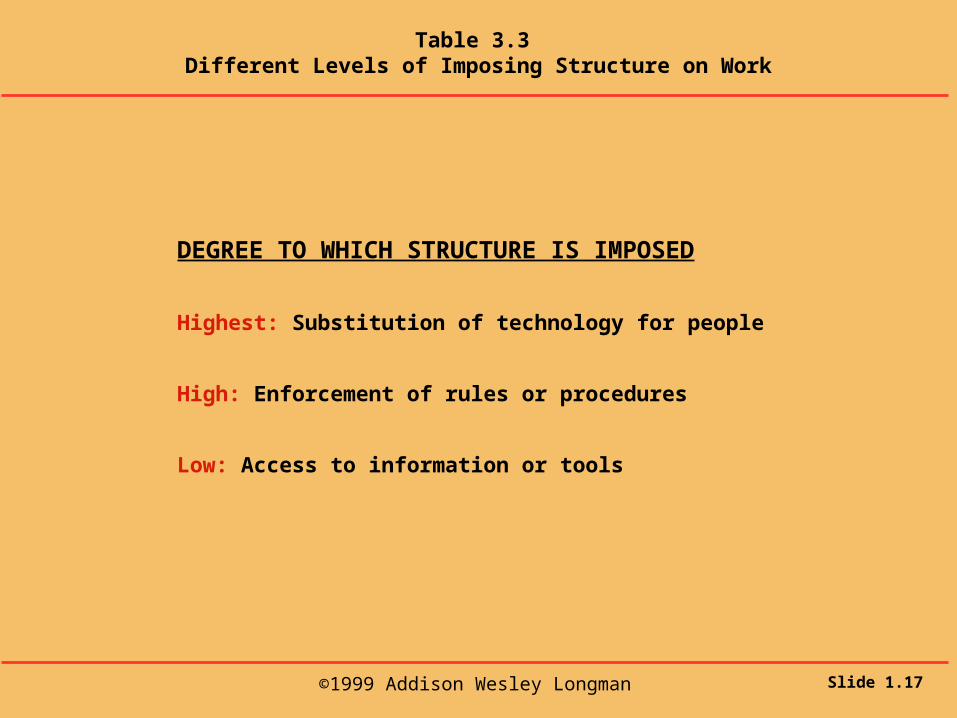
Table 3.3 Different Levels of Imposing Structure on Work
DEGREE TO WHICH STRUCTURE IS IMPOSED
Highest: Substitution of technology for people
High: Enforcement of rules or procedures
Low: Access to information or tools
©1999 Addison Wesley Longman Slide 1.18
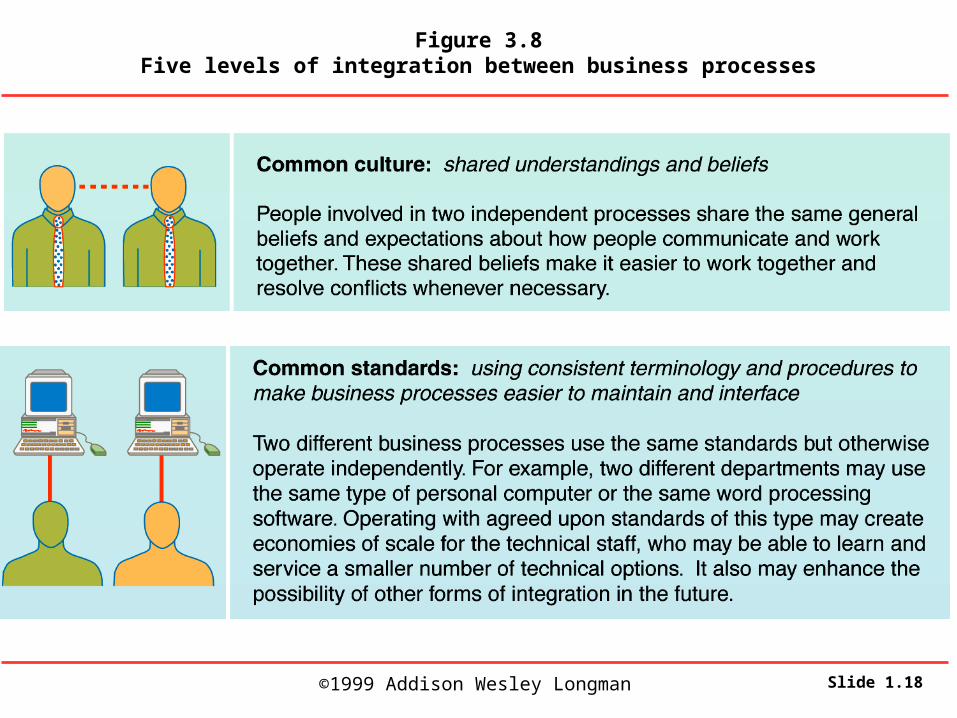
Figure 3.8Five levels of integration between business processes
©1999 Addison Wesley Longman Slide 1.19
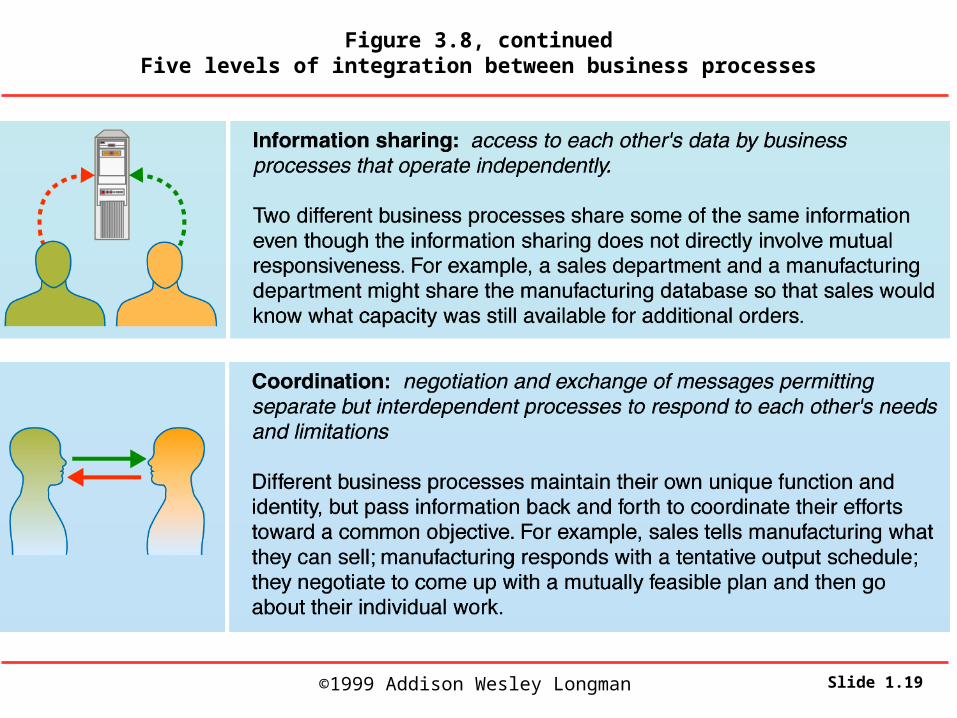
Figure 3.8, continuedFive levels of integration between business processes
©1999 Addison Wesley Longman Slide 1.20
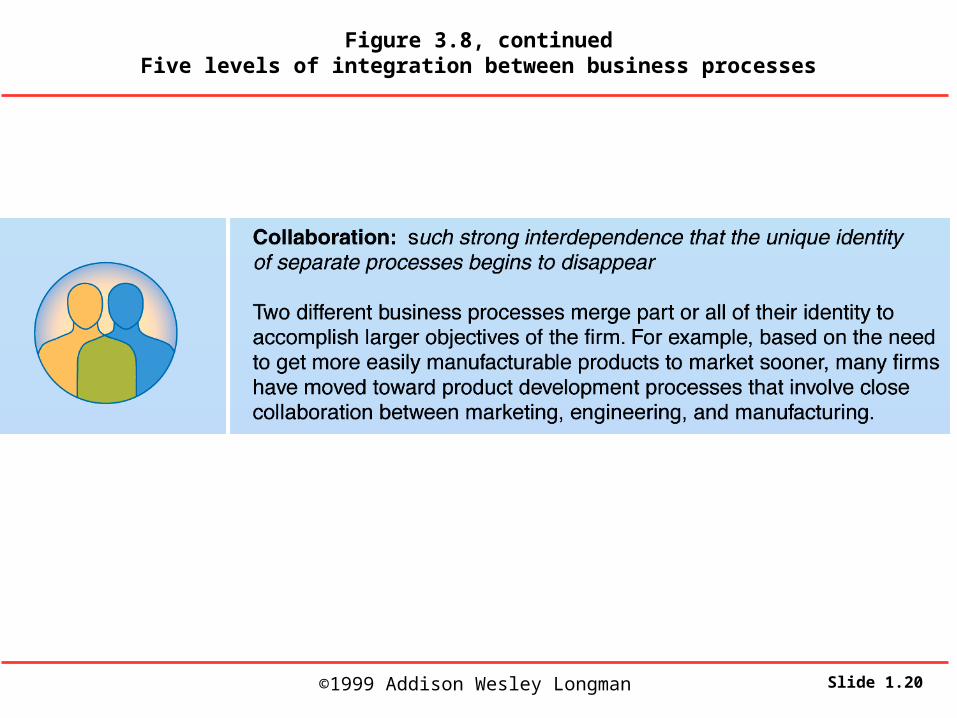
Figure 3.8, continuedFive levels of integration between business processes
©1999 Addison Wesley Longman Slide 1.21
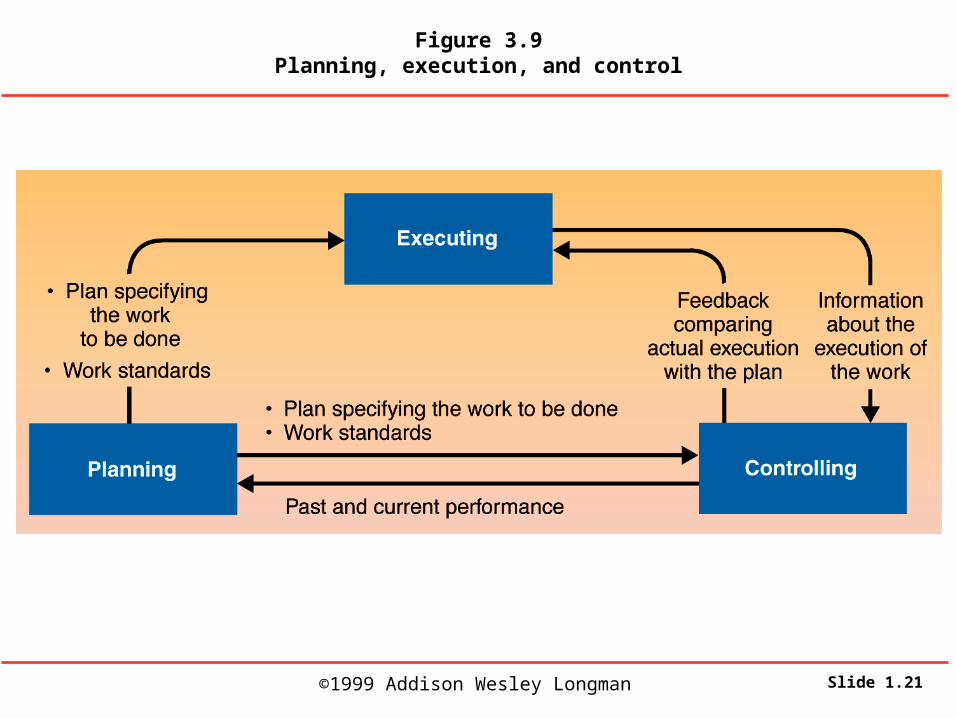
Figure 3.9Planning, execution, and control
©1999 Addison Wesley Longman Slide 1.22
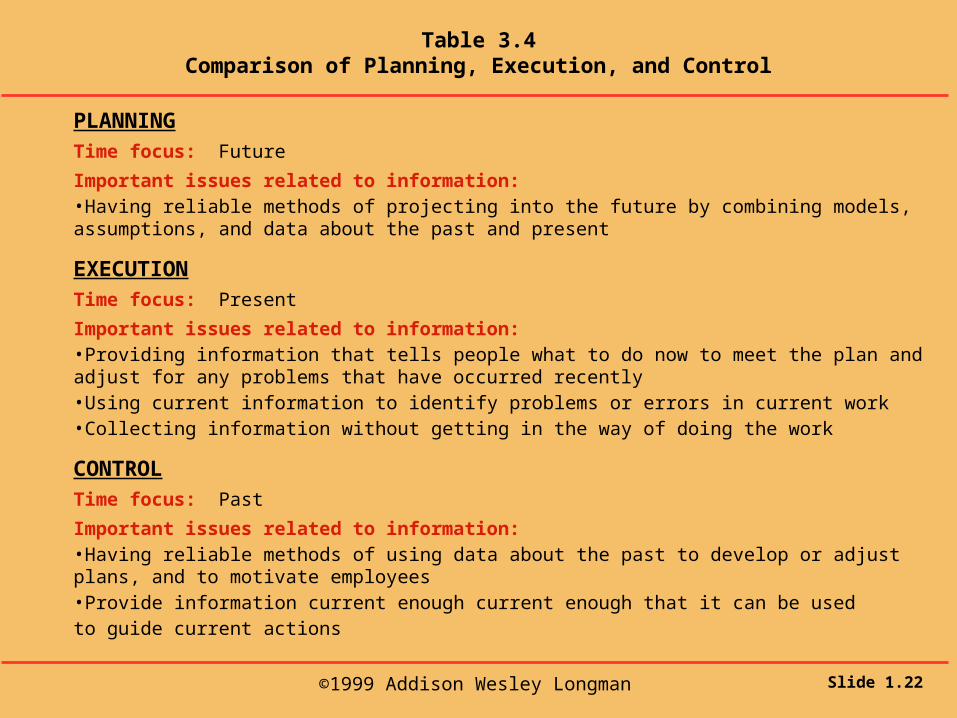
Table 3.4Comparison of Planning, Execution, and Control
PLANNING
Time focus: Future
Important issues related to information:•Having reliable methods of projecting into the future by combining models, assumptions, and data about the past and present
EXECUTION
Time focus: Present
Important issues related to information: •Providing information that tells people what to do now to meet the plan and adjust for any problems that have occurred recently •Using current information to identify problems or errors in current work •Collecting information without getting in the way of doing the work
CONTROL
Time focus: Past
Important issues related to information: •Having reliable methods of using data about the past to develop or adjust plans, and to motivate employees•Provide information current enough current enough that it can be used to guide current actions
©1999 Addison Wesley Longman Slide 1.23
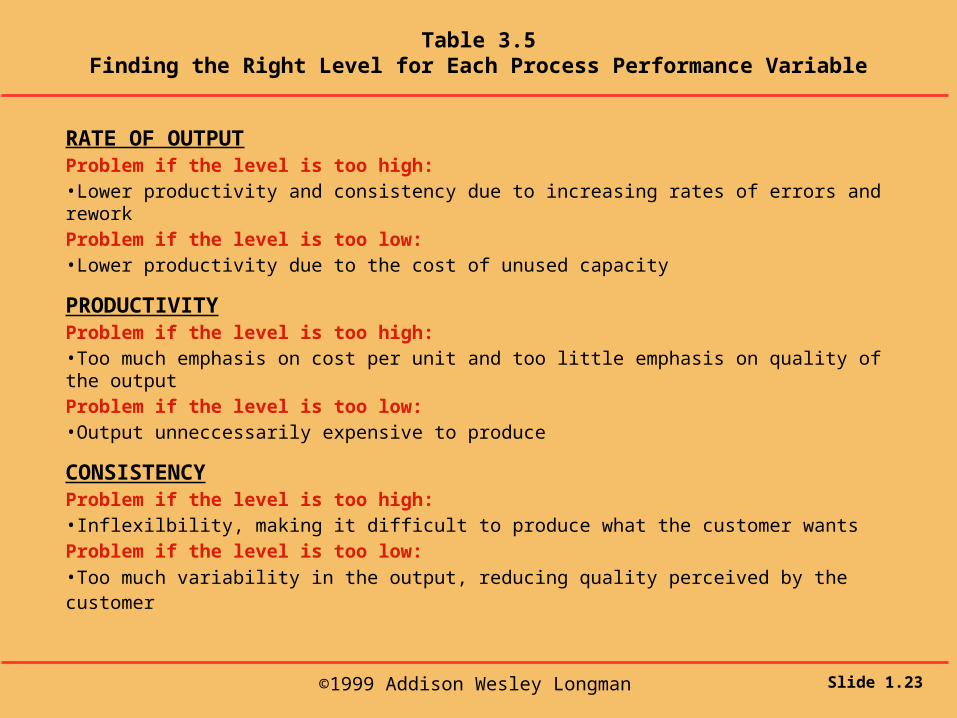
Table 3.5Finding the Right Level for Each Process Performance Variable
RATE OF OUTPUTProblem if the level is too high: •Lower productivity and consistency due to increasing rates of errors and reworkProblem if the level is too low:•Lower productivity due to the cost of unused capacity
PRODUCTIVITYProblem if the level is too high:•Too much emphasis on cost per unit and too little emphasis on quality of the outputProblem if the level is too low: •Output unneccessarily expensive to produce
CONSISTENCYProblem if the level is too high:•Inflexilbility, making it difficult to produce what the customer wantsProblem if the level is too low:
•Too much variability in the output, reducing quality perceived by the customer
©1999 Addison Wesley Longman Slide 1.24
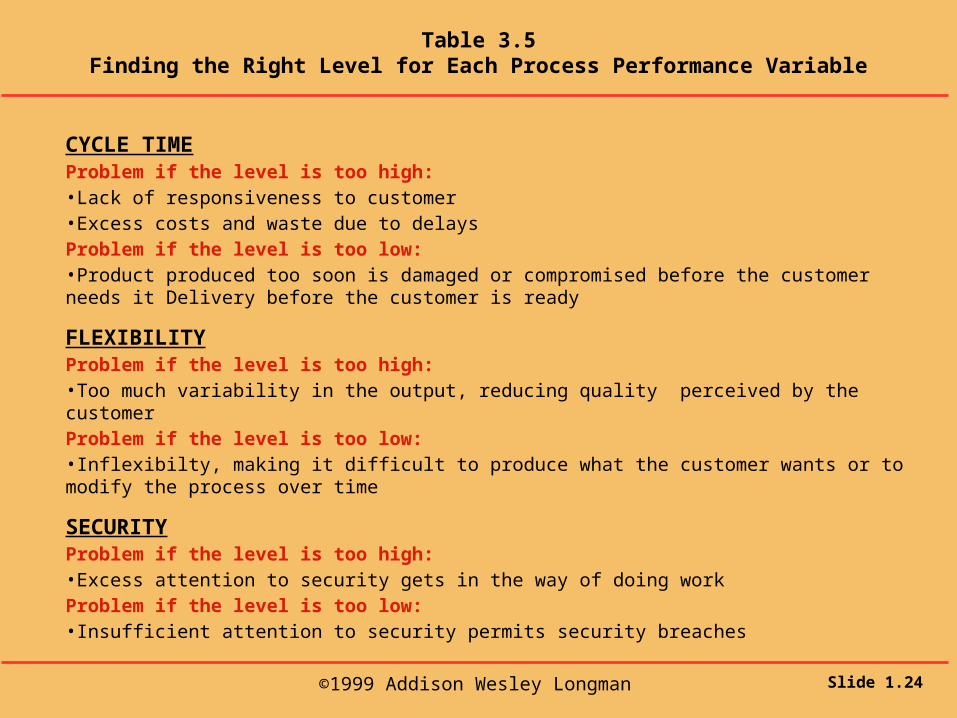
Table 3.5Finding the Right Level for Each Process Performance Variable
CYCLE TIMEProblem if the level is too high:•Lack of responsiveness to customer •Excess costs and waste due to delaysProblem if the level is too low:•Product produced too soon is damaged or compromised before the customer needs it Delivery before the customer is ready
FLEXIBILITYProblem if the level is too high:•Too much variability in the output, reducing quality perceived by the customerProblem if the level is too low: •Inflexibilty, making it difficult to produce what the customer wants or to modify the process over time
SECURITYProblem if the level is too high: •Excess attention to security gets in the way of doing workProblem if the level is too low: •Insufficient attention to security permits security breaches
©1999 Addison Wesley Longman Slide 1.25
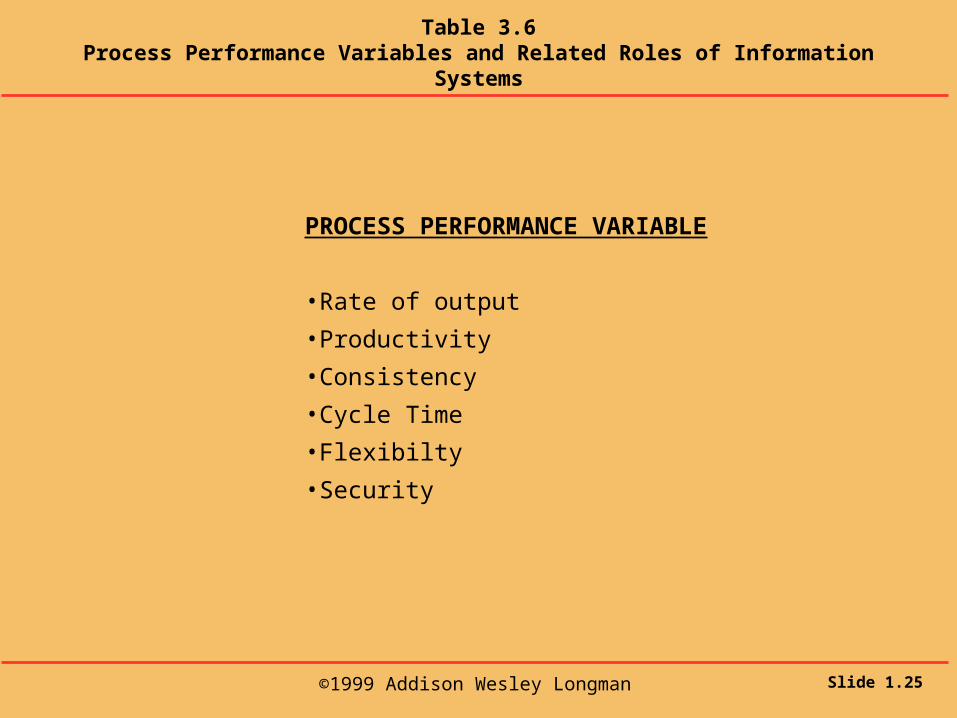
Table 3.6Process Performance Variables and Related Roles of Information Systems
PROCESS PERFORMANCE VARIABLE
•Rate of output
•Productivity
•Consistency
•Cycle Time
•Flexibilty
•Security
©1999 Addison Wesley Longman Slide 1.26
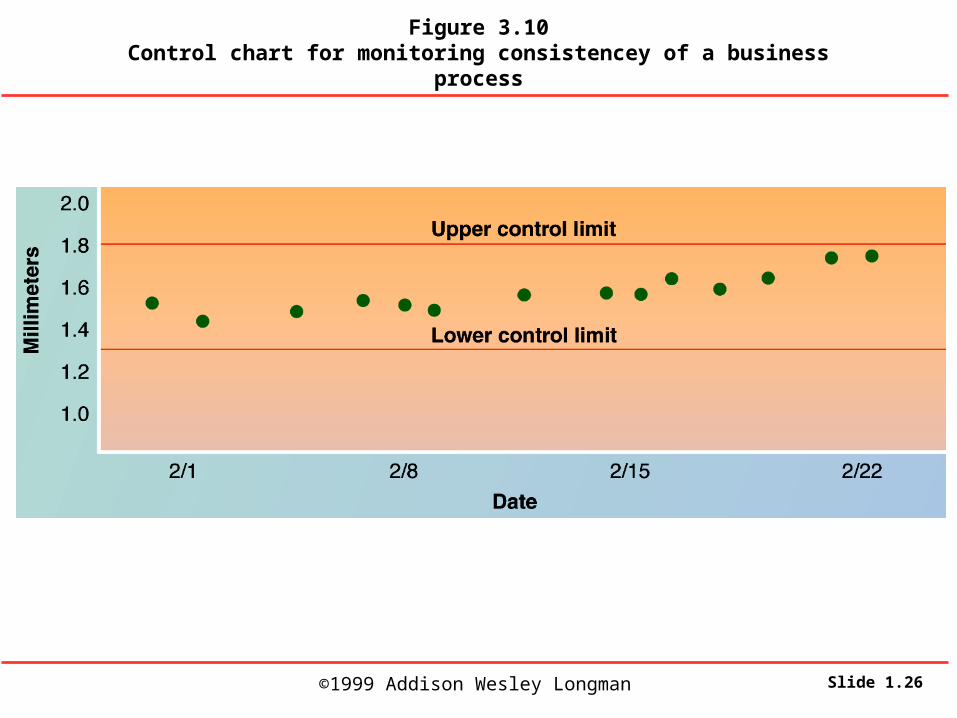
Figure 3.10Control chart for monitoring consistencey of a business process
©1999 Addison Wesley Longman Slide 1.27
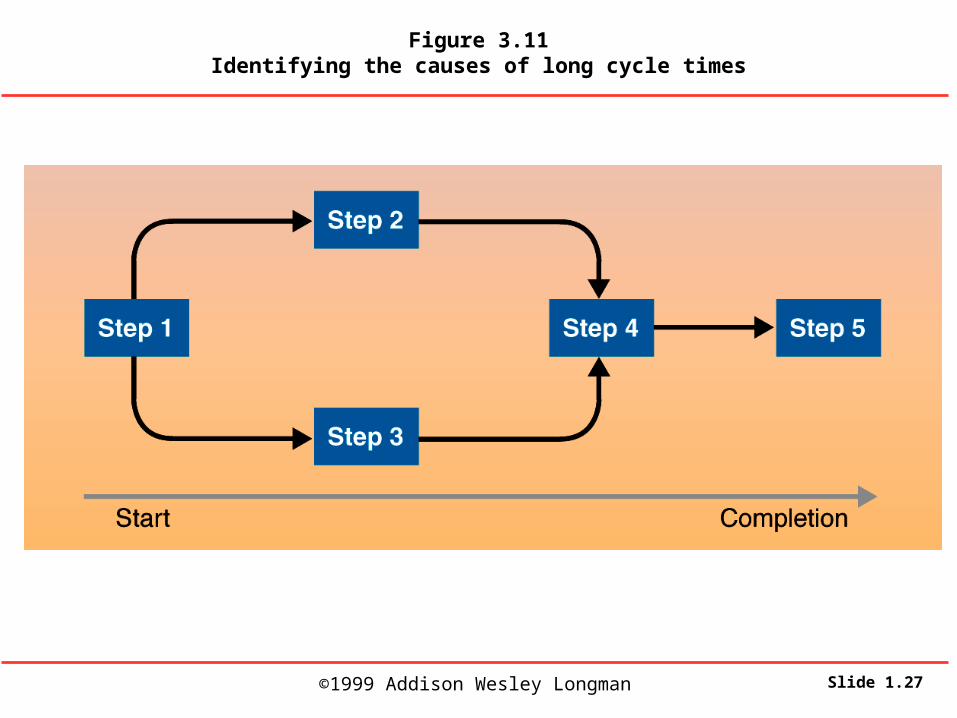
Figure 3.11Identifying the causes of long cycle times
©1999 Addison Wesley Longman Slide 1.28
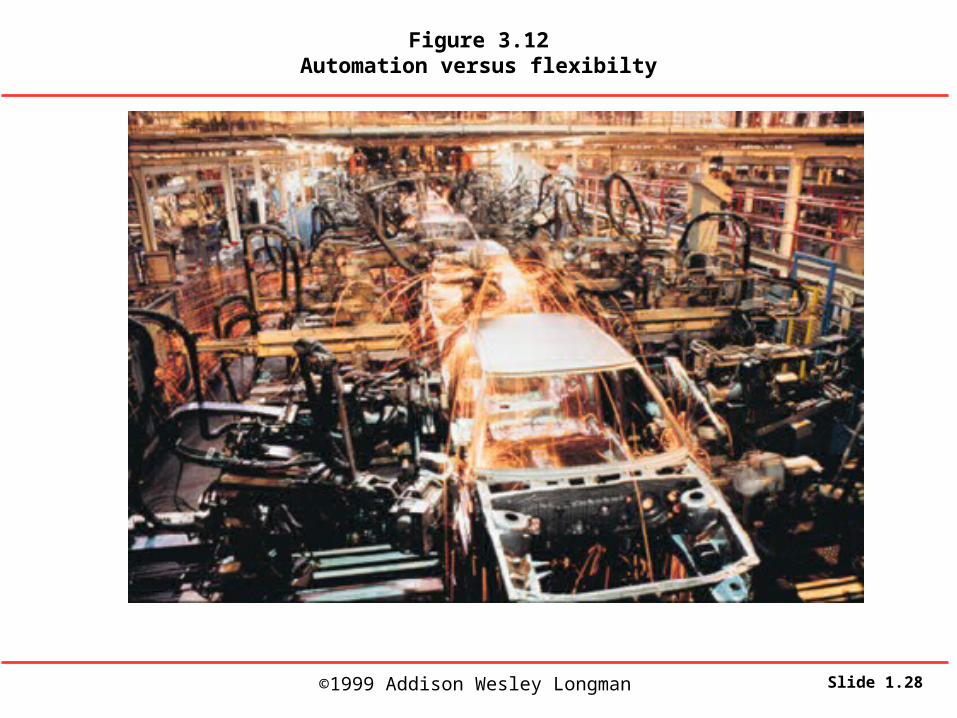
Figure 3.12Automation versus flexibilty

©1999 Addison Wesley Longman Slide 1.29
Figure 3.13Using an eye scanner for controlling access
©1999 Addison Wesley Longman Slide 1.30
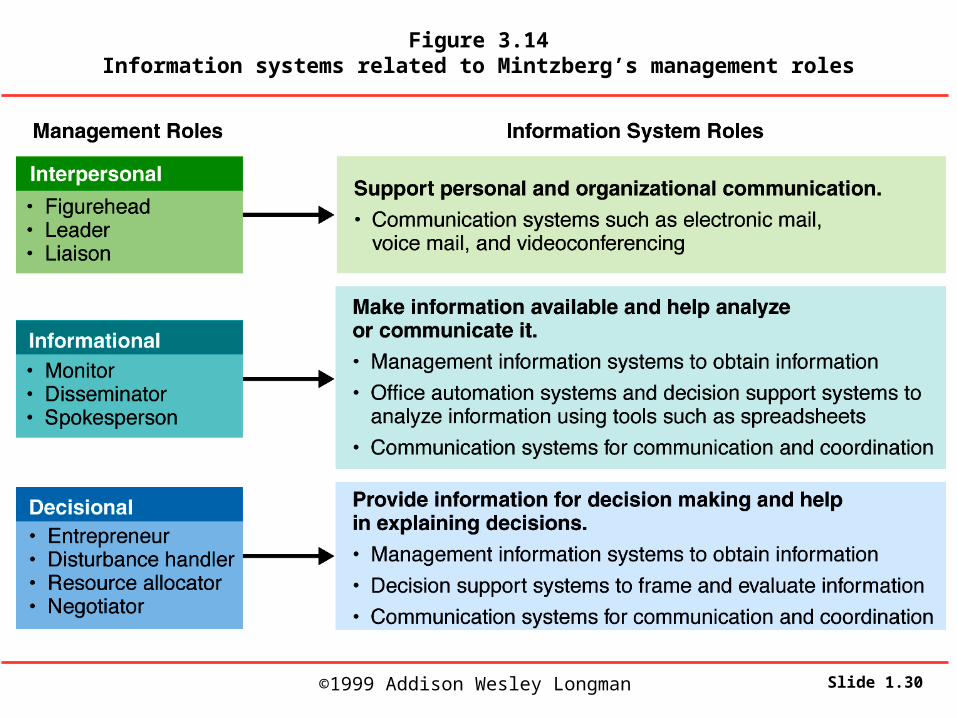
Figure 3.14Information systems related to Mintzberg’s management roles
©1999 Addison Wesley Longman Slide 1.31
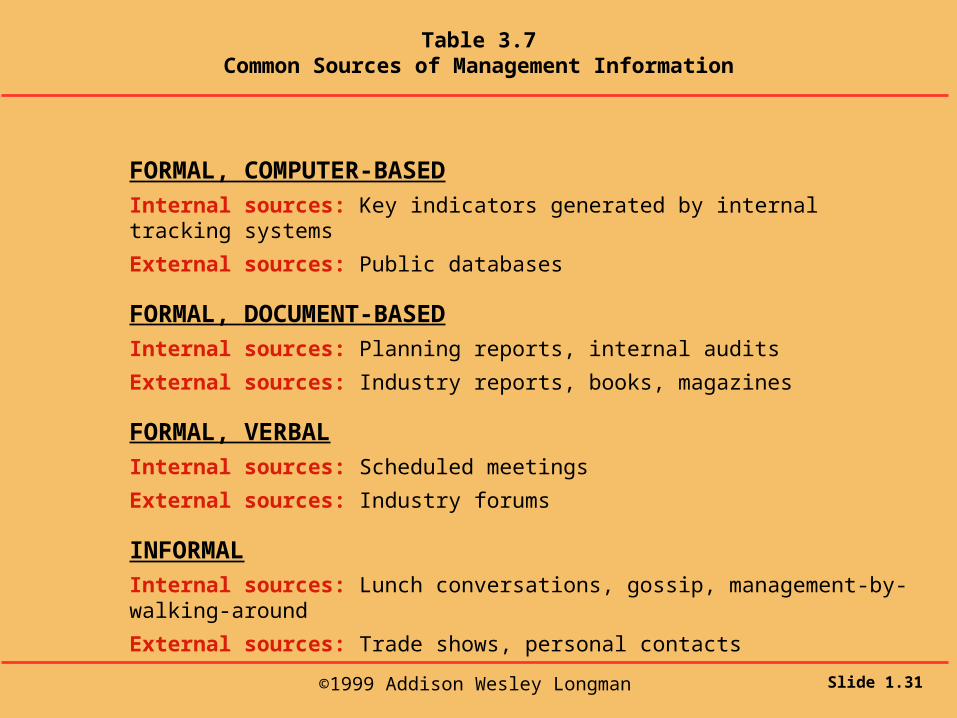
Table 3.7Common Sources of Management Information
FORMAL, COMPUTER-BASED
Internal sources: Key indicators generated by internal tracking systems
External sources: Public databases
FORMAL, DOCUMENT-BASED
Internal sources: Planning reports, internal audits
External sources: Industry reports, books, magazines
FORMAL, VERBAL
Internal sources: Scheduled meetings
External sources: Industry forums
INFORMAL
Internal sources: Lunch conversations, gossip, management-by-walking-around
External sources: Trade shows, personal contacts