Embed Size (px)
Citation preview
1999-2000 Sixth Annual Report
25
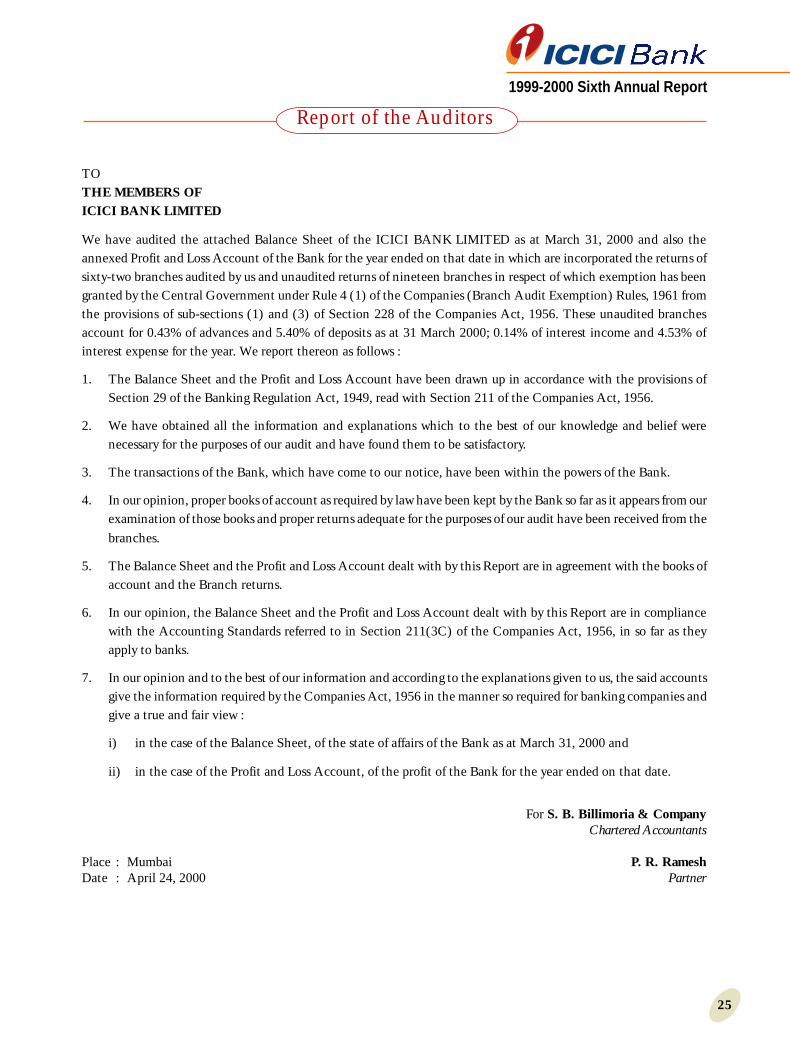
TOTHE MEMBERS OFICICI BANK LIMITED
We have audited the attached Balance Sheet of the ICICI BANK LIMITED as at March 31, 2000 and also theannexed Profit and Loss Account of the Bank for the year ended on that date in which are incorporated the returns ofsixty-two branches audited by us and unaudited returns of nineteen branches in respect of which exemption has beengranted by the Central Government under Rule 4 (1) of the Companies (Branch Audit Exemption) Rules, 1961 fromthe provisions of sub-sections (1) and (3) of Section 228 of the Companies Act, 1956. These unaudited branchesaccount for 0.43% of advances and 5.40% of deposits as at 31 March 2000; 0.14% of interest income and 4.53% ofinterest expense for the year. We report thereon as follows :
1. The Balance Sheet and the Profit and Loss Account have been drawn up in accordance with the provisions ofSection 29 of the Banking Regulation Act, 1949, read with Section 211 of the Companies Act, 1956.
2. We have obtained all the information and explanations which to the best of our knowledge and belief werenecessary for the purposes of our audit and have found them to be satisfactory.
3. The transactions of the Bank, which have come to our notice, have been within the powers of the Bank.
4. In our opinion, proper books of account as required by law have been kept by the Bank so far as it appears from ourexamination of those books and proper returns adequate for the purposes of our audit have been received from thebranches.
5. The Balance Sheet and the Profit and Loss Account dealt with by this Report are in agreement with the books ofaccount and the Branch returns.
6. In our opinion, the Balance Sheet and the Profit and Loss Account dealt with by this Report are in compliancewith the Accounting Standards referred to in Section 211(3C) of the Companies Act, 1956, in so far as theyapply to banks.
7. In our opinion and to the best of our information and according to the explanations given to us, the said accountsgive the information required by the Companies Act, 1956 in the manner so required for banking companies andgive a true and fair view :
i) in the case of the Balance Sheet, of the state of affairs of the Bank as at March 31, 2000 and
ii) in the case of the Profit and Loss Account, of the profit of the Bank for the year ended on that date.
For S. B. Billimoria & CompanyChartered Accountants
Place : Mumbai P. R. RameshDate : April 24, 2000 Partner
Report of the Auditors

1999-2000 Sixth Annual Report
26
(Rupees in thousands)
Schedule As on As on31.3.2000 31.3.1999
CAPITAL AND LIABILITIES
Capital 1 196,81,89 165,00,07
Reserves and surplus 2 952,68,62 143,32,99
Deposits 3 9866,01,80 6072,94,38
Borrowings 4 491,46,84 199,88,84
Other liabilities and provisions 5 565,63,42 400,50,64
Total 12072,62,57 6981,66,92
ASSETS
Cash and balance with Reserve Bank of India 6 721,88,97 465,80,82
Balances with banks and money at call and short notice 7 2693,27,23 1172,44,06
Investments 8 4416,67,79 2861,22,70
Advances 9 3657,34,39 2110,12,00
Fixed assets 10 222,12,22 199,62,83
Other assets 11 361,31,97 172,44,51
Total 12072,62,57 6981,66,92
Contingent liabilities 12 8989,71,84 5013,97,06
Bills for collection 761,43,63 438,46,13
The Schedules referred to above form an integral part of the Balance Sheet
As per our Report of even date For and on behalf of the Board of Directors
For S. B. Billimoria & Company Lalita D. Gupte K. V. KamathChartered Accountants Director Director
R. Rajamani B.V. BhargavaDirector Director
P. R. Ramesh G. Venkatakrishnan Satish C. Jha Somesh R. SathePartner Chief Financial Officer Director Director
Place : Mumbai Bhashyam Seshan Uday M. Chitale H. N. SinorDate : April 24, 2000 Company Secretary Director Managing Director and
Chief Executive Officer
Balance Sheet as on March 31, 2000
1999-2000 Sixth Annual Report
27
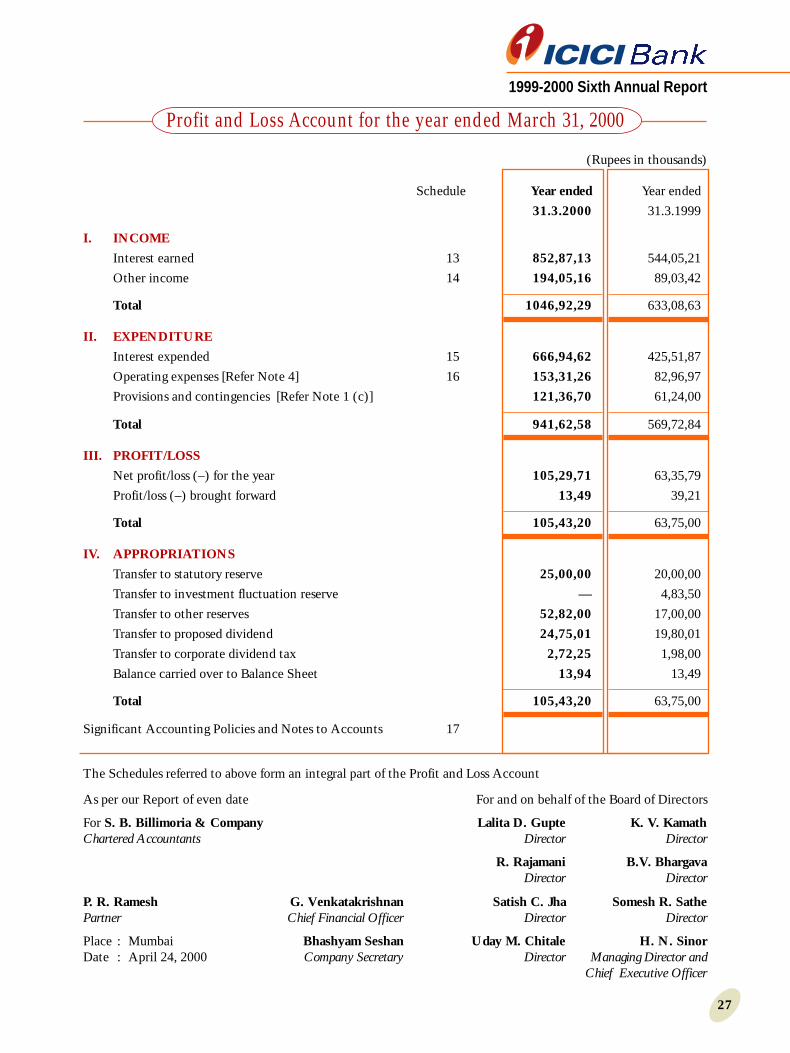
The Schedules referred to above form an integral part of the Profit and Loss Account
As per our Report of even date For and on behalf of the Board of Directors
For S. B. Billimoria & Company Lalita D. Gupte K. V. KamathChartered Accountants Director Director
R. Rajamani B.V. BhargavaDirector Director
P. R. Ramesh G. Venkatakrishnan Satish C. Jha Somesh R. SathePartner Chief Financial Officer Director Director
Place : Mumbai Bhashyam Seshan Uday M. Chitale H. N. SinorDate : April 24, 2000 Company Secretary Director Managing Director and
Chief Executive Officer
(Rupees in thousands)
Schedule Year ended Year ended
31.3.2000 31.3.1999
I. INCOME
Interest earned 13 852,87,13 544,05,21
Other income 14 194,05,16 89,03,42
Total 1046,92,29 633,08,63
II. EXPENDITURE
Interest expended 15 666,94,62 425,51,87
Operating expenses [Refer Note 4] 16 153,31,26 82,96,97
Provisions and contingencies [Refer Note 1 (c)] 121,36,70 61,24,00
Total 941,62,58 569,72,84
III. PROFIT/LOSS
Net profit/loss (–) for the year 105,29,71 63,35,79
Profit/loss (–) brought forward 13,49 39,21
Total 105,43,20 63,75,00
IV. APPROPRIATIONS
Transfer to statutory reserve 25,00,00 20,00,00
Transfer to investment fluctuation reserve — 4,83,50
Transfer to other reserves 52,82,00 17,00,00
Transfer to proposed dividend 24,75,01 19,80,01
Transfer to corporate dividend tax 2,72,25 1,98,00
Balance carried over to Balance Sheet 13,94 13,49
Total 105,43,20 63,75,00
Significant Accounting Policies and Notes to Accounts 17
Profit and Loss Account for the year ended March 31, 2000

1999-2000 Sixth Annual Report
28
(Rupees in thousands)
As on As on31.3.2000 31.3.1999
SCHEDULE 1 - CAPITAL
Authorised Capital30,00,00,000 equity shares of Rs. 10 each 300,00,00 300,00,00
Issued, Subscribed and Paid-up Capital19,68,18,880 (previous year 16,50,00,700) equity shares of Rs. 10 eachincluding 3,18,18,180 underlying equity shares consequent onUSD 175 million ADS issue in March 2000 196,81,89 165,00,07
Less : Calls unpaid — —
Add : Forfeited shares — —
Total 196,81,89 165,00,07
SCHEDULE 2 - RESERVES AND SURPLUS
I. Statutory ReservesOpening balance 78,86,00 58,86,00Additions during the year 25,00,00 20,00,00Deductions during the year — —
II. Capital ReservesOpening balance — —Additions during the year — —Deductions during the year — —
III. Share PremiumOpening balance 37,50,00 37,50,00Additions during the year 731,53,18 —Deductions during the year — —
IV. Revenue and other ReservesOpening balance 26,83,50 5,00,00Additions during the year * 52,82,00 21,83,50Deductions during the year — —
V. Balance in Profit and Loss Account 13,94 13,49
Total 952,68,62 143,32,99* Includes Investment Fluctuation Reserve Rs. Nil
(previous year Rs. 483.50 lakhs)
SCHEDULE 3 - DEPOSITS
A. I. Demand Depositsi) from banks 85,45,31 7,39,90ii) from others 1502,02,30 569,22,13
II. Savings Bank Deposits 533,25,80 227,11,90III. Term Deposits
i) from banks 1553,57,30 1314,15,30ii) from others 6191,71,09 3955,05,15
Total 9866,01,80 6072,94,38
B. I. Deposits of branches in India 9866,01,80 6072,94,38II. Deposits of branches outside India — —
Total 9866,01,80 6072,94,38
Schedules forming part of the Balance Sheet

1999-2000 Sixth Annual Report
29
(Rupees in thousands)
As on As on31.3.2000 31.3.1999
SCHEDULE 4 - BORROWINGS
I. Borrowings in Indiai) Reserve Bank of India 218,66,55 148,48,00ii) other banks 192,18,48 41,77,29iii) other institutions and agencies 80,61,81 9,63,55
II. Borrowings outside India — —
Total 491,46,84 199,88,84Secured borrowings in I and II above Rs. ‘Nil’
SCHEDULE 5 - OTHER LIABILITIES AND PROVISIONS
I. Bills payable 142,20,09 112,18,86II. Inter-office adjustments (net) — —III. Interest accrued 33,52,39 23,49,11IV. Unsecured Redeemable Debentures/Bonds 168,00,00 168,00,00
(Subordinated for Tier II Capital)V. Others (including provisions) * 221,90,94 96,82,67
Total 565,63,42 400,50,64
* Includes proposed dividend Rs. 2475.01 lakhs [Previous year Rs. 1980.01 lakhs]
SCHEDULE 6 - CASH AND BALANCES WITHRESERVE BANK OF INDIA
I. Cash in hand (including foreign currency notes) 31,45,38 9,26,40II. Balances with Reserve Bank of India
i) in current accounts 690,43,59 456,54,42ii) in other accounts — —
Total 721,88,97 465,80,82
SCHEDULE 7 - BALANCES WITH BANKS ANDMONEY AT CALL AND SHORT NOTICE
I. In Indiai) Balances with banks
a) in current accounts 19,64,02 43,80,60b) in other deposit accounts 298,35,50 198,16,50
ii) Money at call and short noticea) with banks 688,15,00 197,01,51b) with other institutions 125,40,00 —
Total 1131,54,52 438,98,61
II. Outside Indiai) in current accounts 17,47,87 20,35,23ii) in other deposit accounts — —iii) Money at call and short notice 1544,24,84 713,10,22
Total 1561,72,71 733,45,45
Grand Total (I + II) 2693,27,23 1172,44,06
Schedules forming part of the Balance Sheet

1999-2000 Sixth Annual Report
30
(Rupees in thousands)
As on As on31.3.2000 31.3.1999
SCHEDULE 8 - INVESTMENTS
I. Investments in India ini) Government securities 2814,93,99 1527,36,16ii) other approved securities — —iii) shares 160,94,54 138,00,30iv) debentures and bonds 1137,21,86 666,61,39v) subsidiaries and/or joint ventures — —vi) others (CPs, Mutual Fund Units, etc.) 303,57,40 529,24,85
Total 4416,67,79 2861,22,70
II. Investments outside India — —
Grand Total 4416,67,79 2861,22,70
SCHEDULE 9 - ADVANCES
A. i) Bills purchased and discounted 701,29,45 454,95,91ii) Cash credits, overdrafts and loans repayable on demand 2577,67,22 1383,50,50iii) Term loans 378,37,72 271,65,59
Total 3657,34,39 2110,12,00
B. i) Secured by tangible assets 2806,06,11 1825,35,08ii) Covered by Bank/Government Guarantees 98,24,27 57,61,46iii) Unsecured 753,04,01 227,15,46
Total 3657,34,39 2110,12,00
C. I. Advances in Indiai) Priority Sector 497,36,84 477,81,55ii) Public Sector 104,46,84 4,28,10iii) Banks 15,46,25 —iv) Others 3040,04,46 1628,02,35
Total 3657,34,39 2110,12,00
II. Advances outside Indiai) Due from banks — —ii) Due from others
a) Bills purchased and discounted — —b) Syndicated loans — —c) Others — —
Total — —
Grand Total (C. I + II) 3657,34,39 2110,12,00
Schedules forming part of the Balance Sheet

1999-2000 Sixth Annual Report
31
(Rupees in thousands)
As on As on31.3.2000 31.3.1999
SCHEDULE 10 - FIXED ASSETS
I. PremisesAt cost as on 31st March of preceding year 130,21,20 106,62,05Additions during the year 14,52,86 23,59,15Deductions during the year — —Depreciation to date (16,73,88) (8,60,67)
II. Other fixed assets (including furniture and fixtures)At cost as on 31st March of preceding year 70,31,78 49,79,77Additions during the year 42,16,40 20,85,58Deductions during the year (24,40) (33,57)Depreciation to date (43,46,77) (28,96,93)
III. Assets on leaseAt cost as on 31st March of preceding year * 61,02,81 62,34,86Additions during the year — 3,48,75Deductions during the year (2,86,46) (4,80,80)Depreciation to date (10,80,19) (8,63,99)Accumulated lease adjustment and provisions (22,01,13) (15,71,37)
Total 222,12,22 199,62,83*Includes repossessed Leased Asset Rs. 960.00 lakhs
(Previous year Rs. Nil)
SCHEDULE 11 - OTHER ASSETS
I. Inter-office adjustments (net) 4,85,98 1,01II. Interest accrued 114,73,93 66,15,04III. Tax paid in advance/tax deducted at source (net) 36,75,84 2,23,50IV. Stationery and stamps 9,80 2,26V. Non-banking assets acquired in satisfaction of claims — —VI. Others * 204,86,42 104,02,70
Total 361,31,97 172,44,51* Includes advances for Capital Assets Rs. 517.95 lakhs
(previous year Rs. 908.82 lakhs);Unamortised ADS issue expenses Rs. 1960.00 lakhs(Previous year Rs. Nil)
SCHEDULE 12 - CONTINGENT LIABILITIES
I. Claims against the Bank not acknowledged as debts 9,89 28,15II. Liability for partly paid investments — 3,75,00III. Liability on account of outstanding forward exchange contracts 7354,97,15 3966,67,84IV. Guarantees given on behalf of constituents
a) in India 756,43,67 462,98,21b) outside India — —
V. Acceptances, endorsements and other obligations 848,96,31 558,65,92VI. Other items for which the Bank is contingently liable 29,24,82 21,61,94
Total 8989,71,84 5013,97,06
Schedules forming part of the Balance Sheet

1999-2000 Sixth Annual Report
32
(Rupees in thousands)
Year ended Year ended31.3.2000 31.3.1999
SCHEDULE 13 - INTEREST EARNED
I. Interest/discount on advances/bills 347,91,02 225,95,40II. Income on investments 409,70,97 208,49,51III. Interest on balances with Reserve Bank of India
and other inter-bank funds 94,61,62 109,41,10IV. Others 63,52 19,20
Total 852,87,13 544,05,21
SCHEDULE 14 - OTHER INCOME
I. Commission, exchange and brokerage 67,07,50 37,41,15II. Profit on sale of investments 101,13,93 12,43,69
Less : Loss on sale of investments — —III. Profit on revaluation of investments — —
Less : Loss on revaluation of investments — —IV. Profit on sale of land, buildings and other assets (13,29) (9,53)V. Profit on exchange transactions 22,38,69 34,11,59
Less : Loss on exchange transactions — —VI. Income earned by way of dividends, etc., from subsidiary
companies and/or joint ventures abroad/in India — —VII. Miscellaneous Income * 3,58,33 5,16,52
Total 194,05,16 89,03,42* Includes Rs. 463.30 lakhs (Previous year Rs. 514.97 lakhs) being
the amount of lease rental income after adjusting the net leaseequalisation of Rs. 105.35 lakhs (previous year Rs. 476.97 lakhs)
SCHEDULE 15 - INTEREST EXPENDED
I. Interest on deposits 580,50,19 371,87,45II. Interest on Reserve Bank of India/inter-bank borrowings 23,55,35 20,39,76III. Others 62,89,08 33,24,66
Total 666,94,62 425,51,87
SCHEDULE 16 - OPERATING EXPENSES
I. Payments to and provisions for employees 36,37,22 18,18,81II. Rent, taxes and lighting 18,01,35 11,37,00III. Printing and stationery 8,23,24 3,24,02IV. Advertisement and publicity 3,87,62 3,39,01V. Depreciation on Bank’s property 24,79,25 17,52,81VI. Directors’ fees, allowances and expenses 7,17 5,47VII. Auditors’ fees and expenses (including branch auditors) 14,45 12,81VIII. Law charges 49,54 95,55IX. Postages, telegrams, telephones, etc. 6,87,47 4,32,65X. Repairs and maintenance 10,08,93 7,57,13XI. Insurance 3,69,28 2,24,82XII. Other expenditure * 40,65,74 13,96,89
Total 153,31,26 82,96,97
* Includes Rs. 989.86 lakhs amortisation of ADS issue expenses(Refer Note 4)
Schedules forming part of the Profit and Loss Account

1999-2000 Sixth Annual Report
33
SCHEDULE 17A. SIGNIFICANT ACCOUNTING POLICIES
1. Investments :a) All investments are categorised as per Reserve Bank of India (RBI) guidelines and classified as ‘current’.
They are valued at cost and/or market/fair value as at March 31, 2000 in accordance with guidelinesissued by RBI.
b) Depreciation/appreciation for each category is aggregated. Net appreciation, if any, for each category isignored.
c) Costs such as brokerage, commission, etc., pertaining to fixed income securities, paid at the time ofacquisition, are charged to revenue.
d) Broken period interest on debt instruments is treated as a revenue item.2. Advances, Income Recognition and Provisioning :
a) All credit exposures are classified as per the RBI guidelines into performing and non-performing assets.Further, non-performing assets are classified into sub-standard, doubtful and loss assets for incomerecognition and provisioning.
b) Interest income is recognised in the Profit and Loss Account as it accrues except in the case of non-performing assets where it is credited to Interest Suspense Account and not reckoned as income in theaccounts.
c) Lease income is calculated by applying the interest rate implicit in the lease to the net investmentoutstanding on the lease over the primary lease period, as per the Guidance Note on Accounting forLeases (Revised) issued by the Institute of Chartered Accountants of India.
d) Provision for non-performing assets is made in determined in accordance with the RBI guidelines.3. Fixed assets and depreciation :
a) Premises and other fixed assets are accounted for at historical cost. Fixed assets are depreciated usingthe ‘written-down value’ method except leased assets which are depreciated using the ‘straight line’method.
b) Depreciation on improvements (including fixtures/fittings) in leased premises is provided over the primarylease period. Depreciation on premises and other fixed assets is provided at the rates specified in ScheduleXIV to the Companies Act, 1956.
c) Depreciation on additions is provided on a pro rata basis for completed months. Additions to fixedassets after the 15th day of a month are not depreciated for that month.
4. Forex transactions :a) Monetary assets and liabilities are translated at closing exchange rates notified by the Foreign Exchange
Dealers’ Association of India (FEDAI).b) Unrealised gains/losses on outstanding forward contracts as at the end of the year are taken as current
income/expenses in accordance with the RBI/FEDAI guidelines. Premium/discount on hedge swaps isrecognised as interest income/expenses and is amortised over the period of the transactions. ContingentLiabilities at the balance sheet date on account of foreign exchange contracts are reported at contractedrates.
5. Staff benefits :a) Contributions to Gratuity/Provident/Pension funds for staff are being accounted on accrual basis.b) Leave encashment liability is provided for as per the eligibility criteria of Bank’s rules.
6. Share issue expensesExpenses on issue of equity shares consequent on USD 175 million ADS Issue are amortised over a period ofthree years.
B. NOTES TO ACCOUNTS1. Disclosure in terms of RBI circulars :
a) Capital adequacy ratio is 19.64 per cent (previous year 11.06 per cent).b) Percentage of net non-performing assets (funded) to net advances is 1.53 per cent (previous year 2.88 per
cent).Percentage of net non-performing assets (funded and including credit-like instruments) to net advances(including credit-like instruments) is 1.14 per cent (Previous year 1.80 per cent).
c) ‘Provisions and Contingencies’ as charged to the Profit and Loss Account for the period is in respect of :(i) income tax Rs. 2,660.40 lakhs (previous year Rs. 3,000.00 lakhs);(ii) interest tax Rs. 600.40 lakhs (previous year Rs. 375.00 lakhs);(iii) wealth tax Rs. 42.20 lakhs (previous year Rs. 3.00 lakhs);(iv) additional depreciation on investments Rs. 1283.70 lakhs (previous year write back of excess
depreciation on investments Rs. 483.50 lakhs);
Significant Accounting Policies and Notes to Accounts

1999-2000 Sixth Annual Report
34
(v) non-performing assets Rs. 7,550.00 lakhs (previous year Rs. 3,220.00 lakhs); and(vi) others Rs. Nil (previous year Rs. 9.50 lakhs).
d) Bank has not raised any subordinated debt during the year (previous year Rs. 16,800.00 lakhs).e) Business ratios :
For the year For the yearended ended
31.3.2000 31.3.1999
(i) Capital Adequacy Ratio Tier I Capital (per cent) 17.42 7.32(ii) Capital Adequacy Ratio Tier II Capital (per cent) 2.22 3.74(iii) Interest income to working funds (per cent) 10.59 11.22(iv) Non-interest income to working funds (per cent) 2.41 1.84(v) Operating profit to working funds (per cent) 2.81 2.57(vi) Return on assets (per cent) 0.87 0.91(vii) Business (average deposits plus average advances)
per employee (Rupees in lakhs) 5,94.99 5,13.91(viii) Profit per employee (Rupees in lakhs) 7.83 7.11
f) Investments :(Rupees in lakhs)
As on As on31.3.2000 31.3.1999
Gross value of Investments in India 44,43,95.43 28,75,66.64Less : Provision for depreciation 27,27.64 14,43.94Net value of investments in India 44,16,67.79 28,61,22.70
g) Movement of Gross NPA (Funded)During the year is givenbelow :
Rs. in lakhs
As on 31st March, 1999 101,45.02Add : Additions during the period 67,71.68
169,16.70Less : Reductions during the period 74,55.72As on 31st March, 2000 94,60.98
Net NPA as on 31st March, 2000 is Rs. 55,92.00 lakhs (Previous year Rs. 60,82.00 lakhs)
h) Maturity pattern of rupee denominated assets and liabilities (Rupees in lakhs)
Maturity Loans and Investment Deposits BorrowingsBuckets Advances Securities
1 to 14 days 390,81 303,98 1314,78 15,9615 to 28 days 121,92 652,89 895,64 Nil29 days to 3 months 748,33 180,84 1851,57 299,293 to 6 months 104,03 296,79 892,04 Nil6 months to 1 year 56,29 125,84 781,28 Nil1 to 3 years 1824,59 1388,37 3648,86 Nil3 to 5 years 106,72 706,60 25,37 NilAbove 5 years 76,04 761,37 18,30 Nil
Total 3428,73 4416,68 9427,84 315,25
Significant Accounting Policies and Notes to Accounts

1999-2000 Sixth Annual Report
35
i) Maturity pattern of Forex denominated assets and liabilities(Rupees in lakhs)
Maturity Loan and Balances with Deposits Borrowings Other OtherBuckets Advances banks and assets liabilities
money at calland shoft notice
1 to 14 days 19,75 1136,35 82,18 111,66 66,57 23,5715 to 28 days 27,29 125,41 62,85 21,81 Nil Nil29 days to 3 months 42,68 104,87 46,58 20,94 Nil Nil3 to 6 months 57,56 182,11 48,26 8,72 Nil Nil6 months to 1 year 58,27 100,22 124,76 13,09 Nil Nil1 to 3 years 21,88 Nil 73,55 Nil Nil Nil3 to 5 years 1,18 Nil Nil Nil Nil NilAbove 5 years Nil Nil Nil Nil Nil Nil
Total 228,61 1648,96 438,18 176,22 66,57 23,57
Note :• In compiling the information of maturity pattern (refer (h) and (i) above), certain estimates and assumptions
have been made by the management which have been relied upon by the Auditors.• Assets and liabilities in foreign currency exclude off-balance sheet assets and liabilities.
j) Lending to sensitive sectors(Rupees in lakhs)
Advances to capital market sector 48,16.00Advances to real estate sector 33,44.00Advances to commodities sector 46,57.00
Total 128,17.00
2. Improvements (including fixtures/fittings) to leased premises have been depreciated over the primary leaseperiod instead of at rates specified in Schedule XIV to the Companies Act, 1956. As a result of this, thedepreciation charge to the Profit and Loss Account during the year is higher by Rs. 336.13 lakhs.
3. At the Extraordinary General Meeting on 21 February, 2000, the shareholders approved an Employee StockOption Scheme. Under the Scheme, upto 5 per cent of the issued equity shares, including the ADS issue,can be allocated to Employee Stock Options. In terms of the Scheme, as at March 31, 2000, option on17,13,000 shares has been granted to eligible employees of both, the company and ICICI Limited, for issueto the employees on exercising the option.
4. Expenditure on USD 175 million ADS issue in March 2000 is Rs. 29,49.86 lakhs of which Rs. 9,89.86 lakhshas been charged to the Profit and Loss Account for the year (Schedule 16 under “Other expenditure”). Thebalance amount of Rs. 19,60.00 lakhs is included in Schedule 11 under “Others” to be amortised over thenext two years.
5. Previous year’s figures are regrouped and reclassified, where appropriate.
Significant Accounting Policies and Notes to Accounts
Signatures to Schedules 1 to 17
For and on behalf of the Board of Directors
Lalita D. Gupte K. V. KamathDirector Director
R. Rajamani B.V. BhargavaDirector Director
G. Venkatakrishnan Satish C. Jha Somesh R. SatheChief Financial Officer Director Director
Place : Mumbai Bhashyam Seshan Uday M. Chitale H. N. SinorDate : April 24 , 2000 Company Secretary Director Managing Director and
Chief Executive Officer
1999-2000 Sixth Annual Report
36
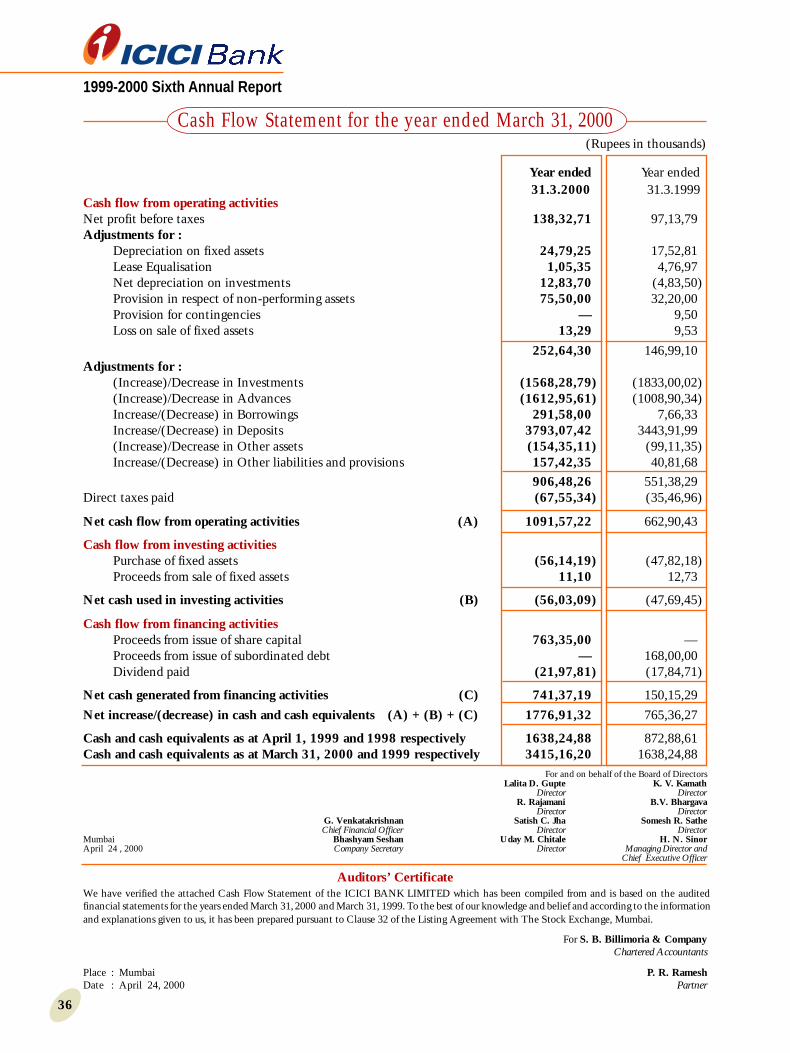
Cash flow from operating activitiesNet profit before taxes 138,32,71 97,13,79Adjustments for :
Depreciation on fixed assets 24,79,25 17,52,81Lease Equalisation 1,05,35 4,76,97Net depreciation on investments 12,83,70 (4,83,50)Provision in respect of non-performing assets 75,50,00 32,20,00Provision for contingencies — 9,50Loss on sale of fixed assets 13,29 9,53
252,64,30 146,99,10Adjustments for :
(Increase)/Decrease in Investments (1568,28,79) (1833,00,02)(Increase)/Decrease in Advances (1612,95,61) (1008,90,34)Increase/(Decrease) in Borrowings 291,58,00 7,66,33Increase/(Decrease) in Deposits 3793,07,42 3443,91,99(Increase)/Decrease in Other assets (154,35,11) (99,11,35)Increase/(Decrease) in Other liabilities and provisions 157,42,35 40,81,68
906,48,26 551,38,29Direct taxes paid (67,55,34) (35,46,96)
Net cash flow from operating activities (A) 1091,57,22 662,90,43
Cash flow from investing activitiesPurchase of fixed assets (56,14,19) (47,82,18)Proceeds from sale of fixed assets 11,10 12,73
Net cash used in investing activities (B) (56,03,09) (47,69,45)
Cash flow from financing activitiesProceeds from issue of share capital 763,35,00 —Proceeds from issue of subordinated debt — 168,00,00Dividend paid (21,97,81) (17,84,71)
Net cash generated from financing activities (C) 741,37,19 150,15,29
Net increase/(decrease) in cash and cash equivalents (A) + (B) + (C) 1776,91,32 765,36,27
Cash and cash equivalents as at April 1, 1999 and 1998 respectively 1638,24,88 872,88,61Cash and cash equivalents as at March 31, 2000 and 1999 respectively 3415,16,20 1638,24,88
(Rupees in thousands)
Year ended Year ended31.3.2000 31.3.1999
Auditors’ CertificateWe have verified the attached Cash Flow Statement of the ICICI BANK LIMITED which has been compiled from and is based on the auditedfinancial statements for the years ended March 31, 2000 and March 31, 1999. To the best of our knowledge and belief and according to the informationand explanations given to us, it has been prepared pursuant to Clause 32 of the Listing Agreement with The Stock Exchange, Mumbai.
For S. B. Billimoria & CompanyChartered Accountants
Place : Mumbai P. R. RameshDate : April 24, 2000 Partner
Cash Flow Statement for the year ended March 31, 2000
For and on behalf of the Board of DirectorsLalita D. Gupte K. V. Kamath
Director DirectorR. Rajamani B.V. Bhargava
Director DirectorG. Venkatakrishnan Satish C. Jha Somesh R. SatheChief Financial Officer Director Director
Mumbai Bhashyam Seshan Uday M. Chitale H. N. SinorApril 24 , 2000 Company Secretary Director Managing Director and
Chief Executive Officer
1999-2000 Sixth Annual Report
37
Independent Auditors’ Report
To the board of directors and stockholders of ICICI Bank Limited
We have audited the accompanying balance sheets of ICICI Bank Limited as of March 31, 2000 and March 31, 1999
and the related statements of income, stockholders’ equity and cash flows for each of the years in the three-year period
ended March 31, 2000. These financial statements are the responsibility of the Bank’s management. Our responsibility
is to express an opinion on these financial statements based on our audits.
We conducted our audits in accordance with auditing standards generally accepted in the United States. Those standards
require that we plan and perform the audit to obtain reasonable assurance about whether the financial statements are
free of material misstatement. An audit includes examining, on a test basis, evidence supporting the amounts and
disclosures in the financial statements. An audit also includes assessing the accounting principles used and significant
estimates made by management, as well as evaluating the overall financial statement presentation. We believe that
our audits provide a reasonable basis for our opinion.
In our opinion, the financial statements referred to above present fairly, in all material respects, the financial position
of ICICI Bank Limited as of March 31, 2000 and 1999, and the result of the operations and its cash flows for each of
the years in the three-year period ended March 31, 2000, in conformity with accounting principles generally accepted
in United States.
The United States dollar amounts are presented in the accompanying financial statements solely for the convenience
of the readers and are arithmetically correct on the basis disclosed in note 1.1.3.
KPMG
Mumbai, IndiaApril 24, 2000

1999-2000 Sixth Annual Report
38
(in millions)At March 31,
1999 2000 2000Rs. Rs. USD
ASSETS
Cash and cash equivalents 19,928 36,326 832
Trading account assets 15,822 28,228 647
Securities, available for sale 3,963 4,709 108
Loans, net 27,597 47,016 1,077
Acceptances 5,587 8,490 194
Property and equipment 1,761 2,097 48
Other assets 1,607 3,550 81
Total assets 76,265 130,416 2,987
LIABILITIES
Interest bearing deposits 54,963 82,785 1,896
Non-interest bearing deposits 5,766 15,875 364
Total deposits 60,729 98,660 2,260
Trading account liabilities 418 1,922 44
Acceptances 5,587 8,490 194
Long-term debt 1,764 2,476 57
Other liabilities 4,937 7,481 171
Total liabilities 73,435 119,029 2,726
STOCKHOLDERS’ EQUITY
Common stock 1,650 1,968 45
Additional paid in capital 375 7,435 171
Deferred Compensation – Employee Stock Option Plan – (39) (1)
Retained earnings 756 1,940 44
Accumulated comprehensive income 49 83 2
Total stockholders’ equity 2,830 11,387 261
Total liabilities and stockholders’ equity 76,265 130,416 2,987
See accompanying notes to the financial statements
Balance Sheets as at March 31, 1999 and 2000Prepared in accordance with US GAAP

1999-2000 Sixth Annual Report
39
Statements of Income for the years ended March 31, 1998, 1999 and 2000
(in millions, except per share data)Year ended March 31,
1998 1999 2000 2000Rs. Rs. Rs. USD
INTEREST REVENUE
Loans, including fees 1,499 2,707 4,437 102Securities, including dividends 148 305 684 16Trading account assets, including dividends 865 2,247 3,073 70Other 67 131 240 5
Total interest revenue 2,579 5,390 8,434 193
INTEREST EXPENSE
Deposits 1,618 3,707 5,789 133Long term debt 16 155 244 6Trading account liabilities 216 256 542 12Other 4 126 81 2
Total interest expense 1,854 4,244 6,656 153
NET INTEREST REVENUE 725 1,146 1,778 40
Provision for credit losses (360) (540) (427) (10)Net interest revenue after
provision for credit losses 365 606 1,351 30
NON-INTEREST REVENUE, NETFees and commissions 240 370 607 14Trading account revenue 147 134 857 20Securities transactions 32 21 75 2Foreign exchange transactions 171 341 220 5Other 1 – — —
Net revenue 956 1,472 3,110 71
NON-INTEREST EXPENSESalaries 116 172 257 6Employee benefits 21 32 59 1
Total employee expense 137 204 316 7
Premise and equipment expense 162 232 340 8Administration and other expense 255 363 673 15Total non-interest expense 554 799 1,329 30Income before taxes 402 673 1,781 41Income tax expense 104 170 379 9
Net income 298 503 1,402 32
EARNINGS PER SHAREBasic and diluted 1.84 3.05 8.49 0.19Weighted average number of common
shares (in millions) used for computingearnings per share– Basic 162.08 165.00 165.09 165.09– Diluted 162.08 165.00 165.11 165.11
See accompanying notes to the financial statements
Prepared in accordance with US GAAP
1999-2000 Sixth Annual Report
40
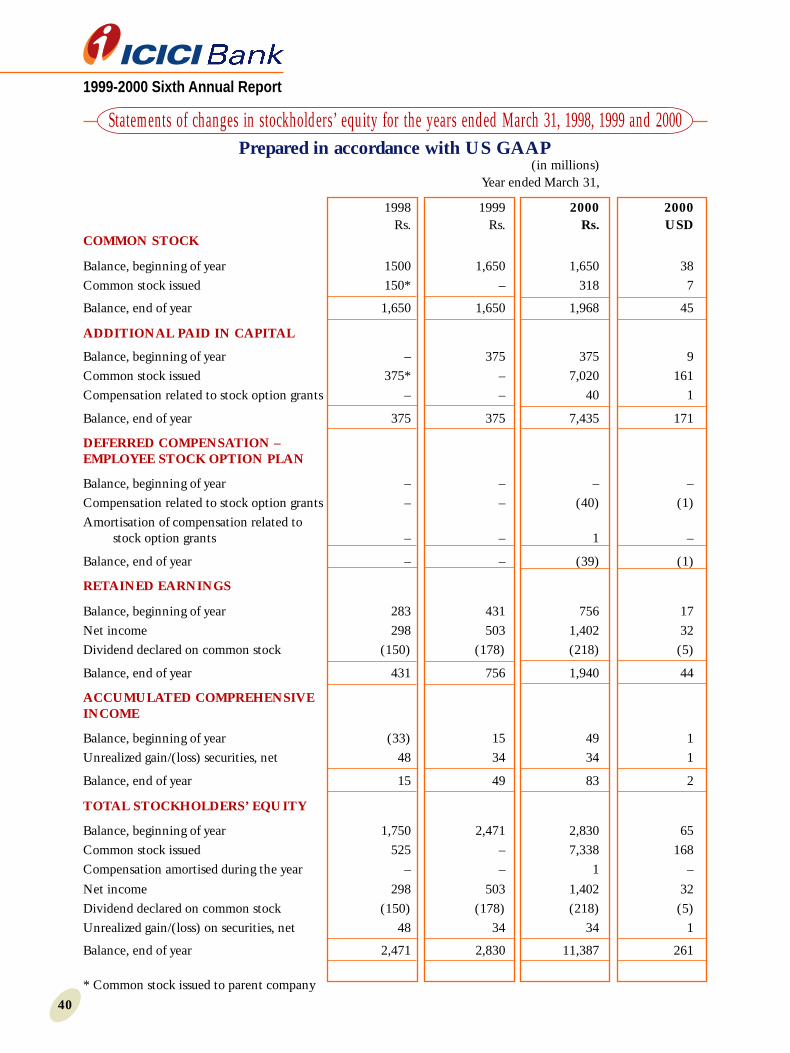
Statements of changes in stockholders’ equity for the years ended March 31, 1998, 1999 and 2000
(in millions)Year ended March 31,
1998 1999 2000 2000Rs. Rs. Rs. USD
COMMON STOCK
Balance, beginning of year 1500 1,650 1,650 38Common stock issued 150* – 318 7
Balance, end of year 1,650 1,650 1,968 45
ADDITIONAL PAID IN CAPITAL
Balance, beginning of year – 375 375 9Common stock issued 375* – 7,020 161Compensation related to stock option grants – – 40 1
Balance, end of year 375 375 7,435 171
DEFERRED COMPENSATION –EMPLOYEE STOCK OPTION PLAN
Balance, beginning of year – – – –Compensation related to stock option grants – – (40) (1)Amortisation of compensation related to
stock option grants – – 1 –
Balance, end of year – – (39) (1)
RETAINED EARNINGS
Balance, beginning of year 283 431 756 17Net income 298 503 1,402 32Dividend declared on common stock (150) (178) (218) (5)
Balance, end of year 431 756 1,940 44
ACCUMULATED COMPREHENSIVEINCOME
Balance, beginning of year (33) 15 49 1Unrealized gain/(loss) securities, net 48 34 34 1
Balance, end of year 15 49 83 2
TOTAL STOCKHOLDERS’ EQUITY
Balance, beginning of year 1,750 2,471 2,830 65Common stock issued 525 – 7,338 168Compensation amortised during the year – – 1 –
Net income 298 503 1,402 32Dividend declared on common stock (150) (178) (218) (5)Unrealized gain/(loss) on securities, net 48 34 34 1
Balance, end of year 2,471 2,830 11,387 261
* Common stock issued to parent company
Prepared in accordance with US GAAP

1999-2000 Sixth Annual Report
41
Statements of changes in stockholders’ equity for the years ended March 31, 1998, 1999 and 2000
(in millions)STATEMENT OF COMPREHENSIVE INCOME Year ended March 31,
1998 1999 2000 2000Rs. Rs. Rs. USD
NET INCOME 298 503 1,402 32
OTHER COMPREHENSIVEINCOME, NET OF TAX
Unrealized gain/(loss) on securities 48 34 34 1
Comprehensive income 346 537 1,436 33
See accompanying notes to the financial statements
Prepared in accordance with US GAAP
Number ofbranches* keep
rising
2000999897961995
(Branches)
23
6
11
36
64
97
March 31
Shareholdingpattern
(Per cent)
March 31, 2000Shareholding Pattern
ICICI UTI & MFs
Bankers Trust* Fiis, etc .
Individuals, etc. LIC, etc.
62.24
16.17
4.423.75 1.40
12.02
* As depository forADSs
Branch and ATMNetwork widen
20001999
64 65
97
175
March 31
Branches including extension counters
ATMs
* includingextensioncounters
For Cash Flow Statement, please see page 42

1999-2000 Sixth Annual Report
42
Statements of cashflows for the years ended March 31, 1998, 1999 and 2000
(in millions)Year ended March 31,
1998 1999 2000 2000Rs. Rs. Rs. USD
CASH FLOWS FROMOPERATING ACTIVITIES
Net income 298 503 1,402 32Adjustments to reconcile net income to net
cash from operating activities :Provision for credit losses 360 540 427 10Depreciation and amortization 148 163 374 9Loss on sale of fixed assets – – 1 –Provision for deferred taxes (99) (130) 113 3Unrealized (gain)/loss on trading securities 127 (23) 79 2Net gain on sale of securities, available for sale (32) (21) (75) (2)
Change in assets and liabilities
Other assets (301) (914) (1,977) (45)Other liabilities 1,787 2,278 2,361 54Trading account assets (7,511) (8,412) (12,509) (287)Trading account liabilities 952 (1,375) 1,504 34
Net cash used in operating activities (4,271) (7,391) (8,300) (190)
CASH FLOWS FROMINVESTING ACTIVITIES
Securities, available for salePurchases (142) (3,610) (10,714) (246)Proceeds from sales 2,609 1,103 10,020 230Net increase in loans (4,751) (15,373) (19,843) (455)Capital expenditure on property and equipment (985) (487) (528) (12)Proceeds from sale of property and equipment 1 1 2 –
Net cash used in investing activities (3,268) (18,366) (21,063) (483)
CASH FLOWS FROMFINANCING ACTIVITIES
Net increase in deposits 12,813 34,439 37,931 869Proceeds from issuance of long term debt 40 1,636 710 16Maturity and redemption of long term debt – – – –Proceeds from issuance of common stock 525* – 7,338 168Payment of dividend (150) (178) (218) (5)
Net cash from financing activities 13,228 35,897 45,761 1,048
Net increase in cashand cash equivalents 5,689 10,140 16,398 375
Cash and cash equivalents atbeginning of period 4,099 9,788 19,928 457
Cash and cash equivalentsat end of the period 9,788 19,928 36,326 832
* Proceeds from issuance of stock to parent company.See accompanying notes to the financial statements.
Prepared in accordance with US GAAP

1999-2000 Sixth Annual Report
43
Notes to Financial Statements for the years ended March 31, 1998, 1999 and 2000
1. SIGNIFICANT ACCOUNTING POLICIES
1.1 Basis of presentation
1.1.1 ICICI Banking Corporation Limited, incorporated in Vadodara, India provides a wide range of banking andfinancial services including commercial lending, trade finance and treasury products. The name of ICICI BankingCorporation Limited was changed to ICICI Bank Limited (“ICICI Bank” or “the Bank”) on September 10,1999. ICICI Bank is a banking company governed by the Banking Regulations Act, 1949. ICICI Bank is a62.24% owned subsidiary of ICICI Limited (“the parent company”), a leading financial institution in India.ICICI Bank does not have any majority owned subsidiaries or investments where its shareholding exceeds 20%of the voting stock of the investee.
1.1.2 The accounting and reporting policies of ICICI Bank used in the preparation of these financial statementsreflect industry practices and conform to generally accepted accounting principles in the United States ofAmerica (“US GAAP”). The preparation of financial statements in conformity with US GAAP requiresmanagement to make estimates and assumptions that affect the reported amounts of assets and liabilities at thedate of the financial statements and the reported income and expenses during the reporting period. Managementbelieves that the estimates used in the preparation of the financial statements are prudent and reasonable.Actual results could differ from these estimates.
1.1.3 The accompanying financial statements have been prepared in Indian rupees (“Rs”), the national currency ofIndia. Solely for the convenience of the reader, the financial statement at and for the year ended March 31,2000 has been translated into US dollars, at the noon buying rate in New York city at March 31, 2000for the cable transfers in rupees, as certified for customs purposes by the Federal Reserve of New York ofUS$1.00 = Rs. 43.65. No representation is made that the rupee amounts have been, could have been or couldbe converted into US dollars at such rate or any other rate on March 31, 2000 or at any other certain date.
1.2 Revenue recognition
1.2.1 Interest income is accounted on an accrual basis except in respect of impaired loans, where it is recognized ona cash basis.
1.2.2 Income from leasing operations is accrued in a manner to provide a fixed rate of return on outstandinginvestments.
1.2.3 Discount on bills is recognized on a straight line basis over the tenure of the bills.
1.2.4 Fees from non-fund based activities such as guarantees and letters of credit are amortized over the contractualperiod of the commitment.
1.3 Cash and cash equivalents
1.3.1 ICICI Bank considers all highly liquid investments, which are readily convertible into cash and have contractualmaturities of three months or less from the date of purchase, to be cash equivalents. The carrying value of cashequivalents approximates fair value.
1.4 Securities and trading account activities
1.4.1 ICICI Bank has adopted the Statement of Financial Accounting Standards (“SFAS”) No. 115, “Accounting forCertain Investments in Debt and Equity Securities”. SFAS No. 115 requires that investments in debt and equitysecurities be reported at fair value, except for debt securities classified as held-to-maturity securities, which arereported at amortized cost. Equity securities and debt securities available for sale are carried at fair value, withunrealized gains and losses reported as a separate component of stockholders’ equity, net of applicable incometaxes. Realized gains and losses on sale of securities are included in earnings on a weighted average cost basis.
1.4.2 Any “other than temporary diminution” in the value of held-to-maturity or securities, available for sale ischarged to the income statement. “Other than temporary diminution” is identified based on management’sevaluation.
Prepared in accordance with US GAAP

1999-2000 Sixth Annual Report
44
1.4.3 Trading account assets include securities held for the purpose of sale in the short term. These securities arevalued at fair value, with the unrealized gains/losses being taken to trading account revenue. Trading accountactivities also include foreign exchange products. Foreign exchange trading positions are valued at prevailingmarket rates on the date of the balance sheet and the resulting gains/losses are included in foreign exchangerevenue.
1.5 Loans
1.5.1 Loans are reported at the principal amount outstanding, inclusive of interest accrued and due pursuant to thecontractual terms. Loan origination fees (net of loan origination costs) are deferred and recognized as anadjustment to yield over the period of the loan. Interest is accrued on the unpaid principal balance and isincluded in interest income.
1.5.2 Loans are identified as impaired and placed on a non-accrual basis, when it is determined that payment ofinterest or principal is doubtful of collection or that interest or principal is past due beyond two paymentperiods (each payment period being 90 days). Such loans are classified as non-performing. Any interest accrued(and not received) on impaired loans is reversed and charged against current earnings, and interest is thereafterincluded in earnings only to the extent actually received in cash. Non-performing loans are returned to anaccrual status when all contractual principal and interest amounts are reasonably assured of repayment andthere is a sustained period of repayment performance in accordance with the contractual terms.
1.5.3 Non-performing loans are reported after considering the impact of “non-performance”. Non-performance ismeasured by comparing the carrying amount of the loan with the present value of the expected future cashflows/fair value of the collateral, discounted at the effective rate of the loan. In cases of default wherein ICICIBank does not have adequate security and/or the borrower is not traceable and legal recourse is not expected toresult in recovery, ICICI Bank writes off all or part of the carrying value of the loan.
1.5.4 Loans include aggregate rentals on lease financing transactions and residual values, net of related unearnedincome and security deposit collected from the lessee. Substantially all of the lease financing transactionsrepresent direct financing leases. Unearned income is amortized under a method which primarily results in anapproximate level rate of return when related to the unrecovered lease investment. Income on non-performingleases is recognised on the same basis as non-performing loans.
1.5.5 Loans further include credit substitutes, such as privately placed/negotiated debt instruments and preferredshares, which are not readily marketable.
1.6 Aggregate allowance for credit losses
1.6.1 ICICI Bank evaluates its entire corporate credit portfolio on a periodic basis and grades its accounts consideringboth qualitative and quantitative criteria. This analysis includes an account by account analysis of the entireloan portfolio, and an allowance is made for any probable loss on each account. In evaluating its credit losses,management has estimated recovery of such loans at various stages of time to recovery and has discounted theseusing the effective interest rate of the loans. In estimating recovery, ICICI Bank considers its past credit lossexperience and such other factors, which in its judgement, deserve recognition in estimating probable creditlosses. Actual recovery may differ from estimates and consequently actual loss could differ from the estimatedloss. The aggregate allowance for credit losses is increased by amounts charged to the provisions for creditlosses, net of write-offs and releases of provisions as a result of cash collections.
1.6.2 Credit card receivables are collectively evaluated for impairment based on the profile of days past due, classifiedinto various buckets. Provisions are based as a fixed percentage of pre-defined buckets. The Bank intends toreview this policy annually based on the historical delinquency and credit loss experience.
1.7 Property and equipment
1.7.1 Property and equipment are stated at cost, less accumulated depreciation. The cost of additions, capitalimprovements and interest during the construction period are capitalized, while repairs and maintenance arecharged to expenses when incurred.
1.7.2 Depreciation is provided over the estimated useful lives of the assets.
Notes to Financial Statements for the years ended March 31, 1998, 1999 and 2000
1999-2000 Sixth Annual Report
45
1.7.3 The cost and accumulated depreciation for property and equipment sold, retired or otherwise disposed of arerelieved from the accounts, and the resulting gains/losses are reflected in the income statement.
1.7.4 Property under construction and advances paid towards acquisition of property, plant and equipment are disclosedas capital work in progress.
1.8 Interest capitalization
1.8.1 The interest cost incurred for funding an asset during its construction period is capitalized based on the actualoutstanding investment in the asset from the date of purchase/expenditure and the average cost of funds. Thecapitalized interest cost is included in the cost of the relevant asset and is depreciated over the asset’s estimateduseful life.
1.9 Income taxes
1.9.1 Income taxes are accounted for under the asset and liability method. Deferred tax assets and liabilities arerecognized for the future tax consequences attributable to the difference between the financial statement carryingamounts of existing assets and liabilities and their respective tax bases, and operating loss carry forwards. Deferredtax assets are recognized subject to management’s judgement that realization is more likely than not. Deferredtax assets and liabilities are measured using enacted tax rates expected to apply to taxable income in the yearsin which temporary differences are expected to be received and settled. The effect on deferred tax assets andliabilities of a change in tax rates is recognized in the income statement in the period of change.
1.10 Retirement benefits
Gratuity
1.10.1 In accordance with Indian law, ICICI Bank provides for a gratuity to its employees in the form of a definedbenefit retirement plan covering all employees. The plan provides a lump sum payment to vested employees atretirement, on death while in employment or on termination of employment based on the respective employee’ssalary and the years of employment with ICICI Bank. The gratuity benefit conferred by ICICI Bank on itsemployees is equal to or greater than the statutory minimum.
1.10.2 ICICI Bank provides the gratuity benefit through annual contributions to a fund administered by trustees andmanaged by the Life Insurance Corporation of India. Under this scheme, the settlement obligation remainswith the Bank although the Life Insurance Corporation of India administers the scheme and determines thecontribution premium required to be paid by the bank. ICICI Bank contributed and expensed Rs. 3 million, Rs.5 million and Rs. 6 million to the gratuity fund in fiscal 1998, 1999 and 2000 respectively. The impact of thescheme is not material or expected to become material to the Bank’s financial condition or operations.
Superannuation
1.10.3 The permanent employees of ICICI Bank are entitled to receive retirement benefits under the superannuationfund operated by ICICI Bank. The Superannuation fund is a defined contribution plan under which ICICIBank contributes annually a sum equivalent to 15% of the employee’s eligible annual salary to Life InsuranceCorporation of India, the manager of the fund, that undertakes to pay the lump sum and annuity paymentspursuant to the scheme. ICICI Bank contributed Rs. 10 million, Rs. 12 million and Rs. 20 million to thesuperannuation plan in fiscal 1998, 1999 and 2000 respectively.
Provident fund
1.10.4 In accordance with Indian law, all employees of ICICI Bank are entitled to receive benefits under the providentfund, a defined contribution plan, in which, both the employee and ICICI Bank contribute monthly at adetermined rate (currently 12% of employees’ salary). These contributions are made to a fund set up by ICICIBank and administered by a board of trustees. ICICI Bank contributed Rs. 7 million, Rs. 11 million andRs. 16 million to the provident fund in fiscal 1998, 1999 and 2000 respectively. Further, in the event the returnon the fund is lower than 12% (current guaranteed rate of return to the employees), such difference will becontributed by ICICI Bank and charged to income.
Notes to Financial Statements for the years ended March 31, 1998, 1999 and 2000

1999-2000 Sixth Annual Report
46
Leave encashment
1.10.5 The liability for leave encashment on retirement or on termination of services of the employee of ICICI Bankis valued on the basis of the employee’s last drawn salary and provided for. Accordingly ICICI Bank has made aprovision of Rs. 1 million, Rs. 4 million and Rs. 6 million, for fiscal 1998, 1999 and 2000 respectively.
1.11 Foreign currency transactions
1.11.1 Revenue and expenses in foreign currency are accounted at the exchange rate on the date of the transaction.Foreign currency balances at year-end are translated at the year-end exchange rates and the revaluation gains/losses are adjusted through the income statement.
1.11.2 Speculative forward exchange contracts are revalued at year-end based on forward exchange rates for residualmaturities and the contracted rates and the revaluation gain/loss is recognised in the income statement. Forwardexchange contracts that are accounted for as hedges of foreign currency exposures, are revalued based on year-end spot rates and the spot rates at the inception of the contract. The revaluation gain/loss is recognised in theincome statement. Premium or discount on such forward exchange contracts is recognised over the life of thecontract.
1.12 Derivative instruments
1.12.1 ICICI Bank enters into currency swaps with its corporate clients which it hedges with the parent company.Such hedge contracts are structured to ensure that changes in their market values would fully offset the effect ofa change in the fair value of the underlying contracts. Accordingly, these swap contracts are designated ashedge transactions and accounted for under accrual method.
1.12.2 ICICI Bank has entered into interest swap contracts for its own balance sheet management purposes as well asfor taking trading positions. The contracts which have been entered into for its balance sheet managementpurposes have been designated as ‘hedge transactions’ and accounted for under the accrual method. The contractsentered into for trading purposes have been designated as ‘Traded Contracts’ and have been accounted at theirfair value.
1.13 Debt issuance costs
1.13.1 Debt issuance costs are amortized over the tenure of the debt.
1.14 Dividends
1.14.1 Dividends on common stock and the related dividend tax are recorded as a liability at the point of their approvalby the board of directors.
1.15 Earnings per share
1.15.1 Basic earnings per share is computed by dividing net income by the weighted average number of commonshares outstanding for the period. Diluted earnings per share is computed by adjusting outstanding shares assumingconversion of all potentially dilutive stock options and other convertible securities.
1.16 Stock-based compensation
1.16.1 The Bank has introduced a stock option plan, wherein options were granted to certain employees and wholetimedirector of the Bank and employees of the parent company. The Bank accounts for employee stock options,granted to its employees and whole time director in accordance with Accounting Principles Board (“APB”)No. 25, “Accounting for Stock issued to Employees” and furnishes the proforma disclosures required underSFAS No. 123, “Accounting for Stock-based compensation” in respect of these options.
1.16.2 Options granted to employees of the parent company are accounted for in accordance with SFAS No. 123. TheBank values the stock options issued, based upon an option-pricing model and recognizes this value as anexpense over the period in which the options vest.
Notes to Financial Statements for the years ended March 31, 1998, 1999 and 2000

1999-2000 Sixth Annual Report
47
1.17 Accounting for outward clearing
1.17.1 In fiscal 2000, the Bank decided to account for cheques deposited by customers and sent for clearing. Accordinglyat March 31, 2000 Rs. 1,610 million has been accounted for as outward clearing suspense and included in cashand cash equivalents and other liabilities respectively. This change is not material to the financial position ofthe Bank and accordingly, the outward clearing balance as at March 31, 1999 amounting to Rs. 1,440 millionhas been included in the financial statements for the year ended March 31, 1999.
2. FINANCIAL INSTRUMENTS
2.1.1 ICICI Bank provides a wide variety of financial instruments as products to its customers, and it also uses theseinstruments in connection with its own activities. Following are explanatory notes regarding financial assetsand liabilities, off-balance sheet financial instruments, concentration of credit risk and the estimated fair valueof financial instruments.
2.1.2 Collateral requirements are assessed on a case-by-case evaluation of each customer and product, and may includecash, securities, receivables, property, plant and equipment and other assets.
2.2 Financial assets and liabilities
Cash and cash equivalents
2.2.1 Cash and cash equivalents at March 31, 2000 include a balance of Rs. 6,904 million (March 31,1999 : Rs. 4,565 million) maintained with the Reserve Bank of India being the minimum daily stipulated amountto be maintained. This balance is subject to withdrawal and usage restrictions.
2.2.2 Cash and cash equivalents at March 31, 2000 also includes, interest-bearing deposits with banks aggregatingRs. 25,273 million (March 31, 1999 : Rs. 11,083 million) and outward clearing suspense of Rs 1,610 million(March 31, 1999 : Rs. 1,440 million)
Trading account assets
2.2.3 A listing of the trading account assets is set out below :
(in millions)At March 31,
1999 2000Rs. Rs.
Government of India securities 14,449 26,903Equity securities 198 90Mutual fund units - 779Revaluation gains on derivative and foreign exchange contracts 425 309Commercial paper/certificates of deposits 750 147
Total 15,822 28,228
2.2.4 In accordance with the Banking Regulation Act, 1949, ICICI Bank is required to maintain a specified percentageof its net demand and time liabilities by way of liquid unencumbered assets like cash, gold and approved securities.The amount of securities required to be maintained at March 31, 2000 was Rs. 20,570 million (March 31,1999 : Rs. 12,875 million).
2.2.5 As at March 31, 2000, trading account assets included certain securities amounting to Rs. 72 million (March31, 1999 : Rs. 18 million), which are pledged in favour of certain banks for the purposes of availing borrowingand funds transfer facilities.
Notes to Financial Statements for the years ended March 31, 1998, 1999 and 2000
1999-2000 Sixth Annual Report
48
Trading account revenue
2.2.6 A listing of trading account revenue is set out below :
(in millions)Year ended March 31,
1998 1999 2000Rs. Rs. Rs.
Gain on sale of trading securities 274 111 936Revaluation gain/(loss) on trading securities (127) 23 (79)
Total 147 134 857
Repurchase transactions
2.2.7 During the period under review, ICICI Bank has undertaken repurchase and reverse repurchase transactions inGovernment of India securities. The average level of repurchase outstandings during fiscal 1999 and 2000 wasRs. 417 million and Rs. 225 million, respectively. The average level of reverse repurchase transactions outstandingduring fiscal 1999 and 2000 was Rs. 211 million and Rs. 203 million, respectively. At March 31, 2000 outstandingrepurchase and outstanding reverse repurchase contracts amounts to Nil (March 31, 1999 : Nil) and Rs. 256million (March 31, 1999 : Nil) respectively.
Securities, available for sale
2.2.8 The portfolio of securities, available for sale is set out below :(in Rs. millions)
At March 31, 1999Amortized Gross unrealized Gross unrealized Fair
cost gain loss Value
Corporate debt securities 2,860 – – 2,860Government of India securities 775 50 – 825Total debt securities 3,635 50 – 3,685Mutual fund units 266 12 – 278Total securities, available for sale 3,901 62 – 3,963
(in Rs. millions)At March 31, 2000
Amortized Gross unrealized Gross unrealized Faircost gain loss Value
Corporate debt securities 2,540 34 – 2,574Government of India securities 914 89 – 1,003Total debt securities 3,454 123 – 3,577Mutual fund units 1,146 – (14) 1,132
Total securities, available for sale 4,600 123 (14) 4,709
Income from securities, available for sale
2.2.9 A listing of interest and dividends on available for sale securities is set out below :(in millions)
Year ended March 31,1998 1999 2000
Rs. Rs. Rs.
Interest 129 248 358Dividends 19 57 326Total interest, including dividends 148 305 684
Notes to Financial Statements for the years ended March 31, 1998, 1999 and 2000

1999-2000 Sixth Annual Report
49
Maturity profile of debt securities
2.2.10 A listing of debt securities, available for sale at March 31, 1999 and March 31, 2000 by original contractualmaturity is set out below :
(in millions)March 31,
1999 2000Rs. Rs.
Amortized Fair Amortized Faircost Value cost Value
Corporate Debt SecuritiesLess than one year 266 266 399 403One to five years 1,894 1,894 1548 1,563More than five years 700 700 593 608Total 2,860 2,860 2,540 2,574
Loans
2.2.11 A listing of loans by category is set out below:
(in millions)At March 31,
1999 2000Rs. Rs.
Corporate
Working capital finance 17,508 31,576
Term loans 2,731 3,798
Credit substitutes 6,762 10,532
Leasing and related activities 366 305
Retail loans 1,110 1,553
Gross loans 28,477 47,764
Aggregate allowance for credit losses (880) (748)
Net loans 27,597 47,016
2.2.12 Loans given to persons domiciled outside India at March 31, 2000 were Rs. 265 million (March 31, 1999 :Rs. 91 million).
2.2.13 Normally, the working capital advances are secured by a first lien on current assets, principally comprisinginventory and receivables. Additionally, in certain cases ICICI Bank may obtain additional security through afirst or second lien on property and equipment, a pledge of financial assets like marketable securities and corporate/personal guarantees. The term loans are normally secured by a first lien on the property and equipment andother tangible assets of the borrower.
Notes to Financial Statements for the years ended March 31, 1998, 1999 and 2000

1999-2000 Sixth Annual Report
50
Net investment in leasing activities
2.2.14 Contractual maturities of ICICI Bank’s net investment in leasing activities and its components, which areincluded in loans, are set out below :
(in Rs. millions)At March 31,
2000
Gross finance receivable for the year ended/ending March 312001 1782002 1282003 472004 402005 beyond 26
419
Less : Unearned income (68) Security deposits (46)
Investment in leasing and other receivables 305Less : Aggregate allowance for credit losses (104)
Net investment in leasing and other receivables 201
Maturity profile of loans
2.2.15 A listing of each category of loans other than net investment in leases and other receivables by maturity is setout below:
(in Rs. millions)
March 31, 1999
Upto 1 1-5 years More than TotalYear 5 years
Term loan 784 1,886 61 2,731Working capital finance 15,240 2,268 – 17,508Credit substitutes – 5,744 1,018 6,762Retail loans 1,110 – – 1,110
Total 17,134 9,898 1,079 28,111
(in Rs. millions)
March 31, 2000Upto 1 1-5 years More than Total
Year 5 years
Term loan 1,402 2,302 94 3,798Working capital finance 28,421 3,155 – 31,576Credit substitutes 1,831 6,175 2,526 10,532Retail loans and credit card receivables 1,553 – – 1,553
Total 33,207 11,632 2,620 47,459
Notes to Financial Statements for the years ended March 31, 1998, 1999 and 2000

1999-2000 Sixth Annual Report
51
Interest and fees on loans
2.2.16 A listing of interest and fees on loans (net of unearned income) is set out below:
(in millions)Year ended March 31,
1998 1999 2000Rs. Rs. Rs.
Working capital finance 1,136 1,755 2,666Term loan 176 338 480Credit substitutes 74 465 981Leasing and related activities 38 21 14Retail loans 75 128 296
Total 1,499 2,707 4,437
Non-performing loans
2.2.17 A listing of non-performing loans is set out below:(in millions)
At March 31,
1999 2000Rs. Rs.
Working capital finance 1,158 1,127Term loan 236 61Credit substitutes 75 45Leasing and related activities 144 185
Total 1,613 1,418
Allowance for credit losses (880) (748)
Impaired loans net of valuation allowance 733 670
Loans without valuation allowance 466 163Loans with valuation allowance 1,147 1,255
Total 1,613 1,418
Interest foregone on non-performing assets 93 124
Average non-performing loans . 1,343 1,432
Changes in the allowance for credit losses
2.2.18 A listing of the changes in allowance for credit losses is set out below :(in millions)
Year ended March 31,
1998 1999 2000Rs. Rs. Rs.
Aggregate allowance for credit lossesat beginning of the year 187 425 880AdditionsProvisions for credit losses, net of release ofprovisions as a result of cash collections 360 540 427
547 965 1,307Write offs (122) (85) (559)Aggregate allowance for credit lossesat end of the year 425 880 748
Notes to Financial Statements for the years ended March 31, 1998, 1999 and 2000

1999-2000 Sixth Annual Report
52
Troubled debt restructuring
2.2.19 Loans at March 31, 2000 include loans aggregating Rs. 43 million (March 31, 1999 : Rs. 38 million), which arecurrently under a scheme of debt restructuring and which have been identified as impaired loans. The grossrecorded investment in these loans is Rs. 43 million (March 31, 1999 : Rs. 38 million) against which an allowancefor credit losses aggregating Rs. 25 million (March 31, 1999 : Rs. 22 million) has been established. Income onrestructured loans would have been Rs. 6.90 million and Rs. 7.70 million for fiscal 1999 and 2000 respectively,based on original terms, and was Rs. 6.87 million and Rs. 6.44 million for fiscal 1999 and 2000 respectively,based on the restructured terms.
2.2.20 There are no commitments to lend incremental funds to any borrower who is party to a troubled debt restructuring.
Concentration of credit risk
2.2.21 Concentrations of credit risk exist when changes in economic, industry or geographic factors similarly affectgroups of counterparties whose aggregate credit exposure is material in relation to ICICI Bank’s total creditexposure. ICICI Bank’s portfolio of financial instruments is broadly diversified along industry, product andgeographic lines within the country.
2.2.22 A listing of the concentration of loan exposures by industry is set out below:
At March 31,1999 2000
(in Rs. millions) % (in Rs. millions) %
Light manufacturing 2,800 9.83 4,895 10.25Chemical, Paints and Pharmaceuticals 2,420 8.50 5,772 12.08Finance 1,949 6.84 6,113 12.80Transport 159 0.56 1,686 3.53Electricity 1,488 5.23 2,784 5.83Textiles 1,405 4.93 1,600 3.35Metal and metal products 1,370 4.81 1,269 2.66Automobile 1,006 3.53 1,680 3.52Construction 740 2.60 882 1.85Iron and steel 620 2.18 703 1.47Cement 540 1.90 1,124 2.35Software 460 1.62 823 1.72Agriculture 675 2.37 1,520 3.18Personal loans 1,110 3.90 1,553 3.25Paper and paper products 373 1.30 745 1.56Other industries 11,362 39.90 14,615 30.60
Total 28,477 100.00 47,764 100.00
Unearned income
2.2.23 A listing of unearned income is set out below :(in millions)
At March 31,1999 2000
Rs. Rs.
Unearned income on leasing and other receivable transactions 84 68Unearned commission on guarantees 73 104Unearned income on letters of credit 17 15Unamortised loan origination fees – 30
Notes to Financial Statements for the years ended March 31, 1998, 1999 and 2000

1999-2000 Sixth Annual Report
53
Deposits
2.2.24 Deposits include demand deposits, which are non-interest-bearing and savings and time deposits, which areinterest-bearing. A listing of deposits is set out below :
(in millions)At March 31,
1999 2000Rs. Rs.
Interest bearingSavings deposits 2,271 5,332Time deposits 52,692 77,453
54,963 82,785Non-interest bearing
Demand deposits 5,766 15,875
Total 60,729 98,660
2.2.25 At March 31, 2000, term deposits of Rs. 71,319 million (March 31, 1999 : Rs. 48,720 million) have a residualmaturity of less than one year. The balance of the deposits mature between one to seven years.
Trading account liabilities
2.2.26 Trading account liabilities at March 31, 2000 include borrowings from banks in the inter-bank call moneymarket of Rs. 1,922 million (March 31, 1999 : Rs. 418 million).
Long-term debt
2.2.27 Long-term debt represent debt with an original maturity of greater than one year. Long term debt bears interestat fixed contractual rates ranging from 12.5% to 17%. A listing of long-term debt by residual maturity is set outbelow :
At March 31,
1999 2000(in Rs. millions) % (in Rs. millions) %
Residual maturityOne year to five years 1,084 62 1,796 73Five years to 10 years 680 38 680 27
Total 1,764 100 2,476 100
2.2.28 Long term debt at March 31, 2000 includes unsecured non-convertible subordinated debt of Rs. 1,680 million(March 31, 1999 : Rs. 1,680 million).
2.3 Off-balance sheet financial instruments
Foreign exchange and derivative contracts
2.3.1 ICICI Bank enters into foreign exchange forward contracts and currency swaps with interbank participants andcustomers. These transactions enable customers to transfer, modify or reduce their foreign exchange and interestrate risks.
Notes to Financial Statements for the years ended March 31, 1998, 1999 and 2000

1999-2000 Sixth Annual Report
54
2.3.2 Forward foreign exchange contracts are commitments to buy or sell foreign currency at a future date at thecontracted rate. Currency swaps are commitments to exchange cash flows by way of interest in one currencyagainst another currency and exchange of notional principal amount at maturity based on predetermined rates.Currency swaps offered to customers are hedged by opposite contracts with the parent company and are accountedfor as hedge contracts.
2.3.3 The market and credit risk associated with these products, as well as the operating risks, are similar to thoserelating to other types of financial instruments. Market risk is the exposure created by movements in interestrates and exchange rates, during the currency of the transaction. The extent of market risk affecting suchtransactions depends on the type and nature of the transaction, value of the transaction and the extent towhich the transaction is uncovered. Credit risk is the exposure to loss in the event of default by counterparties.The extent of loss on account of a counterparty default will depend on the replacement value of the contract atthe ongoing market rates.
2.3.4 The following table presents the aggregate notional principal amounts of ICICI Bank’s outstanding foreignexchange and derivative contracts at March 31, 2000 and March 31, 1999 together with the related balancesheet credit exposure.
Notional principal amounts Balance sheet creditexposure (Note 1)
(in Rs. millions) At March 31, At March 31,
1999 2000 1999 2000Interest rate agreementsSwap agreements – 900 – –
– 900 – –Foreign exchange productsForward contracts 36,705 62,892 425 309Swap agreements 2,962 7,658 – –
39,667 70,550 425 309
Note 1:Balance sheet credit exposure denotes the mark-to-market impact of the derivative and foreign exchangeproducts on the reporting date.
Loan commitments
2.3.5 ICICI Bank has outstanding undrawn commitments to provide loans and financing to customers. These loancommitments aggregated Rs. 9,215 million and Rs. 11,643 million at March 31, 2000 and March 31, 1999respectively. The interest rate on these commitments is dependent on the lending rates on the date of the loandisbursement. Further, the commitments have fixed expiry dates and may be contingent upon the borrowersability to maintain specific credit standards.
Guarantees
2.3.6 As a part of its commercial banking activities, ICICI Bank has issued guarantees and letters of credit to enhancethe credit standing of its customers. These generally represent irrevocable assurances that ICICI Bank willmake payments in the event that the customer fails to fulfill his financial or performance obligations. Financialguarantees are obligations to pay a third party beneficiary where a customer fails to make payment towards aspecified financial obligation. Performance guarantees are obligations to pay a third party beneficiary where acustomer fails to perform a non-financial contractual obligation. The guarantees are generally for a period notexceeding 18 months.
Notes to Financial Statements for the years ended March 31, 1998, 1999 and 2000

1999-2000 Sixth Annual Report
55
2.3.7 The credit risk associated with these products, as well as the operating risks, are similar to those relating toother types of financial instruments. Fees are recognised over the term of the facility.
2.3.8 Details of facilities outstanding are set out below :(in Rs. millions)
At March 31,
1999 2000
Financial guarantees 2,733 4,270Performance guarantees 1,897 3,295
Total 4,630 7,565
2.4 Estimated fair value of financial instruments
2.4.1 ICICI Bank’s financial instruments include financial assets and liabilities recorded on the balance sheet, as wellas off-balance sheet instruments such as foreign exchange and derivative contracts. A listing of the fair value ofthese financial instruments is set out below :
(in Rs. millions)
Carrying Estimated Estimated fair Carrying Estimated Estimated fairvalue fair value value in excess value fair value value in excess
of /(less than) of /(less than)carrying value carrying value
March 31, 1999 March 31, 2000
Financial assets 76,265 76,182 (83) 130,416 130,163 (253)
Financial liabilities 73,435 73,837 402 119,029 119,554 525
2.4.2 Fair values vary from period to period based on changes in a wide range of factors, including interest rates,credit quality, and market perception of value and as existing assets and liabilities run off and new items aregenerated.
2.4.3 A listing of the fair values by category of financial assets and financial liabilities is set out below :
(in Rs. millions)
Particulars Carrying Estimated Estimated fair Carrying Estimated Estimated fairvalue fair value value in excess value fair value value in excess
of /(less than) of /(less than)carrying value carrying value
March 31, 1999 March 31, 2000 Financial assetsSecurities 3,963 3,963 – 4,709 4,709 –Trading assets 15,822 15,822 – 28,228 28,228 –Loans (Note 1) 27,597 27,514 (83) 47,016 46,763 (253)Other financial assets(Note 2) 28,883 28,883 – 50,463 50,463 –
Total 76,265 76,182 (83) 130,416 130,163 (253)
Financial liabilitiesInterest-bearing deposits 54,963 55,365 402 82,785 83,175 390Non-interest-bearing deposits 5,766 5,766 – 15,875 15,875 –Trading account liabilities 418 418 – 1,922 1,922 –Long-term debt 1,764 1,764 – 2,476 2,611 135Other financial liabilities(Note 3) 10,524 10,524 – 15,971 15,971 –
Total 73,435 73,837 402 119,029 119,554 525
DerivativesCurrency swaps (Note 4) – – 12 – – 51Interest rate swaps – – – – – 39
Notes to Financial Statements for the years ended March 31, 1998, 1999 and 2000

1999-2000 Sixth Annual Report
56
Note 1 : The carrying value of loans is net of allowance for credit losses.
Note 2 : Includes cash, due from banks, deposits at interest with banks, short-term highly liquid securities, andcustomers acceptance liability for which the carrying value is a reasonable estimate of fair value.
Note 3 : Represents acceptances and other liabilities outstanding, for which the carrying value is a reasonable estimateof fair value.
Note 4 : All customer positions are hedged by opposite contracts with the parent company.
2.4.4 The above data represents management’s best estimates based on a range of methodologies and assumptions.Quoted market prices are used for many securities. For performing loans, contractual cash flows are discountedat current market origination rates for loans with similar terms and risk characteristics. For impaired loans, theimpairment is considered while arriving at the fair value. For liabilities, market borrowing rates of interest ofsimilar instruments are used to discount contractual cash flows.
2.4.5 The estimated fair value of loans, interest-bearing deposits, and long term debt reflects changes in market ratessince the loans were given, and deposits were taken.
3. PROPERTY AND EQUIPMENT
3.1.1 Property and equipment are stated at cost less accumulated depreciation. Generally, depreciation is computedover the estimated useful life of the asset.
3.1.2 A listing of property and equipment by asset category is set out below :
(in millions)At March 31,
1999 2000Rs. Rs.
Land 121 126Building 977 1,352Equipment and furniture 738 1,151Capital work in progress 308 52
Gross value of property and equipment 2,144 2,681Less : Accumulated depreciation (383) (584)
Net value of property and equipment 1,761 2,097
3.1.3 Capital work in progress at March 31, 2000 include capital advances of Rs. 52 million (March 31, 1999 :Rs. 91 million). Interest capitalized for the year ended March 31, 2000 is Rs. 16 million (March 31, 1999 :Rs. 12 million).
3.1.4 Depreciation charge in fiscal 1998, 1999 and 2000 amounts to Rs. 131 million, Rs. 173 millionand Rs. 201 million, respectively.
4. OTHER ASSETS
4.1.1 Other assets at March 31, 2000 include interest accrued of Rs. 1,147 million (March 31, 1999 : Rs. 662 million),deposits in leased premises of Rs. 185 million (March 31, 1999 : Rs. 157 million) and prepaid expenses ofRs. 3 million (March 31, 1999 : Rs. 18 million).
5. OTHER LIABILITIES
5.1.1 Other liabilities at March 31, 2000 include accounts payable of Rs. 1,422 million (March 31, 1999 :Rs. 1,121 million) and interest accrued but not due on deposits amounting to Rs. 335 million (March 31,1999 : Rs. 235 million).
Notes to Financial Statements for the years ended March 31, 1998, 1999 and 2000

1999-2000 Sixth Annual Report
57
6. COMMON STOCK
6.1.1 At March 31, 2000 and March 31, 1999, the authorized common stock was 300 million shares with a par valueof Rs. 10 per share. At March 31, 2000 the issued common stock was 196.80 million shares with paid-up valueof Rs. 1,968 million. At March 31, 1999, the issued common stock was 165 million shares with paid-up valuesof Rs. 1,650 million.
7. RESTRICTED RETAINED EARNINGS
7.1.1 Retained earnings at March 31, 2000 computed as per generally accepted accounting principles of India includeprofits aggregating to Rs. 1,039 million (March 31, 1999 : Rs. 789 million) which are not distributable as dividendsunder the Banking Regulation Act, 1949. These relate to requirements regarding earmarking a part of theprofits under banking laws. Utilization of these balances is subject to approval of the Board of Directors andneeds to be reported to Reserve Bank of India. Statutes governing the operations of ICICI Bank mandate thatdividends be declared out of distributable profits only after the transfer of atleast 20% of net income, computedin accordance with current banking regulations, to a statutory reserve. Additionally, the remittance of dividendsoutside India is governed by Indian statutes on foreign exchange transactions.
8. EMPLOYEE STOCK OPTION PLAN
8.1.1 In February 2000, the Bank introduced its employee stock option plan, wherein an aggregate of 1,788,000options representing 1,788,000 shares were made available for grant to certain employees and directors of theBank and certain employees of the parent company. These options vest over three years and have a maximumterm of 10 years. Of these 994,250 options were granted to the employees and 75,000 options were granted tonon-whole time directors of the bank at an exercise price of Rs. 171.90, which was equal to the quoted marketvalue of the Bank’s common stock on the date of grant. The awards to non-whole time directors of the bankwere forfeited and such options have been retired from the plan. The Bank has computed and recognisedcompensation cost of Rs. 40 million for 718,750 options granted to the employees of the parent company. Thisamount will be expensed over the vesting period.
8.1.2 Had compensation costs of the Bank’s stock based compensation plan been recognized based on the fair valueon the grant date consistent with the method prescribed by SFAS No. 123, the Bank’s net income and earningsper share for the year ended March 31, 2000 would have been impacted as indicated below:
(Rs. in millions, except per share data)
For the year endedMarch 31, 2000
Net incomeAs reported 1,402Proforma under SFAS No. 123 1,401Basic earnings per share:As reported 8.49Proforma under SFAS No. 123 8.49Diluted earnings per shareAs reported 8.49Proforma under SFAS No. 123 8.49
8.1.3 The effects of applying SFAS No. 123, for disclosing compensation cost under such pronouncement may not berepresentative of the effects on reported net income for future years.
Notes to Financial Statements for the years ended March 31, 1998, 1999 and 2000

1999-2000 Sixth Annual Report
58
8.1.4 The fair value of the stock option granted was estimated on the date of grant using the Black-Scholes option-pricing model, with the following assumptions :
For the year endedMarch 31, 2000
Expected life in years 3Risk free interest rate 10.35%Volatility 30.0%
Dividend yield 0.7%
9. INCOME TAXES
9.1 Components of deferred tax balances
9.1.1 The tax effects of significant temporary differences are reflected through a deferred tax asset/liability, which isincluded in the balance sheet of ICICI Bank.
9.1.2 A listing of the temporary differences is set out below :
(in millions)At March 31,
1999 2000Rs. Rs.
Deferred tax assetsProvision for loan losses 309 303Non-funded provision – 6Leave encashment 2 3Loan processing fee amortization – 12Unrealized loss on securities, available for sale 21 –Others 16 1
Total deferred tax asset 348 325Valuation allowances – –
Net deferred tax asset 348 325Deferred tax liabilitiesProperty and equipment (187) (277)Investments (3) –Unrealized gains on securities, available for sale. (11) –Amortization of software cost (12) (11)Amortization of debt issue costs (4) (4)Performance Bonus – (18)Others (1) (3)
Total deferred tax liability (218) (313)
Net deferred tax asset/(liability) 130 12
Current 10 (14)Non-current 120 26
9.1.3 Management is of the opinion that the realization of the recognized net deferred tax asset of Rs. 12 million atMarch 31, 2000 (March 31, 1999 : Rs. 130 million) is more likely than not based on expectations as to futuretaxable income.
Notes to Financial Statements for the years ended March 31, 1998, 1999 and 2000

1999-2000 Sixth Annual Report
59
9.2 RECONCILIATION OF TAX RATES
9.2.1 The following is the reconciliation of estimated income taxes at Indian statutory income tax rate to income taxexpense as reported.
(in millions)Year ended March 31,
1998 1999 2000Rs. Rs. Rs.
Net income before taxes 402 673 1,781Statutory tax rate 35% 35% 38.5%Income tax expense at statutory tax rate 141 236 686Increase (reductions) in taxes on account ofIncome exempt from taxes (30) (81) (340)Effect of change in statutory tax rate (15) – 6Others 8 15 27
Reported income tax expenses 104 170 379
9.3 Components of income tax expense
9.3.1 The components of income tax expense are set out below :
(in millions)Year ended March 31,
1998 1999 2000Rs. Rs. Rs.
Current 203 300 266
Deferred (99) (130) 113
Total income tax expense 104 170 379
10. EARNINGS PER SHARE
10.1. A listing of earnings per share is set out below :(in Rupees millions except per share data)
Year ended March 31,
1998 1999 2000Basic Fully Basic Fully Basic Fully
Diluted Diluted DilutedEarningsNet Income 298 298 503 503 1,402 1,402SharesWeighted average common
shares outstanding 162.08 162.08 165.00 165.00 165.09 165.09Dilutive effect of stock
options outstanding – – – – – 0.02Total 162.08 162.08 165.00 165.00 165.09 165.11Earnings per share 1.84 1.84 3.05 3.05 8.49 8.49
Notes to Financial Statements for the years ended March 31, 1998, 1999 and 2000

1999-2000 Sixth Annual Report
60
11. SEGMENTAL DISCLOSURES AND RELATED INFORMATION
11.1 Segmental disclosures
11.1.1 ICICI Bank’s operations are solely in the financial services industry and consist of providing traditional bankingservices, primarily commercial lending activities, treasury operations and retail banking activities. ICICI Bankcarries out these activities through offices in India. Operating decisions are made based upon reviews of theBank’s operations as a whole. As a result, ICICI Bank constitutes the only reportable segment.
11.2 Geographic distribution
11.2.1 The business operations of ICICI Bank are largely concentrated in India. Accordingly the entire revenue assetsand net income are attributed to Indian operations.
Major customers11.2.2 ICICI Bank provides banking and financial services to a wide base of customers. There is no major customer
which contributes more than 10% of total revenues.
12. COMMITMENTS AND CONTINGENT LIABILITIES
12.1.1 ICICI Bank is obligated under a number of capital contracts. Capital contracts are job orders of a capital naturewhich have been committed. Estimated amounts of contracts remaining to be executed on capital account,aggregated to Rs. 6 million at March 31, 2000 (March 31, 1999 : Rs. 62 million).
Lease commitments12.1.2 ICICI Bank has commitments under long-term operating leases principally for premises and Automated Teller
Machines. Lease terms for premises generally cover periods of nine years. The following is a summary of futureminimum lease rental commitments for non-cancelable leases.
(in Rs. millions)
March 31, 2000
2001 1192002 1312003 1442004 1582005 174Thereafter 350
Total minimum lease commitments 1,076
12.1.3 Various tax-related legal proceedings are pending against ICICI Bank. Potential liabilities, if any, have beenadequately provided for, and management does not estimate any incremental liability in respect of legalproceedings.
13. RELATED PARTY TRANSACTIONS
13.1.1 ICICI Bank has entered into transactions with the following related parties :
• The parent company;
• Affiliates of the Bank;• Employees Provident Fund Trust; and
• Directors and employees of the group.
13.1.2 The related party transactions can be categorized as follows :Banking services
13.1.3 ICICI Bank provides banking services to all the related parties on the same terms that are offered to othercustomers.
Notes to Financial Statements for the years ended March 31, 1998, 1999 and 2000
1999-2000 Sixth Annual Report
61
13.1.4 The revenues earned from these related parties are set out below:
(in millions)Year ended March 31,
1998 1999 2000Rs. Rs. Rs.
Parent company 15 12 24
Affiliates (1) 5 4 6
Total 20 16 30
(1) Comprising ICICI Securities and Finance Company Limited, ICICI Brokerage Services Limited, ICICICapital Services Limited, Prudential ICICI Asset Management Company Limited and ICICI Venture FundsManagement Company Limited.
13.1.5 ICICI Bank has paid to the parent company interest on deposits and borrowings in call money marketsamounting to Rs. 105 million, Rs. 125 million and Rs. 261million in fiscal 1998, 1999 and 2000 respectively.Similarly, interest paid to affiliates on deposits and call money borrowings amount to Rs. 3 million, Rs. 20million and Rs. 49 million in fiscal 1998, 1999 and 2000 respectively.
13.1.6 ICICI Bank paid brokerage to ICICI Brokerage Services Limited amounting to Rs. 1 million, Rs. 2 millionand Rs. 3 million for fiscal 1998, 1999 and 2000 respectively.Leasing of premises and infrastructural facilities
13.1.7 ICICI Bank has entered into lease agreements with the parent company for the lease of certain premises andinfrastructural facilities to ICICI Bank. Total amount paid as rent for 1998, 1999 and 2000 is Rs. 20 million,Rs. 7 million and Rs. 36 million respectively. Similarly, during the fiscal 2000, ICICI Bank paid Rs. 5 milliontowards lease rentals on certain equipment leased from the parent company. ICICI Bank has also paid interestof Rs. 4 million to the parent company for capital advances made by the parent company for purchase ofequipment.Acquisition of premises
13.1.8 ICICI Bank purchased premises from the parent company for Rs. 532 million in fiscal 1998.Derivative transactions
13.1.9 ICICI Bank enters into foreign exchange currency swaps and interest rate swaps with the parent company ona back to back basis. The outstanding contracts at March 31, 2000 are cross currency swaps amountingto Rs. 3,829 million and interest rate swaps amounting to Rs. 800 million.Expenses for services rendered
13.1.10 ICICI Bank paid Rs. 1 million, Rs. 1 million and Rs. 2 million in fiscal 1998, 1999 and 2000 to the parentcompany for use of the parent company’s employees. ICICI Bank also paid Rs. 10 million in the year endedMarch 31, 2000 to ICICI Infotech Services Limited for use of the employees of ICICI Infotech for informationtechnology services.Receipts for services rendered
13.1.11 ICICI Bank has received Rs. 6 million in fiscal 2000 from the parent company for use of its employees. TheBank has receivables of Rs. 11 million from ICICI PFS Limited, Rs. 1 million from Prudential ICICI Limitedand Rs. 1 million from ICICI Capital Limited as reimbursement of expenditure upon the representatives ofthese affiliates.Share transfer activities
13.1.12 ICICI Bank has paid Rs. 3 million, Rs. 6 million and Rs. 4 million in fiscal 1998, 1999 and 2000 respectivelyto ICICI Infotech Services Limited for share transfer services provided by them. The Bank has paid Rs. 6million in fiscal 2000 for DEMAT services provided by the above affiliate.Other transaction with related parties
13.1.13 ICICI Bank has advanced loans to employees, bearing interest ranging from 3.5 % to 6 %. These are housing,vehicle and general purpose loans. The tenure of these loans ranges from five to twenty years. Further, ICICIBank has advanced loans at 16% to employees for purchase of its equity shares at the time of the public issues.The balance outstanding at March 31, 1999 and March 31, 2000 was Rs. 138 million and Rs. 221 millionrespectively.
Notes to Financial Statements for the years ended March 31, 1998, 1999 and 2000

1999-2000 Sixth Annual Report
62
13.1.14 During the year ended March 31, 2000 ICICI Bank entered into an agreement with ICICI Personal FinancialServices Limited for availing telephone banking call centers services and for performing all the transactionprocessing services for the credit card related activities.The amount paid during fiscal 2000 for these serviceswas Rs. 3 million and Rs. 28 million respectively.
13.1.15 ICICI Bank sold certain investments to Prudential ICICI Asset Management Company Limited and bookeda gain of Rs. 3 million during the year ended March 31, 2000. As on March 31, 2000 ICICI Bank has investmentsin the mutual fund schemes of the above company amounting to Rs. 700 million.
13.1.16 The balances pertaining to receivables from and payable to related parties are as follows :(in Rs. millions)
Parent company Affiliates(1)
At March 31, 1999
Accounts payable 3,081 217
At March 31, 2000
Accounts receivable 1 –
Accounts payable 3,503 1,514
(1) Comprises ICICI Securities and Finance Company Limited, Prudential ICICI Asset Management CompanyLimited, Prudential ICICI Trust Limited, ICICI Infotech Services Limited, ICICI Brokerage ServicesLimited, ICICI Personal Financial Services Limited, ICICI Capital Services Limited, ICICI Venture FundsManagement Company Limited, ICICI Properties Limited and ICICI Home Finance Company Limited.
14. CAPITAL ADEQUACY REQUIREMENTS14.1.1 The Company is a banking company within the meaning of the Indian Banking Regulation Act, 1949, registered
with and subject to examination by the Reserve Bank of India.14.1.2 ICICI Bank is subject to the capital adequacy requirements set by the Reserve Bank of India, which stipulate a
minimum ratio of capital to risk adjusted assets and off-balance sheet items, at least half of which must beTier I capital. Effective March 31, 2000 the Reserve Bank of India has increased the minimum capital adequacyratio to 9.0%. The capital adequacy ratio of the Bank calculated in accordance with the Reserve Bank of Indiaguidelines at March 31, 2000 and March 31, 1999 was 19.64% and 11.06% respectively.
15. FUTURE IMPACT OF NEW ACCOUNTING STANDARDS15.1.1 In June 1998, the Financial Accounting Standards Board (“FASB”) issued Statement of Financial Standards
(“SFAS”) No. 133, “Accounting for derivative instruments and hedging activities” (SFAS No. 133). In June1999, the FASB issued SFAS No. 137, “Accounting for Derivative Instruments and Hedging Activities –Deferral of the Effective Date of FASB Statement No. 133,” which delayed the effective date of SFAS No. 133to fiscal periods beginning after June 15, 2000. As the derivative activities of ICICI Bank are not significant,the future impact of SFAS No. 133 on the financial statements of ICICI Bank is unlikely to be material.
16. YEAR 200016.1.1 To date, ICICI Bank has not encountered any material Year 2000 issues concerning its respective computer
programs. ICICI Bank’s plan for the Year 2000 included replacing or updating existing systems (which were notYear 2000 compliant), assessing the Year 2000 preparedness of clients and counterparties and formulating acontingency plan to ensure business continuity in the event of unforeseen circumstances.
17. Previous year’s figures are regrouped and reclassified, where appropriate.
For and on behalf of the Board of directors
G. Venkatakrishnan Uday M. Chitale H. N. SinorExecutive Vice President amd Director Managing Director andChief Financial Officer Chief Executive Officer
Bhashyam SeshanCompany Secretary
Notes to Financial Statements for the years ended March 31, 1998, 1999 and 2000