Embed Size (px)
Citation preview

Journal of Theoretical and Applied Information Technology 20
th April 2014. Vol. 62 No.2
© 2005 - 2014 JATIT & LLS. All rights reserved.
ISSN: 1992-8645 www.jatit.org E-ISSN: 1817-3195
345
PERFORMANCE ANALYSIS OF FUSION BASED BRAIN
IMAGE CLASSIFICATION USING MINIMUM
DISTANCECLASSIFIER
1S. ANBUMOZHI,
2P.S. MANOHARAN
1Department of ECE, Raja College of Engineering and Technology, Tamil Nadu 625020, INDIA
2Department of EEE, Thiagarajar College of Engineering , Tamil Nadu 625015, INDIA
E-mail: [email protected], [email protected]
ABSTRACT
Image fusion is well used for medical brain image classification. Wavelet transform is the most
commonly used image fusion method, which fuses the source images' information in wavelet domain according to some fusion rules. But because of the uncertainties of the source images' contributions to the fused image, how to design a good fusion rule to integrate as much information as possible into the fused image becomes the most important problem. This paper focused to classify the brain image into normal and abnormal image using minimum distance classifier algorithm. The proposed methodology consists of spatial domain filter, fusion, clipping circuit and minimum distance classifier algorithm. The difference features are extracted from fused image and compared with trained extracted feature set. The low power architecture for the proposed brain image classification method is presented in this paper. The proposed hardware architecture consumes power of 151mW in CMOS 90nm technology.
Keywords: Fuzzy Reasoning, Fuzzy Rules, Image Fusion, Low Power
1. INTRODUCTION
Image fusion is a tool to combine multimodal
images by using image processing techniques. In specific image fusion aims at integrating distinct and complementary data in order to enhance the information apparent in the images, as well as to increase the reliability of the interpretation. This leads to more accurate data and increased utility. Besides, it is also affirmed that the fused data provides robust operational performance such as increased reliability, reduced ambiguity, improved confidence and enhanced classification. Image fusion is a procedure that aims at the integration of disparate and complementary data to enhance the information present in the source images as well as to increase the reliability of the interpretation. This process leads to more accurate data interpretation and utility [1].
A fusion process is nothing but a combination of salient information in order to synthesize an image with more information than individual image and synthesized image is more suitable for visual perception. We use the term image fusion to denote a process by which multiple images or information from multiple images is combined. These images may be obtained from different types of sensors.
With the availability of the multi sensor data in many fields, such as remote sensing, medical imaging or machine vision, image fusion has emerged as a promising and important research area. In other words, Image fusion is a process of combining multiple input images of the same scene into a single fused image, which preserves full content information and also retaining the important features from each of the original images. The fused image should have more useful information content compared to the individual image. As far as the knowledge of the author, none of the image fusion method has been reported which deals with multi focus and multi modal images simultaneously.
So in this paper we propose a novel fusion based brain image classification using minimum distance classifier which overcomes the limitations of different approaches.
2. RELATED WORKS
Ranaet al. [1] explored different medical image fusion methods and their comparison to find out which fusion method gives better results based on the performance parameters. Here medical images of magnetic resonance imaging (MRI) and computed tomography (CT) images are fused to

Journal of Theoretical and Applied Information Technology 20
th April 2014. Vol. 62 No.2
© 2005 - 2014 JATIT & LLS. All rights reserved.
ISSN: 1992-8645 www.jatit.org E-ISSN: 1817-3195
346
form new image. This new fused image improves the information content for diagnosis. Fusing MRI and CT images provide more information to doctors and clinical treatment planning system. MRI provides better information on soft tissues whereas CT provides better information on denser tissues. Fusing these two images gives more information than single input image. In this paper, wavelet transform, principle component analysis (PCA) and Fuzzy Logic techniques are utilized for fusing these two images and results are compared. The fusion performance is evaluated on the basis of root mean square error (RMSE), peak signal to noise ratio (PSNR) and Entropy (H).
An image fusion technique based on discrete wavelet transform using high boost filtering was proposed in [2]. The proposed algorithm achieved an accurate segmentation for region-based fusion using graph based normalized cut algorithm. The regions were extracted from the input registered source images using the resultant segmented image. Then the extracted regions were processed to fuse different regions using different fusion rules. The method was implemented on various registered images of multi-focus and multimodality categories and the fusion results were compared using standard reference based and non-reference based image fusion parameters. It has been observed from simulation results that the algorithm was consistent and preserved more information compared to earlier reported pixel based and region based fusion methods.
Le Moan et al. [3], proposed a new color visualization technique for multi- and hyperspectral images. This method was based on a maximization of the perceptual distance between the scene end members and natural constancy of the resulting images. The reflectance was transformed into values in the CIE L*a*b* color space combined with an a priori known segmentation map using stretched CMF principle. Boundaries are set in the a*b* subspace to balance the natural palette of colors for easy interpretation by a human expert.
Bhatnagaret al. [4] presented a fusion technique based on Non-Sub sampled Contourlet Transform (NSCT). In their method, firstly the source images are transformed by NSCT and then combined with
low frequency and high frequency coefficients. For the fusion of low frequency and high frequency components, two fusion rules were presented. At last, construction of fused image is done by the inverse NSCT with all complex coefficients. Their fusion method provided more accurate analysis of multimodal images. Also, their work can be applied for persons affected with recurrent tumor, Alzheimer and sub-acute stroke.
Tsagariset al. [5] proposed a scheme for hyperspectral image fusion based on principal components transformation (PCT). The first principal component of each subgroup is used for image visualization. The number of bands in each subgroup depends on the application. However, in their work, three subgroups were used for RGB representation. One of the subgroups employed matched filtering based on the spectral characteristics. The quality of the obtained RGB images were quantitatively evaluated using parameters like, correlation coefficient, the entropy, and the maximum energy-minimum correlation index. The performance of their method in classification has been tested using the K-means algorithm.
3. PROPOSED FUSION ALGORITHM
Figure 1 shows the block diagram of the proposed fusion algorithm. It consists of a spatial domain filter, fuzzy based edge detector, fusion block and mean filter. The spatial domain filter serves as a pre-filter to reduce blurring and aliasing artifacts produced by the bilinear interpolation. First, the input pixels of the original images are filtered by the spatial filter to enhance the edges and remove associated noise. Second, the filtered pixels are filtered again to smooth unwanted discontinuous edges of the boundary regions. Finally, the edge detected images are fused into a single image and then clipping circuit is used. It is followed by feature extraction circuit and minimum distance classifier circuit. Finally the fused image is classified as normal or abnormal image. The details of each part will be described in the following sections.

Journal of Theoretical and Applied Information Technology 20
th April 2014. Vol. 62 No.2
© 2005 - 2014 JATIT & LLS. All rights reserved.
ISSN: 1992-8645 www.jatit.org E-ISSN: 1817-3195
347
Figure 1: Block Diagram Of Proposed Fusion Methodology
3.1 Spatial Domain Filter
The spatial filter is a kind of high-pass filter and is used to reduce blurring artifacts. It is defined by a kernel to increase the intensity of a centre pixel relative to its neighbouring pixels. The clamp filter, a kind of low-pass filter, is a 2-D Gaussian spatial domain filter and composed of a convolution kernel array. It usually contains a single positive value at the centre and is completely surrounded by ones. The clamp filter is used to reduce aliasing artifacts and smooth the unwanted discontinuous edges of the boundary regions. The sharpening spatial and clamp filters can be represented by convolution kernels. A larger size of convolution kernel will produce higher quality of images. However, a larger size of convolution filter will also demand more memory and hardware cost. For example, a 6×6 convolution filter demands at least a five-line-buffer memory and 36 arithmetic units, which is much more than the two-line-buffer memory and nine arithmetic units of a 3×3 convolution filter. In our previous work, each of the sharpening spatial and clamp filters was realized by a 2-D 3 × 3 convolution kernel as shown in Figure 2(a). It demands at least a four-line-buffer memory for two 3×3 convolution filters. For example, if the image width is 1920 pixels, 4 × 1920 × 8 bits of data should be buffered in memory as input for processing. To reduce the complexity of the 3×3
convolution kernel, a cross-model formed is used to replace the 3×3 convolution kernel, as shown in Figure 2(b). It successfully cuts down on four of nine parameters in the 3×3 convolution kernel.
Furthermore, to decrease more complexity and memory requirement of the cross-model convolution kernel, T-model and inversed T-model convolution kernels are proposed for realizing the sharpening spatial and clamp filters. As shown in Figure 2(c), the T-model convolution kernel is composed of the lower four parameters of the cross-model, and the inversed T-model convolution kernel is composed of the upper four parameters. In the proposed scaling algorithm, both the T-model and inversed T-model filters are used to improve the quality of the images simultaneously.
The T-model or inversed T-model filter is simplified from the 3×3 convolution filter of the previous work [6], which not only efficiently reduces the complexity of the convolution filter but also greatly decreases the memory requirement from two to one line buffer for each convolution filter. The T-model and the inversed T-model provide the low-complexity and low memory- requirement convolution kernels for the sharpening spatial and clamp filters to integrate the proposed fusion architecture.

Journal of Theoretical and Applied Information Technology 20
th April 2014. Vol. 62 No.2
© 2005 - 2014 JATIT & LLS. All rights reserved.
ISSN: 1992-8645 www.jatit.org E-ISSN: 1817-3195
348
(a) (b) (c)
Figure 2:Weights Of The Convolution Kernels. (a) 3×3 convolution kernel, (b) Cross-model convolution kernel, (c) T-model and inversed T-model convolution kernels
3.2 Fuzzy Edge Detector
The edges of the image are detected based on fuzzy rules formulated. Figure 3 illustrates the edge detection procedure based on fuzzy rule formulation.
Figure 3:Architecture Of Fuzzy Based Edge Detector
3.2.1 Fuzzy logic matrix
Fuzzy is a set or combination of rules and decisions. The proposed fuzzy system is designed with 4 inputs and a single output, such that the 4 inputs indicate the 4 pixels present in the window mask. In this, the number of fuzzy sets used for the input Black and White is 2, and for the output, 3 fuzzy sets are used. The Fuzzy rules are formulated as shown in Table 1 for the input and output variables.
Table 1: Fuzzy Rules For Input And Output Variables.
Input / Output Name Range MF type
Fuzzy input 1=
Pixel P1
Black [0 0 255] Triangular
White [0 255 255] Triangular
Fuzzy input 2=
Pixel P2
Black [0 0 255] Triangular
White [0 255 255] Triangular
Fuzzy input 3=
Pixel P3
Black [0 0 255] Triangular
White [0 255 255] Triangular
Fuzzy input 4= Black [0 0 255] Triangular
Pixel P4 White [0 255 255] Triangular
Fuzzy output 1=
Pixel P4_out
Black [0 3 5] Triangular
White [249 252 255] Triangular
Edge [130 133 135] Triangular
The accuracy level of edge detection in the image will be improved by using fuzzy logic. 16 Fuzzy rules are constructed for every 2×2 pixel sub-block. The output value indicates to which fuzzy set (Black fuzzy set, White fuzzy set or Edge fuzzy set) the output pixel ‘P4’ belongs to. The fuzzy matrix is shown in Table 2. The notation ‘B’ represents black pixel and ‘W’ represents white pixel and ‘E’ represents edge pixel. For the construction of 2×2 sub block, the edge pixel is noted if any pixel variation occurs in this sub-block.
Table 2: Fuzzy Logic Matrix ForEach Sub-Block.
Fuzzy Inputs Fuzzy
Output
P1 P2 P3 P4 P4_out
B B B B B
B B B W E
B B W B E
B B W W E
B W B B E
B W B W E
B W W B E
B W W W E
W B B B E
W B B W E
W B W B E
W B W W E
W W B B E
W W B W E
W W W B E
W W W W W

Journal of Theoretical and Applied Information Technology 20
th April 2014. Vol. 62 No.2
© 2005 - 2014 JATIT & LLS. All rights reserved.
ISSN: 1992-8645 www.jatit.org E-ISSN: 1817-3195
349
3.2.2 Register Bank
The Register Bank (RB) includes 12
registersReg0 to Reg11, which stores the 3×3 pixel values of the current mask. Figure 4 illustrates the arrangement of RB in which each 3 registers are connected in series to provide three pixel values of a row in mask and Reg4 keeps the luminance value of the current pixel to be denoised.
Figure 4: Architectural Arrangement Of Register Banks
The luminance value from the input device enters the RB and immediately the denoising process starts. The twelve pixel values are stored in RB and then made use by consequent extreme data detectors and noise filters for denoising. After the denoising is complete, the reconstructed pixel values produced by the arbiter are fed to the line buffer. Suppose if we denoise row2 and all four selection signals are set to 0, the values of row1 and row2 will be stored in Line Buffer-odd and Line Buffer-even, respectively.
3.3 Fusion Circuit
Figure 5 shows the design of the fusion circuit in which the edge pixels detected fromimage1 and image2 are compared with a threshold value. The pixels of both the images are combined (fused) into a single image. In the last block, fusion rule is applied and it gives the fused pixel values, i.e. the combined pixel values of two images.
Figure 5: Architecture Of The Fusion Circuit
Figure 6: Clipping Circuit
3.4 Clipping Circuit
The clipping circuit as shown in Figure 6 is employed in the proposed fusion scheme. After the
fusion is complete, the fused pixel value may be greater than the maximum intensity value of 255. In order to reduce the fused pixel value within 255,
Journal of Theoretical and Applied Information Technology 20
th April 2014. Vol. 62 No.2
© 2005 - 2014 JATIT & LLS. All rights reserved.
ISSN: 1992-8645 www.jatit.org E-ISSN: 1817-3195
350
clipping is done. The clipping circuit compares the fused pixel value with the maximum value. If it is greater than 255, it is clipped, i.e. it is replaced with maximum value or else the actual pixel value is retained.
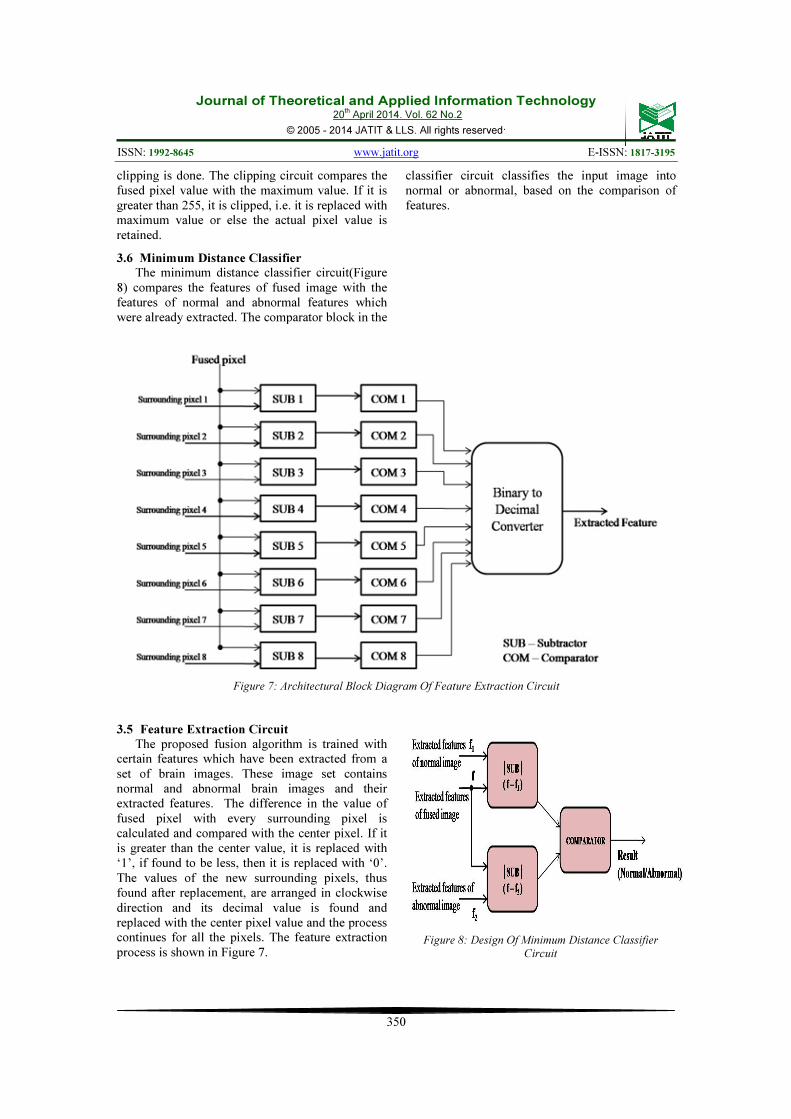
3.6 Minimum Distance Classifier The minimum distance classifier circuit(Figure
8) compares the features of fused image with the features of normal and abnormal features which were already extracted. The comparator block in the
classifier circuit classifies the input image into normal or abnormal, based on the comparison of features.
Figure 7: Architectural Block Diagram Of Feature Extraction Circuit
3.5 Feature Extraction Circuit
The proposed fusion algorithm is trained with certain features which have been extracted from a set of brain images. These image set contains normal and abnormal brain images and their extracted features. The difference in the value of fused pixel with every surrounding pixel is calculated and compared with the center pixel. If it is greater than the center value, it is replaced with ‘1’, if found to be less, then it is replaced with ‘0’. The values of the new surrounding pixels, thus found after replacement, are arranged in clockwise direction and its decimal value is found and replaced with the center pixel value and the process continues for all the pixels. The feature extraction process is shown in Figure 7.
Figure 8: Design Of Minimum Distance Classifier
Circuit
Journal of Theoretical and Applied Information Technology 20
th April 2014. Vol. 62 No.2
© 2005 - 2014 JATIT & LLS. All rights reserved.
ISSN: 1992-8645 www.jatit.org E-ISSN: 1817-3195
351
4. RESULTS AND DISCUSSION
4.1 Evaluation Details Of Proposed Algorithm
Using MATLAB
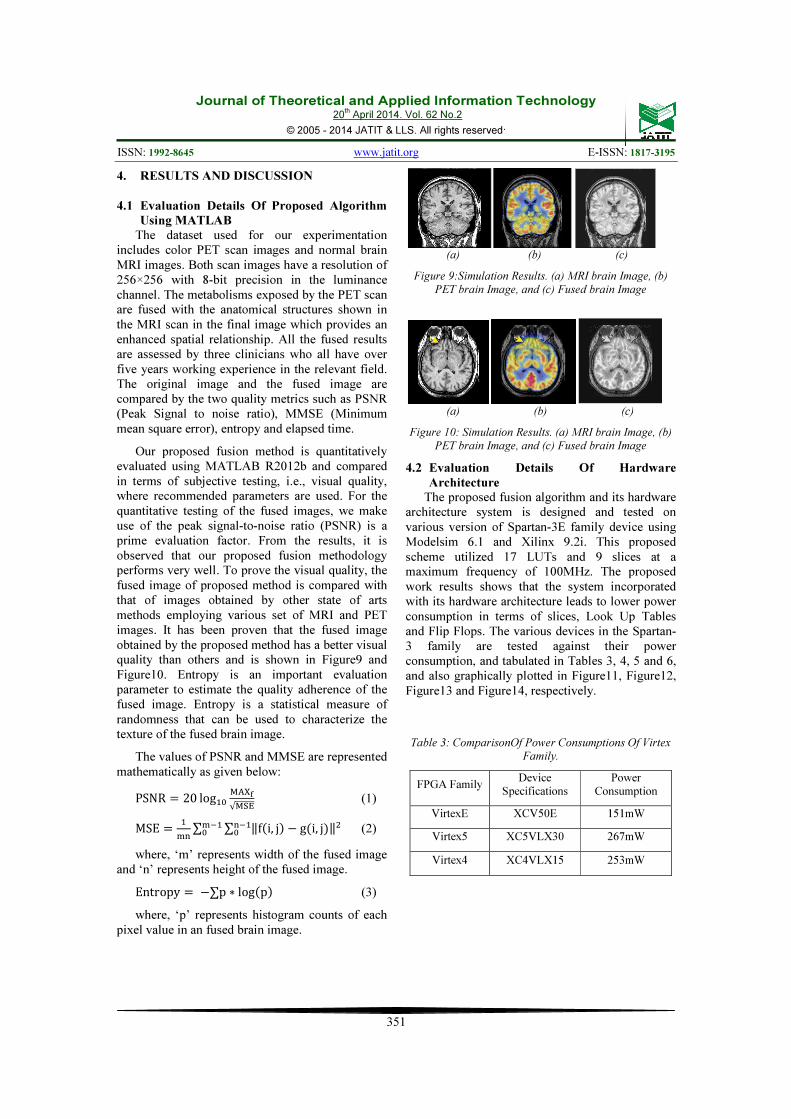
The dataset used for our experimentation includes color PET scan images and normal brain MRI images. Both scan images have a resolution of 256×256 with 8-bit precision in the luminance channel. The metabolisms exposed by the PET scan are fused with the anatomical structures shown in the MRI scan in the final image which provides an enhanced spatial relationship. All the fused results are assessed by three clinicians who all have over five years working experience in the relevant field. The original image and the fused image are compared by the two quality metrics such as PSNR (Peak Signal to noise ratio), MMSE (Minimum mean square error), entropy and elapsed time.
Our proposed fusion method is quantitatively evaluated using MATLAB R2012b and compared in terms of subjective testing, i.e., visual quality, where recommended parameters are used. For the quantitative testing of the fused images, we make use of the peak signal-to-noise ratio (PSNR) is a prime evaluation factor. From the results, it is observed that our proposed fusion methodology performs very well. To prove the visual quality, the fused image of proposed method is compared with that of images obtained by other state of arts methods employing various set of MRI and PET images. It has been proven that the fused image obtained by the proposed method has a better visual quality than others and is shown in Figure9 and Figure10. Entropy is an important evaluation parameter to estimate the quality adherence of the fused image. Entropy is a statistical measure of randomness that can be used to characterize the texture of the fused brain image.
The values of PSNR and MMSE are represented mathematically as given below:
PSNR � 20 log������
√��� (1)
MSE ��
∑ ∑ ‖f�i, j� � g�i, j�‖���
���� (2)
where, ‘m’ represents width of the fused image and ‘n’ represents height of the fused image.
Entropy � �∑p ∗ log�p� (3)
where, ‘p’ represents histogram counts of each pixel value in an fused brain image.
(a) (b) (c)
Figure 9:Simulation Results. (a) MRI brain Image, (b)
PET brain Image, and (c) Fused brain Image
(a) (b) (c)
Figure 10: Simulation Results. (a) MRI brain Image, (b)
PET brain Image, and (c) Fused brain Image
4.2 Evaluation Details Of Hardware
Architecture
The proposed fusion algorithm and its hardware architecture system is designed and tested on various version of Spartan-3E family device using Modelsim 6.1 and Xilinx 9.2i. This proposed scheme utilized 17 LUTs and 9 slices at a maximum frequency of 100MHz. The proposed work results shows that the system incorporated with its hardware architecture leads to lower power consumption in terms of slices, Look Up Tables and Flip Flops. The various devices in the Spartan-3 family are tested against their power consumption, and tabulated in Tables 3, 4, 5 and 6, and also graphically plotted in Figure11, Figure12, Figure13 and Figure14, respectively.
Table 3: ComparisonOf Power Consumptions Of Virtex
Family.
FPGA Family Device
Specifications
Power
Consumption
VirtexE XCV50E 151mW
Virtex5 XC5VLX30 267mW
Virtex4 XC4VLX15 253mW

Journal of Theoretical and Applied Information Technology 20
th April 2014. Vol. 62 No.2
© 2005 - 2014 JATIT & LLS. All rights reserved.
ISSN: 1992-8645 www.jatit.org E-ISSN: 1817-3195
352
Figure 11: Graphical Illustration Of Table 3
Table 4:Quiescent Parameters Evaluation In VIRTEXE
XCV50E Family.
Parameters Current (mA) Power (mW)
Quiescent form at 1.8V
80 144
Quiescent Vccaux
at
3.3V 2 6.60
Figure 12: Graphical Illustration Of Table 4
Table 5:Quiescent Parameters Evaluation InVIRTEX5
XC5VLX30 Family.
Parameters Current (mA) Power
(mW)
Quiescent form at
1V 168.72 168.72
Quiescent Vccaux
at
2.5V 38 95
Figure13: Graphical Illustration Of Table 5
Table 6:Quiescent Parameters Evaluation InSpartan-3e
XC3S500E Family.
Parameters Current (mA) Power
(mW)
Quiescent form at
1.2V 49.85 59.81
Quiescent Vccaux
at
2.5V 77.25 193.13
Figure14: Graphical Illustration Of Table 6
The proposed fusion architecture is implemented in 90nm CMOS technology. The post layout results of the proposed fusion architecture are summarized in Table 7, and the chip layout is shown in Figure15. The power consumption is 151mW.
A number of performance evaluation and resource utilization parameters are being used in the design of proposed fusion algorithm. The present research is focused on the design and development of efficient hardware architecture for low power applications. The parameters considered for
0
50
100
150
200
250
300
Xc3s500E Xc3s1200E Xc3s1600E
Po
we
r C
on
sum
ed
(m
W)
Spartan 3E family
0
50
100
150
200
Quiescent form at
1.8V
Quiescent Vccaux
at 3.3V
Current (mA) Power (mW)
0
50
100
150
200
Quiescent form at
1V
Quiescent Vccaux
at 2.5V
Current (mA) Power (mW)
0
50
100
150
200
250
Quiescent form at
1.2V
Quiescent Vccaux
at 2.5V
Current (mA) Power (mW)

Journal of Theoretical and Applied Information Technology 20
th April 2014. Vol. 62 No.2
© 2005 - 2014 JATIT & LLS. All rights reserved.
ISSN: 1992-8645 www.jatit.org E-ISSN: 1817-3195
353
investigation include Current and Power consumption (PC) and fusion latency.
(a) (b) (c)
Figure15:Simulation Results Of Proposed Technique. (a) RTL schematic view, (b) Technology schematic view and (c) Chip layout of proposed fusion IC
Table 7:Post Layout Results Of Proposed Architecture.
Technology CMOS 90nm
Clock frequency 100MHz
Power consumption 151mW
Memory size 164572kB
Table 8:Chip Summary Of FPGA Devices.
Family 3E 3E 3E
Device XCV50E XC5VLX30 XC4VLX15
Package CS144 FF324 SF363
Speed Grade
-8 -3 -12
The performance of Spartan devices is analyzed
based on Junction temperature and is tabulated in Table 9. The same is graphically illustrated in Figure16.
Table 9:Performance Analysis Based On Junction
Temperature.
Device Junction temperature
XCV50E 30.12°C
XC5VLX30 29.94°C
XC4VLX15 30.26°C
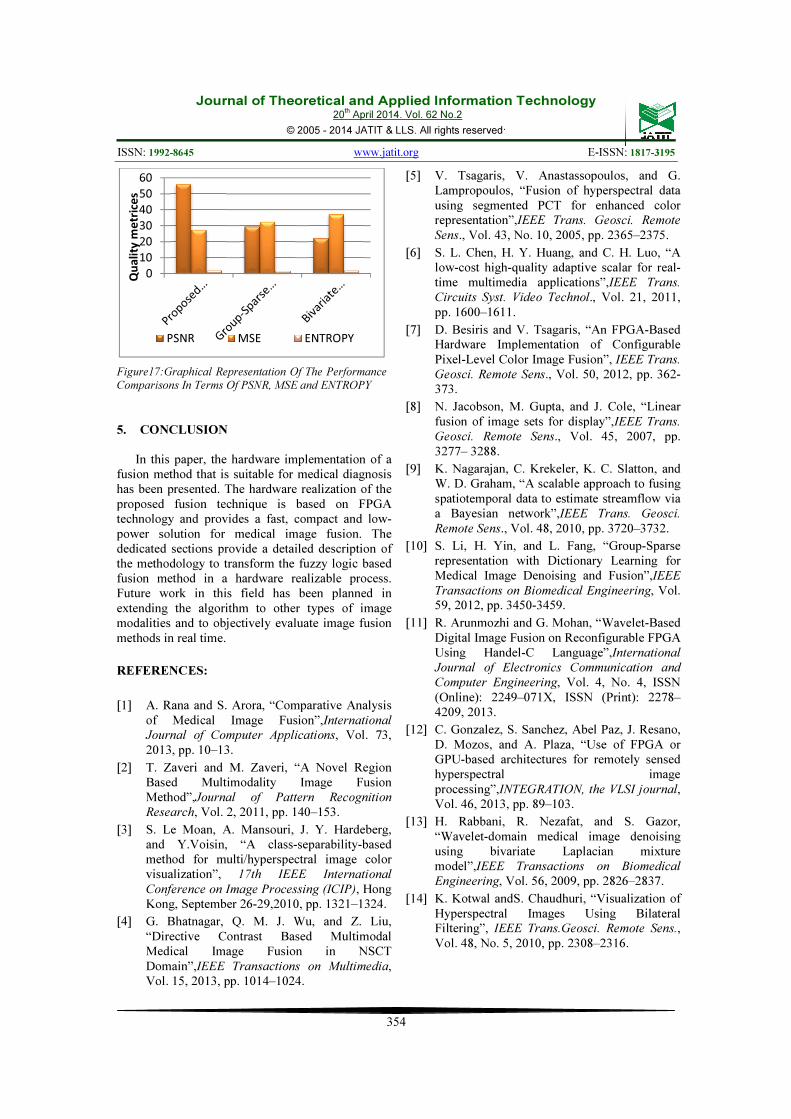
Table 10 illustrates the variation of PSNR, MSE
and Entropy. Figure17 graphically represents the variation of PSNR, MSE and Entropy.
Figure 16:Graphical Plot For Performance Based On
Junction Temperature
Table 10:Performance Comparison OfProposed Fusion
Method In Terms Of Quality Metrics.
Methodology PSNR MSE ENTROPY
Proposed
Methodology 56.23 27.41 2.0958
Group-Sparse
Algorithm [10] 29.54 32.56 1.7864
Bivariate Laplacian
mixture model [13] 22.16 37.19 1.9652
29.7
29.8
29.9
30
30.1
30.2
30.3
XCV50E XC5VLX30 XC4VLX15
Jun
ctio
n t
em
pe
ratu
re
(°C
)
Device Specification
Journal of Theoretical and Applied Information Technology 20
th April 2014. Vol. 62 No.2
© 2005 - 2014 JATIT & LLS. All rights reserved.
ISSN: 1992-8645 www.jatit.org E-ISSN: 1817-3195
354
Figure17:Graphical Representation Of The Performance
Comparisons In Terms Of PSNR, MSE and ENTROPY
5. CONCLUSION
In this paper, the hardware implementation of a fusion method that is suitable for medical diagnosis has been presented. The hardware realization of the proposed fusion technique is based on FPGA technology and provides a fast, compact and low-power solution for medical image fusion. The dedicated sections provide a detailed description of the methodology to transform the fuzzy logic based fusion method in a hardware realizable process. Future work in this field has been planned in extending the algorithm to other types of image modalities and to objectively evaluate image fusion methods in real time.
REFERENCES:
[1] A. Rana and S. Arora, “Comparative Analysis of Medical Image Fusion”,International
Journal of Computer Applications, Vol. 73, 2013, pp. 10–13.
[2] T. Zaveri and M. Zaveri, “A Novel Region Based Multimodality Image Fusion Method”,Journal of Pattern Recognition
Research, Vol. 2, 2011, pp. 140–153.
[3] S. Le Moan, A. Mansouri, J. Y. Hardeberg, and Y.Voisin, “A class-separability-based method for multi/hyperspectral image color visualization”, 17th IEEE International
Conference on Image Processing (ICIP), Hong Kong, September 26-29,2010, pp. 1321–1324.
[4] G. Bhatnagar, Q. M. J. Wu, and Z. Liu, “Directive Contrast Based Multimodal Medical Image Fusion in NSCT Domain”,IEEE Transactions on Multimedia, Vol. 15, 2013, pp. 1014–1024.
[5] V. Tsagaris, V. Anastassopoulos, and G. Lampropoulos, “Fusion of hyperspectral data using segmented PCT for enhanced color representation”,IEEE Trans. Geosci. Remote
Sens., Vol. 43, No. 10, 2005, pp. 2365–2375.
[6] S. L. Chen, H. Y. Huang, and C. H. Luo, “A low-cost high-quality adaptive scalar for real-time multimedia applications”,IEEE Trans.
Circuits Syst. Video Technol., Vol. 21, 2011, pp. 1600–1611.
[7] D. Besiris and V. Tsagaris, “An FPGA-Based Hardware Implementation of Configurable Pixel-Level Color Image Fusion”, IEEE Trans.
Geosci. Remote Sens., Vol. 50, 2012, pp. 362-373.
[8] N. Jacobson, M. Gupta, and J. Cole, “Linear fusion of image sets for display”,IEEE Trans.
Geosci. Remote Sens., Vol. 45, 2007, pp. 3277– 3288.
[9] K. Nagarajan, C. Krekeler, K. C. Slatton, and W. D. Graham, “A scalable approach to fusing spatiotemporal data to estimate streamflow via a Bayesian network”,IEEE Trans. Geosci.
Remote Sens., Vol. 48, 2010, pp. 3720–3732.
[10] S. Li, H. Yin, and L. Fang, “Group-Sparse representation with Dictionary Learning for Medical Image Denoising and Fusion”,IEEE
Transactions on Biomedical Engineering, Vol. 59, 2012, pp. 3450-3459.
[11] R. Arunmozhi and G. Mohan, “Wavelet-Based Digital Image Fusion on Reconfigurable FPGA Using Handel-C Language”,International
Journal of Electronics Communication and
Computer Engineering, Vol. 4, No. 4, ISSN (Online): 2249–071X, ISSN (Print): 2278–4209, 2013.
[12] C. Gonzalez, S. Sanchez, Abel Paz, J. Resano, D. Mozos, and A. Plaza, “Use of FPGA or GPU-based architectures for remotely sensed hyperspectral image processing”,INTEGRATION, the VLSI journal, Vol. 46, 2013, pp. 89–103.
[13] H. Rabbani, R. Nezafat, and S. Gazor, “Wavelet-domain medical image denoising using bivariate Laplacian mixture model”,IEEE Transactions on Biomedical
Engineering, Vol. 56, 2009, pp. 2826–2837.
[14] K. Kotwal andS. Chaudhuri, “Visualization of Hyperspectral Images Using Bilateral Filtering”, IEEE Trans.Geosci. Remote Sens., Vol. 48, No. 5, 2010, pp. 2308–2316.
0
10
20
30
40
50
60
Qu
ali
ty m
etr
ice
s
PSNR MSE ENTROPY


![Multi-focus Image Fusion Based on Muti-schemevigir.missouri.edu/~gdesouza/Research/Conference... · decomposition method [1, 2] and wavelet image fusion method. Wavelet image fusion](https://img.dokumen.tips/doc/110x75/5f610cf2ca7f86655445691a/multi-focus-image-fusion-based-on-muti-gdesouzaresearchconference-decomposition.jpg)