Embed Size (px)
Citation preview

ON LIQUEFACTION PHENOMENA, BY PROFESSOR A. CASAGRANDE: REPORT OF LECTURE
REPORTERS: P. A. GREEN, BSc., D.I.C., F.G.S., M.I.C.E. P. A. S. FERGUSON, M.A., S.M., M.I.C.E.
On 16 November 1970 Professor Arthur Casagrande of Harvard University presented a Lecture, entitled ‘On liquefaction phenomena’, jointly to BNCOLD and the British Geo- technical Society. The following is a summary of his Lecture.
After expressing his thanks to the joint Chairmen (Messrs H. H. Dixon and M. J. Tomlinson) for the opportunity to give the Lecture, Professor Casagrande said that he proposed to present the Lecture in two parts, the first. dealing with illustrated examples of liquefaction phenomena on the Earth and Moon, and the second with laboratory investigations on the liquefaction of sands.
EXAMPLES OF NATURAL LIQUEFACTION PHENOMENA The first of 23 illustrations used by Professor Casagrande to exemplify natural liquefaction
phenomena showed, diagrammatically, three adjacent flow slides that occurred in loose alluvial sands along the Zeeland coast of Holland. These slides contained a total volume of 7 million cu. yd of material and had a surface slope (after sliding) of 3”4”, this very shallow angle being indicative of the very small shear strength of the sand during the sliding process.
The second example was a liquefaction slide that occurred during the early part of 1949 in a point bar on the west bank of the Mississippi River near Baton Rouge. This slide was illustrated by a plan, section and aerial photograph which showed that the slide was situated on the inside of a bend and had a final surface slope of about 3”. Investigations revealed that the slide contained about 4 million cu. yd of fine sands. The Speaker suggested that deposition of sand in a point bar might occur within an upward branch of helicoidal currents which develop in river bends.
As a result of the Baton Rouge slide the U.S. Corps of Engineers discovered evidence of other liquefaction slides at point bars. Investigation of such slides led to the development of a technique for obtaining undisturbed samples of loose sand in mud-filled holes and of criteria to identify locations which present a possible slide hazard. At such places, the river levees are then constructed inland from the region of potential failure.
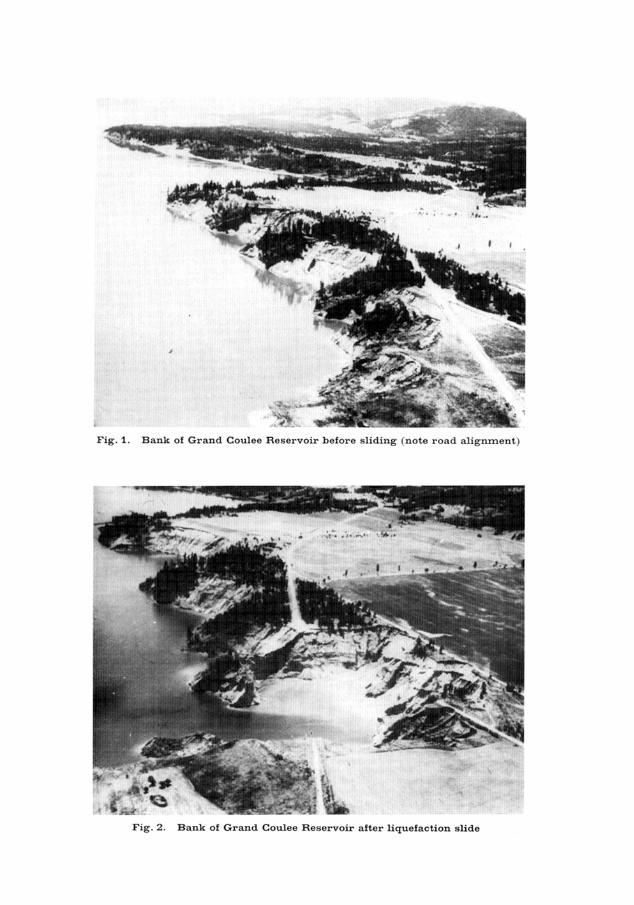
Professor Casagrande then showed two examples of slides, on the Columbia River in Washington State, in deposits containing lenses or layers of sand and silt. The first slide occurred in prehistoric times and contained about 100 million cu. yd of material. The almost horizontal surface of the slipped material was characterized by a series of lateral ridges trans- verse to the slide direction.
The second example occurred upstream of the first and in the reservoir of the Grand Coulee Dam. Two oblique aerial photographs (Figs 1 and 2) show the location of the slide before and after the failure. About 6 million cu. yd. of material slipped into the reservoir, severing a road (Fig. 2).
The partial failure of the Fort Peck Dam in 1938, during construction, was discussed, using three photographs and a diagrammatic cross section as illustration. In a matter of about three minutes, 10 million cu. yd of fill and foundation sands slipped into the reservoir. The maximum distance of this flow slide was 1400 ft and its final surface was nearly horizontal.
1 197

198 P. A. GREEN AND P. A. S. FERGUSON
Although no unanimously accepted reason for the failure was determined, Professor Casa- grande considered that it was triggered by movement in the Bearpaw shale (a clay shale con- taining beds of montmorillonite) which, with an overlying stratum of alluvial sand, formed the dam’s foundation. The resulting shear strains in the foundation sand and in the sand forming the upstream shell caused liquefaction. Over several days prior to the failure, rail tracks on the upstream slope had been going out of alignment.
Professor Casagrande then showed an aerial photograph of a flow slide in ‘quick’ clay in Ottawa, Canada. This type of slide can occur in very flat terrain. He also mentioned enormous submarine slides as examples of flow slides.
Although most liquefaction slides take place in loose silts and sands, Professor Casagrande used two photographs to illustrate the Iatent danger, often unappreciated, of such slides in industrial- and mining-waste deposits, which are often formed hydraulically from coarse silt- or sand-size particles. The first spectacular example described was a mine-tailings dam over 300 ft high. As could be seen in the photograph, the ‘dam’ consisted of a sun-baked skin of dry tailings formed by a labourer with a shovel. The second example was a photograph of a disastrous liquefaction slide of chemical tailings. At the time of failure the deposit was over 100 ft high and had slopes of about 1 horizontal to 26 vertical, with the retaining crust con- sisting only of desiccated material.
Professor Casagrande went on to describe three natural flow slides in which the fluid phase was mainly gas (he referred to this phenomenon as ‘fluidization’). The first example was a 400 million cu. yd slide of marble breccia which occurred at Blackhawk Canyon in the San Bernardino Mountains of South California, and was probably caused by an earthquake. The slide mass was 5 miles long, 2 miles wide and between 30 and 50 ft deep. The final surface slope of the slipped material was less than 24”.
The second fluidization example was a 40 million cu. yd slide across the Sherman Glacier in Alaska, triggered by the 1964 earthquake. The slide formed a blanket of broken rock 2 miles wide and lo-20 ft thick.
The third example was a fluidization slump in which the pore-air pressures dropped suffr- ciently quickly to arrest the mass before it had spread very far. The slide was in volcanic ash in a high mountain desert of Chile. As can be seen in Fig. 3, transverse cracks and ridges are apparent on the upper, substantially flat surface of this slide, which had an effective diameter of 1200 ft and a 500 ft high scarp.
In the last section of his description of liquefaction phenomena in Nature, Professor Casagrande referred to impact (meteorite) craters on the Earth and Moon. His examples included an aerial photograph of Wolf Creek Crater (Australia), the crater Copernicus and a crater on the far side of the Moon. He considered that, in such cases, there was a possi- bility that the fallback material, which probably contained large amounts of entrapped gas generated during the impact, was fluidized. Professor Casagrande’s main concern in the study of impact craters was the fact that they could yield valuable information about the behaviour of large excavations formed by nuclear explosion. Such information could not be reasonably inferred by extrapolation from the results of relatively small scale tests.
LABORATORY INVESTIGATIONS OF LIQUEFACTION OF SANDS
The concept of a critical void ratio was first postulated by him in the 1930s. The critical void ratio line, defined as the line joining void ratios during constant-volume deformation at different effective normal or minor principal stresses, was originally obtained from drained direct shear and consolidated drained (CD) triaxial tests.l
By means of a typical critical void ratio line derived from direct shear tests, he showed that
1 Throughout this Report the symbols CD and CU are used for consolidated and undrained tests, respec- tively; in Harvard nomenclature these would be S and R tests, or R if pore pressures are measured.


ON LIQUEFACTION PHENOMENA, BY A. CASAGRANDE: REPORT 199
shear strength and void ratio at constant volume deformation are dependent only on effective normal stress, whereas the shape of the stress-strain curves is dependent on the initial void ratio. The initially dense specimens developed a peak strength prior to constant volume deformation. The critical void ratio could be seen to decrease with increasing effective nor- mal stress, with an approximately straight-line relationship between critical void ratio and the logarithm of normal effective stress.
Professor Casagrande’s original hypothesis was that sands which plot above this critical void ratio line in their in situ state would be susceptible to liquefaction under undrained con- ditions, while those below would be safe against this type of failure. Investigations of the Fort Peck Dam slide, however, proved that sands, which according to such test results should be safe against liquefaction, had actually liquefied with a very large loss in strength. There- fore, he concluded that either his method for determining the critical void ratio or his entire concept of liquefaction of sands was faulty. Chiefly on the basis of his investigations of the Fort Peck Dam slide, he evolved the hypothesis that during flow the sand grains keep re- arranging themselves so as to create a minimum frictional resistance. He explained this ‘flow structure’ by analogy with a boulder flowing through a hydraulic pipe line which only in one position can be moved by the water without wedging in the pipe; and he suggested that the change from a ‘static structure’ to a ‘flow structure’ would explain the very large drop in resistance which is observed in a typical liquefaction slide.
It was not until recently that apparatus capable of inducing liquefaction in the laboratory was developed by Castro2 at Harvard. His apparatus employs load control, with pore pres- sures, strains and loads measured by means of transducers. End restraints of the specimens are reduced by using lubricated end-caps. A diagrammatic representation of the triaxial apparatus modified for cyclic loading was shown.
Tests were performed by Castro on Banding sand, a fine uniform sand with sub-rounded to sub-angular grains, and a D,, size of O-1 mm. Load was applied in small increments. CU- tests were carried out at initial effective confining pressures varying between 0.3 and 10.0 kg/ cm2 on specimens consolidated to relative densities ranging between 20 and 50%.
Several diagrams were shown by Professor Casagrande to illustrate the mechanism of liquefaction and the effects of relative density, initial confining pressure and method of loading. In showing these diagrams he made, inter alia, the following observations:
(a) There is a very large difference in the rates of strain before and after peak deviator stress. In the diagram giving the deviator stress-strain plot for a specimen consolidated to an initial confining pressure of 4.0 kg/cm2 at a relative density of 29O,&, peak deviator stress was reached in 16 min at a strain of 1% and the next 25% strain occurred in 0.15 s.
(b) During the flow condition the sand has a constant, though very small, shear strength, which in the example cited in (a) corresponded to a compressive strength of 0.2 kg/cm2.
(c) During the flow condition the induced pore pressure recorded on the specimen described in (a) was 3.9 kg/cm2 for an effective initial confining pressure of 4.0 kg/cm2.
(a) At constant effective initial confining pressure the mode of and shear strength at failure are dependent on the consolidated relative density. For specimens consolidated to an effective initial confining pressure of 4.0 kg/cm2, liquefaction occurred in a specimen consolidated to a relative density of 27%, limited liquefac- tion occurred in one consolidated to a relative density of 44% and dilative response occurred in one consolidated to 47%.
a See thesis by G. Castro submitted in partial fulfilment of a Doctorate in Philosophy at Harvard Uni- versity and reproduced in the Harvard Soil Mechanics Series No. 81, entitled Liquefaction of sands.

200 P. A. GREEN AND P. A. S. FERGUSON
072
W Start of CU test with pore-pressure measurement (after consolidation stage)
0 68 . Critical void ratioduring flow failure
kgflcm2
IO Ii0 Id00 kN/m 2
Effeective minor principal stress: G3
Fig.5. Summary of strain-controlled E triaxial test results for Banding sand
kgflcm 2
kNlm 2
I.0 100
I 100 1000
Effective minor principal stress: C’,
Fig. 6. Summary of CD triaxial test results for Banding sand

ON LIQUEFACTION PHENOMENA, BY A. CASAGRANDE: REPORT 201
(e) Co&active anisotropically consolidated specimens reach their peak strength at lower strains and at smaller peak strengths than comparable isotropically con- solidated specimens.
(f) The critical void ratios obtained from load-controlled triaxial CU-tests for isotropi- tally and anisotropically consolidated monotonic and cyclic loading tests in which limited or typical liquefactions occurred are plotted to a log effective minor principal stress base (see Fig. 4). The resulting line drawn through the points is designated the .ZF line. This critical void ratio line shows that with increasing effective minor principal stress the critical void ratio decreases. Also, the initial states of all the specimens in which total and partial liquefaction occurred lie to the right of (above) the .& line. The initial states of those specimens in which only limited liquefaction was observed lie closer to the ZF line than those in which substantial liquefaction occurred.
Professor Casagrande then compared the critical void ratio line obtained from strain- controlled triaxial CU-tests, the &, line, with the & line (see Fig. 5). The &, line is parallel to the 2, line and lies above it. Thus critical void ratios are higher under strain-control than under load-control conditions. The significant difference between these two types of test is that during liquefaction in a load control test the rate of deformation develops about 10 000 times faster than when conventional strain control is used.
The critical void ratios from consolidated-drained (CD) triaxial tests were also compared with the Z, and t& lines. As can be seen in Fig, 6, there is considerable scatter. At any particular void ratio the effective minor principal stress in the critical range can be up to ten times higher in the CD-test than in the load-controlled CU-test.
Professor Casagrande considered that these results supported his concept of flow structure which he defined as the orientation of grains in such a way as to offer minimum resistance to deformation. It is induced by constant-volume shear with an attendant increase in pore pressure. By controlling the rate of strain during constant-volume deformation such a flow structure does not form; hence the critical lines derived from CD and strain-controlled CU- tests differ from the & line, and err well on the unsafe side.
Professor Casagrande continued by considering liquefaction of sands induced by cyclic loading. Professor Seed and co-workers (Lee and Seed, 1967; Peacock and Seed, 1968; Seed and Lee, 1966) had carried out triaxial and shear box cyclic tests on undrained saturated sand specimens. As a result of these tests, they had reached the conclusion that the lower the initial effective confining pressure, the more easily will liquefaction occur, which is exactly the opposite of the conclusion derived from all investigations at Harvard. In an effort to resolve this contradiction, similar cyclic tests were carried out at Harvard. It was found that when medium dense and dense triaxial specimens were subjected to cyclic loading, they developed redistribution of the water content, with the top of the specimen accumulating water and becoming progressively softer with increasing number of cycles. The specimens, however, continued to show a dilative response and rapidly hardened in each cycle during straining. In each cycle the maximum pore pressure developed at the moment when the deviator stress (and the shear stresses) passed through zero. Professor Casagrande proposed the term ‘cyclic mobility’ for the progressive softening of a portion of the specimen which is observed on small laboratory specimens that are subjected to cyclic loading, but which are sufficiently dense to remain safe against liquefaction failure. In cyclic simple shear tests the boundary effects facilitate redistribution of the water content and cyclic softening as compared to cyclic triaxial tests.
Professor Casagrande described a simple cyclic test which he considered useful for demon- stration and termed the ‘poor boy’s simple shear test ‘. In this method the centre of atriaxial specimen was oscillated laterally by hand to failure. The specimen was then frozen and the

202 P. A. GREEN AND P. A. S. FERGUSON
distribution of water content determined. The central portion of the specimen, which had become very soft, had much higher water contents than the adjacent portions.
Professor Casagrande concluded by discussing the need for further research. He felt that the relevance of ‘cyclic mobility’ to in situ conditions should be investigated and more exten- sive research would be necessary before this factor could be assessed. It might be that speci- mens 10 or 15 ft in size would need to be tested, with an instrumented central zone which was not subject to the boundary effects that influence the small triaxial or simple shear specimens.
He emphasized that nature itself had carried out a considerable amount of testing in the form of earthquakes, and so on. It is possible that sands which have been subjected to severe earthquakes are rendered safe against further liquefaction. Sands subjected to such natural phenomena should be investigated. A great deal of work was still necessary to develop a reliable method for determining in situ sand densities. The dynamic standard penetration test used for estimating the in situ relative densities of sands was very unreliable. Professor Casagrande preferred undisturbed sampling and laboratory determination of rela- tive density, but even this procedure he considered unreliable.
The difference in relative density of sensitive and insensitive sands is small but, from the results of Castro’s experiments, Professor Casagrande considered that ordinary sands with a relative density of more than 50% would be safe against liquefaction. He was confident that liquefaction induced in the small scale tests at Harvard was representative of in situ failure conditions because during the flow condition for strains of 20% or more the measured residual load and pore pressure remained remarkably constant.
REFERENCES
LEE, K. L. & SEED, H. B. (1967). Cyclic stress conditions causing liquefaction of sands. Am. Sot. Cis. Engrs, Jnl Soil Mech. Fdn Divn 93 (SMl) 47-70.
PEACOCK, W. H. $ SEED, H. B. (1968). Sand liquefaction under cyclic loading simple shear conditions. Am. Sot. Civ. Engrs, Jnl Soil Mech. Fdn Diun 94 (SM3) 689-708.
SEED, H. B. & LEE, K. L. (1966). Liquefaction of saturated sands during cyclic loading. Am. Sm. Civ. Engrs, Jnl Soil Mech. Fdn Divn 92 (SM6) 105-134.