Embed Size (px)
Citation preview

MONTHLY
Annual Report IssueFEDERAL RESERVE BANK OF MINNEAPOLIS
JANUARY 1965
Digitized for FRASER http://fraser.stlouisfed.org/ Federal Reserve Bank of St. Louis

Digitized for FRASER http://fraser.stlouisfed.org/ Federal Reserve Bank of St. Louis

Dist l t t developments in 1964
A he Ninth district’s economic performance in 1964 was, on the whole, a rather subdued replica of major national patterns of growth. Many district production measures continued to expand, though none spectacularly, and most at less than national rates.
The important agricultural sector fell short of its previous year’s performance as a generator of district income — by some 5 per cent. (Agriculture normally accounts for about one-tenth of the district’s total personal income.) A major factor contributing to the drop was lower farm prices, although declines in crop production also figure in the showings. Dollar receipts from marketings of livestock during 1964 remained at about the level achieved the previous year in spite of lower prices, while reduced receipts from crops served to pull total cash from marketings below the three- and-a-third billion dollar level. The fact that government payments to district farmers — at nearly one-third billion dollars — were up 24 per cent over the preceding year helped soften the impact of the estimated decline in receipts from marketings.
In the nonfarm sector, 1964 witnessed modest improvements in most industrial activity — employment totals, unemployment rates, production and shipments of raw materials and products, and construction. Again these improvements tended to be at lesser rates than those which held for the nation as a whole.
The over-all balance of effects appears to have resulted in an increase in district personal income
flows of the order of 4 per cent during the year. Some of the increased earnings has presumably shown up in expanded buying by consumers, although the fragmentary sales data available suggest that the over-all rise in consumption purchases was rather small. District automobile buying shared some of the surge that output and sales boosts caused nationwide in 1964 — and this presumably also helped shape the expansion in instalment credit that took place at some district banks.
Consumers apparently also chose to add some of their increased incomes directly to their savings balances: they continued the rather substantial build-up of savings at the district’s commercial banks that has persisted since 1961. In fact the expansion in savings deposits of more than a quarter-billion dollars absorbed much of the indicated half-billion dollar increase in personal income. Undoubtedly consumers chose to place some of their increased income in commercial banks, although just how much of the increased bank savings was simply diverted from other savings institutions, or was made at the expense of “ normal” demand deposit growth, is unknown.
In any event, the great bulk of 1964’s deposit increase at district member banks was accounted for by the boost in interest-paying time deposits, but little by the rise in demand deposits. The concomitant increase in member bank earning assets during 1964 followed a relatively similar pattern to that of the preceding year, with funds going mostly into loans.
The foregoing comments highlight the district’s
JANUARY 1965 3Digitized for FRASER http://fraser.stlouisfed.org/ Federal Reserve Bank of St. Louis
economic performance in 1964. Particulars follow under three major headings: agriculture, banking and business.
AgricultureThe Ninth district farm economy dipped slightly
in 1964 as generally unfavorable price levels and a mixture of good and bad crop outputs led to lower cash incomes. Prices for many major commodities ran below those of a year earlier with the most notable differentials existing in wheat and feeder cattle prices. Livestock prices were down for the most part relative to 1963, although price strength in some beef classes, in hogs, and in sheep in the fall months brightened the income picture to some extent. About the only price category to run consistently above 1963 was “ all milk.” The sharply lower wheat prices in 1964 reflected the new wheat program, a change that brought the average market price down about 50 cents per bushel at the farm level. Corn prices, which started the year at higher levels than those of a year earlier, fell during the fall months to levels just under those of 1963.
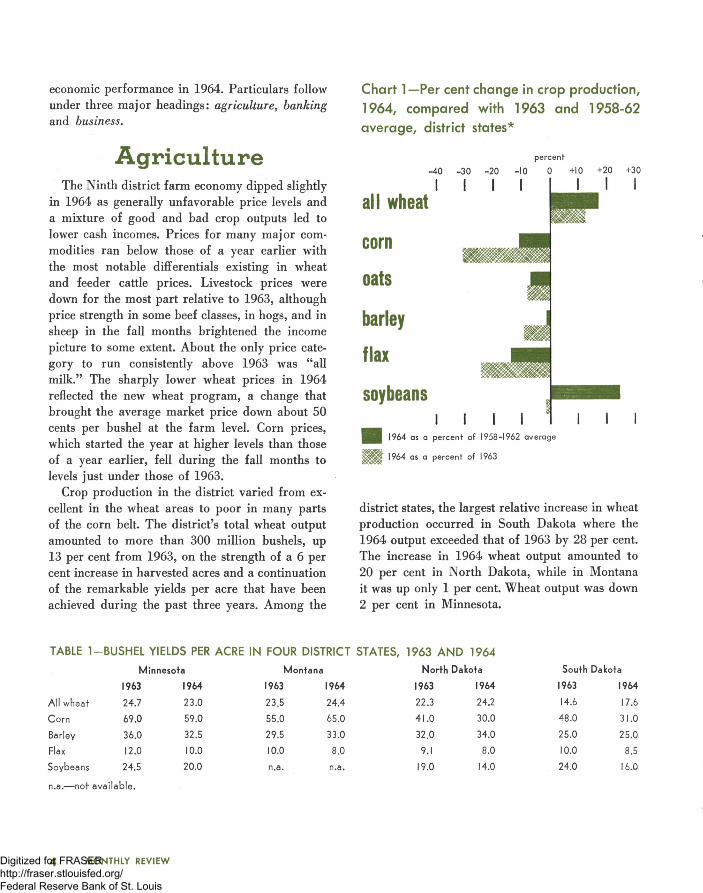
Crop production in the district varied from excellent in the wheat areas to poor in many parts of the corn belt. The district’s total wheat output amounted to more than 300 million bushels, up 13 per cent from 1963, on the strength of a 6 per cent increase in harvested acres and a continuation of the remarkable yields per acre that have been achieved during the past three years. Among the
Chart 1—Per cent change in crop production, 1964, compared with 1963 and 1958-62 average, district states*
percent
-40 -30 -20 -10 0 +10 +20 +30
Iall wheat
corn
oats
barley
flax
soybeansi
| 1964 as a percent of 1958-1962 average
1964 as a percent of 1963
district states, the largest relative increase in wheat production occurred in South Dakota where the 1964 output exceeded that of 1963 by 28 per cent. The increase in 1964 wheat output amounted to 20 per cent in North Dakota, while in Montana it was up only 1 per cent. Wheat output was down 2 per cent in Minnesota.
TABLE 1-B U SH E L YIELDS PER ACRE IN FOUR DISTRICT STATES, 1963 A N D 1964
Minnesota Montana North Dakota South Dakota
1963 1964 1963 1964 1963 1964 1963 1964
All wheat 24.7 23.0 23.5 24.4 22.3 24.2 14.6 17.6
Corn 69.0 59.0 55.0 65.0 41.0 30.0 48.0 31.0
Barley 36.0 32.5 29.5 33.0 32.0 34.0 25.0 25.0
Flax 12.0 10.0 10.0 8.0 9.1 8.0 10.0 8.5
Soybeans 24.5 20.0 n.a. n.a. 19.0 14.0 24.0 16.0
n.a.— not available.
4 MONTHLY REVIEWDigitized for FRASER http://fraser.stlouisfed.org/ Federal Reserve Bank of St. Louis
Feed grain output in the district was typically under that of the previous year with the exception of oat production in North Dakota and barley in Montana. Harvested acres of feed grains were down in all states. The mid-summer drought severely reduced yields of corn, the major feed grain: district output totaled nearly 360 million bushels, down 31 per cent from 1963. The 1964 corn crop in Minnesota, the district’s major corn producer, was 23 per cent under that of 1963 while the South Dakota crop equaled only 53 per cent of the year-earlier output.
Cash receipts down
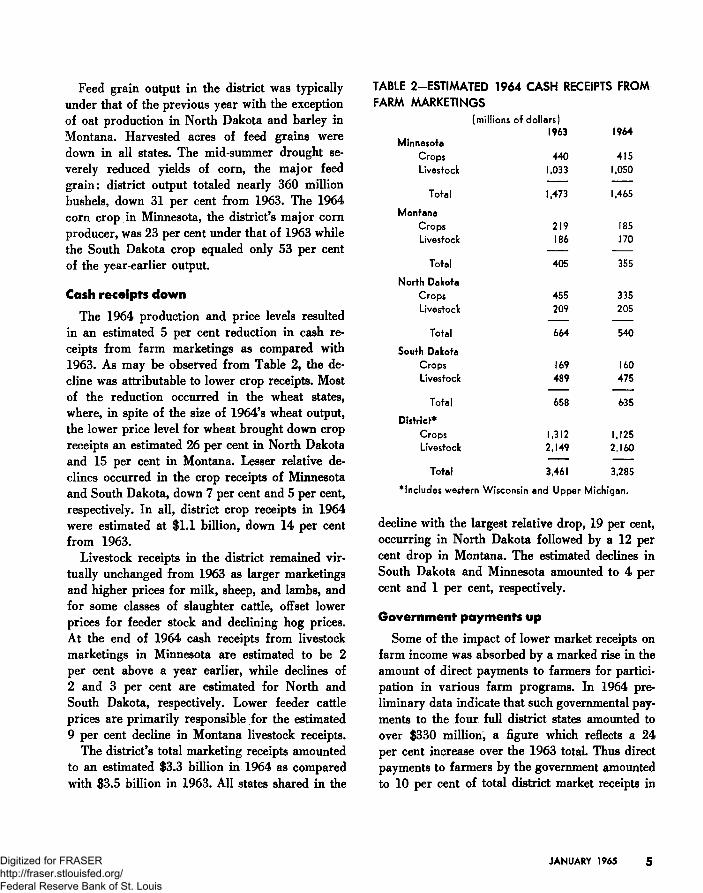
The 1964 production and price levels resulted in an estimated 5 per cent reduction in cash receipts from farm marketings as compared with1963. As may be observed from Table 2, the decline was attributable to lower crop receipts. Most of the reduction occurred in the wheat states, where, in spite of the size of 1964’s wheat output, the lower price level for wheat brought down crop receipts an estimated 26 per cent in North Dakota and 15 per cent in Montana. Lesser relative declines occurred in the crop receipts of Minnesota and South Dakota, down 7 per cent and 5 per cent, respectively. In all, district crop receipts in 1964 were estimated at $1.1 billion, down 14 per cent from 1963.
Livestock receipts in the district remained virtually unchanged from 1963 as larger marketings and higher prices for milk, sheep, and lambs, and for some classes of slaughter cattle, offset lower prices for feeder stock and declining hog prices. At the end of 1964 cash receipts from livestock marketings in Minnesota are estimated to be 2 per cent above a year earlier, while declines of 2 and 3 per cent are estimated for North and South Dakota, respectively. Lower feeder cattle prices are primarily responsible for the estimated 9 per cent decline in Montana livestock receipts.
The district’s total marketing receipts amounted to an estimated $3.3 billion in 1964 as compared with $3.5 billion in 1963. All states shared in the
TABLE 2—ESTIMATED 1964 CASH RECEIPTS FROM FARM MARKETINGS
(millions of dollars)1963 1964
MinnesotaCrops 440 415Livestock 1,033 1,050
------------ ------------
Total 1,473 1,465
MontanaCrops 219 185Livestock 186 J70
---- ----Total 405 355
North DakotaCrops 455 335Livestock 209 205
Total 664 540
South DakotaCrops 169 160Livestock 489 475
—— • — ——
Total 658 635
D is t r ic tCrops 1,312 1,125Livestock 2,149 2,160
•..........- ----Total 3,461 3,285
* Includes western Wisconsin and Upper Michigan.
decline with the largest relative drop, 19 per cent, occurring in North Dakota followed by a 12 per cent drop in Montana. The estimated declines in South Dakota and Minnesota amounted to 4 per cent and 1 per cent, respectively.
Government payments up
Some of the impact of lower market receipts on farm income was absorbed by a marked rise in the amount of direct payments to farmers for participation in various farm programs. In 1964 preliminary data indicate that such governmental payments to the four full district states amounted to over $330 million, a figure which reflects a 24 per cent increase over the 1963 total. Thus direct payments to farmers by the government amounted to 10 per cent of total district market receipts in
JANUARY 1965 5Digitized for FRASER http://fraser.stlouisfed.org/ Federal Reserve Bank of St. Louis

1964 as compared with 8 per cent in 1963 and 3 per cent in 1960.
Most of the increase in program payments is the result of the 1964 wheat program which brought into the district an estimated $112 million in combined certificate and land diversion payments, a figure which compares to $60 million paid to district wheat farmers under the 1963 program. The largest share of these 1964 payments went to North Dakota and Montana where wheat producers received $57 million and $28 million, respectively. Payments under the 1964 feed grain program amounted to an estimated $141 million in the district, up $33 million from a year ago. Payments under the other major program, the soil bank, continued to decline as acres were withdrawn from the conservation reserve. This latter program provided an estimated $44 million in farm income in 1964, down $25 million from the 1963 total.
The increment to cash farm income provided by
Chart 2—Cash farm receipts,* Ninth district
the expanded government programs not only partially closed the gap between the 1964 total and that of 1963, but it has also acted as a stabilizing factor for farm income over the past few years (see Chart 2 ).
BankingDistrict member bank growth during 1964 as
measured by deposit and credit activity proceeded at much the same pace as in 1963, but both years fell substantially below 1962.
Total deposits at district member banks moved 6 per cent higher in 1964 to match the relative gain recorded in 1963 (see Table 1 ). Not only were the gains in total deposits the same in both years, but the gains in the components were similar. In 1964 demand deposits edged 2 per cent higher, while time and savings deposits rose by 13 per cent to provide most of the gain in the deposit total. The same pattern prevailed in 1963.
I960
1961
1962
1963
1964
1,000
CROPCASH RECEIPTS
LIVESTOCK. CASH RECEIPTS
2,000
r / A v r ^ v V . G O V ER N M EN T PAYMENTS * *
3,000 4,000
millions of dollars*
1964 figures are estimated **government payment figures are for four full states only
^Minnesota, Montana, North Dakota, and South Dakota
6 MONTHLY REVIEWDigitized for FRASER http://fraser.stlouisfed.org/ Federal Reserve Bank of St. Louis

TABLE 1-PERCENTAGE CHANGES IN DEPOSITS AT NINTH DISTRICT MEMBER BANKS
(mid-December to mid-December)
1964 1963 1962All Member Banks
Total Deposits 6% 6% 9%Gross Demand 2 2 1Time and Savings 13 13 24
City BanksTotal Deposits 3 ♦ 12
Gross Demand ** — 4 — 1Time and Savings 8 9 64
Country BanksTotal Deposits 8 10 8
Gross Demand 3 6 2Time and Savings 14 14 16
*Down less than I per cent. **Up less than I per cent.
Further, time and savings deposits at city and at country banks also showed substantially the same rate of growth in 1964 and 1963. The similarity pattern is upset, however, when a comparison is made of demand deposit behavior. During 1964 demand deposits at city banks showed no significant change, whereas in 1963 a 4 per cent contraction was recorded. This 1964 relative improvement at city banks, nevertheless, was offset at country banks where demand deposits grew at only one-half the 1963 rate.
District deposit growth in 1964 and 1963, however, did not match the strong deposit expansion which took place in 1962. The principal reason for the 1962 upsurge stemmed from changes in Regulation Q made at the beginning of that year which permitted member banks to raise their allowed rate of interest payable on both time and savings deposits. District city banks, faced with growing competition for savings deposits from other savings institutions and from the short-term money market, immediately increased their rates— in the case of time deposits by the full additional amount allowed. As a result, the time and savings deposit growth rate showed a substantial increase in 1962. Having virtually exhausted the rate increases al
lowable by Regulation Q the previous year, however, city banks in 1963 and 1964 were able to increase interest rates only slightly, and time and savings deposits advances proceeded at a much lower rate during the last two years. At district country banks, on the other hand, competition for savings deposits was less keen. Interest rates rose only moderately in 1962 providing considerable leeway for increases in the interest rates in the succeeding two years. The effect of this development may be observed in the relative steadiness of time and savings deposit expansion at country banks over the last three years.
Loans upLoans at district member banks, excluding loans
to other commercial banks, rose 10 per cent during 1964—matching loan expansion in 1963, but falling somewhat short of the 13 per cent loan increment in 1962 (see Table 2). Country bank loans in 1964 were down slightly from those of the previous year, but the decline was offset entirely by
TABLE 2-PERCENTAGE CHANGES IN LOANS AND INVESTMENTS AT NINTH DISTRICT MEMBER BANKS
(mid-December to mid-December)
1964 1963 1962A ll Member Banks
Total Loans and Investments, adj. * 8% 7% M%Loans, adjusted* 10 10 13Investments 6 2 8
U.S. Government securities 1 — 3 6Other securities 17 17 14
City BanksTotal Loans and Investments, adj. 8 3 13
Loans, adjusted 9 7 15Investments 7 — 4 8
U.S. Government securities 1 — II 4Other securities 19 15 21
Country BanksTotal Loans and Investments 8 9 9
Loans I I 12 IIInvestments 6 5 7
U.S. Government securities 2 1 6Other securities 16 17 II
* Ad justed loans equal loans (net of valuation reserves) minus loans to other commercial banks.
JANUARY 1965 7Digitized for FRASER http://fraser.stlouisfed.org/ Federal Reserve Bank of St. Louis

TABLE 3—PERCENTAGE CHANGES IN LOANS AND INVESTMENTS AT NINTH DISTRICT CITY BANKS
(mid-December to mid-December)
1964 1963 1962Loans, adjusted 9% 7% 15%
Commercial and industrial 7 6 15Nonbank financial institutions 24 9 35Real estate 12 14 9All other loans 4 2 6
Investments 7 — 4 8U. S. Government securities 1 — 1 1 3
Under 5 year maturities —- 5 — 17 — 15Over 5 year maturities 15 9 221
Other securities 19 15 24
trends at city banks: 1964 loans advanced relativeto those of 1963.
An expansion of consumer loans appears to have been the principal factor behind the stronger loan advance at city banks during 1964 relative to1963 (see Table 3). Both loans to nonbank financial institutions, which represent indirect loans to consumers, and “ all other loans,” which includes direct consumer loans, reflected strong advances in 1964 relative to the previous year. Auto instalment credit comprises a substantial element of both categories, and since there appears to be a strong correlation between auto sales and volume of auto instalment credit extended, it is not too surprising that the increased volume of auto sales in the district during 1964 should be reflected in a higher rate of increase in these loan categories.
Commercial and industrial loans at district city banks continued to lag in 1964 after their rate of expansion had been greatly reduced in 1963 from that of the previous year. This lag exerted a drag on the rate of loan expansion at city banks because commercial and industrial loans comprise such a large share of total loans. The comparatively slower rate of growth of loans at city banks thus exerted a depressing impact on district bank credit in 1964 and 1963 compared to that in 1962. Since a close association exists between business loans and inventory accumulation, the slowdown in business loan expansion perhaps indicates that
district city bank credit has not been used to build inventory stockpiles.
In adding to their investment portfolios during 1964, district banks continued to depend heavily on “ other securities,” comprised substantially of municipal and federal agency obligations (see Tables 2 and 3). Such investment in higher yielding (in the case of municipals, on an after-tax basis) albeit riskier securities was in answer to the need by banks to offset the higher interest cost arising from both the increased volume of time and savings deposits and the higher rates of interest paid on those deposits. Long-term U. S. government bonds on the basis of city bank behavior, likewise, were a favored investment because of their recent history of relatively high and stable yields. But the need for relatively high yields in investment portfolios also induced district city banks to reduce holdings of shorter-term U. S. government securities. The rate of disinvestment of these securities, however, was lower in1964 than in the previous two years. In 1963 deposit losses at city banks forced a higher than usual selloff of short-term U. S. governments, while in 1962 the rapid rise of time deposits relative to demand deposits likely induced an unusually large rate of transfer to the longer-term investment category.
Rate and regulation changes
In late November the Federal Reserve System both increased its discount rate on loans to member banks and liberalized certain provisions of Regulation Q. The objective of the discount rate increase (from 3% to 4 per cent) was to discourage an increase in the outflow of capital abroad in response to an upward movement of short-term interest rates in Britain which followed an increase in discount rate (from 5 to 7 per cent) by the Bank of England. Such outflows would otherwise tend to widen the United States balance of payments deficit.
Regulation Q was changed to permit member banks to increase (from 3 to 4 per cent) the
8 MONTHLY REVIEWDigitized for FRASER http://fraser.stlouisfed.org/ Federal Reserve Bank of St. Louis

maximum interest rate payable on savings deposits held less than one year. (Banks were already permitted to pay 4 per cent on savings deposits held one year and longer). Member banks were also permitted to increase interest rates on time deposits (including negotiable certificates of deposit [CD’s ] ) to 4 per cent on those maturing in less than 90 days, and to 4% per cent on those having longer maturities. The previous limits were 1 per cent on less-than-90-day-maturities and 4 per cent on longer maturities. The purpose of the changes in Regulation Q was to encourage the flow of savings to member banks in order to maintain an ample supply of credit for domestic investment.
It is still too early to ascertain the effect of the most recent change in Regulation Q on district bank deposits. The state of Minnesota, for example, presently prohibits interest payments of more than 4 per cent. Should this prohibition remain effective while interest rates paid by New York and other large city banks go up, the larger banks in Minnesota, since they could not compete, might experience an outflow of CD’s. Such a development would pose a real problem to Minnesota banks and force them to consider other means of obtaining resources.
BusinessDistrict business activity during 1964 was stim
ulated by the $11.5 billion federal tax cut which became effective March 5. This measure boosted both personal consumption expenditures and savings, especially in the larger district cities. Rising aggregate consumer demand expanded markets for manufactured products and minerals which, in turn, served to initiate the building and installation of new manufacturing facilities. District resorts also benefited from the sharp rise in disposable consumer income. In the construction field, activity, which was dominated by federal projects in some areas, apparently was less noticeably affected by the tax cut.
A weak spot was the contraction in home building stemming largely from conditions peculiar to the Ninth district. The demand for new housing is, in part, determined by the rate of regional economic growth; and all district states still suffer a net out-migration of population with its consequent depressing effect upon residential building.
Nature of the expansion
In 1964 payroll and proprietors’ income from district manufacturing rose approximately 3 per cent, thus revealing a significant expansion in the output of industrial products. Despite large cutbacks in government contracts for hard goods, the expansion was concentrated in durable products. Marked increases were recorded in the categories of electrical and nonelectrical machinery, transportation equipment, and furniture and fixtures. While the output of nondurables also expanded, it was at a much slower rate. A marked increase did occur in the output of textile products and apparel.
The expansion in industrial production was accompanied by an acceleration in capital investment. From May through September, the dollar valuation of building permits authorizing industrial building was nearly two and one-half times the amount a year earlier. Further evidence of industrial and commercial expansion was noted in the steady rise in business loans at large commercial banks in the district.
In Minnesota, where much of the district’s manufacturing is located, detailed information concerning new industrial facilities is available. According to compilations made by the Minnesota Department of Business Development, 149 new plants (including major warehouse facilities) were erected on new sites and began operations during 1964. These plants, and their equipment, represented a capital investment of $87,270,000 and called for the employment of 11,700 workers. This latter number, however, did not represent a net increase in manufacturing employment since some workers were transferred from old plants.
JANUARY 1965 9Digitized for FRASER http://fraser.stlouisfed.org/ Federal Reserve Bank of St. Louis
In addition to the entirely new plant operations, 171 expansions (defined as an addition to an operating facility or new plant built on an adjoining site) were completed in Minnesota during 1964. The investment involved aggregated $100,- 300,000; employment, 3,600 workers.
With the exception of home building, construction put-in-place was at a high level during 1964. Commercial redevelopment in urban centers as well as highway and bridge construction moved ahead at a rapid pace. The new missile base complex under construction in North Dakota added significantly to the total regional activity.
Mineral production
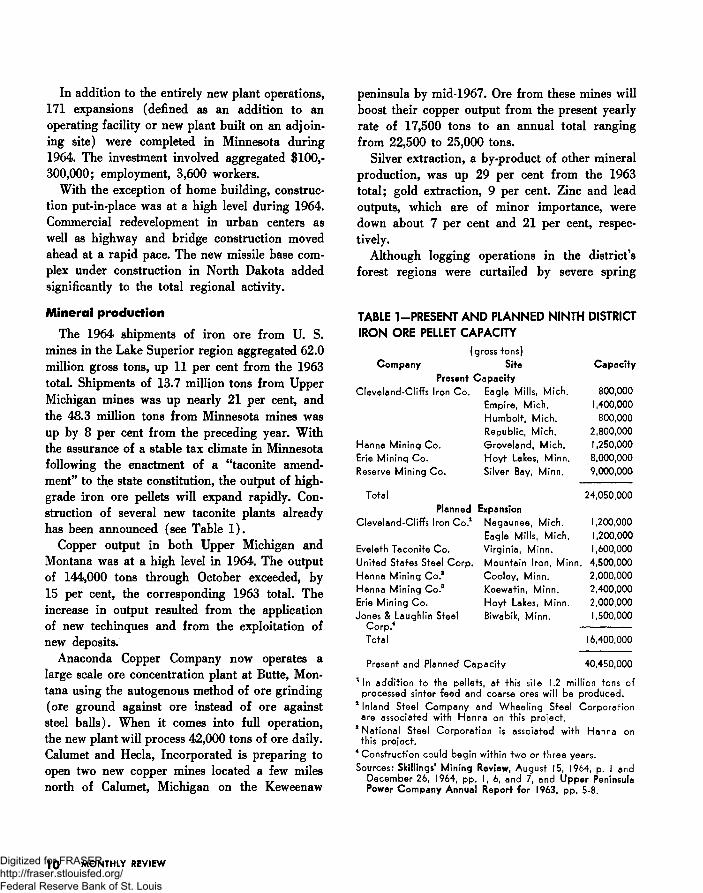
The 1964 shipments of iron ore from U. S. mines in the Lake Superior region aggregated 62.0 million gross tons, up 11 per cent from the 1963 total. Shipments of 13.7 million tons from Upper Michigan mines was up nearly 21 per cent, and the 48.3 million tons from Minnesota mines was up by 8 per cent from the preceding year. With the assurance of a stable tax climate in Minnesota following the enactment of a “ taconite amendment” to the state constitution, the output of high- grade iron ore pellets will expand rapidly. Construction of several new taconite plants already has been announced (see Table 1).
Copper output in both Upper Michigan and Montana was at a high level in 1964. The output of 144,000 tons through October exceeded, by 15 per cent, the corresponding 1963 total. The increase in output resulted from the application of new techinques and from the exploitation of new deposits.
Anaconda Copper Company now operates a large scale ore concentration plant at Butte, Montana using the autogenous method of ore grinding (ore ground against ore instead of ore against steel balls). When it comes into full operation, the new plant will process 42,000 tons of ore daily. Calumet and Hecla, Incorporated is preparing to open two new copper mines located a few miles north of Calumet, Michigan on the Keweenaw
peninsula by mid-1967. Ore from these mines will boost their copper output from the present yearly rate of 17,500 tons to an annual total ranging from 22,500 to 25,000 tons.
Silver extraction, a by-product of other mineral production, was up 29 per cent from the 1963 total; gold extraction, 9 per cent. Zinc and lead outputs, which are of minor importance, were down about 7 per cent and 21 per cent, respectively.
Although logging operations in the district’s forest regions were curtailed by severe spring
TABLE 1-PRESENT AND PLANNED NINTH DISTRICT IRON ORE PELLET CAPACITY
(gross tons)Company Site Capacity
Present CapacityCleveland-Cliffs Iron Co. Eagle Mills, Mich. 800,000
Empire, Mich. 1,400,000Humbolt, Mich. 800,000Republic, Mich. 2,800,000
Hanna Mining Co. Groveland, Mich. 1,250,000Erie Mining Co. Hoyt Lakes, Minn. 8,000,000Reserve Mining Co. Silver Bay, Minn. 9,000,000
Total 24,050,000Planned Expansion
Cleveland-Cliffs Iron Co.1 Negaunee, Mich. 1,200,000Eagle Mills, Mich. 1,200,000
Eveleth Taconite Co. Virginia, Minn. 1,600,000United States Steel Corp. Mountain Iron, Minn. 4,500,000Hanna Mining Co.a Cooley, Minn. 2,000,000Hanna Mining Co.8 Keewatin, Minn. 2,400,000Erie Mining Co. Hoyt Lakes, Minn. 2,000,000Jones & Laughlin Steel Biwabik, Minn. 1,500,000
Corp.4Total 16,400,000
Present and Planned Capacity 40,450,000
1 In addition to the pellets, at this site 1.2 million tons of processed sinter feed and coarse ores will be produced.
2 Inland Steel Company and Wheeling Steel Corporation are associated with Hanna on this project.
8 National Steel Corporation is assoiated with Hanna on this project.
4 Construction could begin within two or three years.Sources: Skillings' Mining Review, August 15, 1964, p. I and
December 26, 1964, pp. I, 6, and 7, and Upper Peninsula Power Company Annual Report for 1963, pp. 5-8.
10 MONTHLY REVIEWDigitized for FRASER http://fraser.stlouisfed.org/ Federal Reserve Bank of St. Louis
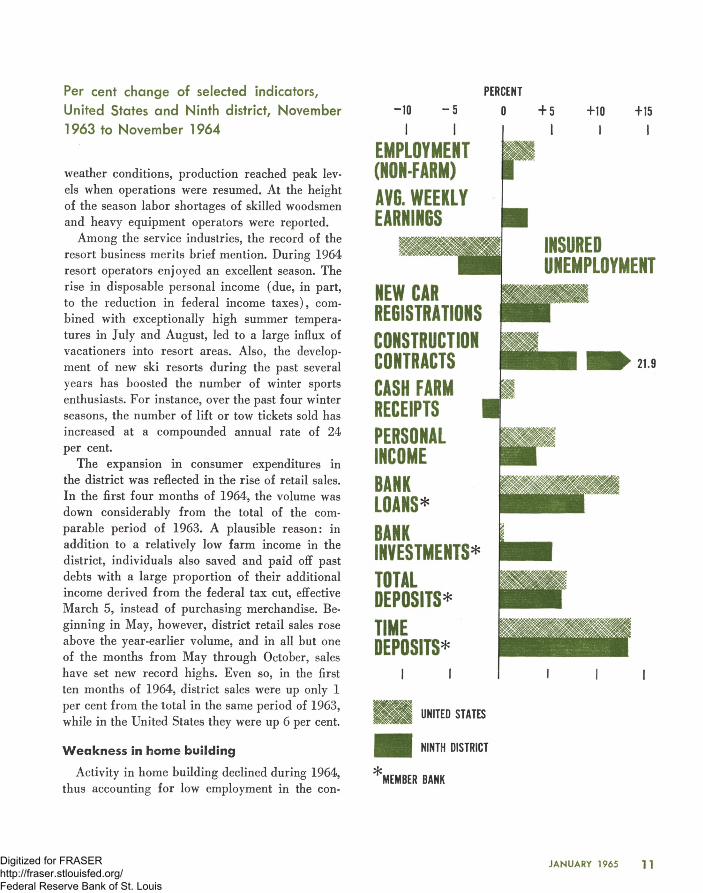
Per cent change of selected indicators, United States and Ninth district, November 1963 to November 1964
weather conditions, production reached peak levels when operations were resumed. At the height of the season labor shortages of skilled woodsmen and heavy equipment operators were reported.
Among the service industries, the record of the resort business merits brief mention. During 1964 resort operators enjoyed an excellent season. The rise in disposable personal income (due, in part, to the reduction in federal income taxes), combined with exceptionally high summer temperatures in July and August, led to a large influx of vacationers into resort areas. Also, the development of new ski resorts during the past several years has boosted the number of winter sports enthusiasts. For instance, over the past four winter seasons, the number of lift or tow tickets sold has increased at a compounded annual rate of 24 per cent.
The expansion in consumer expenditures in the district was reflected in the rise of retail sales. In the first four months of 1964, the volume was down considerably from the total of the comparable period of 1963. A plausible reason: in addition to a relatively low farm income in the district, individuals also saved and paid off past debts with a large proportion of their additional income derived from the federal tax cut, effective March 5, instead of purchasing merchandise. Beginning in May, however, district retail sales rose above the year-earlier volume, and in all but one of the months from May through October, sales have set new record highs. Even so, in the first ten months of 1964, district sales were up only 1 per cent from the total in the same period of 1963, while in the United States they were up 6 per cent. UNITED STATES
W e a k n e ss in hom e b u ild in g H H DISTRICT
Activity in home building declined during 1964, ^ ucllDtD DAy„, , , . MtMBtK BANK
thus accounting tor low employment in the con-
PERCENT
0 + 5
EMPLOYMENT (NON-FARM) AV6. W EEKLY EARNINGS
NEW CAR REGISTRATIONSCONSTRUCTIONCONTRACTSCASH FARM RECEIPTSPERSONALINCOME
INSUREDUNEMPLOYMENT
BANKLO A N S *BANKINVESTMENTS*TOTALDEPOSITS*TIMEDEPOSITS*
JANUARY 1965 11Digitized for FRASER http://fraser.stlouisfed.org/ Federal Reserve Bank of St. Louis

struction field. The decline was prompted by a falling off in the demand for both apartments and single houses. The number of apartment units authorized by building permits began to slow down in March 1964, and by the end of November the number of units was down 9 per cent from a year earlier. The number of single houses authorized by permit began to fall off in April, and by the end of November they also were down 9 per
cent. In the United States, housing starts have declined since October 1963, but at a slower rate than in the district.
During the latter half of 1964, the supply of new housing appears to have come into balance with the prevailing demand. The vacancy rate leveled off, family formation was rising, and terms on mortgage loans remained liberal.
Bank operations in 1964
The end of the 50th anniversary year of the Federal Reserve System, is an appropriate time to look at certain historical aspects of the institution to better understand what the nature of the Federal Reserve Bank of Minneapolis is presently and how the tasks performed relate to it.
Those who participated in the Congressional debates of 1913 about the Federal Reserve Act, working in the immediacy of the money panics of 1907 and 1903, and remembering as well those that marked each decade following the Civil War, were very aware of the need for a sweeping monetary reform. Capitalism, as the basis on which our economic system was and is predicated, had suffered greatly from the inadequacies of a monetary system which made no provision for expansion and contraction of currency and credit in accordance with the needs of the nation’s economy.
Underlying the Federal Reserve Act as originally passed, and the Federal Reserve System as it exists today, was the belief that if the amount of
credit available to the economy could be kept in reasonable relation to demands for it, the marketplace would be able to function freely and that “ freedom of choice,” the essential characteristic of capitalism, could be preserved. To those responsible for the original Federal Reserve Act, though, the record of history of other countries and of the U. S., as well, indicated the wisdom of shielding the monetary authorities from government’s untrammeled use, and so made the Federal Reserve System, which was to determine the availability of credit, free from day-to-day political pressures.
Furthermore, the 1913 Congress recognized that monetary and credit policy should be formulated and implemented flexibly in response to changing conditions, and, in addition, that legislative action on monetary policy normally could not be taken with necessary speed. Thus, the System was given a form of “ trust indenture,” a delegation of certain money powers which Congress constitutionally holds. As a result, the Federal Reserve System
12 MONTHLY REVIEWDigitized for FRASER http://fraser.stlouisfed.org/ Federal Reserve Bank of St. Louis

was created and is now “ independent within the government.”
A blend of functions
There were those in the 1913 Congress who felt that the important powers delegated to the Federal Reserve System should not be concentrated in a small number of decision makers, so they incorporated into the System an idea based on what is commonly termed “ federalism,” a blend of centralized and regional functions and responsibilities. The idea was given concrete expression in regional Federal Reserve banks responsible to regional boards of directors. The main monetary power was to be the discounting done by these banks in almost automatic response to the credit needs of the districts through the rediscounting of commercial paper of member banks. Originally it was felt that the banks would discount commercial bank loans made to finance the production or marketing of goods.
Experience in the early 1920s showed, however, that commercial loans were discounted in large volume precisely when credit should have been restricted, and in small volume when credit should have been expanded. Also, with the discount rate being determined by the several Federal Reserve boards of directors, variations existed in the rates from district to district. As a result, credit was sought out by commercial banks in the district with lower rates.
During the very severe post World War I depression, the earnings of the Federal Reserve banks, dependent as they were on the discounts and advances made, dropped sharply as reduced credit pressures on the commercial banks lowered the demands for credit from the “ Feds.” The individual Federal Reserve banks had been given the power in the original Act to go into the open market to buy and sell government securities, much as commercial banks could, to bolster their earnings and thus be able to meet expenses and pay the statutory dividends on member bank stock. As individual Federal Reserve banks did this, they found
out that their uncoordinated purchases disrupted the securities markets, and in some cases found themselves trying to outbid each other and the Treasury for securities. As an operational matter, these purchases, prompted by a decline in discounting and Bank earnings, were found to add to the reserves of member banks through whom the purchases of government securities took place. These added reserves further reduced the need of commercial banks to borrow—thus adding to further reduction in discount earnings.
But more important was the discovery that such “ open market operations” were a powerful force for easing or tightening general credit conditions, a force that could be deliberately introduced into central money markets, and with the developing fluidity of these markets, spread quickly throughout the country. By 1923 a committee, the “ Open Market Investment Committee for the Federal Reserve System” (OMIC) was established under the supervision of the Federal Reserve Board to recommend plans for the purchase, sale, and distribution of securities for the System.
Since that time, credit administration has been a “matter of judgment concerning each specific credit situation at the particular moment of time when it has arisen or is developing.” * With this development, and with the knowledge gained about the nature of the discount function as a monetary tool, the role of the regional Federal Reserve bank has changed in emphasis—but in some respects the System regionalism is more important now than when originally conceived.
The “ automatic” extension of credit through the determination of the discount rate by the boards of directors of the several Federal Reserve banks is gone. Now, with judgment important in credit administration, the Federal Open Market Committee (as the OMIC as named by Congress in 1935) reflects the basic regionalism of the System in its make-up of members. The seven members of the Board of Governors sit with the 12 presidents of the Federal Reserve banks, five of whom have a*Annual Report of the Federal Reserve Board of 1923.
JANUARY 1965 13Digitized for FRASER http://fraser.stlouisfed.org/ Federal Reserve Bank of St. Louis

vote in the deliberations; and currently meetings are held every three weeks to discuss and determine monetary policy. Thus, the regionalism found in the 12 Federal Reserve banks is represented by the 12 presidents in this important task of credit determination.
Counsel and advice
Each president, serving as he does as the chief executive officer of the regional Federal Reserve bank and responsible to its board of directors, relies on his own staff of capable economic experts, who via staff briefings prior to the FOMC meetings, counsel and advise him. Also, each bank president is in close contact with bankers, businessmen, and labor leaders in his respective district and is therefore very knowledgeable about regional needs. As an informed participant in the monetary policy process, each president is thus able to make significant contributions to policy deliberations and thereby to the economic welfare of the country. It is important that bank presidents be responsive to these boards of directors and to these other regional influences generally for monetary policy has to be based on the needs and conditions in all parts of the country.
The discount function has changed from a primary source of Reserve bank credit to one which enables a member bank to exercise a privilege of obtaining necessary funds when faced with problems unique to itself or which may be the result from specific local, regional, or national conditions. While the establishment of the discount rate is still initiated by the board of directors of each Federal Reserve bank, it was made subject to the “ determination and approval” of the Board of Governors by the Banking Act of 1935, the Act which recognized that with the establishment of the FOMC, discount rate determination had to be coordinated with the other instruments of monetary policy. An example of how this works was observed this past year. When the government in Great Britain raised the British bank rate, the discount rates of all Federal Reserve banks were
raised within the period of a few days (November 23 and November 30). The Executive Committee of the Board of Directors of the Federal Reserve Bank of Minneapolis had met on November 23, but recognizing that commercial loan expansion in the Ninth district had been lagging that in the rest of the country, they deferred “establishing” the higher rate here until their next meeting on November 27 to be effective November 30. Thus, regional differences were recognized to a certain extent in the timing of establishment of the discount rate.
The administration of the discount window is a task performed at the local Federal Reserve bank and all discounts and advances are approved by the board of directors or its executive committee. To determine that such extensions of credit to individual member banks are for appropriate uses, the board or its executive committee at frequent intervals reviews these borrowings with the Federal Reserve bank staff.
Other operational aspects
Several other aspects of operations deserve consideration in this retrospective review of Federal Reserve banks. The individual Federal Reserve bank, being the funnel through which economic and banking data flows, is able to serve its region in many positive ways. For instance, the Federal Reserve Bank of Minneapolis began work this year on a district production worker man-hours index; when perfected, it will reveal movements at the individual industry level within the district and will allow comparisons with corresponding industries in the national economy. Also a regional stock prices index is now being tested. Regional surveys and reports are made; two, “ The Timber Economy of the Ninth District West” and “ Ski Resorts in the Ninth District” were issued this year. Participation has also continued, through research and consultation, in the work of the Upper Midwest Research and Development Council.
The Federal Reserve Banks aid banks generally in performing many services for them. Through
14 MONTHLY REVIEWDigitized for FRASER http://fraser.stlouisfed.org/ Federal Reserve Bank of St. Louis

the cooperation and assistance of the commercial banking community, our Check department this year achieved substantially “ full automation” in the handling of magnetically encoded checks. Also, besides the services performed for the member banks, there are programs handled for the Treasury through the Fiscal Agency department. “Letters of credit” were first used in connection with certain Federal programs to allow the Treasury to make use of allotted funds until they are actually disbursed.
All of these and other developments put greater demands and offer greater challenges to members of the Federal Reserve Bank staff to do a bigger job more effectively. In part this reflects the developing pace facing banking generally, and the fluidity and speed with which financial matters are being handled. It also requires more coordination between the Federal Reserve banks, since the impact of these operations and of monetary determinations are very quickly felt.
The principal avenue of coordinating administrative managerial matters of the Federal Reserve banks is through the quarterly conferences of the 12 Federal Reserve bank presidents and its System committees and subcommittees. The volume and importance of the work being done by these groups is growing, reflecting again the quickening pace of banking today.
Along with this coordinating work the Research department performed a number of services and made surveys at the request of the Board of Governors. These included a sampling of reserve statistics in a national effort to improve the estimates of weekly figures on bank reserves, a reporting of quarterly changes in bank lending practices, and a quarterly maturity survey of certificates of deposits.
At the end of the year, the President of the United States announced the appointment of Frederick L. Deming to the position of the Undersecretary of the Treasury for Monetary Affairs to fill the vacancy left by the resignation of Robert V. Roosa, which became effective December 31,1964. During the year, three officers retired from the staff, Harold G. McConnell, Arthur W. Johnson, and Milford E. Lysen. At year end, the Board of Directors promoted Earl O. Beeth and William C. Bronner to Assistant Vice Presidents to become effective January 1, 1965. In the election of directors by the Group 1 (large) member banks, John F. Nash, President of the American National Bank of St. Paul was elected to succeed Rollin 0. Bishop as a Class A director; and Joyce A. Swan, Executive Vice President and Publisher of the Minneapolis Star and Tribune, to succeed T. G. Harrison as a Class B director, for three year terms beginning January 1, 1965.
The Board of Governors of the Federal Reserve System appointed for a similar term B. W. Reeve, President of Lake Shore, Inc., Iron Mountain, Michigan, as a Class C director to succeed John H. Warden; and reappointed Charles G. McClave as a director of the Helena Branch for a two year term. Atherton Bean was redesignated as chairman and Federal Reserve Agent and Judson Bemis as deputy chairman for 1965. The Board of Directors of the Federal Reserve Bank of Minneapolis appointed Charles H. Brocksmith, President, First Security Bank of Glasgow, Montana, and Glenn H. Larson, President, First State Bank of Thompson Falls, Montana, as directors of the Helena Branch for two year terms and re-elected John A. Moorhead as the Federal Advisory Council member for 1965.
JANUARY 1965 1 5Digitized for FRASER http://fraser.stlouisfed.org/ Federal Reserve Bank of St. Louis

Volume of Operations*Number Dollar Amounts
1963 1964 1963 1964Discounts and advances 359 519 612,234,000 888,677,000Currency shipments, outgoing 17,598 17,620 451,523,000 473,004,000Coin shipments, outgoing 32,118 18,142 34,861,000 25,006,000Checks handled, total 173,998,830 184,882,000 49,118,987,000 52,443,244,000Collection items handled 875,419 706,777 621,316,000 579,893,000Issues, redemptions, exchanges of
9,441,769,000U. S. Government securities 253,356 287,676 8,553,228,000Securities held in safekeeping 295,377 314,153 1,683,079,000 1,743,158,000Transfers of funds 100,026 114,950 47,938,261,000 55,081,388,000
Earnings and ExpensesCURRENT EARNINGS
Discounts and advancesUnited States Government securitiesA ll other
Total Current Earnings
1963 $ 169,804 22,713,451
60,886 22,944,141
1964 $ 246,575 26,265,227
161,521 26,673,323
CURRENT EXPENSES Operating ExpensesAssessment for expenses of Board of Governors Federal Reserve Currency
Total Current Expenses
7,000,591176,30077,640
7,254,531
6,962,251201,300321,642
7,485,193
Less: reimbursement for certain fiscal agency and other expenses 611,557 609,703
Net Expenses 6,642,974 6,875,490
CURRENT NET EARNINGS 16,301,167 19,797,833
NET ADDITIONS TO CURRENT NET EARNINGSProfits on sales of U. S. Government securities (net) A ll other
32,201 — 2,450
12,28018,008
NET EARNINGS BEFORE PAYMENTS TO UNITED STATES TREASURY 16,330,918 19,828,121
PAYMENTS TO U. S. TREASURY (Interest on Federal Reserve Notes) 14,332,546 29,991,401
DIVIDENDS PAID 673,472 711,320
TRANSFERRED TO SURPLUS 1,324,900 -10,874,600
SURPLUS January 1 21,709,200 12,159,500
SURPLUS December 31 23,034,100 12,159,500
*AII figures are for Minneapolis and Helena combined.
16 MONTHLY REVIEWDigitized for FRASER http://fraser.stlouisfed.org/ Federal Reserve Bank of St. Louis
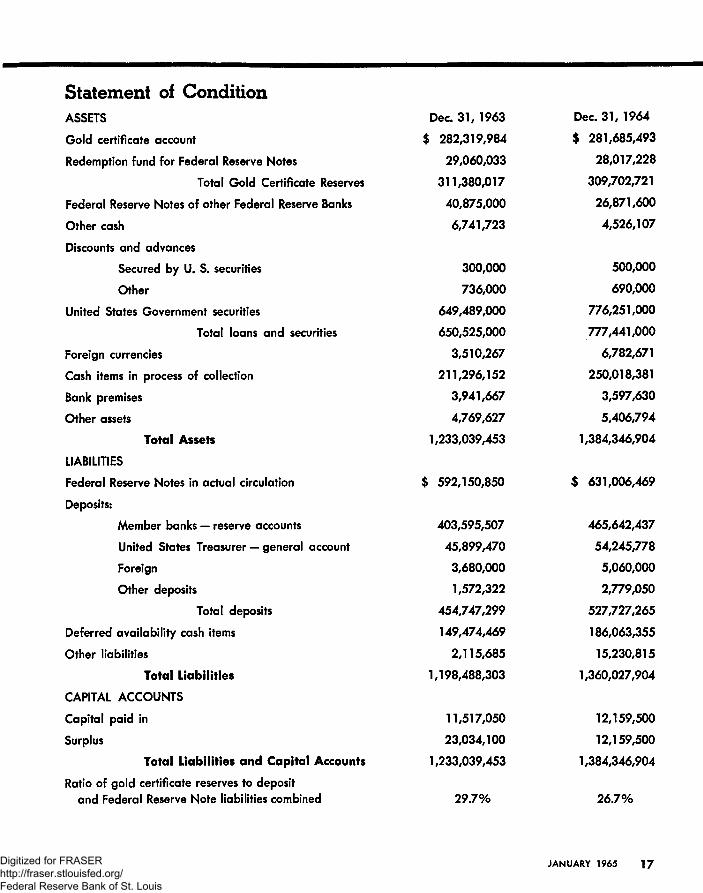
Statement of ConditionASSETS Dec. 31, 1963
Gold certificate account $ 282,319,984
Redemption fund for Federal Reserve Notes 29,060,033
Total Gold Certificate Reserves 311,380,017
Federal Reserve Notes of other Federal Reserve Banks 40,875,000
Other cash 6,741,723
Discounts and advances
Secured by U. S. securities 300,000
Other 736,000
United States Government securities 649,489,000
Total loans and securities 650,525,000
Foreign currencies 3,510,267
Cash items in process of collection 211,296,152
Bank premises 3,941,667
Other assets 4,769,627
Total Assets 1,233,039,453
LIABILITIES
Federal Reserve Notes in actual circulation $ 592,150,850
Deposits:
Member banks — reserve accounts 403,595,507
United States Treasurer — general account 45,899,470
Foreign 3,680,000
Other deposits 1,572,322
Total deposits 454,747,299
Deferred availability cash items 149,474,469
Other liabilities 2,115,685
Total L iab ilities 1,198,488,303
CAPITAL ACCOUNTS
Capital paid in 11,517,050
Surplus 23,034,100
Total Liab ilities and Capital Accounts 1,233,039,453
Ratio of gold certificate reserves to depositand Federal Reserve Note liabilities combined 29.7%
Dec. 31, 1964
$ 281,685,493
28,017,228
309,702,721
26,871,600
4,526,107
500,000
690,000
776.251.000
777.441.000
6,782,671
250,018,381
3,597,630
5,406,794
1.384.346.904
$ 631,006,469
465,642,437
54,245,778
5,060,000
2,779,050
527,727,265
186,063,355
15,230,815
1.360.027.904
12.159.500
12.159.500
1.384.346.904
26.7%
JANUARY 1965 1 7Digitized for FRASER http://fraser.stlouisfed.org/ Federal Reserve Bank of St. Louis

Officers of the Federal Reserve Bank of MinneapolisFrederick L. Deming
Maurice H. Strothman, Jr.
Kyle K. Fossum
John J . Gillette
Roger K. Grobel
Clarence W . Groth
Melvin B. Holmgren
Franklin L. Parsons
Ralph J . Dreitzler
Christopher E. Bjork
Frederick J . Cramer
Lester G . Gable
Roland D. Graham
Howard L. Knous
Oscar F. Litterer
John A . MacDonald
John P. Olin
Earl O. Beeth
Carl E. Bergquist
William C. Bronner
William A. O'Brien
Marcus O. Sather
Officers at the Helena BranchClement A . Van Nice
John L. Heath
Robert W . Worcester
As of December 31, 1964
President
First Vice President
Vice President
Vice President
Vice President
Vice President and Cashier
Vice President
Vice President
General Auditor
Assistant General Auditor
Assistant Vice President
Chief Examiner
Assistant Counsel and Assistant Secretary
Assistant Vice President
Assistant Vice President
Assistant Vice President
Assistant Vice President and Secretary
Assistant Cashier
Assistant Cashier
Assistant Cashier
Assistant Cashier
Assistant Cashier
Vice President
Assistant Cashier
Assistant Cashier
1 8 MONTHLY REVIEWDigitized for FRASER http://fraser.stlouisfed.org/ Federal Reserve Bank of St. Louis

Directors of the Federal Reserve Bank of MinneapolisClass A:
Rollin O. Bishop
Curtis B. Mateer
Harold C. Refling
Consultant, The American National Bank of Saint Paul, Saint Paul, MinnesotaExecutive Vice President, The Pierre National Bank,Pierre, South DakotaExecutive Vice President, First National Bank in Bottineau, Bottineau, North Dakota
Class B:T. G . Harrison
Hugh D. Galusha, Jr.
Ray C. Lange
Class C:John H. Warden
Atherton Bean
Judson Bemis
Chairman of the Board, Super Valu Stores, Inc.,Minneapolis, MinnesotaLawyer and Certified Public Accountant,Helena, MontanaPresident, Chippewa Canning Company, Inc., Chippewa Falls, Wisconsin
Term expires December 31
1964
1965
1966
1964
1965
1966
Chairman of the Board, Upper Peninsula Power Company, 1964Houghton, MichiganCHAIRMAN AND FEDERAL RESERVE AGENT 1965President, International Milling Company, Inc., Minneapolis, Minnesota DEPUTY CHAIRMAN 1966President, Bemis Bro. Bag Co., Minneapolis, Minnesota
Directors of the Helena BranchAppointed by Federal Reserve Bank:
Roy G . Monroe Chairman of the Board and President,The First State Bank of Malta, Malta, Montana
Harald E. Olsson President, Ronan State BankRonan, Montana
B. Meyer Harris President, The Yellowstone Bank,Laurel, Montana
Appointed by Board of Governors:
C. G . McClave CHAIRMANPresident and General Manager, Montana Flour Mills Co., Great Falls, Montana
Edwin G . Koch VICE CHAIRAAANPresident, Montana School of Mines, Butte, Montana
Member of the Federal Advisory CouncilJohn A. Moorhead
As of December 31/ 1964
President, Northwestern National Bank of Minneapolis, Minneapolis, Minnesota
1964
1964
1965
1964
1965
JANUARY 1965 19Digitized for FRASER http://fraser.stlouisfed.org/ Federal Reserve Bank of St. Louis

Subscriptions available from Monthly Review, Research Department, Federal Reserve Bank of Minneapolis, Minneapolis, Minnesota 55440
Digitized for FRASER http://fraser.stlouisfed.org/ Federal Reserve Bank of St. Louis