Embed Size (px)
Citation preview

192 IEEE TRANSACTIONS ON AUTOMATION SCIENCE AND ENGINEERING, VOL. 12, NO. 1, JANUARY 2015
A Run-to-Run Profile Control Algorithm forImproving the Flatness of Nano-Scale Products
Xin Wang, Su Wu, and Kaibo Wang
Abstract—In scaling-up Carbon Nanotubes (CNTs) array man-ufacturing, the uniformity of CNTs’ height, or flatness of array, iscritical for the yield of nanodevices fabricated fromCNTs, and thusneeds to be properly controlled. However, since the flatness of theCNTs array is better characterized by a profile, the conventionalrun-to-run (R2R) controllers that are designed for a single or mul-tiple quality indicators are not effective in controlling the CNTsarray manufacturing process. Therefore, in this work, we first de-velop a statistical model to characterize the variation of the flat-ness profile, and then derive a novel R2R profile controller basedon a state-space model and Kalman filter to improve the flatness ofCNTs array. The performance of the proposed R2R control algo-rithm is studied and compared with existing controller via simula-tion studies.
Note to Practitioners—In the quality control practice, it shouldbe noted that many aggregated quality indicators or the pass/failconclusions are, in fact, drawn on the basis of complex measure-ments. Such measurements convey rich information about theprocess variability and quality patterns, and is therefore criticalto quality improvement.This work focuses on a scaling-up nano-manufacturing process.
The quality of the product is characterized by a profile, whichcontains information about both the location and the flatness ofthe product. We design a statistical model to characterize productquality, then derive a control algorithm to improve the flatnessby adjusting controllable process variables. Such data-drivenmodeling and control framework is critical to study processes withcomplex quality metrics and large uncertainties.
Index Terms—Nano-manufacturing, run-to-run (R2R) control,statistical quality control.
I. INTRODUCTION
I N CERTAIN modern manufacturing processes, the productquality is characterized by the flatness of a two-dimen-
sional surface or one-dimensional profile. The flatness reflectsthe uniformity of some quality variables, usually the thicknessor height, over a specified interval. Compared to the traditionalunivariate or multivariate quality indices, the flatness is usually
Manuscript received June 03, 2013; revised August 28, 2013; acceptedSeptember 23, 2013. Date of publication November 07, 2013; date of currentversion December 31, 2014. This paper was recommended for publication byAssociate Editor T. Kawahara and Editor K. Bohringer upon evaluation of thereviewers’ comments. The work of K. Wang was supported by the NationalNatural Science Foundation of China under Grant 71072012, and the TsinghuaUniversity Initiative Scientific Research Program. This work was supportedby Prof. S. Fan, Dr. L. Liu, and Dr. Q. Cai from the Tsinghua-FoxconnNanotechnology Research Center. (Corresponding author: K. Wang.)The authors are with the Department of Industrial Engineering, Tsinghua Uni-
versity, Beijing 100084, China (e-mail: [email protected]).Color versions of one or more of the figures in this paper are available online
at http://ieeexplore.ieee.org.Digital Object Identifier 10.1109/TASE.2013.2284935
formed by the same variable measured at multiple locations ona product surface, or along one or multiple lines on a surface.Therefore, the flatness is a complicated metric that usuallyconvey rich information such as the shape, position, and rough-ness of a product. To achieve higher product quality, the controlof product flatness becomes an important while challengingtopic.In this work, we focus on a real scaling-up nano-manufac-
turing process for producing Carbon Nanotubes (CNTs) array.CNTs have been considered as a potential candidate to replacea lot of traditional materials due to its excellent photoelec-tric properties, mechanical strength and flexibility. In 2002,super-aligned CNTs array were first successfully synthesizedon silicon wafers using the Chemical Vapor Deposition (CVD)method, which is accomplished in a reaction furnace withflowing gaseous carbon feedstock and argon in the presenceof silicon wafer with catalysts [1]. The CVD is essentially athermal dehydrogenation reaction, whereby the catalyst is uti-lized to lower the reaction condition required to crack a gaseoushydrocarbon feed into carbon and hydrogen [2] . The resultingCNTs array is well-aligned and formed into bundles by van derWaals force [2]. Continuous and large-scale CNTs films, whichhave been developed to produce novel products such as touchpanels, LCD and other optoelectronic devices, can be easilydrawn from the super-aligned CNTs array [3]. Since the firstsuccessful experiment in the laboratory, the production of theCNTs array has started to enter the scaling-up stage; factorssuch as yield, quality and cost are seriously considered to meethigh industrial demand [4].However, due to the immature techniques and limited un-
derstanding of the CNTs array synthesis technology, its man-ufacturing process still suffers from issues such as high costand low yield, and these are directly dominated by the qualityof the CNTs array. In order to have a better understanding forquality of the CNTs array, we briefly introduce how the CNTsarray is used for producing thin film, which could be furtherused to produce touch panels. The CVD synthesis process canproduce a forest of tall and super-aligned CNTs, the CNTsarray, on a wafer basis, as Fig. 1 shows. First, the CNTs arrayis cut by laser to remove the edge area (see Fig. 2). Then,the rest of the CNTs array are drawn from one side awayfrom the wafer. Due to the unique adhesion property of theCNTs, a thin-film band is formed naturally (see Fig. 3). Thelength of the produced thin-film is determined by the heightof the CNTs array. The heights of CNTs are measured alonga predefined line, termed measuring line, which is perpendic-ular to drawing direction (see Fig. 2). Fig. 4 shows the heightmeasurement system for CNTs array and heights of the CNTs
1545-5955 © 2013 IEEE. Personal use is permitted, but republication/redistribution requires IEEE permission.See http://www.ieee.org/publications_standards/publications/rights/index.html for more information.

WANG et al.: A R2R PROFILE CONTROL ALGORITHM FOR IMPROVING THE FLATNESS OF NANO-SCALE PRODUCTS 193
Fig. 1. SEM image of the CNTs array on the silicon wafer in side view.
Fig. 2. Schematic drawing of cut lines.
Fig. 3. Illustration of mechanism of transforming CNTs array to film whendrawing from one side of the array.
Fig. 4. Side view of the height measurement system and the heights of theCNTs along the measuring line.
along the measuring line on the wafer. During the measure-ment, the measuring line on the wafer is set to be parallel tothe slide way, and the measuring lens can move along the slideway to measure the height of any point on the measuring line.Practically, multiple measurement sites with equal interval areselected for each measuring line.Due to the mechanism of the CVD process, the height of the
CNTs produced on the wafer surface is not ideally uniform. In
practice, height uniformity is desirable for several reasons. First,the wafer with CNTs array is treated using laser beam beforeentering the drawing stage. The power of the laser beam is de-termined by the height of the CNTs array. Therefore, if the uni-formity of the array is poor, the adjustment of the laser powerwould be difficulty, which may cause damage to the CNTs arrayif not properly set and incur quality loss. Second, certain elec-trical properties of the produced film, such as conductivity, is af-fected by the height of the CNTs array. As uniform conductivityon the film is required, high uniformity of the height is thereforealso important. Finally, uneven height distribution cause mate-rial wastage. It is observed that CNTs near the center area areusually lower than that near the edge area. Consequently, whendrawing the film from the wafer (see Fig. 2), the center areaconsumes faster than the upper and lower edge area. Thus, highwastage is resulted when the center area has been used up whilethe upper and lower edge area still has leftover. The amountof leftover is mainly determined by the height uniformity ofthe CNTs along the direction being parallel to the measuringline. Therefore, controlling the uniformity of the CNTs is animportant topic for improving the yield and reducing produc-tion cost.Although the statistical approach has been applied in nan-
otechnology for recent years, most of the related works mainlyfocus on design of experiment and process modeling for syn-thesis [5]–[8], and characterization [9]–[11] of nanomaterial.The process control of nano-manufacturing has not been wellstudied so far. The CVD process, which is used to produce theCNTs array as introduced above, is a typical run-to-run (R2R)process and widely used in semiconductor manufacturing. In theliterature, extensive research has been reported on R2R processcontrol for semiconductor manufacturing [12], [13]. The R2Rcontrol, which is a form of discrete control, aims to regulateprocess output using a filter and a feedback controller. The filteris used to estimate the current system state according to the latestoutput, and the feedback controller is utilized to determine thenew recipe according to the estimated system state.In the following section, a review of existing work will be
given. It will be shown that most existing R2R control algo-rithms are designed to control one or multiple quality variables.In the aforementioned nano-manufacturing process, the qualityobjective is to improve the flatness of the CNTs array alonga specific direction. As the heights of the CNTs are measuredalong the measuring line, which has formed a profile naturally,it is equivalent to control the flatness of the profile. However,to the best of our knowledge, very limited work can be foundfor controlling the flatness of a profile or a surface in R2R con-trol for semiconductor manufacturing and nano-manufacturing.Therefore, in this work, we target to propose a new modelingand run to run profile control method for improving the flatnessof the CNTs array.The rest of this work is organized as follows. Section II
presents a review of existing R2R control methods. Section IIIproposes a new R2R profile control algorithm for the CNTsarray production process to improve profile flatness. InSection IV, the performance of the proposed control algorithmis studied using simulation. Finally, Section V concludes thiswork with suggestions for future research.
194 IEEE TRANSACTIONS ON AUTOMATION SCIENCE AND ENGINEERING, VOL. 12, NO. 1, JANUARY 2015
II. LITERATURE REVIEW
Ingolfsson and Sach [14] proposed to use exponentialweighted moving average (EWMA) statistics to update theestimation of system state (as the filter), this approach is termedEWMA controller, which becomes one of the most popularR2R controllers. The authors also investigated the stabilityand sensitivity of the EWMA controller under three differentdisturbances [14]. Bulter and Stefani [15] proposed a doubleEWMA controller for the process suffered from a drift. DelCastillo [16] discussed the stability and sensitivity of the doubleEWMA controller. Del Castillo [17] gave a detailed reviewand analyzed performance of the EWMA controller for processexhibiting dynamics and being influenced by a ARMA noise.Many manufacturing systems, especially nano-manufac-
turing, are by nature multiple input and multiple outputs(MIMO) processes [18]. However, the MIMO process cannotbe controlled properly by EWMA if there is correlation be-tween different outputs [19]. Tseng et al. [18] proposed amultivariate EWMA controller (termed MEWMA) to tacklethis problem. The authors also investigated the stability con-dition and feasible region of this controller, and obtained thediscount factor which minimizes the total mean square error(MSE) of process output under assumption that the processdisturbance is either a white noise or an IMA time series [18].Del Castillo et al. [19] extended the double EWMA controllerto MIMO process. Other methodologies, such as singular valuedecomposition (SVD) [20] and partial least square (PLS) [21],are also utilized to reduce dimension and decouple the systemfor MIMO process.The aforementioned EWMA controller is restricted to the
case that the discount factor is a predetermined constant. Thecontroller with fixed discount factor usually requires a moder-ately large number of runs to bring the output to its target [12],[22] , and it also cannot minimize the MSE of the estimation un-less the process disturbance is IMA noise [23]. Although, sev-eral modified EWMA controller with variable discount factorhave proposed, these method requires the ratio of the true pa-rameters to the estimated parameter ( ) [12], [22] , which isunrealistic in the CNTs array manufacturing.Kalman [24] presented a method for recursively estimating
states of a linear system based on the most current observa-tion and the past observations. This method, which is knownas the Kalman filter, can adjust the Kalman gain adaptively andgive the minimization of the MSE among all possible estima-tors. Therefore, the Kalman filter has the potential to provide abetter prediction of system states from the MES point of view.Palmer et al. [25] utilized a state space model to describe thephotolithography process and Kalman filter to update the stateof process. Other researches, such as Del Castillo and Mont-gomery et al. [26], Del Castillo et al. [27], Chen et al. [28] , alsoillustrated that the Kalman filter can be applied in R2R control.In all R2R controllers mentioned above, it is assumed that
the quality of a process or product can be properly describedby a univariate or multivariate quality characteristics. However,in many applications, especially in CNTs array manufacturing(as illustrated in Section I), the quality of a process or productis better represented by a function between the response andone or a set of explanatory variables, which termed profile [29].The profile can be represented by a linear function [30], non-
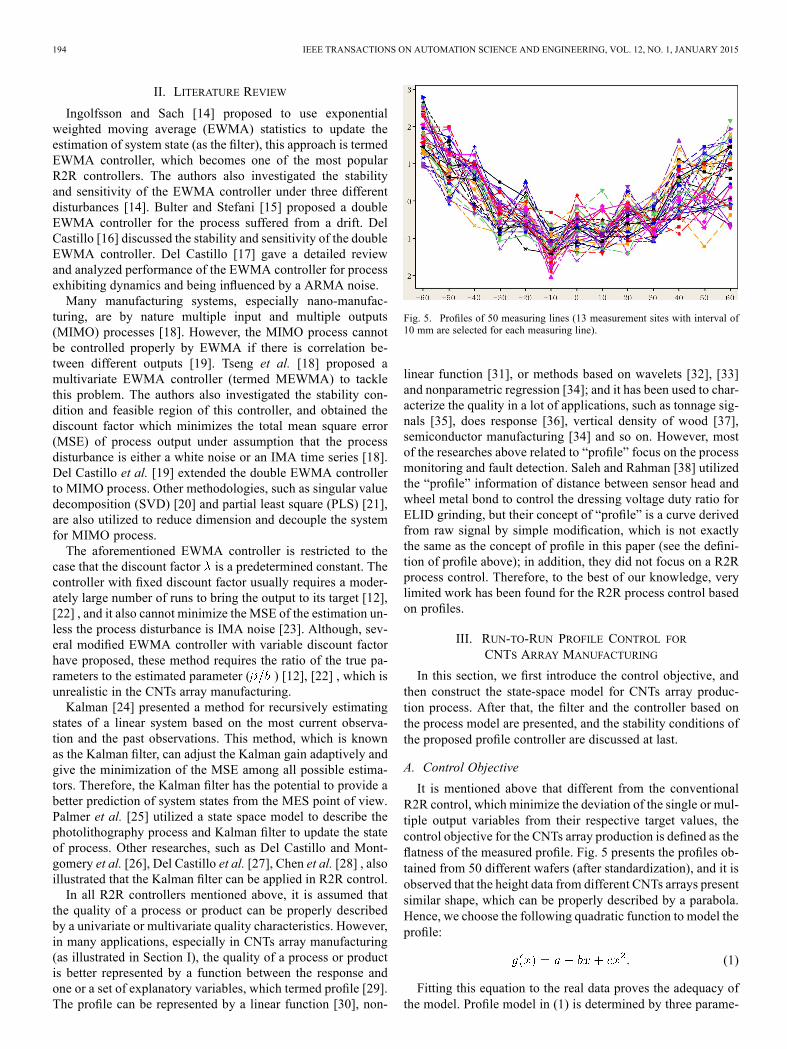
Fig. 5. Profiles of 50 measuring lines (13 measurement sites with interval of10 mm are selected for each measuring line).
linear function [31], or methods based on wavelets [32], [33]and nonparametric regression [34]; and it has been used to char-acterize the quality in a lot of applications, such as tonnage sig-nals [35], does response [36], vertical density of wood [37],semiconductor manufacturing [34] and so on. However, mostof the researches above related to “profile” focus on the processmonitoring and fault detection. Saleh and Rahman [38] utilizedthe “profile” information of distance between sensor head andwheel metal bond to control the dressing voltage duty ratio forELID grinding, but their concept of “profile” is a curve derivedfrom raw signal by simple modification, which is not exactlythe same as the concept of profile in this paper (see the defini-tion of profile above); in addition, they did not focus on a R2Rprocess control. Therefore, to the best of our knowledge, verylimited work has been found for the R2R process control basedon profiles.
III. RUN-TO-RUN PROFILE CONTROL FORCNTS ARRAY MANUFACTURING
In this section, we first introduce the control objective, andthen construct the state-space model for CNTs array produc-tion process. After that, the filter and the controller based onthe process model are presented, and the stability conditions ofthe proposed profile controller are discussed at last.
A. Control Objective
It is mentioned above that different from the conventionalR2R control, which minimize the deviation of the single or mul-tiple output variables from their respective target values, thecontrol objective for the CNTs array production is defined as theflatness of the measured profile. Fig. 5 presents the profiles ob-tained from 50 different wafers (after standardization), and it isobserved that the height data from different CNTs arrays presentsimilar shape, which can be properly described by a parabola.Hence, we choose the following quadratic function to model theprofile:
(1)
Fitting this equation to the real data proves the adequacy ofthe model. Profile model in (1) is determined by three parame-

WANG et al.: A R2R PROFILE CONTROL ALGORITHM FOR IMPROVING THE FLATNESS OF NANO-SCALE PRODUCTS 195
Fig. 6. Illustration of effect of parameter on parabola.
ters defined as , therefore is considered as re-sponse vector at run and estimated via least square method asfollows:
(2)
where is the height vector of the CNTs array produced at run, is the matrix defined as follows:
......
...(3)
where ( ) is the coordinate of the th elementof . Quality characterization using the profile model in (1) hastwo advantages. First, dimension of the problem can be reduceddramatically while preserving as much information as possible,because the number of measure sites is much larger than 3 inthe actual CNTs array production. Second, the profile can filtera part of measurement noise such that performance of the con-troller can be improved.The effects of the three parameters on the profile are presented
in Figs. 6–8. It can be seen that has an influence on the curva-ture of profile (the height difference between boundary sites andcentral site), affects the scale of profile (height difference be-tween boundary sites), mainly determines the absolute heightof profile. As it is desirable that the synthesized CNTs alongmeasuring line are uniform and the height of CNTs is approx-imately equal to prespecified value, the parameters , andare expected to be as close to 0, 0 and the prespecified valueas possible. In conclusion, the target of the response vector
is assumed as
Fig. 7. Illustration of effect of parameter on parabola.
Fig. 8. Illustration of effect of parameter on parabola.
where is the pre-specified height value, the subscript indi-cates that it is the target based on profile.This profile controller aims to minimize the MSE of response
vector at run ( ) by choosing a proper process recipeat run ( ). Hence, the objective function based on profile isdefined as
(4)
where is the process recipe at run ( 1).It should be noted that in the mechanical design literature,
geometric dimensioning and tolerancing (GD&T) has been ex-tensively studied. For example, Kandikjan et al. [39] introduceddifferent types of geometric tolerancing scheme, including size,form, orientation, position, run-out and profile. Carr amdFerreora [40] introduced verification models for flatness and

196 IEEE TRANSACTIONS ON AUTOMATION SCIENCE AND ENGINEERING, VOL. 12, NO. 1, JANUARY 2015
straightness of planar surfaces. In the GD&T system, the re-quirement for size and flatness are usually assigned separately.However, in process control, as all deviations incur qualityloss, the penalties related to size and flatness are reflected inthe same objective function. This is consistent with the qualityloss function proposed by Taguchi [41] and widely used in thequality control literature [13], [42], [43].
B. Modeling
Although most of the nano-material growth process is com-plicated and highly nonlinear [5], [8], in CNTs array production,engineers usually restrict the recipes to a very small region inorder to prevent unexpected results. Within the small adjustableregion, the relationship between the heights of CNTs and thecontrol variables can be approximately described by a linearfunction according to regression analysis of production data andengineering experience. Therefore, based on our engineeringknowledge and verification with real data, we use the followingmodel to characterize the CNTs manufacturing process:
(5)
where
the height vector with dimension of 1;
the intercept vector with dimension of 1;
the slope vector with dimension of ;
the process disturbance;
the control vector with dimension of 1.
According to the further residual analysis of the productiondata, the process disturbance actually consists of twoparts, first is the growth noise ( ) which can be describedand predicted by an ARMA model; second is the measurementerror ( ) which is usually assumed as white noise andcannot be predicted. The R2R controllers that are based onmodel in (5), such as MEWMA controller, do not have theability to differentiate between growth and metrology noise[44]; hence, such kind of controllers treat the process distur-bance as an integral whole, regardless of the predictabilityof the growth noise, when updating the system states. Onthe contrary, the state-space model, which is divided into aprocess state equation and output observation equation, hasthe ability to distinguish two kinds of noise [44]; therefore, itcan take advantage of the predictability of the growth noise,which will be illustrated in detail in Section IV. In addition, thestate-space model can directly use the Kalman filter, which canminimize the MSE of the estimated system states as introducedin Section II, to update the system states. In addition, this formof modeling strategy has been used to improve the quality andreduce manufacturing cost [45]. Therefore, we try to transformthe model in (5) into its state-space representation.It is shown below that the growth noise (ARMA process)
can be characterized by system state transition matrix and co-variance matrix in state equation, and measurement error canbe characterized by covariance matrix in observation function.
First, it is illustrated that the ARMA model can be repre-sented in equivalent state-space form [23]. Consider the ARMA
process defined by
(6)
where is the lag operator.We assume the is the corresponding AR ( ) model
(7)
Substitute (7) to (6)
(8)
(9)
Then, we have
(10)
where
...
......
.... . .
...
According to (10), the state-space representation of model in(5) can be directly obtained as
(11)
where is the system state vector,
is the observation matrix, is identity matrix
is the system state transition matrix, is
the process gain, , and are covari-
ance matrix of and . It is noted that two kinds of noise areseparated in the model in (11).
C. Kalman Filter Based Profile Control AlgorithmAfter the establishment of process model, a control algorithm
based on the model in (11) is required to adjust the CNTs arrayproduction properly. The control scheme used to regulate the

WANG et al.: A R2R PROFILE CONTROL ALGORITHM FOR IMPROVING THE FLATNESS OF NANO-SCALE PRODUCTS 197
process is fundamentally comprised of two parts, which are stateupdating process and profile based controller respectively. Forthe first part, it is mentioned above that the Kalman filter canbe directly used to update the state for the model in (11) andhas ability to provide estimation of system state with minimumMSE; hence, the Kalman filter is utilized to regulate system statein the proposed control algorithm.The updating process based on the Kalman filter, which is
basically divided into two parts (the filtering and prediction re-spectively), are shown as follows:
(12)
(13)
(14)
(15)
(16)
It is worth noting that the (15) is essentially a weighted sum ofstate prediction and process innovation ,and the weighting value, term Kalman gain, is calculated ac-cording to (14). As can be seen, Kalman gain is determined bythe relative amount of prediction error, indicated by , andmeasurement error, indicated by . If the is compara-tively larger, it indicates the measurement result is morereliable, and it is reasonable that process innovation
is put larger weight by relatively larger Kalman gain;otherwise, the prediction is more reliable and will be putlarger weight by relatively smaller Kalman gain.For the second part of control scheme, the new recipe is ex-
pected to be determined in order to compensate for processdisturbance according to system state. It is aforementioned inSection III-A that the objective function based on the profileis shown in (4), and we let the first-order partial derivative of
with respect to equal to 0
(17)
The solution to (17) is
(18)
The right side of (18) is a vector with dimension of 3 while thedimension of recipe is usually larger than 3 in actual CNTs
Fig. 9. Schematic diagram of the proposed Kalman-based profile controller.
array production, which means (18) has infinitely many solu-tions. Under this situation, we want to minimize the adjustmentamounts at each run [18], [19], which became the optimizationproblem as follows:
(19)
By using the Lagrange multiplier, the solution is
(20)
where
Fig. 9 illustrates the proposed profile control loop, which used(12)–(16) to update system states and (20) as controller. In orderto discuss the stability condition, we review the proposed con-trol scheme from prospective of linear system theory. It can beseen that the new process recipe is obtained via output feed-back controller in (20) according to the system states . How-ever, the system states cannot be directly measured due to lackof physical meaning. An algorithm, termed state observer inlinear system theory, is required to reconstruct the system statesfrom latest process output. From this point-of-view, the Kalmanfilter in the proposed control scheme is equivalent to the stateobserver in linear system theory. Then, the stability condition isderived as follows.It is noted that has been determined and known, so it
is supposed to be constant. Hence, if we relax the constraint ofand focus on the general form of the feedback controller,
(20) can be expressed as
(21)
where , is the constantterm.
198 IEEE TRANSACTIONS ON AUTOMATION SCIENCE AND ENGINEERING, VOL. 12, NO. 1, JANUARY 2015
Substituting (15) into (11), we get the observer based on theKalman filter
(22)
With the controller in (20) and the observer, the observed systembecomes
(23)
where is the error of observer and its dynamicfunction is
(24)
Hence, will converge to 0 and the system in (24) willbe stable if the eigenvalues of ( ) and ( ) arewithin the unite circle.
IV. SIMULATION STUDIES
In this section, we evaluate the performance of the proposedprofile controller via simulation study. Traditionally, the engi-neers characterize the height of the CNTs array as a multivariatevector, and then used the MEWMA controller, as proposed by[18], to adjust the CNTs array production process. Therefore,the MEWMA controller will be used as a benchmark in the fol-lowing simulation study.As mentioned before, the manufacturing process of the
CNTs array is essentially a CVD process. So the maintenance,cleaning of reacting furnaces and machining aging, which areinevitable after a certain time of production, have a great chanceto bring a sudden shift or moderate drift to process output. Inaddition, the estimation error of model parameters should bealso taken into consideration. Hence, in order to illustratethe effectiveness of the proposed profile controller, it will becompared with MEWMA controller under three circumstances,which are noise, with shift anddrift, with unknown gain, respectively.
A. Parameters Setting and Criterion
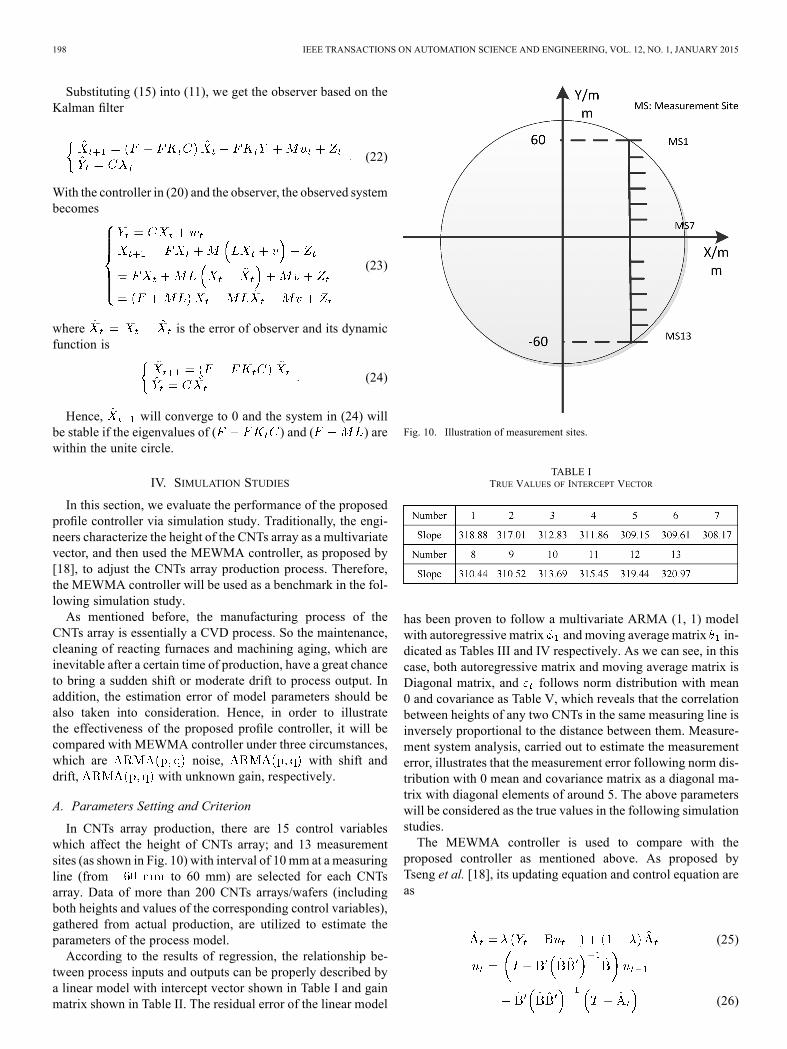
In CNTs array production, there are 15 control variableswhich affect the height of CNTs array; and 13 measurementsites (as shown in Fig. 10) with interval of 10 mm at a measuringline (from to 60 mm) are selected for each CNTsarray. Data of more than 200 CNTs arrays/wafers (includingboth heights and values of the corresponding control variables),gathered from actual production, are utilized to estimate theparameters of the process model.According to the results of regression, the relationship be-
tween process inputs and outputs can be properly described bya linear model with intercept vector shown in Table I and gainmatrix shown in Table II. The residual error of the linear model
Fig. 10. Illustration of measurement sites.
TABLE ITRUE VALUES OF INTERCEPT VECTOR
has been proven to follow a multivariate ARMA (1, 1) modelwith autoregressive matrix and moving average matrix in-dicated as Tables III and IV respectively. As we can see, in thiscase, both autoregressive matrix and moving average matrix isDiagonal matrix, and follows norm distribution with mean0 and covariance as Table V, which reveals that the correlationbetween heights of any two CNTs in the same measuring line isinversely proportional to the distance between them. Measure-ment system analysis, carried out to estimate the measurementerror, illustrates that the measurement error following norm dis-tribution with 0 mean and covariance matrix as a diagonal ma-trix with diagonal elements of around 5. The above parameterswill be considered as the true values in the following simulationstudies.The MEWMA controller is used to compare with the
proposed controller as mentioned above. As proposed byTseng et al. [18], its updating equation and control equation areas
(25)
(26)

WANG et al.: A R2R PROFILE CONTROL ALGORITHM FOR IMPROVING THE FLATNESS OF NANO-SCALE PRODUCTS 199
TABLE IITRUE VALUES OF THE GAIN MATRIX
where is the estimated intercept vector fromMEWMA algo-rithm at run , is the estimated gain matrix, is the discountfactor ( ), is the target vector, of which elementsare supposed to be 300 in the following.The MSE of the heights at measuring line is utilized as crite-
rion to evaluate the performance of two algorithms, and definedas
(27)
where is the length of simulation and is still the targetvector.
B. Case One: ARMA (1, 1)
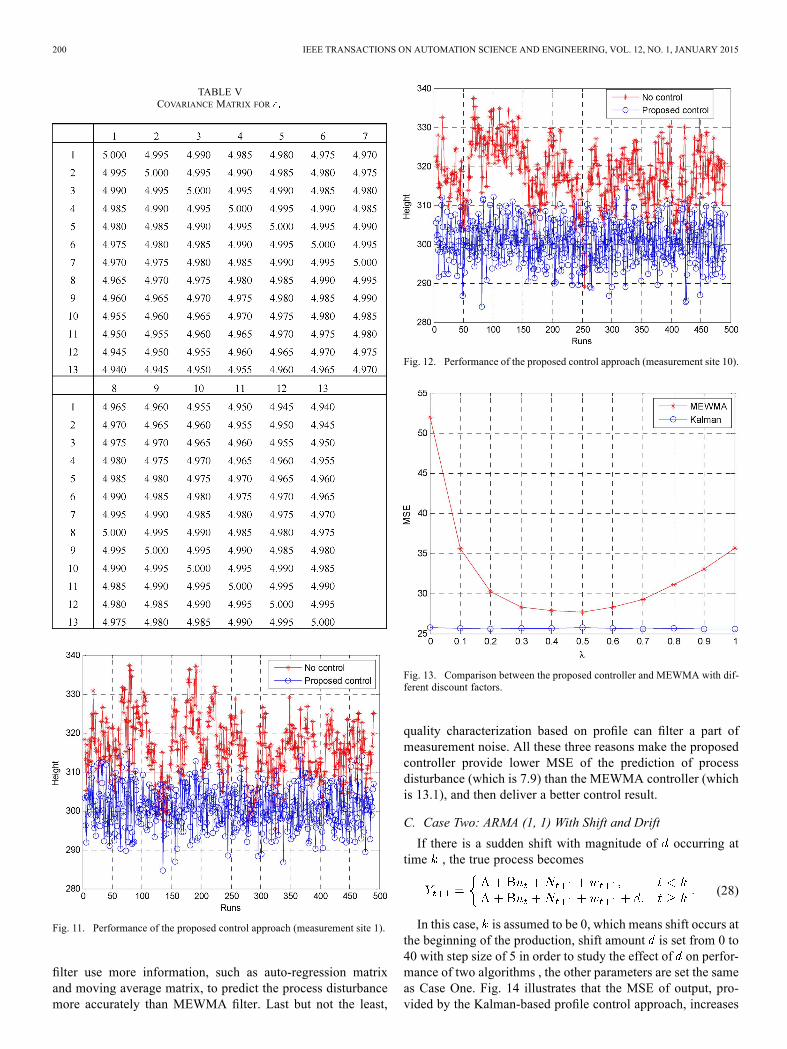
In this case, the proposed profile controller is studied undertwo situations. First, 500 runs are processed with the proposedprofile controller and without any controller respectively, inorder to illustrate the effectiveness of our controller. As shownin Figs. 11 and 12, the output converges to target rapidly after afew runs under the Kalman filter-based profile controller eventhough the initial inputs is chosen improperly, in the contrary,
TABLE IIIAUTOREGRESSIVE MATRIX
TABLE IVMOVING AVERAGE MATRIX
the output would be totally out of control if no control action isapplied. The performance at other points is similar.Second, we compare the profile controller with the bench-
mark, which is the MEWMA controller; in order to illustrateour controller is more proper to the CNTs array productionprocess control. Considering that the discount factor has agreat influence on the performance of MEWMA, the simulationis processed 500 runs for the proposed algorithm and MEWMAwith different from 0 to 1 (step size is 0.1). As depicted inFig. 13, the MSE provided by MEWMA with discount factorof 0.5, which performs best among all discount factors, is stilllarger than MSE delivered by the proposed algorithm. Hence,the proposed profile controller can provide better output thanMEWMA.The reasons for better performance of the Kalman filter-based
profile controller lie in three aspects. First, as mentioned above,the state-space model can distinguish between the predictableprocess noise and the unpredictable measurement noise, whilethe tradition model considers the process disturbance as onepart. Second, based on the state-space model, the Kalman
200 IEEE TRANSACTIONS ON AUTOMATION SCIENCE AND ENGINEERING, VOL. 12, NO. 1, JANUARY 2015
TABLE VCOVARIANCE MATRIX FOR
Fig. 11. Performance of the proposed control approach (measurement site 1).
filter use more information, such as auto-regression matrixand moving average matrix, to predict the process disturbancemore accurately than MEWMA filter. Last but not the least,
Fig. 12. Performance of the proposed control approach (measurement site 10).
Fig. 13. Comparison between the proposed controller and MEWMA with dif-ferent discount factors.
quality characterization based on profile can filter a part ofmeasurement noise. All these three reasons make the proposedcontroller provide lower MSE of the prediction of processdisturbance (which is 7.9) than the MEWMA controller (whichis 13.1), and then deliver a better control result.
C. Case Two: ARMA (1, 1) With Shift and Drift
If there is a sudden shift with magnitude of occurring attime , the true process becomes
(28)
In this case, is assumed to be 0, which means shift occurs atthe beginning of the production, shift amount is set from 0 to40 with step size of 5 in order to study the effect of on perfor-mance of two algorithms , the other parameters are set the sameas Case One. Fig. 14 illustrates that the MSE of output, pro-vided by the Kalman-based profile control approach, increases

WANG et al.: A R2R PROFILE CONTROL ALGORITHM FOR IMPROVING THE FLATNESS OF NANO-SCALE PRODUCTS 201
Fig. 14. Comparison between two algorithms under different shift amount.
as the magnitude of the sudden shift; however, the proposed al-gorithm still can deliver better output if the shift amount is lessthan a specific value which is approximately 35 in this case.Thus, the proposed algorithm is superior to MEWMA when themagnitude of the shift is moderately small. According to theexperience of actual production, the shift amount, caused bymaintenance and cleaning of furnace, is usually less than 10% oftarget value; therefore, the proposed algorithm is more suitablefor quality control of CNTs array production than MEWMA.In addition to sudden shift, the moderate drift should be con-
sidered in performance evaluation of control approach. Underthis circumstance, the true process becomes
(29)
where is the drift rate. The two algorithms are compared underdifferent from 0 to 0.8 with step size of 0.05. Fig. 15 showsthat both of the two control approaches perform worse with theincrease of drift rate, however, the proposed method can providebetter production outputs than MEWMA if drift rate is less than0.6.In conclusion, MSE delivered by the proposed Kalman-based
profile control approach is smaller thanMEWMAwhen the shiftor drift of process is less than a specific value determined byproduction process. However, up to now, no evidence has beenfound to indicate that there is any relatively large shift and driftin the CNTs arraymanufacturing. Hence, the proposed approachis suitable for process control of the CNTs array manufacturing.
D. Case Three: Unknown Gain
It is mentioned above that the process gain matrix is obtainedthrough regression analysis, which could lead to bias betweentrue process gain and estimated value. Therefore, it is essen-tial to take the estimation bias into consideration when the effi-ciency of the proposed algorithm is studied; in other words, weshould evaluate the performance of the control approach withassumption of unknown gain.
Fig. 15. Comparison between two algorithms under different drift rate.
Fig. 16. Comparison between two controllers with unknown gain.
The estimation of the process gain is assumed to be a linearfunction of actual value
(30)
We compare the MSE of process under two algorithms withfrom 0.6 to 6.4 with step size of 0.2, because both of two con-troller will be unstable if is lower than 0.4. The simulation re-sults are depicted in Fig. 16, and the conclusions are as follows.1) As shown in Fig. 16, the proposed profile controller isa little more sensitive to parameter estimation error thanMEWMA filter. However, there exists an interval around1 for parameter estimation error, within which the Kalmanfilter-based profile controller outperforms the MEWMAcontroller. In this case, the interval for the estimation errorlies in between 0.8 to 3.6. Practically, the ratio of esti-mated value to the true value of parameters ( ) is unlikely
202 IEEE TRANSACTIONS ON AUTOMATION SCIENCE AND ENGINEERING, VOL. 12, NO. 1, JANUARY 2015
larger than 3 if the data collection and analysis method arecorrect.
2) From the long-run point-of-view, it is worth noting that thetwo sets of algorithm behave in the similar way. When theestimation error is keeping increase, MSE of three parame-ters under two controllers gradually converges to the samevalue.
V. CONCLUSION AND FUTURE RESEARCH
The flatness, possessing a great influence on the subsequenceprocessing and macro properties of the produced CNTs film, isconsidered as a critical quality characteristic of the CNTs array.However, due to the immature technique of the CNTs array syn-thesis, the flatness of the CNTs array has not been controlledproperly. In order to stabilize the process and improve the flat-ness of CNTs array, a new run to run profile control methodis proposed by combining the R2R control technique with theprofile characterization of the CNTs array. In this approach, theprofile of CNTs array at measurement line is used to constructobjective function instead of multivariate vector of height valueat each measurement site; state-space model, which has abilityto differentiate between process noise and measurement error,is utilized to describe the production process; and Kalman filteris used to update the state of system according to latest output.The simulation study is carried out to evaluate the perfor-
mance of the proposed profile controller; three different typesof disturbance, namely ARMA (1, 1), ARMA (1, 1) with driftand shift, and ARMA (1, 1) with unknown gain, are consideredin the study. The results show that the proposed profile con-troller has ability to bring output of process to target and out-performs MEWMA under ARMA (1, 1) with and without mod-erate shift or drift; for the ARMA (1, 1) with unknown gain,there exists an sufficiently large interval around 1 for parameterestimation error in the real application, within which theKalmanfilter based profile controller is superior to MEWMA.Nano-manufacturing is recently beginning to emerge with
the development of nanotechnology; a lot of issues related toquality control in nano-manufacturing need to be addressed inthe future. First, different types of information, such as expert’sopinions and engineering knowledge, should be integrated withexperimental data by statistical approach when designing thecontroller for nano-manufacturing. Second, due to the complexgrowth mechanism of nanomaterials, modeling for the manu-facturing process need to be deeper investigated. Third, qualitycontrol theories should be extended to processes with multipleprofiles or data-intensive surfaces. The requirement for control-ling flatness is also seen in other processes. In this paper, weused a one-dimensional profile to represent the surface. Futureresearch that considers the whole two-dimensional surface datastructure may provide better uniformity control across the wholesurface. Fourth, measurements that are physically close to eachother may be spatially correlated; such spatial correlation is animportant feature of complex data and deserves further study.Last but not the least, the proposed profile control is still moresensitive to shift, drift as well as estimation error; hence, it isworth improving its robustness for more broad applications. Inaddition, it is still a challenge problem that how to model theprofile in order to preserve the critical information related to
product quality of interest while filtering as much useless noiseas possible, if using profile for process control.
ACKNOWLEDGMENT
The authors thank the associate editor and two anonymousreferees for their valuable comments, which have helped us im-prove this work greatly. They also thank Prof. S. Fan, Dr. L.Liu, and Dr. Q. Cai from Tsinghua-Foxconn NanotechnologyResearch Center for providing the raw data, contributing theirdomain expertise on CNTs array production.
REFERENCES
[1] K. L. Jiang, Q. Q. Li, and S. S. Fan, “Nanotechnology: Spinning contin-uous carbon nanotube yarns: Carbon nanotubes weave their way into arange of imaginative macroscopic applications,” Nature, vol. 419, no.6909, pp. 801–801, 2002.
[2] M. Kumar and Y. Ando, “Chemical vapor deposition of carbonnanotubes: A review on growth mechanism and mass production,” J.Nanosci. Nanotechnol., vol. 10, no. 6, p. 20, 2010.
[3] K. Jiang, J. Wang, Q. Li, L. Liu, C. Liu, and S. Fan, “Superalignedcarbon nanotube arrays, films, and yarns: A road to applications,” Adv.Mater., vol. 23, no. 9, pp. 1154–1161, 2011.
[4] C. Feng, K. Liu, J.-S. Wu, L. Liu, J.-S. Cheng, Y. Zhang, Y. Sun,Q. Li, S. Fan, and K. Jiang, “Flexible, stretchable, transparent con-ducting films made from superaligned carbon nanotubes,” Adv. Func-tional Mater., vol. 20, no. 6, pp. 885–891, 2010.
[5] Q. Huang, “Physics-driven Bayesian hierarchical modeling of thenanowire growth process at each scale,” IIE Trans., vol. 43, no. 1, pp.1–11, 2011.
[6] Q. Huang, L.Wang, T. Dasgupta, L. Zhu, P. K. Sekhar, S. Bhansali, andY. An, “Statistical weight kinetics modeling and estimation for silicananowire growth catalyzed by PD thin film,” IEEE Trans. Autom. Sci.Eng., vol. 8, no. 2, pp. 303–310, Apr. 2011.
[7] L. Wang and Q. Huang, “Cross-domain model building and valida-tion (CDMV): A new modeling strategy to reinforce understanding ofnanomanufacturing processes,” IEEE Trans. Autom. Sci. Eng., vol. 10,no. 3, pp. 571–578, Jul. 2013.
[8] T. Dasgupta, C. Ma, V. R. Joseph, Z. L. Wang, and C. F. J. Wu, “Sta-tistical modeling and analysis for robust synthesis of nanostructures,”J. Amer. Statistical Assoc., vol. 103, no. 482, pp. 594–603, Jun. 2008.
[9] X. Deng, V. R. Joseph, W. Mai, Z. L. Wang, and C. J. Wu, “Statis-tical approach to quantifying the elastic deformation of nanomaterials,”Proc. Nat. Academy Sci., vol. 106, no. 29, pp. 11845–11850, 2009.
[10] L. Xu and Q. Huang, “Modeling the interactions among neighboringnanostructures for local feature characterization and defect detection,”IEEE Trans. Autom. Sci. Eng., vol. 9, no. 4, pp. 745–754, Oct. 2012.
[11] L. Xu andQ. Huang, “EM estimation of nanostructure interactions withincomplete feature measurement and its tailored space filling designs,”IEEE Trans. Autom. Sci. Eng., vol. 10, no. 3, pp. 579–587, Jul. 2013.
[12] S. T. Tseng, F. Tsung, and P. Y. Liu, “Variable EWMA run-to-run con-troller for drifted processes,” IIE Trans., vol. 39, no. 3, pp. 291–301,2007.
[13] K. Wang and F. Tsung, “Run-to-run process adjustment using categor-ical observations,” J. Qual. Technol., vol. 39, no. 4, pp. 312–325, 2007.
[14] A. Ingolfsson and E. Sachs, “Stability and sensitivity of an EWMAcontroller,” J. Qual. Technol., vol. 25, no. 4, pp. 271–287, 1993.
[15] S. W. Butler and J. A. Stefani, “Supervisory run-to-run control ofpolysilicon gate etch using in-situ ellipsometry,” IEEE Trans. Semi-cond. Manuf., vol. 7, no. 2, pp. 193–201, 1994.
[16] E. Del Castillo, “Long run and transient analysis of a double EWMAfeedback controller,” IIE Trans., vol. 31, no. 12, pp. 1157–1169, 1999.
[17] E. Del Castillo and A. M. Hurwitz, “Run-to-run process control: Lit-erature review and extensions,” J. Qual. Technol., vol. 29, no. 2, pp.184–196, 1997.
[18] S. T. Tseng, R. J. Chou, and S. P. Lee, “A study on a multivariateEWMA controller,” IIE Trans., vol. 34, no. 6, pp. 541–549, 2002.
[19] E. Del Castillo and R. Rajagopal, “A multivariate double EWMAprocess adjustment scheme for drifting processes,” IIE Trans., vol. 34,no. 12, pp. 1055–1068, 2002.
[20] W. Wu and C. Y. Maa, “Double EWMA controller using neuralnetwork-based tuning algorithm for MIMO non-squared systems,” J.Process Control, vol. 21, no. 4, pp. 564–572, 2011.
WANG et al.: A R2R PROFILE CONTROL ALGORITHM FOR IMPROVING THE FLATNESS OF NANO-SCALE PRODUCTS 203
[21] J. H. Chen and F. Wang, “PLS based dEWMA run-to-run controllerfor MIMO non-squared semiconductor processes,” J. Process Control,vol. 17, no. 4, pp. 309–319, 2007.
[22] S. T. Tseng, A. B. Yeh, F. Tsung, and Y. Y. Chan, “A study of variableEWMA controller,” IEEE Trans. Semicond. Manuf., vol. 16, no. 4, pp.633–643, 2003.
[23] G. Box and G. M. Jenkins, Time Series Analysis Forecasting and Con-trol. Oakland, CA, USA: Holden-Day, 1976.
[24] R. E. Kalman, “A new approach to linear filtering,” ASME J. BasicEng., no. 3, pp. 35–45, 1960.
[25] E. Palmer, W. Ren, C. J. Spanos, and K. Poolla, “Control of photoresistproperties: A Kalman filter based approach,” IEEE Trans. Semicond.Manuf., vol. 9, no. 2, pp. 208–214, 1996.
[26] E. Del Castillo and D. C. Montgomery, “A Kalman filtering process-control scheme with an application in semiconductor short-run manu-facturing,” Qual. Rel. Eng. Int., vol. 11, no. 2, pp. 101–105, 1995.
[27] E. Del Castillo, R. Pan, and B. M. Colosimo, “A unifying view ofsome process adjustment methods,” J. Qual. Technol., vol. 35, no. 3,pp. 286–293, 2003.
[28] J. H. Chen, T. W. Kuo, and A. C. Lee, “Run-by-run process control ofmetal sputter deposition: Combining time series and extended Kalmanfilter,” IEEE Trans. Semicond. Manuf., vol. 20, no. 3, pp. 278–285,Aug. 2007.
[29] W. H. Woodall, D. J. Spitzner, D. C. Montgomery, and S. Gupta,“Using control charts to monitor process and product quality profiles,”J. Qual. Technol., vol. 36, no. 3, pp. 309–320, 2004.
[30] K. Kim, M. A. Mahmoud, and W. H. Woodall, “On the monitoring oflinear profiles,” J. Qual. Technol., vol. 35, no. 3, pp. 317–328, 2003.
[31] J. D. Williams, W. H. Woodall, and J. B. Birch, “Statistical monitoringof nonlinear product and process quality profiles,” Qual. Rel. Eng. Int.,vol. 23, no. 8, pp. 925–941, 2007.
[32] J. H. Jin and J. J. Shi, “Automatic feature extraction of waveform sig-nals for in-process diagnostic performance improvement,” J. Intell.Manuf., vol. 12, no. 3, pp. 257–268, 2001.
[33] S. Y. Zhou, B. C. Sun, and J. J. Shi, “An SPC monitoring systemfor cycle-based waveform signals using Haar transform,” IEEE Trans.Autom. Sci. Eng., vol. 3, no. 1, pp. 60–72, Jan. 2006.
[34] M. M. Gardner, R. S. J. C. G. Lu, J. J. Wortman, B. E. Hornung, H. H.Heinisch, E. A. Rying, S. Rao, and J. C. Davis, “Equipment fault detec-tion using spatial signatures,” IEEE Trans. Compon., Packag., Manuf.Technol., Part C, vol. 20, no. 4, pp. 295–304, 1997.
[35] J. H. Jin and J. J. Shi, “Feature-preserving data compression ofstamping tonnage information using wavelets,” Technometrics, vol.41, no. 4, pp. 327–339, 1999.
[36] J. D. Williams, J. B. Birch, W. H. Woodall, and N. M. Ferry, “Statis-tical monitoring of heteroscedastic dose-response profiles from high-throughput screening,” J. Agricultural Biological and EnvironmentalStatist., vol. 12, no. 2, pp. 216–235, Jun. 2007.
[37] T. M. Young, P. M. Winistorfer, and S. Q. Wang, “Multivariate con-trol charts of MDF and OSB vertical density profile attributes,” ForestProducts J., vol. 49, no. 5, pp. 79–86, May 1999.
[38] T. Saleh and M. Rahman, “In-process truing for ELID (electrolyticin-process dressing) grinding by pulsewidth control,” IEEE Trans.Autom. Sci. Eng., vol. 8, no. 2, pp. 338–346, Apr. 2011.
[39] T. Kandikjan, J. J. Shah, and J. K. Davidson, “A mechanism forvalidating dimensioning and tolerancing schemes in CAD systems,”Comput.-Aided Design, vol. 33, no. 10, pp. 721–737, 2001.
[40] K. Carr and P. Ferreira, “Verification of form tolerances Part I: Basicissues, flatness, and straightness,” Precision Eng., vol. 17, no. 2, pp.131–143, 1995.
[41] G. Taguchi, Introduction to Quality Engineering: Designing QualityInto Products and Processes. Toyko, Japan: Asian Productivity Org.,1986.
[42] F. He, K. Wang, and W. Jiang, “A general harmonic rule controller forrun-to-run process control,” IEEE Trans. Semicond. Manuf., vol. 22,no. 2, pp. 232–44, May 2009.
[43] J. Lin and K. Wang, “A Bayesian framework for online parameter es-timation and process adjustment using categorical observations,” IIETrans., vol. 44, no. 4, pp. 291–300, 2012.
[44] W. J. Campbell, S. K. Firth, A. J. Toprac, and T. F. Edgar, “A compar-ison of run-to-run control algorithms,” in Proc. Amer. Control Conf.,2002, vol. 1–6, pp. 2150–2155.
[45] J. Liu, J. Jin, and J. Shi, “State space modeling for 3-d variationpropagation in rigid-body multistage assembly processes,” IEEETrans. Autom. Sci. Eng., vol. 7, no. 2, pp. 274–290, Apr. 2010.
Xin Wang received the B.S. degree from theDepartment of Industrial Engineering, Xi DianUniversity, Xi’an, China, in 2009. He is currentlyworking towards the Ph.D. degree at the Departmentof Industrial Engineering, Tsinghua University,Beijing, China.His general research interests include statistical
modeling, process control and experiment design fornano-manufacturing.Mr. Wang is a Member of Institute for Oper-
ations Research and the Management Sciences(INFORMS).
SuWu received the Ph.D. degree in mechanical engi-neering from the Tsinghua University, Beijing, Chinain 1994.He is currently a Professor with the Department of
Industrial Engineering, Tsinghua University, Beijing,China. His research focus is on manufacturing andservice quality control, manufacturing technology,reliability and maintenance.Prof. Wu is a member of Editorial Board for
the International Journal of Production Eco-nomics, and an Associate Member of China High
Tech. Industrialization.
Kaibo Wang received the B.S. and M.S. degrees inmechatronics from Xi’an Jiaotong University, Xi’an,China, and the Ph.D. degree in industrial engineeringand engineering management from the Hong KongUniversity of Science and Technology, Hong Kong.He is an Associate Professor with the Department
of Industrial Engineering, Tsinghua University, Bei-jing, China. He has published papers in the Journalof Quality Technology, the IIE Transactions, Qualityand Reliability Engineering International, the Inter-national Journal of Production Research, and others.
His research is devoted to statistical quality control and data-driven complexsystem modeling, monitoring, diagnosis and control, with a special emphasison the integration of engineering knowledge and statistical theories for solvingproblems from the real industry.Dr. Wang is a member of INFORMS, ASQ, and IIE.


![INDEX [] · INDEX NAMES. Abraham Mr., 65 ... Soc. publications, 94, 160. 182, 203, 208. ... Society , Transactions nf, 192 dimming* Well, 55](https://img.dokumen.tips/doc/110x75/5b9ad47f09d3f24f678c8933/index-index-names-abraham-mr-65-soc-publications-94-160-182.jpg)