Embed Size (px)
Citation preview

IGCSE Biology (O610) Workbook
© A. Nixon 2016
For videos, worksheets and other resources go to ScienceSauceOnline.com 1
Chapter 19
Organisms and their environment The stuff you need to know in this chapter: 19.1 ENERGY FLOW Core • State that the Sun is the principal source of energy input to biological systems Ex tended • Describe the flow of energy through living organisms including light energy from the sun and chemical energy in organisms and its eventual transfer to the
environment 19.2 FOOD CHAINS AND FOOD WEBS Core • Define a food chain as showing the transfer of energy from one organism to the next, beginning with a producer • State that energy is transferred between organisms in a food chain by ingestion • Construct simple food chains • Define a food web as a network of interconnected food chains • Define producer as an organism that makes its own organic nutrients, usually using energy from sunlight, through photosynthesis • Define consumer as an organism that gets its energy by feeding on other organisms • State that consumers may be classed as primary, secondary and tertiary according to their position in a food chain • Define herbivore as an animal that gets its energy by eating plants • Define carnivore as an animal that gets its energy by eating other animals • Define decomposer as an organism that gets its energy from dead or waste organic material • Interpret food chains and food webs in terms of identifying producers and consumers • Use food chains and food webs to describe the impacts humans have through over-harvesting of food species and through introducing foreign species to a
habitat • Draw, describe and interpret pyramids of numbers Ex tended • Describe how energy is transferred between trophic levels • Define trophic level as the position of an organism in a food chain, food web, pyramid of numbers or pyramid of biomass • Explain why the transfer of energy from one trophic level to another is inefficient • Explain why food chains usually have fewer than five trophic levels • Explain why there is a greater efficiency in supplying plants as human food, and that there is a relative inefficiency in feeding crop plants to livestock that will
be used as food • Identify producers, primary consumers, secondary consumers, tertiary consumers and quaternary consumers as the trophic levels in food webs, food chains,
pyramids of numbers and pyramids of biomass

IGCSE Biology (O610) Workbook
© A. Nixon 2016
For videos, worksheets and other resources go to ScienceSauceOnline.com 2
• Draw, describe and interpret pyramids of biomass • Discuss the advantages of using a pyramid of biomass rather than a pyramid of numbers to represent a food chain 19.3 NUTRIENT CYCLES Core • Describe the carbon cycle, limited to photosynthesis, respiration, feeding, decomposition, fossilisation and combustion • Discuss the effects of the combustion of fossil fuels and the cutting down of forests on the carbon dioxide concentrations in the atmosphere • Describe the water cycle, limited to evaporation, transpiration, condensation and precipitation Ex t ended • Describe the nitrogen cycle in terms of: – decomposition of plant and animal protein to ammonium ions – nitrification – nitrogen fixation by lightning and bacteria – absorption of nitrate ions by plants – production of amino acids and proteins – feeding and digestion of proteins – deamination – denitrification • State the roles of microorganisms in the nitrogen cycle, limited to decomposition, nitrification, nitrogen fixation and denitrification (generic names of individual
bacteria, e.g. Rhizobium, are no t required) 19.4 POPULATION SIZE Core • Define population as a group of organisms of one species, living in the same area, at the same time • Identify and state the factors affecting the rate of population growth for a population of an organism, limited to food supply, predation and disease • Discuss the increase in human population size over the past 250 years and its social and environmental implications • Interpret graphs and diagrams of human population growth Ex t ended • Define community as all of the populations of different species in an ecosystem • Define ecosystem as a unit containing the community of organisms and their environment, interacting together, e.g. a decomposing log, or a lake • Identify the lag, exponential (log), stationary and death phases in the sigmoid population growth curve for a population growing in an environment with limited
resources • Explain the factors that lead to each phase in the sigmoid curve of population growth, making reference, where appropriate, to the role of limiting factors

IGCSE Biology (O610) Workbook
© A. Nixon 2016
For videos, worksheets and other resources go to ScienceSauceOnline.com 3
FOOD CHAINS AND WEBS 1. Name input of energy into most biological systems _________________________________________________________________ 2. Name a type of ecosystem that doesn’t rely on the sun for energy _________________________________________________________________
(You don’t need to know about these for IGCSE bio, but it’s good to know why we say “most” ecosystems rely on the sun)3. Complete the table to define the following words:
Word Definition
Food chain ____________________________________________________________________________________________________________
Food web ____________________________________________________________________________________________________________
Producer ____________________________________________________________________________________________________________
Consumer ____________________________________________________________________________________________________________
Herbivore ____________________________________________________________________________________________________________
Carnivore ____________________________________________________________________________________________________________
Decomposer ____________________________________________________________________________________________________________
Trophic level ____________________________________________________________________________________________________________

IGCSE Biology (O610) Workbook
© A. Nixon 2016
For videos, worksheets and other resources go to ScienceSauceOnline.com 4
4. Explain what is meant by term primary, secondary, tertiary and quaternary when discussing consumers _________________________________________________________________ _________________________________________________________________ 5. a) Draw a food chain based on the following information:
A hawk eats field mice. Mice are herbivores. In this food chain, grass is the producer b) Draw a food web based on the following information
Grass is the only producer. Grasshoppers, mice and rabbits are primary consumers. Lizards and hawks eat grasshoppers but the hawk will also eat lizards, rabbits, mice and snakes. Snakes feed on mice.
c) For the food web you have drawn, describe the possible results on other organisms if there is an outbreak of a disease that only affects snakes. _________________________________________________________________ _________________________________________________________________ _________________________________________________________________ _________________________________________________________________ _________________________________________________________________ _________________________________________________________________
IGCSE Biology (O610) Workbook
© A. Nixon 2016
For videos, worksheets and other resources go to ScienceSauceOnline.com 5
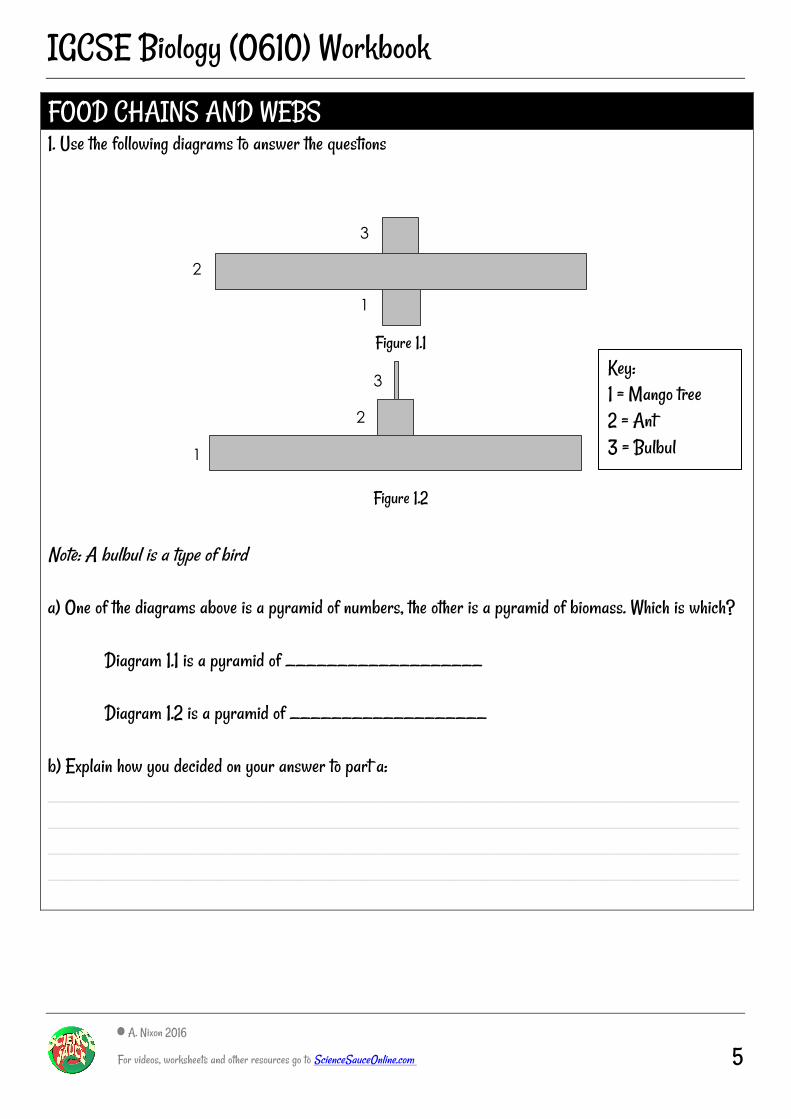
FOOD CHAINS AND WEBS 1. Use the following diagrams to answer the questions
Note: A bulbul is a type of bird a) One of the diagrams above is a pyramid of numbers, the other is a pyramid of biomass. Which is which?
Diagram 1.1 is a pyramid of ___________________ Diagram 1.2 is a pyramid of ___________________
b) Explain how you decided on your answer to part a: _________________________________________________________________ __________________________________________________________________________________________________________________________________ _________________________________________________________________
1
2
3
1
2
3
Figure 1.1
Figure 1.2
Key: 1 = Mango tree 2 = Ant 3 = Bulbul
IGCSE Biology (O610) Workbook
© A. Nixon 2016
For videos, worksheets and other resources go to ScienceSauceOnline.com 6
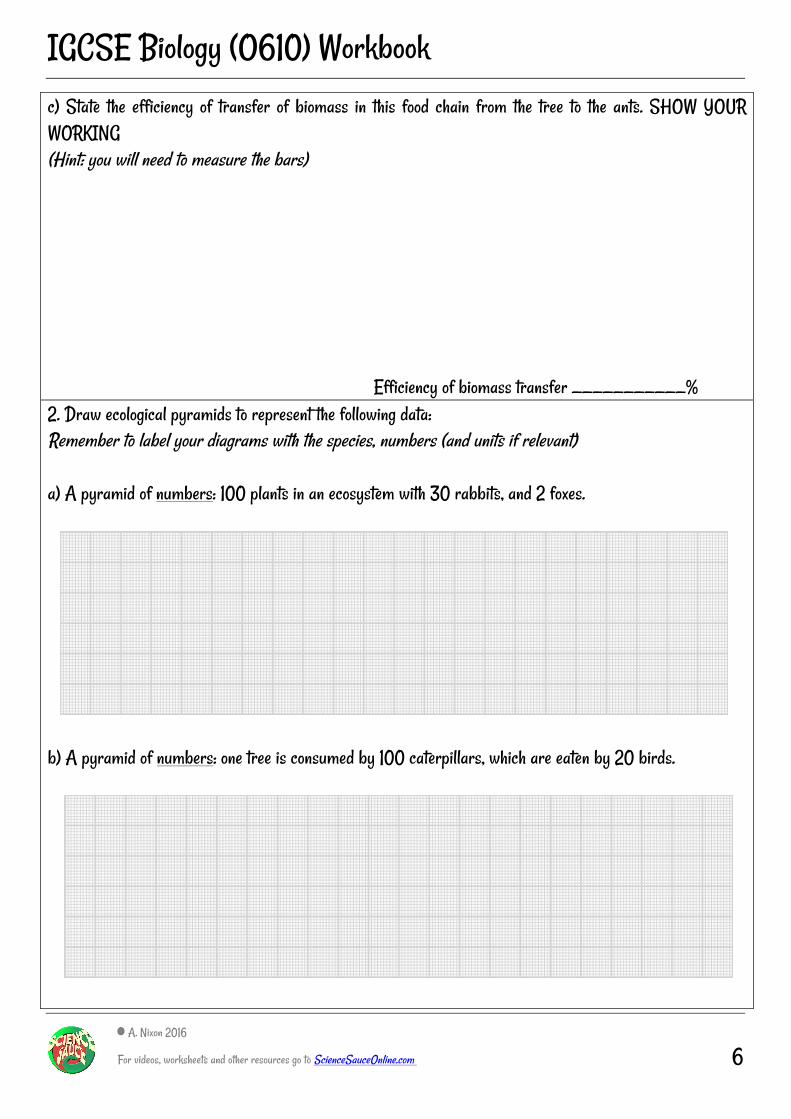
c) State the efficiency of transfer of biomass in this food chain from the tree to the ants. SHOW YOUR WORKING (Hint: you will need to measure the bars)
Efficiency of biomass transfer ___________% 2. Draw ecological pyramids to represent the following data: Remember to label your diagrams with the species, numbers (and units if relevant) a) A pyramid of numbers: 100 plants in an ecosystem with 30 rabbits, and 2 foxes. b) A pyramid of numbers: one tree is consumed by 100 caterpillars, which are eaten by 20 birds.

IGCSE Biology (O610) Workbook
© A. Nixon 2016
For videos, worksheets and other resources go to ScienceSauceOnline.com 7
c) A pyramid of biomass: one tree is consumed by many caterpillars, which are eaten by a few birds. (You should estimate the mass. Remember that transfers in a food chain are roughly 10% efficient)

IGCSE Biology (O610) Workbook
© A. Nixon 2016
For videos, worksheets and other resources go to ScienceSauceOnline.com 8
THE CARBON CYCLE 1. Draw a diagram of the carbon cycle. Include the following things:
Explain how the combustion of fossil fuels alters carbon dioxide concentration in the atmosphere. Refer to your diagram if necessary. _________________________________________________________________ __________________________________________________________________________________________________________________________________ _________________________________________________________________
animals
CO2 in the
air
plants fossil fuels
microorganisms (and
other decomposers)
IGCSE Biology (O610) Workbook
© A. Nixon 2016
For videos, worksheets and other resources go to ScienceSauceOnline.com 9
Deforestation can affect the atmospheric carbon dioxide levels. Using the following points as guidance, explain these effects. Reduced photosynthesis _________________________________________________________________ __________________________________________________________________________________________________________________________________Burning wood _________________________________________________________________ __________________________________________________________________________________________________________________________________Rotting wood __________________________________________________________________________________________________________________________________ _________________________________________________________________
IGCSE Biology (O610) Workbook
© A. Nixon 2016
For videos, worksheets and other resources go to ScienceSauceOnline.com 10
THE WATER CYCLE 1. Draw a diagram of the water cycle. Your diagram should include the following processes:
evaporation transpiration condensation precipitation
IGCSE Biology (O610) Workbook
© A. Nixon 2016
For videos, worksheets and other resources go to ScienceSauceOnline.com 11
THE NITROGEN CYCLE 1. Complete the words to list the main storages of nitrogen in the nitrogen cycle:
i) A__________ nitrogen ii) P__________ in plants iii) P__________ in animals iv) A__________ v) N__________s
1. Draw a diagram of the nitrogen cycle.

IGCSE Biology (O610) Workbook
© A. Nixon 2016
For videos, worksheets and other resources go to ScienceSauceOnline.com 12
POPULATION SIZE 1. Define “Population” ___________________________________________________________________________________________________________________________________________________________________________________________________ 2. State three factors that limit population growth rates.
i) ______________________ ii) ______________________ iii) ______________________
3. Describe and explain the change in human population over the past 300 years. ______________________________________________________________________________________________________________________________________________________________________________________________________________________________________________________________________________________________________________________________________________________________________________________________________

IGCSE Biology (O610) Workbook
© A. Nixon 2016
For videos, worksheets and other resources go to ScienceSauceOnline.com 13
4. a) Outline the information that is presented in a population pyramid __________________________________________________________________________________________________________________________________ b) Look at the population pyramids below and answer the questions i) Complete the sentences based on the age pyramids
In country A, the birth rate is significantly higher than / is significantly less than / is about
equal to the death rate.
In country B, the birth rate is significantly higher than / is significantly less than / is about
equal to the death rate.
ii) Predict the future changes in population for countries A and B. __________________________________________________________________________________________________________________________________ __________________________________________________________________________________________________________________________________
Country A Country B
IGCSE Biology (O610) Workbook
© A. Nixon 2016
For videos, worksheets and other resources go to ScienceSauceOnline.com 14
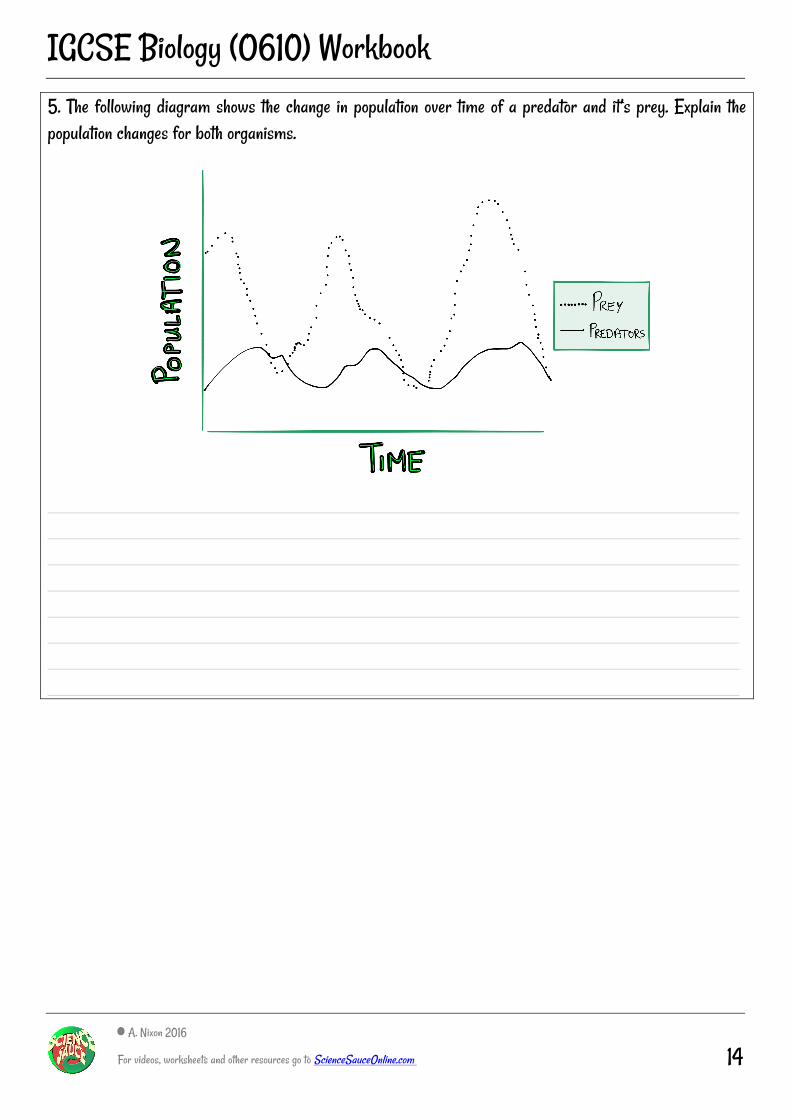
5. The following diagram shows the change in population over time of a predator and it’s prey. Explain the population changes for both organisms. ________________________________________________________________________________________________________________________________________________________________________________________________________________________________________________________________________________________________________________________________________________________________________________________________________________________________________________________________________________________________________________________________________

IGCSE Biology (O610) Workbook
© A. Nixon 2016
For videos, worksheets and other resources go to ScienceSauceOnline.com 15
6. Define the term “community” __________________________________________________________________________________________________________________________________ 7. Define the term “ecosystem” __________________________________________________________________________________________________________________________________ 8. Draw a graph of idealized population growth and decline of yeast. Label the lag, log, stationary and death phase on your diagram 9. Outline what is meant by a “sigmoidal” growth curve ____________________________________________________________________________________________________________________________________________________________________________________________________________________________________________________________________

IGCSE Biology (O610) Workbook
© A. Nixon 2016
For videos, worksheets and other resources go to ScienceSauceOnline.com 16
10. Complete the sentences below to explain the shape of the sigmoidal growth curve of yeast. Use the words listed to help.
log lag limiting factors rapid exceeds death few exponential food decreases stationary
In the beginning there is a ________________ phase in which there are
________________ cells reproducing. After this, growth becomes very ________________.
This is known as the ________________ phase and ________________ growth is observed.
After time there may be ________________ ________________ present, such as the limited
amount of ________________ which limits population growth. Soon, the number of
deaths of cells ________________ the number of new cells produced. This is the
________________ phase. The ________________ phase is observed when the number of
deaths ________________ the number of new cells produced, and the population
________________.