Embed Size (px)
Citation preview

19 - Adversary Sequence Diagram (ASD) Model
The Twenty-Sixth International Training Course
Page 1
19. Adversary Sequence Diagram (ASD) Model
October 24 – November 11, 2016Albuquerque, New Mexico, USA
Mark Snell
Adversary Sequence Diagram Model
Learn ing Object ives
After completing this module, you should be able to:• Identify an Adversary Sequence Diagram (ASD) and
describe what it represents• Describe why an ASD is useful in the analysis of a PPS• Identify the three steps to use when developing an ASD• Develop an ASD for an example facility
2

19 - Adversary Sequence Diagram (ASD) Model
The Twenty-Sixth International Training Course
Page 2
Adversary Sequence Diagram Model
INFCIRC/225/Revis ion 5
• Chapter 4 – Requirements for measures against unauthorized removal of nuclear material in use and storage
• Chapter 5 – Requirements for measures against sabotage of nuclear facility and nuclear materials in use and storage
3
Adversary Sequence Diagram Model
Adversary Sequence Diagram
Adversary Sequence Diagram: A graphical model used to help evaluate the effectiveness of the PPS at a facility• ASD represents
Paths that adversaries can follow to accomplish sabotage or theft PPS elements along paths
• ASD is used to determine the most vulnerable path for specific PPS and threat
4

19 - Adversary Sequence Diagram (ASD) Model
The Twenty-Sixth International Training Course
Page 3
Off Site
Site Security Area
Building Protected Area
Controlled Building
Controlled Room
Target Enclosure
Physical Areas
Protection Layer
Path Elements
Target Location
Adversary Sequence Diagram Model
Concept of Adversary Sequence Diagram
• Composed of layers• Target locations that define an ASD are at the bottom
5
Adversary Sequence Diagram Model
Three Steps to Create an Adversary Sequence D iagram1. Model the facility by separating it into adjacent physical
areas2. Define protection layers in terms of path elements
between areas3. Assign minimum probability of detection (PD) and delay
time (T) for each path element and physical area
6

19 - Adversary Sequence Diagram (ASD) Model
The Twenty-Sixth International Training Course
Page 4
Building Protected Area
Site Security Area
Off Site
Controlled Room
Controlled Building
Target
Enclosure
Target
Adversary Sequence Diagram Model
Fac i l i ty
7
Off Site
Site Security Area
Building Protected Area
Controlled Building
Controlled Room
Target Enclosure
Adversary Sequence Diagram Model
S tep 1: Model the Fac i l i ty
• Separate it into adjacent physical areas
8

19 - Adversary Sequence Diagram (ASD) Model
The Twenty-Sixth International Training Course
Page 5
Adversary Sequence Diagram Model
S tep 2: Def ine Protect ion Layers
• Identify protection layers at the facility• Each protection layer separates two physical areas
9
Physical Area
Site Security Area
Building Protected Area
Controlled Building
Controlled Room
Target Enclosure
Protection Layers
Off Site
Adversary Sequence Diagram Model
S tep 2: Def ine Protect ion Layers (cont ’d)
• Identify Path Elements in Protection Layers A Path Element is any distinct part of the protection layer
between two physical areas An adversary must pass over, under, around or through a Path
Element to move between adjacent physical areas
10

19 - Adversary Sequence Diagram (ASD) Model
The Twenty-Sixth International Training Course
Page 6
Adversary Sequence Diagram Model
S tep 3: Ass ign Detect ion and Delay Values
• Assign minimum Probability of Detection (PD) and delay time (T) for each path element and physical area
11
• Path elements
Determine minimum PD• Intrusion detection • Entry control• Human surveillance• Contraband and Category 1
detection
Determine minimum delay time• Barriers• Security officers• Locks• Theft or sabotage tasks
• Physical areas Determine minimum PD
• Intrusion detection• Human surveillance
Determine minimum delay time
• Security officers• Transit time
Adversary Sequence Diagram Model
Sample Fac i l i ty
12
Off Site
Site Campus
Fence
Gate
Secure Room
Reactor Area
Target
Reactor Building
Reactor Complex
Isolation Zone
Vehicle Portal
Personnel Portal
DOOR
DOOR
DOORSURFACE
SURFACE
DOOR

19 - Adversary Sequence Diagram (ASD) Model
The Twenty-Sixth International Training Course
Page 7
Off Site
Site Campus
Reactor Complex
Reactor Building
Reactor Area
Secure Room
Physical Areas
Adversary Sequence Diagram Model
S tep 1: Model the Sample Fac i l i ty
• Separate it into adjacent physical areas
13
Adversary Sequence Diagram Model
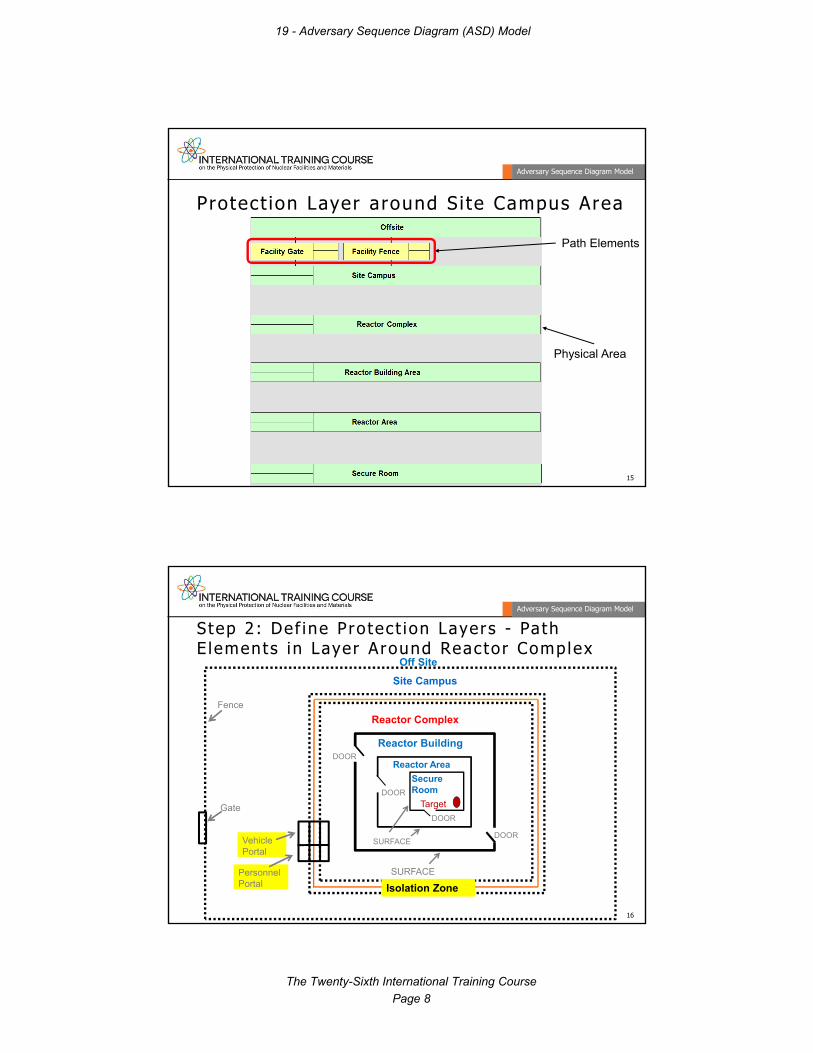
S tep 2: Def ine Protec t ion Layers - Path E lements in Layer around S i te Campus Area
14
Off Site
Site Campus
Fence
Gate
Secure Room
Reactor Area
Target
Reactor Building
Reactor Complex
Isolation Zone
Vehicle Portal
Personnel Portal
DOOR
DOOR
DOORSURFACE
SURFACE
DOOR
19 - Adversary Sequence Diagram (ASD) Model
The Twenty-Sixth International Training Course
Page 8
Adversary Sequence Diagram Model
P rotect ion Layer around Si te Campus Area
15
Path Elements
Physical Area
Adversary Sequence Diagram Model
S tep 2: Def ine Protec t ion Layers - Path E lements in Layer Around Reactor Complex
16
Off Site
Site Campus
Fence
Gate
Secure Room
Reactor Area
Target
Reactor Building
Reactor Complex
Isolation Zone
Vehicle Portal
Personnel Portal
DOOR
DOOR
DOORSURFACE
SURFACE
DOOR

19 - Adversary Sequence Diagram (ASD) Model
The Twenty-Sixth International Training Course
Page 9
Adversary Sequence Diagram Model
P ro tec t ion Layer around the Reactor Complex
17
Path Elements
Protection Layer
Physical Areas
Adversary Sequence Diagram Model
Th i rd Protec t ion Layer a t the Sample Fac i l i tyOff Site
Site Campus
Fence
Gate
Secure Room
Reactor Area
Target
Reactor Building
Reactor Complex
Isolation Zone
Vehicle Portal
Personnel Portal
DOOR
DOOR
DOORSURFACE
SURFACE
DOOR
18

19 - Adversary Sequence Diagram (ASD) Model
The Twenty-Sixth International Training Course
Page 10
Adversary Sequence Diagram Model
S tep 2: Def ine Protec t ion Layers - Path E lements in Layer around Reactor Bu i ld ing
19
Path Elements
Protection Layer
Physical Areas
Adversary Sequence Diagram Model
Pa th E lements f rom Reactor Complex to Reactor Bu i ld ing• Include characteristically different path elements in each protection layer• Multiple path elements with the same characteristics can be represented by
a single element
20
ASD Depiction
Indicates Not Present

19 - Adversary Sequence Diagram (ASD) Model
The Twenty-Sixth International Training Course
Page 11
Adversary Sequence Diagram Model
Completed S i te -Spec i f i c ASD for Sample Fac i l i ty
21
Adversary Sequence Diagram Model
Example of a Jump
22
Off Site
Site Campus
Fence
Gate
Secure Room
Reactor Area
Target
Reactor Building
Reactor Complex
Isolation Zone
Vehicle Portal
Personnel Portal
DOOR
DOOR
DOORSURFACE
SURFACE
DOOR

19 - Adversary Sequence Diagram (ASD) Model
The Twenty-Sixth International Training Course
Page 12
Adversary Sequence Diagram Model
Jumps Create Redundanc ies When Protec t ion Layers Are Ident i f ied around Adjacent Areas • The same path element will appear in protection areas around two or more
adjacent physical areas
23Path elements in protection layer around the Secure Room
Common Elements
Path elements in protection layer boundary around Reactor Area
Adversary Sequence Diagram Model
S i te -Spec i f i c ASD for Sample Fac i l i ty w i th a Jump
24
Representation of Jump

19 - Adversary Sequence Diagram (ASD) Model
The Twenty-Sixth International Training Course
Page 13
Adversary Sequence Diagram Model
Mul t ip le ASDs May Be Required
• A different ASD may be required for each unique situation Target Target location (glove box versus floor vault) Facility condition (day, night, normal operation, shutdown,
refueling, etc.) Adversary objective (theft or sabotage) Threat characteristics
• The complexity of multiple targets may be reduced by examining “worst-case” or “bounding” situations
25
Adversary Sequence Diagram Model
S tep 3: Ass ign Detect ion and Delay Values
• Assign minimum Probability of Detection (PD) and delay time (T) for each path element and physical area
26
• Path element
Determine minimum PD• Intrusion detection • Entry control• Human surveillance• Contraband and Category 1
detection
Determine minimum delay time• Barriers• Security officers• Locks• Theft or sabotage tasks
• Physical area Determine minimum PD
• Intrusion detection• Human surveillance
Determine minimum delay time
• Security officers• Transit time
Data for the detection and delay values can be found in the hypothetical facility data book.

19 - Adversary Sequence Diagram (ASD) Model
The Twenty-Sixth International Training Course
Page 14
Adversary Sequence Diagram Model
M in imum Performance Values
• Minimum performance data are used for each path element and physical area to provide a conservative estimate of system performance
• Review data for each path element and select the minimum performance value that is within the DBT capabilities
• PD and delay time values do not have to be for the same DBT tool set
27
Adversary Sequence Diagram Model
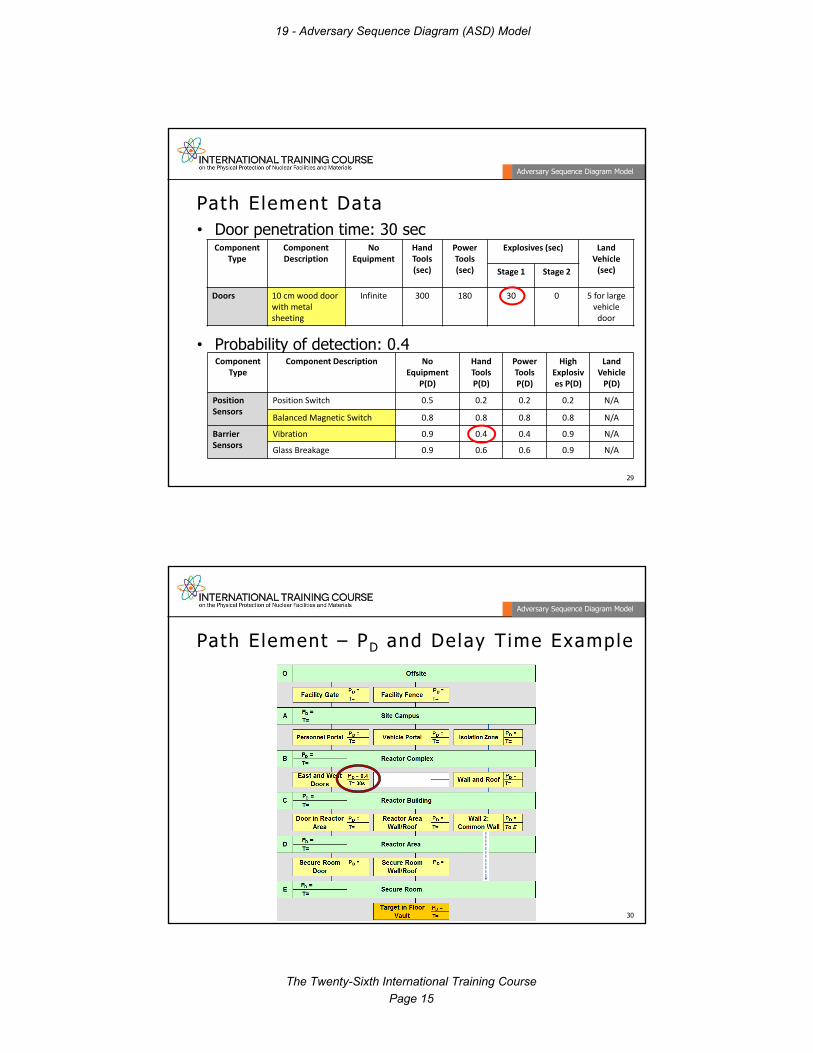
Path E lement Example
• Building Door Characteristics 10-cm wood door with metal sheeting Balanced magnetic switch position sensor Vibration sensor
• DBT capabilities Traveling on foot Hand tools / Power tools Explosives
28
19 - Adversary Sequence Diagram (ASD) Model
The Twenty-Sixth International Training Course
Page 15
ComponentType
ComponentDescription
No Equipment
HandTools (sec)
Power Tools (sec)
Explosives (sec) Land Vehicle(sec)Stage 1 Stage 2
Doors 10 cm wood door with metal sheeting
Infinite 300 180 30 0 5 for large vehicle door
Adversary Sequence Diagram Model
Path E lement Data• Door penetration time: 30 sec
• Probability of detection: 0.4
29
Component Type
Component Description No Equipment
P(D)
Hand Tools P(D)
Power Tools P(D)
High Explosives P(D)
Land Vehicle P(D)
Position Sensors
Position Switch 0.5 0.2 0.2 0.2 N/A
Balanced Magnetic Switch 0.8 0.8 0.8 0.8 N/A
Barrier Sensors
Vibration 0.9 0.4 0.4 0.9 N/A
Glass Breakage 0.9 0.6 0.6 0.9 N/A
Adversary Sequence Diagram Model
Path E lement – PD and Delay Time Example
30

19 - Adversary Sequence Diagram (ASD) Model
The Twenty-Sixth International Training Course
Page 16
Adversary Sequence Diagram Model
Phys ica l Area Example
• Research Complex 30 meters minimum distance from isolation zone to building Random patrol by guards
• DBT Capabilities Traveling on foot Hand tools / power tools Explosives
31
Adversary Sequence Diagram Model
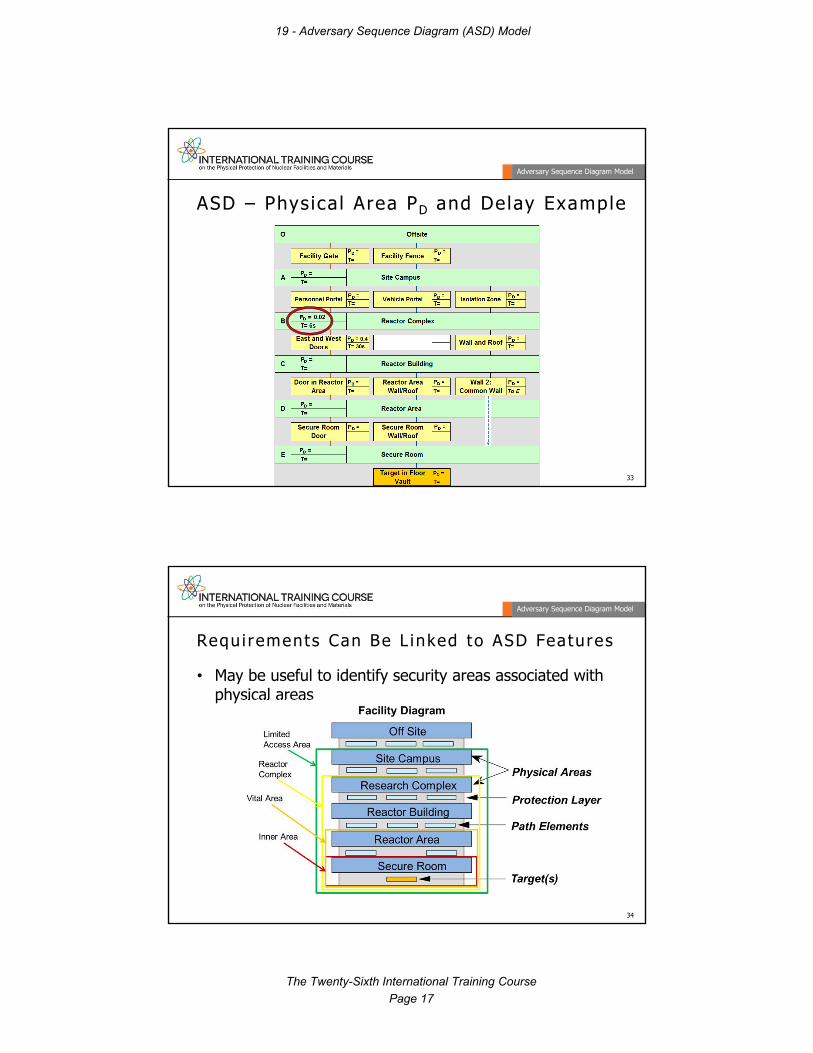
Phys ica l Area Data
• Transit time: 6 seconds (Data book, Table 18, Running Rates; running with tools)
• Probability of detection: 0.02 (Security Officer on random patrol)
32
Component Type
Component Description No Equipment
P(D)
Small Arms P(D)
Light Antitank Weapons
(LAW) P(D)
Independent of threat attribute
P(D)
SO on Patrol
Random .02 Scheduled .01
19 - Adversary Sequence Diagram (ASD) Model
The Twenty-Sixth International Training Course
Page 17
Adversary Sequence Diagram Model
ASD – Phys ica l Area PD and Delay Example
33
Adversary Sequence Diagram Model
Requ i rements Can Be L inked to ASD Features
• May be useful to identify security areas associated with physical areas
34

19 - Adversary Sequence Diagram (ASD) Model
The Twenty-Sixth International Training Course
Page 18
Adversary Sequence Diagram Model
Summary
• An ASD represents Paths that adversaries can follow to accomplish sabotage or theft PPS elements along paths
• ASD is used to determine the most vulnerable path for a specific PPS and threat
• Three steps used to create an ASD 1. Model the facility by separating it into adjacent physical areas2. Define protection layers in terms of path elements between
areas3. Assign probability of detection (PD) and delay time (T) for each
path element and physical area
35