Embed Size (px)
Citation preview

Kirk R. SmithProfessor of GlobalEnvironmental HealthUniversity of CaliforniaBerkeley
18th Annual SewellDistinguished Lecturein EnvironmentalHealth Sciences
Columbia University

World Health Reports – 2002, 2001
4.9 million deaths/y
Global Burden of Disease from Top 10 Risk Factorsplus selected other risk factors
0% 2% 4% 6% 8% 10%
Climate change
Urban outdoor air pollution
Lead (Pb) pollution
Physical inactivity
Road traffic accidents*
Occupational hazarads (5 kinds)
Overweight
Indoor smoke from solid fuels
Lack of Malaria control*
Cholesterol
Child cluster vaccination*
Unsafe water/sanitation
Alcohol
Tobacco
Blood pressure
Unsafe sex
Underweight
Percent of All DALYs in 2000
World HealthOrganization, 2004
Authoritative estimates are thatthe eventual total prematuredeaths from Chernobyl willbe 4000-10,000 after manydecades – nearly all from cancer
How much would 12 Chernobyl-size accidents per year add tothe global burden of disease?
Lost Healthy Life YearsBest measure of ill-health

Global Burden of Disease from Top 10 Risk Factorsplus selected other risk factors
0.0% 2.0% 4.0% 6.0% 8.0% 10.0%
Underweight
Unsafe sex
Blood pressure
Tobacco
Alcohol
Unsafe water/sanitation
Child cluster vaccination*
Cholesterol
Lack of Malaria control*
Indoor smoke from solid fuels
Overweight
Occupational hazards (5 kinds)
Road traffic accidents*
Physical inactivity
Lead (Pb) pollution
Urban outdoor air pollution
Climate change
Chernobyl per month
Percent of All DALYs
1.6 million prematuredeaths/year
0.8 million prematuredeaths/year
0.12 million prematuredeaths/year

Oldest Pollution Source in Human History

Households Using Solid Cooking Fuels
For 2005, CRA-10 preliminary


Or, since wood is mainly just carbon, hydrogen, and oxygen,doesn’t it just change to CO2 and H2 O when it is combined with oxygen (burned)?
Reason: the combustion efficiency is far less than 100%
Woodsmoke is natural – how can it hurt you?
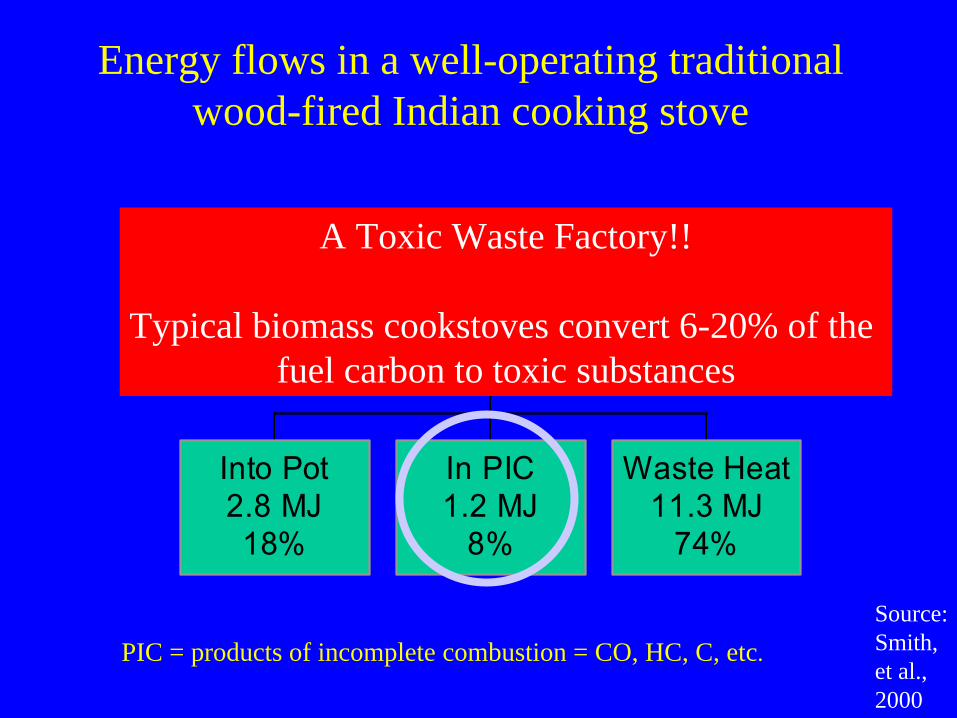
Energy flows in a well-operating traditional wood-fired Indian cooking stove
Into Pot2.8 MJ18%
In PIC1.2 MJ
8%
Waste Heat11.3 MJ
74%
Wood: 1 kg15.3 MJ
Traditional Stove
PIC = products of incomplete combustion = CO, HC, C, etc.
15% moisture
Source:Smith,et al.,2000
A Toxic Waste Factory!!
Typical biomass cookstoves convert 6-20% of the fuel carbon to toxic substances

Toxic Pollutants in Biomass Fuel Smoke from Simple (poor) Combustion
• Small particles, CO, NO2• Hydrocarbons
– 25+ saturated hydrocarbons such as n-hexane– 40+ unsaturated hydrocarbons such as 1,3 butadiene– 28+ mono-aromatics such as benzene & styrene– 20+ polycyclic aromatics such as benzo()pyrene
• Oxygenated organics– 20+ aldehydes including formaldehyde & acrolein– 25+ alcohols and acids such as methanol– 33+ phenols such as catechol & cresol– Many quinones such as hydroquinone – Semi-quinone-type and other radicals
• Chlorinated organics such as methylene chloride and dioxin
Source: Naeher et al,J Inhal Tox, 2007

Health-Damaging Air Pollutants From Typical Woodfired Cookstove in India.
10 mg/m3
Carbon Monoxide:150 mg/m3
0.1 mg/m3
Particles3.3 mg/m3
0.002 mg/m3
Benzene0.8 mg/m3
0.0003 mg/m3
1,3-Butadiene0.15 mg/m3
0.1 mg/m3
Formaldehyde0.7 mg/m3
Wood: 1.0 kgPer Hour
in 15 ACH40 m3 kitchen
Typical Health-based Standards Typical Indoor
Concentrations
IARC Group 1 CarcinogensBest single indicator

First person in human history to have her exposuremeasured doing the oldest task in human history
Kheda District,Gujarat, 1981
How muchexposure?

350-400
400-450
450-500
300-350
Unknown
150-200
200-250
250-300
100-150
24 Hrs PM2.5 Concentration (mic.g/m3)
Estimated PM2.5 for solid fuel using households in India
Preliminaryresult fromHAP CRA
Balakrishnanet al.
~400 ug/m3 average
USEPA Standard15 ug/m3
WHO Guideline10-35 ug/m3

CognitiveImpairment
ALRI/Pneumonia(meningitis)
Asthma?
Low birthweight
Chronic obstructivelung disease
Interstitial lungdiseaseCancer (lung, NP, cervical,aero-digestive)
Blindness (cataracts, opacity)
Tuberculosis
Heart disease?Blood pressureST-segment
Diseases for which we haveepidemiological studies - 2010
Birth defects?Burns, health and safetyimpacts of fuel gathering?
Stillbirth

World Health Reports – 2002, 2001
4.9 million deaths/y
Global Burden of Disease from Top 10 Risk Factorsplus selected other risk factors
0% 2% 4% 6% 8% 10%
Climate change
Urban outdoor air pollution
Lead (Pb) pollution
Physical inactivity
Road traffic accidents*
Occupational hazarads (5 kinds)
Overweight
Indoor smoke from solid fuels
Lack of Malaria control*
Cholesterol
Child cluster vaccination*
Unsafe water/sanitation
Alcohol
Tobacco
Blood pressure
Unsafe sex
Underweight
Percent of All DALYs in 2000
World HealthOrganization, 2004

Global Burden of Disease Databaseand Comparative Risk Assessment
World Health Organization
Being completely updatedFor 2011 release
For household air pollution:New exposure assessment modeling
New outcome estimates based on meta-analysesALRI, COPD, Lung Cancer
Low birth weight, cataracts, cardiovascular

RESPIRE RESPIRE –– Randomised trial (n=518)Randomised trial (n=518) Impact on pneumonia up to 18 months of ageImpact on pneumonia up to 18 months of age
Traditional open 3Traditional open 3--stone fire: stone fire: kitchen 48kitchen 48--hour PMhour PM2.52.5
levels of levels of 600 600 --
1200 1200 μμg/mg/m33
Chimney wood stove, locally made Chimney wood stove, locally made and popular with households and popular with households
Highland Guatemala
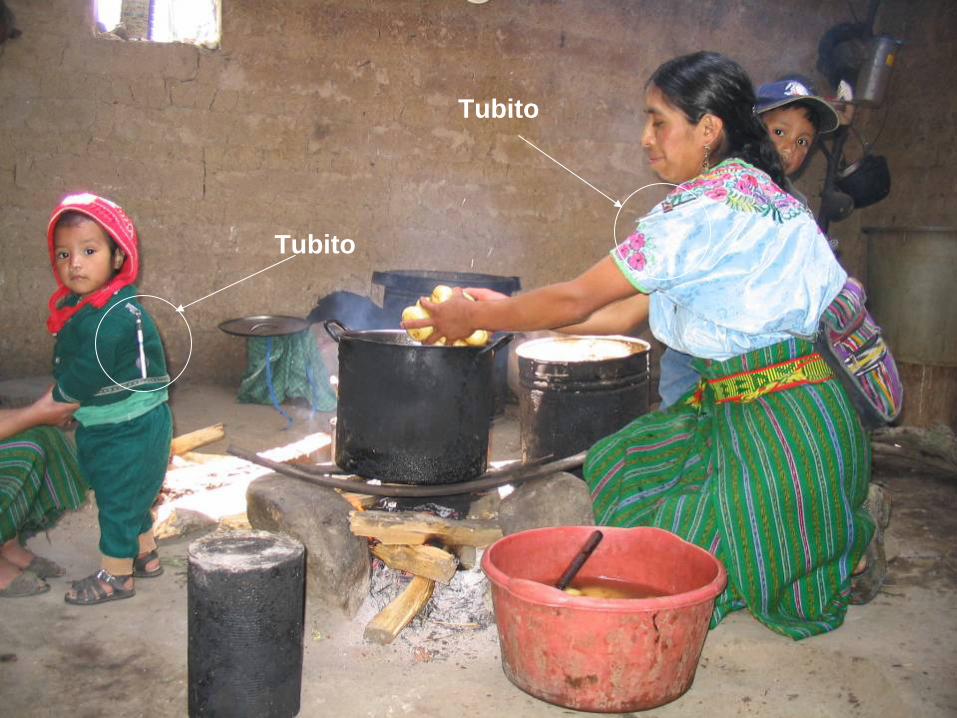
Tubito
Tubito

0 1 2 3 4 5 6 7
CO Exposure (ppm)
ALR
I Rat
e (p
er 1
00 C
hild
-Yr)
2030
4060
80
(A)
MD-diagnosed Acute Lower Respiratory Infection
RESPIRE-Guatemala
Approximate Mean PM2.5 exposure in 100s of ug/m3
Open fire
Chimney stove

1 2 3
C O (p p m )
rve n tio n g ro upn tro l g ro up
- 2 - 1 0 1 2 3
0.0
0.5
1.0
1.5
(b )
C hi ld A ve ra g e o f L o g o f C O (p p m )
- 2 - 1
0.0
0.5
1.0
1.5
P re d ic te d L o n
Average 50% reduction in exposure
BebésCon FogónAbierto
BebésconPlancha
100 120 240
(ug/m3 PM2.5 )
Chimneystove didnot protectall children

Effect of Plancha on PM2.5
1
10
100
1000
1 2
48-hug/m3
Kitchen Bedroom
~90% Reduction, sig.
~20% reduction, ns
Log Scale
Openfire
Plancha

Reasons that child personal exposures did not lower as muchas kitchen levels:
--Time-activity: the kids do not spend their entire dayin the kitchen
--Household (or “neighborhood”) pollution: a chimney does not reduce smoke, but just shifts it outside into the household environment, where the difference betweenintervention and control households was less

20-month averageground-level PM2.5from satellite data
Large areas of rural Indiaand China have high ambient air pollution –much from household fuel

NASA INTEX_B Database Percent PM2.5
emissions from households
23
30%
71%
53%
0%
NASA INTEX_B 2006 (accessed 2010)

Global warming in 2005 due to all human emissions since 1750
IPCC, 2007
CO2 is important for climate,
but so are many other
pollutants, including the ones
circled that, unlike CO2 , also
have significant health as
well as climate impacts
Several of the non-CO2 ,
greenhouse gases create
a good proportion of both
their climate forcing and
health damage through
the secondary pollutant,
tropospheric ozone
Household Fuels and Climate
Climate impacts come from non-renewable biomass and coal, i.e., from net CO2 emissions
Poor combustion also leads to other emissions such as the relatively well-understood GHGs – methane and nitrous oxide – which are “Kyoto” GHGs
In addition, a wide range of less well-understood short- lived GH-related emissions are emitted including
CO and black carbon – warming agents
Ozone precursors – warming But also cooling agents such as sulfates and organic carbon particles
There are also indirect climate impacts of these pollutants including
Reducing carbon capture of forests by ozone damage
Darkening of snow/ice by black carbon

Controllable Global Warming from Black Carbon EmissionsNet of OC, Forcings from IPCC, 2007: 0.25 W/m2
Inventory from T Bond Database, V 7.1.1 Feb 2009
Transport24%
Industry27%
Households36%
Ag Waste4%
Forest and Grassland
6%Power
1%Ships and Aircraft
2%
~One-third of net black carbon acarbon monoxide emissions globcome from household fuels
~One-sixth of ozone causing pol
~One-twentieth of methane

Climate Warming in 2020 Under Present Trends
Unger et al. 2010
Household Biomass

Perfect Storm for Health Impacts
Highly polluting activity
Half of world households
Several times a day
Just when people are present
Most vulnerable (women and young children) most likely to be there

IF = 1.0
In other words, the Intake Fractionis extremely large
IF is the fraction of material emittedthat is actually breathed in by someone

IF = 1.0

Heart Disease and Combustion Particle Doses
Solid FuelZone
From “Mind the Gap,”Smith/Peel, 2010 and Popeet al., 2009

Heart Disease and Combustion Particle Doses
0
5
10
15
20
25
30
35
0 200 400 600 800 1000
Annual mean PM2.5 - ug/m3
Hear
t Dis
ease
Impa
ct
Solid FuelZone
From “Mind the Gap,”Smith/Peel, 2010 and Popeet al., 2009

0 1 2 3 4 5 6 7
CO Exposure (ppm)
ALR
I Rat
e (p
er 1
00 C
hild
-Yr)
2030
4060
80
(A)
MD-diagnosed Acute Lower Respiratory Infection
RESPIRE-Guatemala
Approximate Mean PM2.5 exposure in 100s of ug/m3
Where weWant toBe!
Open fire
Chimney stove

China’s National Improved Stove Program (NISP) 1981-1998
0
50
100
150
200
250
300
1975 1980 1985 1990 1995 2000 2005
Year
Freq
uenc
y (M
ILLI
ON
)
Lu Y., 1993
Smith et al.,1993
Qiu et al.,1996
MOE/DOE 1998
CERS and CAREI 2000
China Statistical Yearbook, 2001
Total RuralHouseholds Total Improved
Stoves

Improved Stove in Shanxi

*Includes coal use: J: 17%; WB: 13%;C: 2%; O: 2%
India in 2005
Venkataramanet al. 2010
71% householdsuse solid fuelfor cooking

Only blower stoves are sufficiently cleanto mimic performance of gas – where we need to be for health

Only blower stoves are sufficiently cleanto mimic performance of gas – where we need to be for health

Geographic
Commercial
Areas of convenienceAreas chosen politicallyAreas with deforestationAreas close to glaciersSupport R&D
MicrofinanceMarketingProtect IPRSubsidy to producerSubsidy to consumer
Vulnerability
Modes of Dissemination
RefugeesDisaster victimsOther?

Alternative Approaches Do Not Target the Vulnerable
Geographic approach targets entire communities, not the vulnerable households
And does so based on criteria not well correlated with vulnerability
Commercial approach, even with subsidies, is almost inversely correlated with vulnerability
Starts with the rich, not the poor.
In additionto starting atthe top of theincomepyramid,therefore
Need to find waysto start at the bottom!

0
20
40
60
80
100
120
1 2 3 4 5
Income Quintal
Perc
ent S
olid
Fue
l Use
Solid Fuel
LPG + Kero
NFHS, 2006
Distribution of Household Cooking Fuel by Income in India
160 million households
Lowest Highest

Vulnerable populationsin India now being reached
by national programs
Rural HousingProgram
Women’sLiteracyProgram
Rajiv GandhiScheme –rural electrification
Antenatal CareSystem

ASHAWorkerContemplatingAdvancedBlowerStove

Environment
Toxic Tsunami threatening US healthBy OUR CORRESPONDENTEvidence indicates that a wave of toxic material will soon be affecting US populations. As many as half of all households to be exposed to hazards from new technology far exceeding safety standards. Thousands likely to die.

It will wash across the countryside exposing half the United States population
to a toxic soup containing
• Dozens of poisonous organic chemicals known to be mutagens, immune system suppressants, severe irritants, blood poisons, inflammation agents, central nervous system depressants, cilia toxins, endocrine disrupters, or neurotoxins.
• Several other chemicals firmly established as human carcinogens.
• Other toxic inorganic chemicals known to cause asphyxiation, stillbirth, infant death, heart disease, and severe acute and chronic lung disease.

The Toxic Tsunami• It will be the result of a process that pours this
toxic soup directly into half of all US homes every day; all year; every year.
• It will expose families to toxic levels much higher those of people living on top of toxic waste dumps, working in most heavy industries, or residing in the dirtiest cities
• These toxic levels will be tens or hundreds of times the levels set by international and national organizations to protect health
• Insidiously, it will target women and young children in these households

Why would it happen?• Because a technology will be widely promoted
that takes perfectly safe natural material and converts 10% of it to toxins in the course of functioning. Sometimes as much as 20%
• The efficiency of the process is extremely low, leading to little human benefit per unit toxin created as well as waste of the natural resource.
• Instead of carefully disposing of this toxic material in safe places, this industry will spread the toxic soup by air right into neighborhoods where people live.
• All this, in spite of there being well-known alternative technologies available producing very little toxin.

What might be the health consequences if this happens?
• A vast epidemic of a respiratory illness that kills faster than SARS or Avian Flu – initiation to death in 2 days in some cases.
• So fast, that trying to apply medical care is often hopeless.
• Estimates are that soon it would be killing at least 1000 children a week, 50,000 a year
• In addition, thousands of children will be severely burned each year because of this technology, many will die

What else?
• Thousands of women would have their breath taken from them as their lung function is slowly eaten away by exposure to the toxins
• Thus, at tragically young ages they will become unable to breathe normally or do common tasks.
• Alarmingly, once a woman is affected, there is no known medical therapy to reverse the process.
• More than 500 per week, 25 thousand per year, would soon start to die prematurely because their lungs would finally give out.

Anything else?• Although some effects are known, so little study has been
done of this threat that we are unsure of even all the types of health impacts there would be, let alone their scale
• There are strong indications, however, that the burden on households would include many other insidious diseases, such as– Significant exacerbation of heart disease, the most important cause
of death in the country– A major negative impact on babies’ health and survival through
reductions in growth before birth – Increases in several types of cancer, including lung and throat– Damage to the eyesight of tens of thousands– A significant increase in tuberculosis, one of the most important
and intransigent of the re-emerging infectious diseases• Based on animal experiments, we can also expect
– Reduction in child cognitive capacity (learning ability or IQ)– Several types of birth defects

What should the response be?
• Full time coverage on CNN and all other news outlets as the disaster unfolds?
• A major effort coordinated by the National Guard to protect the country?
• Emergency legislation in Congress to provide funds for cleaner technologies?
• New laws and regulations to make sure it never happens again?
In fact, nothing will happen – no one will notice

Environment
Toxic Tsunami threatening US healthBy OUR CORRESPONDENTEvidence indicates that a wave of toxic material will soon be affecting US populations. As many as half of all households to be exposed to hazards from new technology far exceeding safety standards. Thousands likely to die.

Household pollution from burning simple solid fuels like wood
Everything stated about the Toxic Tsunami istrue, as best we know, except for three aspects:
1. It is already happening2. In half the world’s households, but not US households
3. No industry is responsible – but poverty and complacencyA sin of omission, not commission
But still killing 1.5 million women and children

Wood is the fuel that
• Heats you twice as Thoreau said?– Once when you chop it and– Once when you burn it
• Or four times?– The fever from respiratory infection and– Global warming
• Better combustion will get rid of the second pair
Publications and presentations available at my website:
Just Google “Kirk R. Smith”
Thank You