Embed Size (px)
Citation preview

8/8/2019 187588_633777800398832500ata minig presentation
http://slidepdf.com/reader/full/187588633777800398832500ata-minig-presentation 1/20
Data Preprocessing
prepared By
Avisek Dey09Bs0000498
January 16, 2011 1

8/8/2019 187588_633777800398832500ata minig presentation
http://slidepdf.com/reader/full/187588633777800398832500ata-minig-presentation 2/20
January 16, 2011 2
Chapter 3: Data Preprocessing
Preprocess Steps
Data cleaning
Data integration and transformation
Data reduction
8/8/2019 187588_633777800398832500ata minig presentation
http://slidepdf.com/reader/full/187588633777800398832500ata-minig-presentation 3/20
January 16, 2011 3
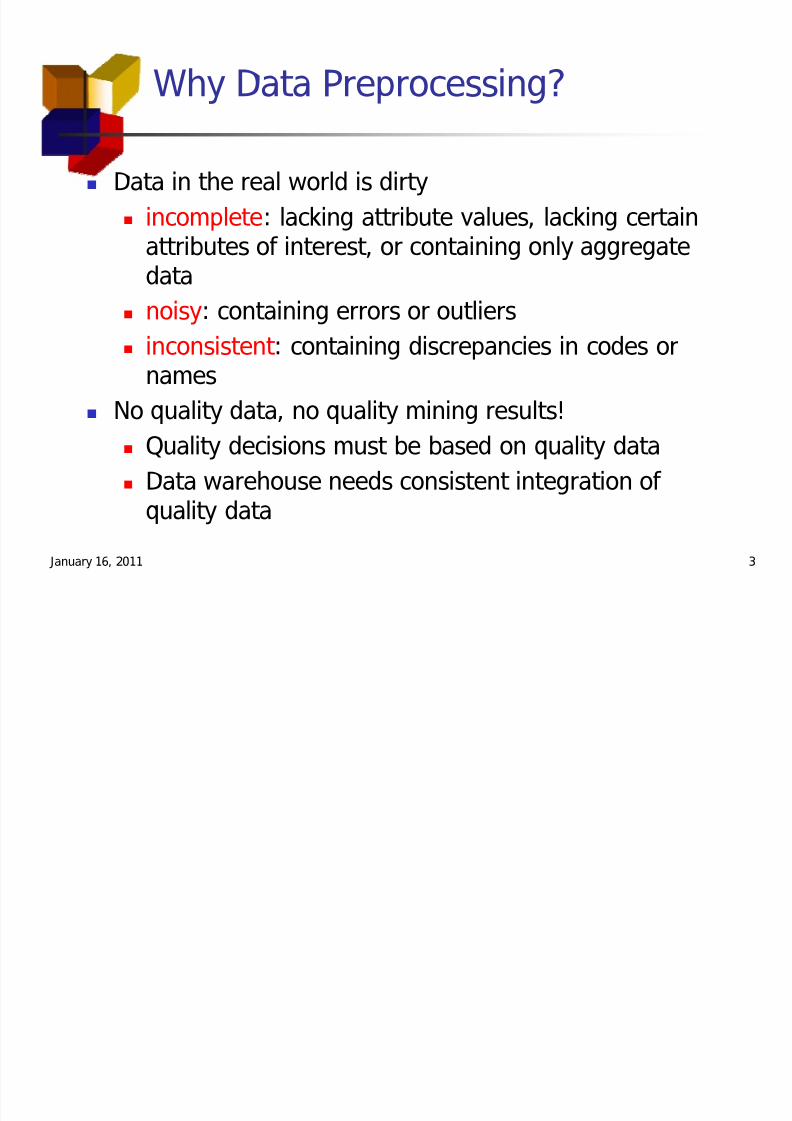
Why Data Preprocessing?
Data in the real world is dirty
incomplete: lacking attribute values, lacking certainattributes of interest, or containing only aggregate
data noisy: containing errors or outliers
inconsistent : containing discrepancies in codes ornames
No quality data, no quality mining results! Quality decisions must be based on quality data
Data warehouse needs consistent integration of quality data

8/8/2019 187588_633777800398832500ata minig presentation
http://slidepdf.com/reader/full/187588633777800398832500ata-minig-presentation 4/20
January 16, 2011 4
Multi-Dimensional Measure of Data Quality
A well-accepted multidimensional view:
Accuracy
Completeness Consistency
Timeliness
Believability
Value added
Interpretability
Accessibility

8/8/2019 187588_633777800398832500ata minig presentation
http://slidepdf.com/reader/full/187588633777800398832500ata-minig-presentation 5/20
January 16, 2011 5
Major Tasks in Data Preprocessing
Data cleaning Fill in missing values, smooth noisy data, identify or remove
outliers, and resolve inconsistencies
Data integration Integration of multiple databases, data cubes, or files
Data transformation Normalization and aggregation
Data reduction Obtains reduced representation in volume but produces the
same or similar analytical results

8/8/2019 187588_633777800398832500ata minig presentation
http://slidepdf.com/reader/full/187588633777800398832500ata-minig-presentation 6/20
January 16, 2011 6
Forms of data preprocessing

8/8/2019 187588_633777800398832500ata minig presentation
http://slidepdf.com/reader/full/187588633777800398832500ata-minig-presentation 7/20
January 16, 2011 7
Data Cleaning
Data cleaning tasks
Fill in missing values
Identify outliers and smooth out noisy data
Correct inconsistent data

8/8/2019 187588_633777800398832500ata minig presentation
http://slidepdf.com/reader/full/187588633777800398832500ata-minig-presentation 8/20
January 16, 2011 8
How to Handle Missing Data?
Ignore the tuple: usually done when class label is missing (assuming
the tasks in classificationnot effective when the percentage of
missing values per attribute varies considerably.
Fill in the missing value manually: tedious + infeasible?
Use a global constant to fill in the missing value: e.g., unknown, a
new class?!
Use the attribute mean to fill in the missing value
Use the attribute mean for all samples belonging to the same class
to fill in the missing value: smarter
Use the most probable value to fill in the missing value: inference-
based such as Bayesian formula or decision tree

8/8/2019 187588_633777800398832500ata minig presentation
http://slidepdf.com/reader/full/187588633777800398832500ata-minig-presentation 9/20
January 16, 2011 9
Noisy Data
Noise: random error or variance in a measured variable
Incorrect attribute values may due to
faulty data collection instruments
data entry problems
data transmission problems
technology limitation
inconsistency in naming convention
Other data problems which requires data cleaning
duplicate records
incomplete data
inconsistent data

8/8/2019 187588_633777800398832500ata minig presentation
http://slidepdf.com/reader/full/187588633777800398832500ata-minig-presentation 10/20
January 16, 2011 10
Cluster Analysis
Clustering: detect and remove outliers
8/8/2019 187588_633777800398832500ata minig presentation
http://slidepdf.com/reader/full/187588633777800398832500ata-minig-presentation 11/20
January 16, 2011 11
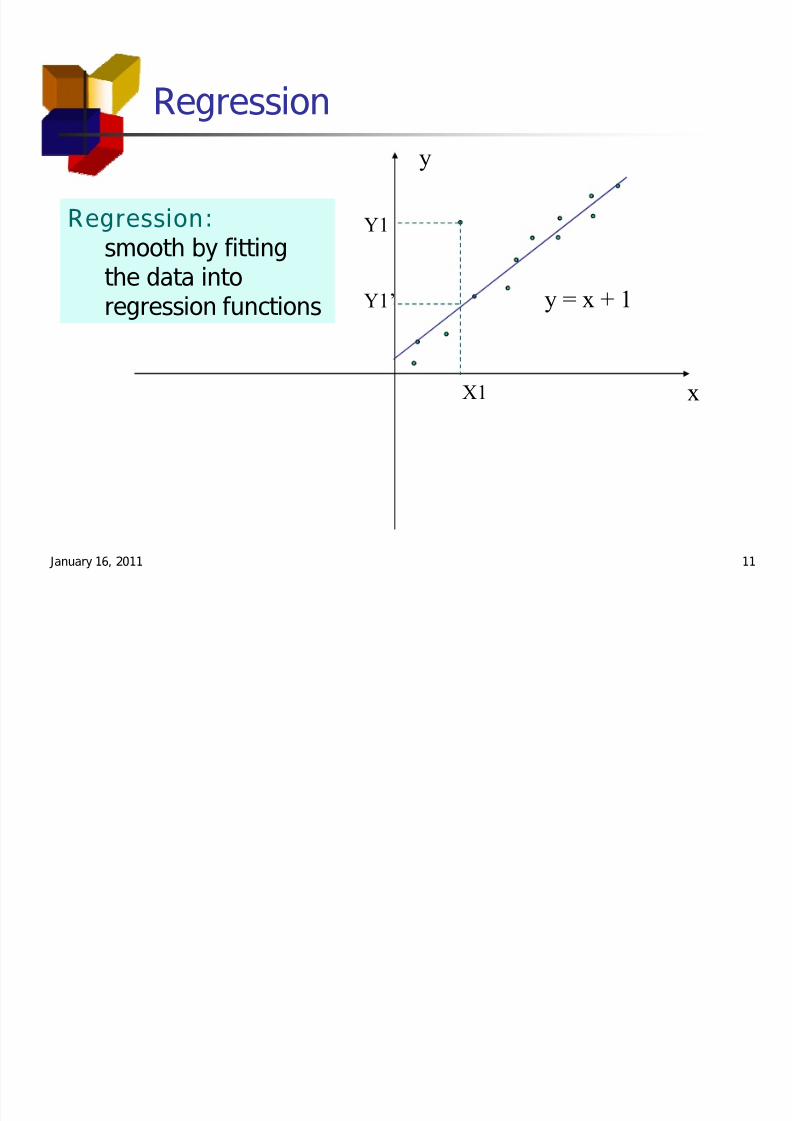
Regression
x
y
y = x + 1
X1
Y1
Y1
Regression:smooth by fitting
the data intoregression functions

8/8/2019 187588_633777800398832500ata minig presentation
http://slidepdf.com/reader/full/187588633777800398832500ata-minig-presentation 12/20
January 16, 2011 12
Data Integration
Data integration:
combines data from multiple sources.
Schema integration
integrate metadata from different sources Entity identification problem: identify real world entities
from multiple data sources, e.g., A.cust-id | B.cust-#
Detecting and resolving data value conflicts
for the same real world entity, attribute values fromdifferent sources are different
possible reasons: different representations, different scales, e.g., metric vs. British units

8/8/2019 187588_633777800398832500ata minig presentation
http://slidepdf.com/reader/full/187588633777800398832500ata-minig-presentation 13/20
January 16, 2011 13
Handling Redundant Data in Data Integration
Redundant data occur often when integration of multiple
databases
The same attribute may have different names in
different databases One attribute may be a derived attribute in another
table.
Redundant data may be able to be detected by
correlational analysis
Careful integration of the data from multiple sources may
help reduce/avoid redundancies and inconsistencies and
improve mining speed and quality
8/8/2019 187588_633777800398832500ata minig presentation
http://slidepdf.com/reader/full/187588633777800398832500ata-minig-presentation 14/20
January 16, 2011 14
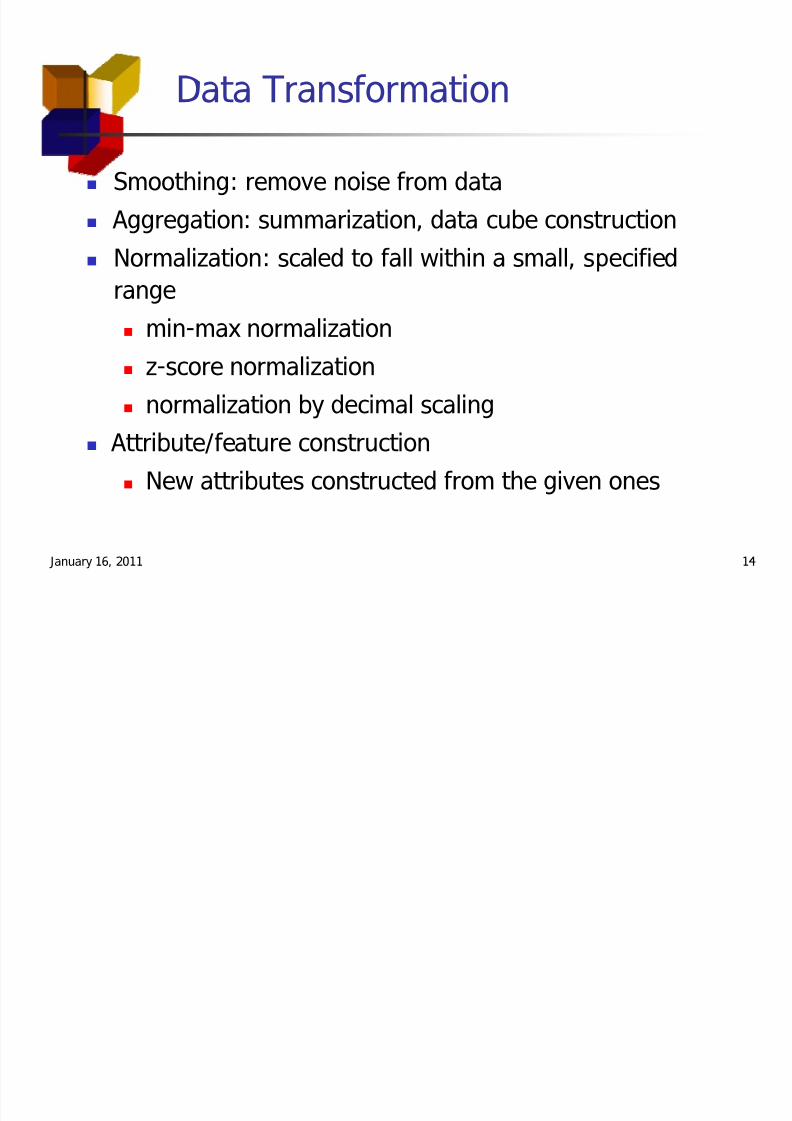
Data Transformation
Smoothing: remove noise from data
Aggregation: summarization, data cube construction
Normalization: scaled to fall within a small, specifiedrange
min-max normalization
z-score normalization
normalization by decimal scaling Attribute/feature construction
New attributes constructed from the given ones

8/8/2019 187588_633777800398832500ata minig presentation
http://slidepdf.com/reader/full/187588633777800398832500ata-minig-presentation 15/20
January 16, 2011 15
Data Transformation: Normalization
min-max normalization
Min-max normalization performs a lineartransformation on the original data.
Suppose that mina and maxa are the minimum andthe maximum values for attribute A. Min-maxnormalization maps a value v of A to v in the range
[new-mina, new-maxa] by computing: v= ( (v-mina) / (maxa mina) ) * (new-maxa
newmina)+ new-mina

8/8/2019 187588_633777800398832500ata minig presentation
http://slidepdf.com/reader/full/187588633777800398832500ata-minig-presentation 16/20
January 16, 2011 16
Data Transformation: Normalization
Z-score Normalization: In z-score normalization, attribute A are normalized
based on the mean and standard deviation of A. a
value v of A is normalized to v by computing: v = ( ( v ) / A )
where and A are the mean and the standarddeviation respectively of attribute A.
This method of normalization is useful when theactual minimum and maximum of attribute A areunknown.

8/8/2019 187588_633777800398832500ata minig presentation
http://slidepdf.com/reader/full/187588633777800398832500ata-minig-presentation 17/20
January 16, 2011 17
Data Transformation: Normalization
Normalization by Decimal Scaling
Normalization by decimal scaling normalizes bymoving the decimal point of values of attribute A.
The number of decimal points moved depends onthe maximum absolute value of A.
a value v of A is normalized to v by computing: v =( v / 10j ). Where j is the smallest integer such that Max(|v|)<1.

8/8/2019 187588_633777800398832500ata minig presentation
http://slidepdf.com/reader/full/187588633777800398832500ata-minig-presentation 18/20
January 16, 2011 18
Data Reduction Strategies
Warehouse may store terabytes of data: Complex dataanalysis/mining may take a very long time to run on thecomplete data set
Data reduction Obtains a reduced representation of the data set that is
much smaller in volume but yet produces the same (oralmost the same) analytical results
Data reduction strategies
Data cube aggregation
Dimensionality reduction
concept hierarchy generation

8/8/2019 187588_633777800398832500ata minig presentation
http://slidepdf.com/reader/full/187588633777800398832500ata-minig-presentation 19/20
January 16, 2011 19
Data Compression
String compression
Typically lossless
Audio/video compression
Typically lossy compression, with progressiverefinement
Sometimes small fragments of signal can bereconstructed without reconstructing the whole

8/8/2019 187588_633777800398832500ata minig presentation
http://slidepdf.com/reader/full/187588633777800398832500ata-minig-presentation 20/20
Thank You
January 16, 2011 20


![INDEX [kgr.ac.in]kgr.ac.in/beta/wp-content/uploads/2018/09/DWDM_lab_manual_Final.pdf · DATAWARE HOUSING AND DATA MINIG LAB 1 COMPUTER SCIENCE & ENGINEERING INDEX S.NO EXPIREMENT](https://img.dokumen.tips/doc/110x75/5e169e90f0c32c7abc4e0d1a/index-kgracinkgracinbetawp-contentuploads201809dwdmlabmanualfinalpdf.jpg)