Embed Size (px)
Citation preview

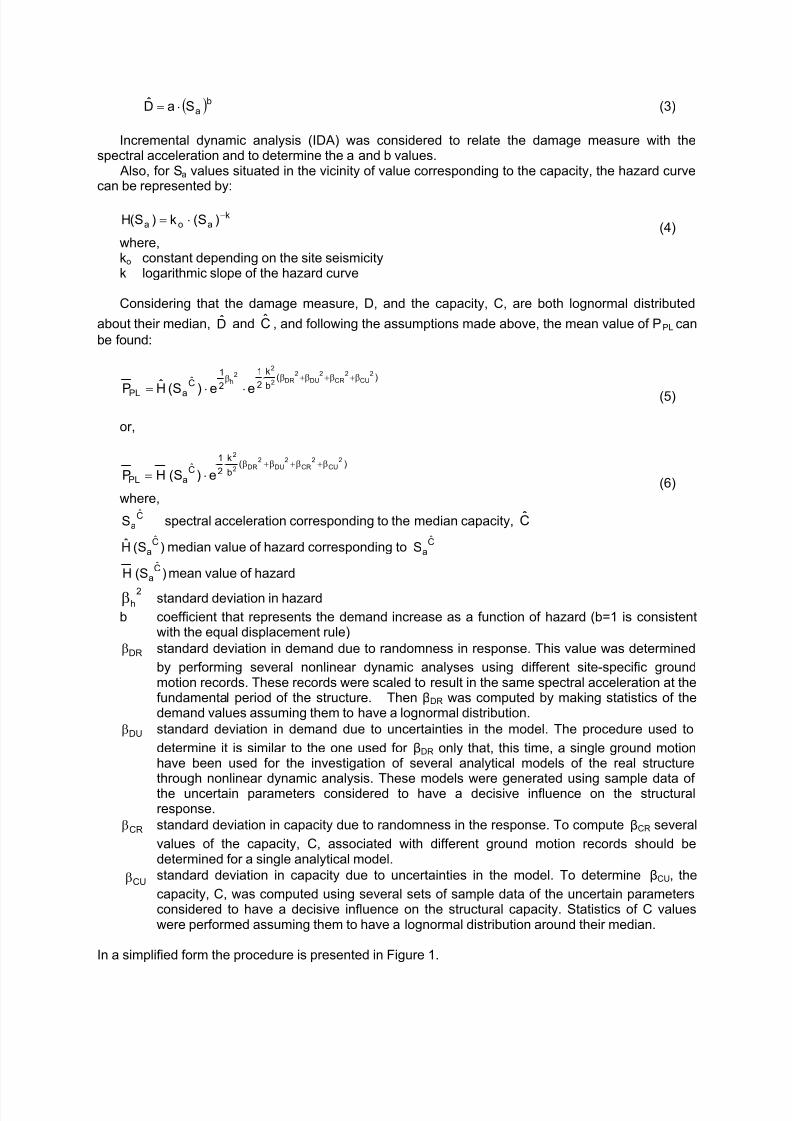
8/2/2019 183 Fib 2003 Full
http://slidepdf.com/reader/full/183-fib-2003-full 1/8
PROBABILISTIC PROCEDURE FOR THE SEISMIC EVALUATION OFSOME INDUSTRIAL RC STRUCTURES
Viorel POPA1
Tudor POSTELNICU1
1
Technical University of Civil Engineering, Bucharest, Department of Structural Engineering
Keywords: seismic, probabilistic, hazard, dynamic, nonlinear, damage, performance
1 INTRODUCTION
The rehabilitation of existing seismic vulnerable buildings represents one of the most difficult tasksthat the design professionals have to face in seismic areas. The number of existing buildings is by far much larger than the number of the new ones and the knowledge progress in the earthquake-engineering, imposes that an increasing number of buildings to be considered vulnerable.In these circumstances the development of new methods for the structural performance assessmentof existing buildings becomes very important.
The paper presents the application of a full probabilistic procedure, developed by Cornell & al.
(2001) for determining the structural performance of a widely spread category of buildings in Romania,namely the industrial single level precast halls.
The procedure which is a performance based assessment method takes into account thevariability of the main parameters that characterize the ground motion and structural behavior.
2 THEORETICAL FUNDAMENTALS
Likewise in other assessment methods the performance checking consists in the comparisonbetween a parameter that characterize the structural capacity and the corresponding parameter thatdefines the seismic demand.
The procedure operates with three main random elements.First of them is the intensity measure (IM) of the ground motions. The spectral acceleration at the
fundamental vibration period of the structure (determined for 5% damping), Sa, was chosen todescribe the ground motion intensity. The Sa values can be associated with different hazard levelsusing site specific hazard functions, that provide the mean annual probability that a random value Sa equals or exceeds a certain level sa.
The second element is the damage measure (D). Usually the lateral drift can be used to describethe structural and nonstructural damage level. Given that the analyzed structure is a single level onethe top displacement was chosen as damage measure.
The third element is the structural capacity (C). To be able to directly compare the capacity withthe demand the capacity was expressed in the same form as the damage measure.
As mentioned above Sa can be related to the hazard level using hazard functions. Thesefunctions, usually available for different sites, are developed by seismologists.
To establish a relation between the intensity measure, Sa, and the damage measure, D, is the dutyof the structural engineer. This structure specific damage hazard function provides the annual
probability that the damage measure, D, will exceed a certain level, d:
[ ]∫ ⋅=≥= )x(dHxSdDP)d(H aD (1)
If the damage hazard function is combined with the capacity, C, one can determine the annualprobability of the performance level not being met, PPL:
∫ ⋅≥= )d(dHD]dC[PPPL (2)
The above relations are not convenient for common engineering practice. To simplify them, onecan assume that, in the vicinity of the value that makes the capacity to be reached, the median
demand D can be approximated by a power function:
8/2/2019 183 Fib 2003 Full
http://slidepdf.com/reader/full/183-fib-2003-full 2/8
( )baSaD ⋅= (3)
Incremental dynamic analysis (IDA) was considered to relate the damage measure with thespectral acceleration and to determine the a and b values.
Also, for Sa values situated in the vicinity of value corresponding to the capacity, the hazard curvecan be represented by:
kaoa )S(k)S(H −⋅=
(4)where,ko constant depending on the site seismicityk logarithmic slope of the hazard curve
Considering that the damage measure, D, and the capacity, C, are both lognormal distributed
about their median, D and C , and following the assumptions made above, the mean value of PPL can
be found:
)(b
k
2
1
2
1C
aPL
2CU
2CR
2DU
2DR2
22
h
ee)S(Hˆ
P
β+β+β+β⋅β
⋅⋅= (5)
or,
)(b
k
2
1
CaPL
2CU
2CR
2DU
2DR2
2
e)S(HPβ+β+β+β⋅
⋅=(6)
where,
CaS spectral acceleration corresponding to the median capacity, C
)S(HC
a median value of hazard corresponding toC
aS
)S(HC
a mean value of hazard
2hβ
standard deviation in hazard
b coefficient that represents the demand increase as a function of hazard (b=1 is consistentwith the equal displacement rule)
DRβ standard deviation in demand due to randomness in response. This value was determined
by performing several nonlinear dynamic analyses using different site-specific groundmotion records. These records were scaled to result in the same spectral acceleration at thefundamental period of the structure. Then βDR was computed by making statistics of thedemand values assuming them to have a lognormal distribution.
DUβ standard deviation in demand due to uncertainties in the model. The procedure used to
determine it is similar to the one used for βDR only that, this time, a single ground motionhave been used for the investigation of several analytical models of the real structurethrough nonlinear dynamic analysis. These models were generated using sample data of the uncertain parameters considered to have a decisive influence on the structuralresponse.
CRβ standard deviation in capacity due to randomness in the response. To compute βCR several
values of the capacity, C, associated with different ground motion records should bedetermined for a single analytical model.
CUβ standard deviation in capacity due to uncertainties in the model. To determine βCU, the
capacity, C, was computed using several sets of sample data of the uncertain parametersconsidered to have a decisive influence on the structural capacity. Statistics of C valueswere performed assuming them to have a lognormal distribution around their median.
In a simplified form the procedure is presented in Figure 1.

8/2/2019 183 Fib 2003 Full
http://slidepdf.com/reader/full/183-fib-2003-full 3/8
Sa
H(Sa )(mean annual frequency)
D
b
a )S(aD ⋅=
k
aoa )S(k)S(H −⋅=
Fig. 1.
If the PPL is set to be equal to the performance objective, Po, the relation above yields to a moreconvenient load resistance design factor (LRDF) checking format as follows:
oPa
2DU
2DR2
22
CU2
CR2
2
S)(
b
k
2
1)(
b
k
2
1
DeCe ⋅≥⋅β+β⋅β+β⋅−
(7)
or,
oPaSDC ⋅λ≥⋅Φ . (8)
In a graphical form the procedure in presented in Figure 2.
Sa
H(Sa )(mean annual frequency)
D
b
a )S(aDˆ
⋅=
k
aoa )S(k)S(H −⋅=
Fig. 2.
3 DESCRIPTION OF ANALYZED STRUCTURES
Several single level industrial halls have been analyzed.They were made up of precast RC elements. The structural system consists of prefabricated beam
hinged on prefabricated columns.The halls had been realized upon typified projects carried out between 1970 and 1980, according
to the provisions of the Romanian seismic design code P13/70.Two structures have been selected as examples. They represent the limits of the common domain:
- structures with 24.00 x12.00 m spans and the height 5,40 m- structures with 12.00 x 6.00 m spans and the height 4,80 m
Only the checking for the transversal frame (along the maximum span) is reported.The buildings were erected in Bucharest. The city was recognized at the design time as being
placed in a seismic area. The design base shear force used to design the structural members was 8%of the build weight.
The halls schemes, together with the characteristics column sections and their vertical loads aredisplayed in Figure 3 and Figure 4.

8/2/2019 183 Fib 2003 Full
http://slidepdf.com/reader/full/183-fib-2003-full 4/8
Fig. 3. Transversal frame
Fig. 4. Columns dimensions and reinforcement details:a) 12.00 m span b) 24.00 m span
4. PERFORMANCE PREDICTION USING THE PROBABILISTIC PROCEDURE
To be able to apply the dynamic nonlinear analysis an analytical model of the structure had to becreated. Considering that most of the building weight is located at top, the structure has been modeledas a single degree of freedom system. The behavior of the rectangular RC columns has beenapproximated through a bilinear free – displacement relationship. The initial stiffness has beencomputed considering the cracked RC elements properties.
The time-history analysis was conducted using Drain 2DX. A preliminary analysis offered the dynamic characteristics of the structures. The fundamental
vibration periods resulted 0.97s for the 12m span hall and 1.27s for the hall 24m span hall.The checking procedure has been applied for three levels of the ground motion intensity. Ground
motions associated with mean recurrence intervals of 20, 50 and 475 years have been considered.The performance objectives defined by these hazard levels combined with the collapse preventionperformance level are defined by FEMA 273 as limited objectives. The aim of this work was to checkthe structures capacity to meet the requirements of these limited performance objectives. In other words, the structure ability to avoid collapse has been checked for three hazard levels.
Both the capacity and the demand had to be computed for each intensity level.The problem solution involves the calculation of all the factors involved in Eq. 7. The following
steps have been completed:(i) The relationship between the intensity measure, Sa, and damage measure, the top
displacement, D, have been determined using IDA. 11 ground motions, all recorded inBucharest, have been considered. Each record was scaled to 50 different levels of
intensity to produce Sa values ranging from 0,2 m/s2
to 10 m/s2
. The 11 curves obtainedfor each hall are represented in Figure 5.
Precastcolumn
Precast hingedbeam
Precast roof shells
12.00 (24.00) 12.00 (24.00)
450
5 0 0
4ø22+8ø18
Central column
400
4 5 0
4ø28+8ø20
Perimetral column
12ø28+4ø22
Perimetral column
600
6 0 0
4ø28+12ø20
Central column
650
7 0 0
N = 899 kNN = 1256 kNN = 203 kNN = 337 kN
a) b)

8/2/2019 183 Fib 2003 Full
http://slidepdf.com/reader/full/183-fib-2003-full 5/8
0
1
2
3
4
5
6
7
8
9
10
0.000 0.250 0.500
Top Displacement (m)
S p e c t r a l a c c e l e r a t i o n ( m / s
2 )
0
1
2
3
4
5
6
7
8
9
10
0.000 0.250 0.500
Top Displacement (m)
S p e c t r a l a c c e l e r a t i o n
( m / s 2 )
a) b)
Fig. 5. IDA curves.a) 12.00 m span b) 24.00 m span
0
1
2
3
4
5
6
7
8
9
10
0.0000 0.2500 0.5000
Top Displacem ent (m )
S p e c t r a l a c c e l e r a t i o n ( m / s
2 )
Mean 50% STDEV
0
1
2
3
4
5
6
7
8
9
10
0.000 0.250 0.500
Top Displacement (m)
S p e c t r a l a c c e l e r a t i o n ( m / s
2 )
Mean 50% STDEV
a) b)Fig. 6. Statistics of IDA curves.
a) 12.00 m span b) 24.00 m span
0
1
2
3
4
5
6
7
8
9
10
0.000 0.250 0.500
Top Displacem ent (m )
S p e c t r a l a c c e l e r a t i o n ( m / s
2 )
0
1
2
3
4
5
6
7
8
9
10
0.000 0.250 0.500
Top Displacem ent (m )
S p e c t r a l a c c e l e r a t i o n ( m / s
2 )
023.1aS022.0D =
012.1aS023.0D =
110.2aS0035.0D =
909.0aS0304.0D =
647.1aS0091.0D =
773.1aS0091.0D =
a) b)Fig. 7. Power functions fitted on the median IDA curve
a) 12.00 m span b) 24.00 m span
8/2/2019 183 Fib 2003 Full
http://slidepdf.com/reader/full/183-fib-2003-full 6/8
(ii) Statistics of these curves have been performed, considering a lognormal distribution of theresponse values. The mean and the median curve together with the standard deviation in
demand due to the randomness in response, βDR, are presented in Figure 6.
(iii) The power function which serves for the approximation of the median demand, D )
, givenin Eq. 3, was determined for each level of interest of the ground motion intensity. The
results are presented in Figure 7.(iv) To compute βDU and βCU, the concrete compressive strength and the yield strength of the
longitudinal reinforcement have been selected as the uncertain parameters having adecisive influence on the structural response. Their cumulative distribution functions were
used to generate 30 sample sets. To compute βDU, for each set the analytical modelcharacteristics such as the yielding moment, the initial stiffness and the strain hardeningratio have been computed. This resulted in 30 analytical models for each analyzedstructure. For each model, the nonlinear dynamic analysis provided the peak values of thetop displacement. Then, assuming a lognormal distribution of these values, the standard
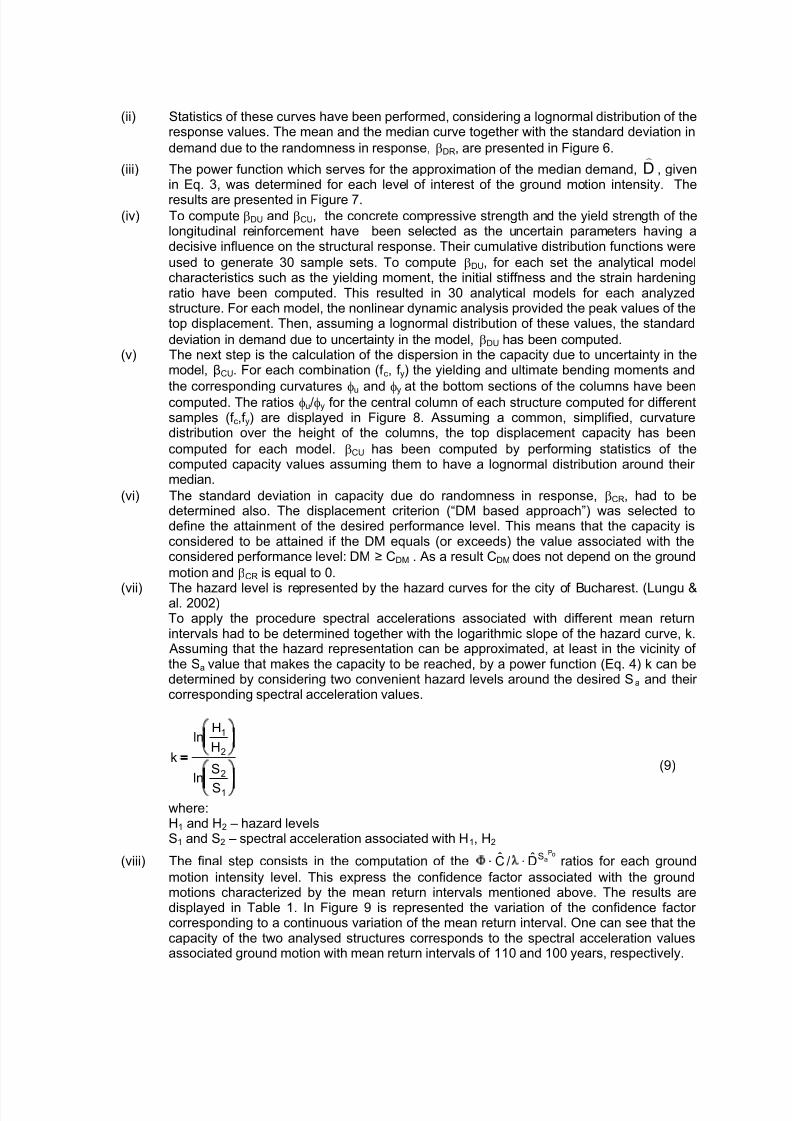
deviation in demand due to uncertainty in the model, βDU has been computed.(v) The next step is the calculation of the dispersion in the capacity due to uncertainty in the
model, βCU. For each combination (f c, f y) the yielding and ultimate bending moments and
the corresponding curvatures φu and φy at the bottom sections of the columns have beencomputed. The ratios φu/φy for the central column of each structure computed for differentsamples (f c,f y) are displayed in Figure 8. Assuming a common, simplified, curvaturedistribution over the height of the columns, the top displacement capacity has been
computed for each model. βCU has been computed by performing statistics of thecomputed capacity values assuming them to have a lognormal distribution around their median.
(vi) The standard deviation in capacity due do randomness in response, βCR, had to bedetermined also. The displacement criterion (“DM based approach”) was selected todefine the attainment of the desired performance level. This means that the capacity isconsidered to be attained if the DM equals (or exceeds) the value associated with theconsidered performance level: DM ≥ CDM . As a result CDM does not depend on the ground
motion and βCR is equal to 0.
(vii) The hazard level is represented by the hazard curves for the city of Bucharest. (Lungu &al. 2002)To apply the procedure spectral accelerations associated with different mean returnintervals had to be determined together with the logarithmic slope of the hazard curve, k. Assuming that the hazard representation can be approximated, at least in the vicinity of the Sa value that makes the capacity to be reached, by a power function (Eq. 4) k can bedetermined by considering two convenient hazard levels around the desired Sa and their corresponding spectral acceleration values.
=
1
2
2
1
S
Sln
H
Hln
k(9)
where:H1 and H2 – hazard levelsS1 and S2 – spectral acceleration associated with H1, H2
(viii) The final step consists in the computation of theoP
aSD/C ⋅ ratios for each ground
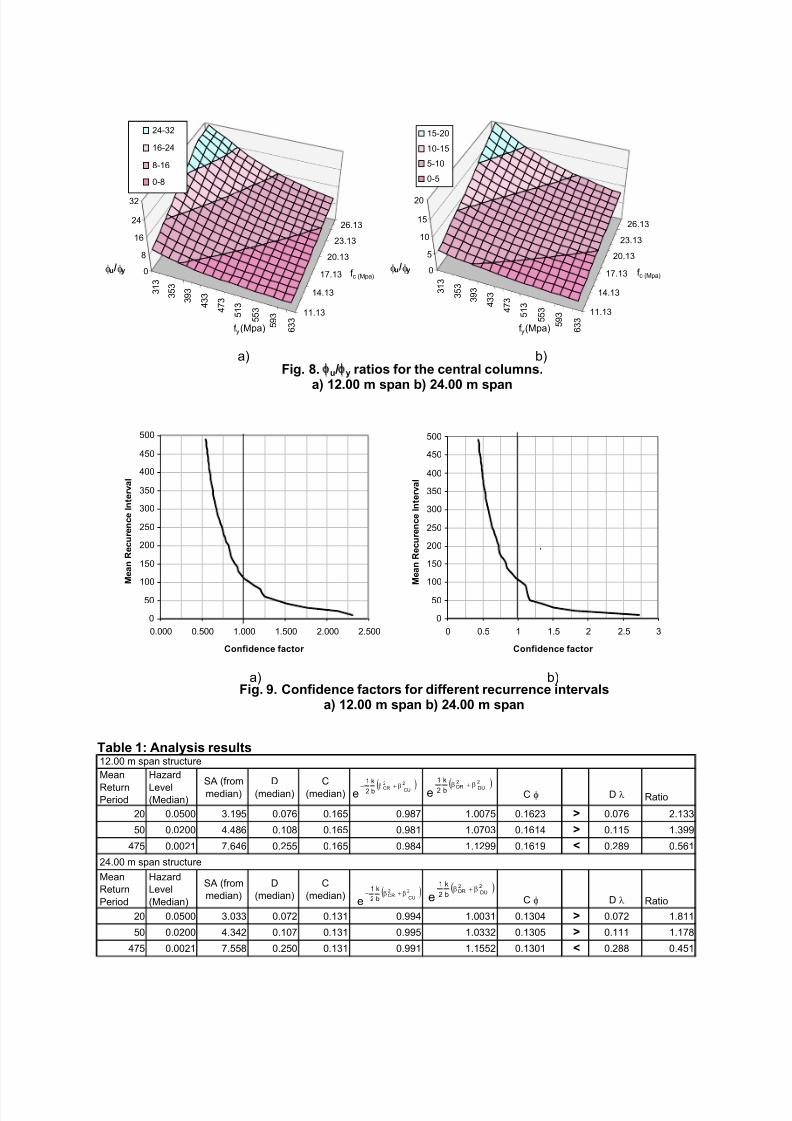
motion intensity level. This express the confidence factor associated with the groundmotions characterized by the mean return intervals mentioned above. The results aredisplayed in Table 1. In Figure 9 is represented the variation of the confidence factor corresponding to a continuous variation of the mean return interval. One can see that thecapacity of the two analysed structures corresponds to the spectral acceleration valuesassociated ground motion with mean return intervals of 110 and 100 years, respectively.
8/2/2019 183 Fib 2003 Full
http://slidepdf.com/reader/full/183-fib-2003-full 7/8
Table 1: Analysis results12.00 m span structure
Mean
ReturnPeriod
Hazard
Level(Median)
SA (frommedian) D(median) C(median) C φ D λ Ratio
20 0.0500 3.195 0.076 0.165 0.987 1.0075 0.1623 > 0.076 2.133
50 0.0200 4.486 0.108 0.165 0.981 1.0703 0.1614 > 0.115 1.399
475 0.0021 7.646 0.255 0.165 0.984 1.1299 0.1619 < 0.289 0.561
24.00 m span structure
Mean
Return
Period
Hazard
Level
(Median)
SA (from
median)
D
(median)
C
(median) C φ D λ Ratio
20 0.0500 3.033 0.072 0.131 0.994 1.0031 0.1304 > 0.072 1.811
50 0.0200 4.342 0.107 0.131 0.995 1.0332 0.1305 > 0.111 1.178
475 0.0021 7.558 0.250 0.131 0.991 1.1552 0.1301 < 0.288 0.451
( )2CU
2CRb
k
2
1
eβ+β− ( )
2
DU
2DR
b
k
2
1
e β+β
( )2
CU
2CR
b
k
2
1
eβ+β−
( )2
DU
2DR
b
k
2
1
eβ+β
3 1 3
3 5 3
3 9 3
4 3 3
4 7 3
5 1 3
5 5 3
5 9 3
6 3 3
11.13
14.13
17.13
20.13
23.13
26.13
0
8
16
24
32
φu /φy
f y(Mpa)
f c (Mpa)
24-32
16-24
8-16
0-8
3 1 3
3 5 3
3 9 3
4 3 3
4 7 3
5 1 3
5 5 3
5 9 3
6 3 3
11.13
14.13
17.13
20.13
23.13
26.13
0
5
10
15
20
φu /φy
f y(Mpa)
f c (Mpa)
15-20
10-15
5-10
0-5
a) b)Fig. 8. φu /φy ratios for the central columns.
a) 12.00 m span b) 24.00 m span
0
50
100
150
200
250
300
350
400
450
500
0.000 0.500 1.000 1.500 2.000 2.500
Confidence factor
M e a n R e c u r e n c e I n t e r v a l
0
50
100
150
200
250
300
350
400
450
500
0 0.5 1 1.5 2 2.5 3
Confidence factor
M e a n R e c u r e n c e I n t e r v a l
,
a) b)Fig. 9. Confidence factors for different recurrence intervals
a) 12.00 m span b) 24.00 m span

8/2/2019 183 Fib 2003 Full
http://slidepdf.com/reader/full/183-fib-2003-full 8/8
5. CONCLUSIONS. FURTHER OBJECTIVES OF THE STUDY
The paper presented some results of a study devoted to the seismic assessment of a widelyspread category of buildings in Romania: the one level precast RC halls. Most of these halls wereerected based on typified design projects.
The study aims at the safety of these buildings that have been designed using a seismic code,
now considered surpassed (this code have been issued before the 1977 Vrancea earthquake). Theevaluation have been conducted using a variant of the probabilistic procedure developed by Cornell &al.
The way to apply the procedure is presented for two structures, representing the limits of thecommon domain in Romania: 12.00 x 6.00 and 24.00 x 12.00. The buildings were considered to belocated in Bucharest. The seismicity of the Bucharest area is characterised in the current Romanianseismic design code by a 0.2g peak ground acceleration associated with a 50%/50years probability of exceedance.
The verifying criterion was the structural damage directly related to the ultimate lateral topdisplacement.
The application of the probabilistic procedure showed that the structures experience a relativelysmall ductility. Median values of the displacement ductility between 2 and 3 were obtained for all theinvestigated columns. Despite of this, the structure proved to have the capacity to withstand future
seismic events with intensities associated with relatively large mean return periods. In the case of the12.00 x 6.00 halls the demand does not exceed the capacity for ground motions associated with110years mean return intervals. In the other case, the 24.00 x 6.00 halls, the interval was 100 years.Considering the level of knowledge at the design time it can be considered that this performance canbe considered satisfactory.
The results encourage the authors to extend the application of the procedure for the entire domainof industrial halls. All dimensional types and all seismic zones will be investigated. The structuralsafety will be assessed based on specific criteria for ultimate and serviceability limit state. The effectsof other uncertain factors, such as the concrete ultimate strain in compression, the development of theplastic hinge, etc., will be taken into consideration.
In the end, based on the obtained results, strengthening measures will be recommended for eachdimensional type and seismic zone.
REFERENCES
[1] [1] Cornell C.A., Vamvatsikos D., Jalayer F., Luco N., Seismic Reliability of Steel Frames,Proc. of 9
thIFIP WG 7.5 Working Conference on Reliability and Optimisation of Structural
Systems[2] [2] Vamvastsikos D., Cornell C.A., Incremental Dynamic Analysis, preprint of an article
submitted for publication in Earthquake Engineering Structural Dynamics[3] [3] FEMA 350. NEHRP Recommended Seismic Design Criteria for New Steel Moment-Frame
Buildings, Federal Emergency Management Agency, 2000[4] [4] Lungu D., Vacareanu R., Aldea A., Arion A., Cornea T., Seismic hazard of the city of
Bucharest, RISK-UE Program: An advanced approach to earthquake risk scenarios withapplication to different European towns, Report, April 2002.


![RUNNING TIME ANALYSIS - GitHub Pages · Running time analysis of the iterative algorithm function F(n) Create an array fib[1..n] fib[1] = 1 fib[2] = 1 for i = 3 to n: fib[i] = fib[i-1]](https://img.dokumen.tips/doc/110x75/5e95ef9e965d8c2b7e7f1cbb/running-time-analysis-github-pages-running-time-analysis-of-the-iterative-algorithm.jpg)