Embed Size (px)
Citation preview
1
Fiber Quality Variability Within a Plant 1
Neha Kothari 2
International Textile Center, Texas Tech University, Lubbock TX 79407 3
Tel: 806-747-3790 4
Email: [email protected] 5
Noureddine Abidi (corresponding author) 6
International Textile Center and Department of Plant and Soil Science, Texas Tech 7
University, Lubbock TX 79407 8
Tel: 806-747-3790 9
Email: [email protected] 10
Eric Hequet 11
International Textile Center and Department of Plant and Soil Science, Texas Tech 12
University, Lubbock TX 79407 13
Tel: 806-747-3790 14
Email: [email protected] 15
Thea Wilkins 16
Dept. of Plant and Soil Science, Texas Tech University, Lubbock, TX 17
Phone: 806-742-3722 18
Email: [email protected] 19
Acknowledgment 20
This research was supported by Texas Department of Agriculture/Food and Fibers 21
Research Grant Program and the International Cotton Research Center/USDA. 22
23
24

2
Fiber Quality Variability Within a Plant 1
2
3
4
5
6
7
8
9
10
11
12
13
14
15
16
17
18
19
20
21
22
23
24

3
ABSTRACT 1
Our primary goal in this research is to study the spatial distribution of fiber maturity and 2
length within a cotton plant. It is of the utmost importance for geneticists and 3
biotechnologists to realize that the fibers sampled for analysis and testing should be 4
representative of the plant or genotype under study. Two genotypes were selected, 5
namely TM-1 and im. TM-1 is a wild type cotton and the genotype im is an isogenic 6
mutant of TM-1, which has been reported to be genetically immature. Twenty plants 7
each, of TM-1 and im were tagged in the field and harvested. Cotton bolls were 8
identified by fructifer branch number and by position within each branch. Cotton 9
samples collected from different positions in the plant were hand-ginned to prevent fiber 10
breakage. Advanced Fiber Information System and High Volume Instrument were used 11
to measure length, maturity ratio and their distribution as well as other pertinent fiber 12
properties. The results obtained show that there is a large variability for both, length and 13
maturity distributions when progressing from the bottom of the plant to the top. In 14
addition, the extent of the fiber quality variation appears to be genotype specific. These 15
results demonstrate that appropriate sampling protocols need to be developed for single 16
plant testing (cotton breeding for example). 17
18
Keywords: HVI, AFIS, Maturity, Micronaire, TM-1, im 19
4
INTRODUCTION 1
The cotton plant growth habits lead to tremendous variation in fiber quality within 2
genotypes, within plant, and within a boll. This variability is, in general caused by an 3
interplay of various metabolic processes and regulatory mechanisms. In addition, it has 4
been reported that soil pH and organic content could result in variation in fiber yield and 5
quality (Johnson, et al. 2002, Elms, et al. 2001). Also, Moisture availability, irrigation 6
timing and level, soil fertility, to name a few are also a cause of fiber quality variability. 7
Under controlled growth conditions, most fibers develop well. However, even under the 8
best growth conditions within a boll, some fibers will be poorly developed (Wilkins, et 9
al., 1999). 10
The environment plays an important role in variability of cotton fiber quality. It 11
has been shown that cotton fiber quality changes with boll location within the plant and 12
planting dates (Davidonis et al., 2004). Krieg (2005) reported that temperature and 13
growth environment also lead to variation in cotton fiber quality. Exposure to sunlight 14
(UV radiation) affects fiber quality. Ultra-violet radiation causes breakage of cellulose 15
chains, leading to weaker fibers (Morton and Hearle, 1997). Lint from open bolls can be 16
negatively affected if exposed to rain before being harvested. 17
Besides genotype and environmental conditions affecting fiber quality, 18
harvesting, ginning, and processing methods can also alter fiber quality parameters of 19
cotton (MacAlister et al., 2005). It is known that harvesting methods impact fiber quality 20
and length distributions (Behery, 1993). Cotton stripping tends to generate higher short 21
fiber content than cotton picking because stripper cotton contains more foreign matter 22
than picked cotton (El Mogahzy and Chewning, 2001). Therefore, stripped cotton needs 23
additional lint cleaning at the gin. This additional mechanical stress leads to more fiber 24
5
breakage and, thus, increases the short fiber content. Ginning techniques influence fiber 1
length distributions. It is known that saw ginning tends to break more fibers than roller 2
ginning while hand ginning tends to break less fibers than roller ginning (Robert et al., 3
2000). Hand ginning is not an industrial process and it is used only in research. At an 4
industrial level, saw ginning is widely used and this procedure aids in the proper mixing 5
of the fibers to some extent. Roller ginning is less effective in mixing the lint. In 6
addition to hand ginning in research programs, saw ginning and roller ginning are used. 7
The small laboratory gins almost never lead to proper mixing, hence it is very important 8
(before fiber testing) to use a blender to mix the lint of the ginned samples, because of the 9
high variability of fiber quality seen within a plant. 10
Ginning leads to fiber breakage which is closely related to individual fiber 11
strength and therefore to maturity. Fiber maturity is a very important and critical fiber 12
quality trait in the cotton industry (Basra and Malik, 1984). Immature fibers tend to 13
break easily and generate high short fiber content, thereby affecting fiber length (Hequet 14
et al. 2000). Wilkins et al. (1999) reported that individual fibers in the same boll of cotton 15
show variation in the cell wall thickness. Depending on where a sample is picked from 16
the plant and the way it is processed, it can give different fiber quality measurements. 17
In this paper we report on the variability of fiber properties within a cotton plant 18
for two extremely different genotypes, TM-1 and im. TM-1 is the wild type cotton and im 19
is its isogenic mutant known to grow genetically immature fibers (Kohel, 1990). 20
MATERIALS AND METHODS 21
Materials 22
TM-1 (Texas Marker-1, identified as TM) and im (immature cotton) were grown 23
in the green-house (located at TG Trees, Lubbock, TX) and in the field (Texas Tech 24
6
Quaker Farm, Lubbock, TX) with randomized complete block design. Each plot had 1
about 40 plants. Planting was done in the green-house on July 20, 2006. Green-house 2
growth protocol was 30oC/20oC for day/night routine in optimal conditions with 5 gallon 3
pots and 3 plants/pot. Drip irrigation system was used. In the field, planting was done on 4
June 8, 2006. 5
Harvesting 6
To study the variability of the fiber quality (especially maturity and length) we 7
harvested cotton bolls at different positions within the plant. These samples are called 8
the plant ‘mapping’ samples. For this purpose, twenty plants were tagged for each 9
genotype. Opened bolls were collected from different fruiting branches and boll 10
positions, and samples were identified as TM-x-y or im-x-y, where x refers to the 11
fructifer branch number and y refers to the boll potion within that branch. For example, 12
TM-8-1 would mean genotype TM fructifer branch 8 and boll position 1. Branch 13
numbering started from the bottom (just after the last vegetative branch) of the plant to 14
the top. Bolls were harvested starting October 16, 2006 and by November 15, 2006 all 15
the bolls were harvested. 16
From the remaining 20 plants in the field for each plot, a combined ‘average 17
sample’ was harvested. An ‘average sample’ was obtained by harvesting all the bolls 18
from 20 plants for each cultivar (for each of the replicates), roller ginning the bolls and 19
then mixing them with a laboratory blender. Only two replications were harvested in the 20
green-house since the third one had been lost due to poor yield. Harvesting for the green-21
house average samples was done on January 25, 2007. 22
Ginning and blending 23
7
Bolls harvested at different positions (mapping samples) in the plant were hand-1
ginned. The lint from identical branches and boll positions were combined for each 2
genotype to generate sufficient lint for testing. We collected a set of twelve boll positions 3
for both TM-1 and im. 4
The average samples from the field and green-house were machine ginned with a 5
small tabletop roller gin. A mechanical cotton blender was used to mix the cotton to 6
reduce the effects of within-sample variability. 7
HVI and AFIS testing 8
The samples were conditioned in the laboratory at 65% relative humidity and 9
21oC (standard laboratory conditions) for at least 48 hours before testing. Fiber testing 10
was done at the International Textile Center, Texas Tech University, Lubbock. The 11
instruments employed were, Uster® HVI 900A (High Volume Instrument) and Uster® 12
AFIS PRO (Advanced Fiber Information System). A module test 1,10 (1 micronaire test 13
and 10 length and strength tests) with the HVI was done on the combined average 14
samples from field and green-house. AFIS testing was performed on all the samples. For 15
AFIS testing, 5,000 fibers were counted and three replications were performed (total of 16
15,000 fibers analyzed). AFIS length and maturity distributions were plotted. 17
RESULTS AND DISCUSSION 18
Fiber quality Analysis of average samples from the green-house and the field 19
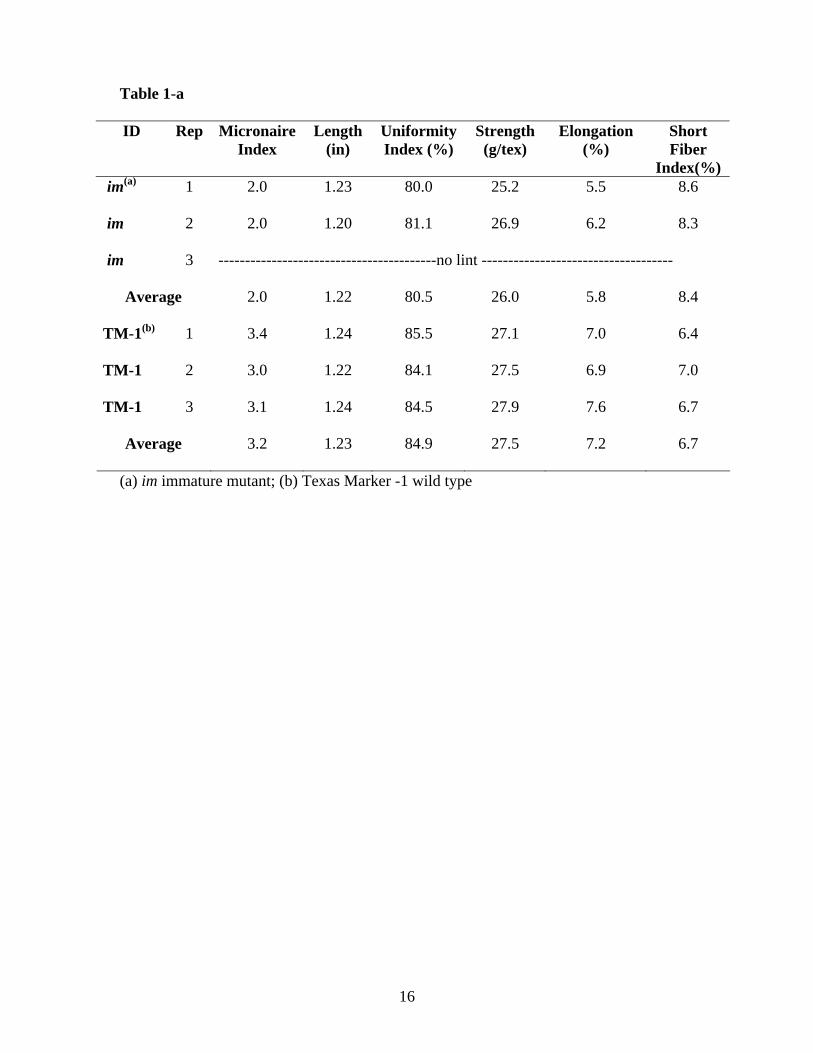
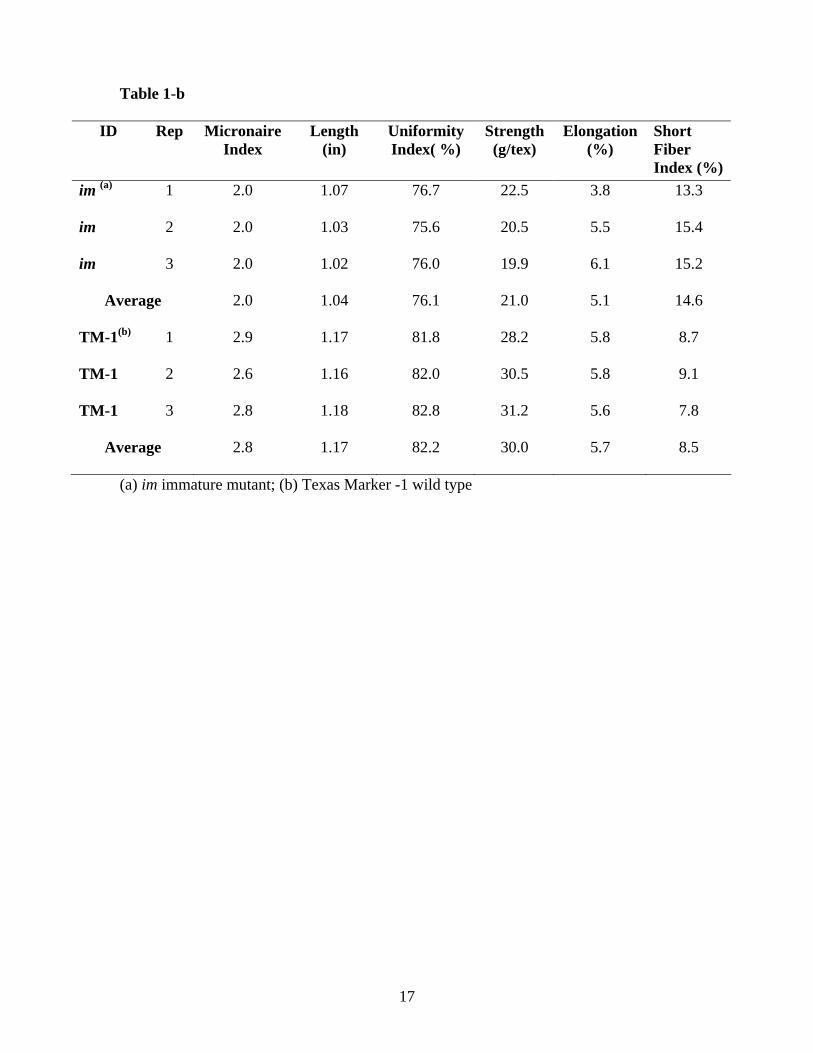
HVI data analysis: Tables 1-a and 1-b show the HVI results for TM-1 and im in green-20
house and field conditions. A micronaire of 2.0 was observed for im, in the green-house 21
as well as in the field, which is the lowest reading that the instrument measures. TM-1 22
had a micronaire of 3.2 when grown in the green-house, and 2.8 when grown in the field 23
revealing that even the wild-type cotton was somewhat immature that year. This is 24

8
consistent with the Lubbock classing office data of the 2006-2007 crop which showed 1
that 40.5% of the bales had a micronaire of 3.5 or below. The HVI strength of the TM-1 2
fibers was higher for field-grown samples than for the green-house samples. This could 3
be due to the very principle of HVI bundle testing. HVI bundle strength results from a 4
force measurement divided by the weight. Lower is the micronaire larger is the number 5
of fibers in the bundle for the given weight. This will result in higher bundle strength. It 6
does not mean that individual fiber strength is better. 7
The HVI average elongation of TM-1 is 7.2% in the green-house and 5.7% in the 8
field. Average strength and elongation values of im are lower than TM-1 for both, green-9
house and field-grown cotton. There is in general, a weak correlation between fiber 10
maturity and HVI elongation that is not seen in this set of data. This could mean that in 11
addition to cellulose deficiency im fibers may exhibit a structural organization problem. 12
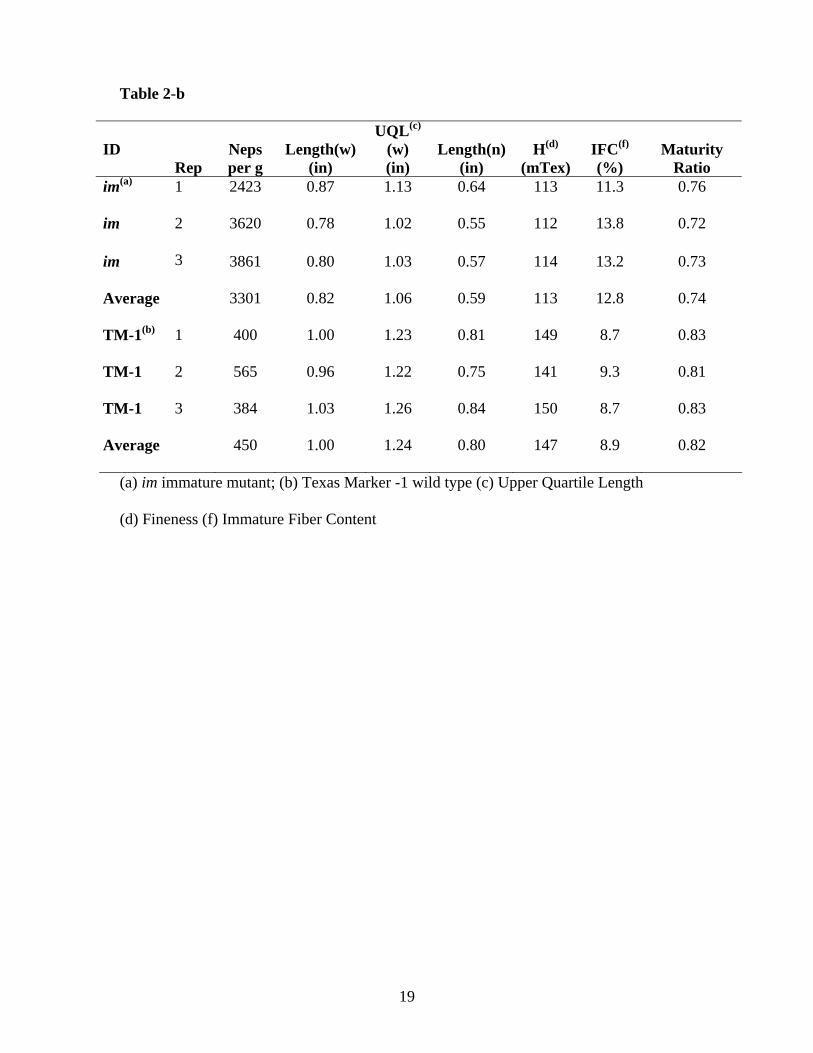
AFIS data analysis: The AFIS measures length by number, length by weight, maturity 13
ratio, fineness, neps and trash. Neps are entangled fibers formed primarily by immature 14
fibers. Neps may lead to the formation of white specks on the dyed fabric (Davidonis, 15
2003, Mangialardi, 1987). The im fibers were found to be very immature and extremely 16
fine (meaning low weight per km of fibers), in the green-house as well as in the field-17
grown plants (Tables 2-a and 2-b). Green-house grown fibers have 6 times less neps 18
compared to the field-grown im fibers. This indicates that the phenotype im is greatly 19
affected by the environmental conditions. Field-grown im also has 7 to 8 times higher 20
proportion of neps compared to field-grown TM-1. A high level of neps is very strongly 21
suggestive of highly immature fibers. TM-1 fibers had better maturity in the green-house 22
and much less neps. 23
9
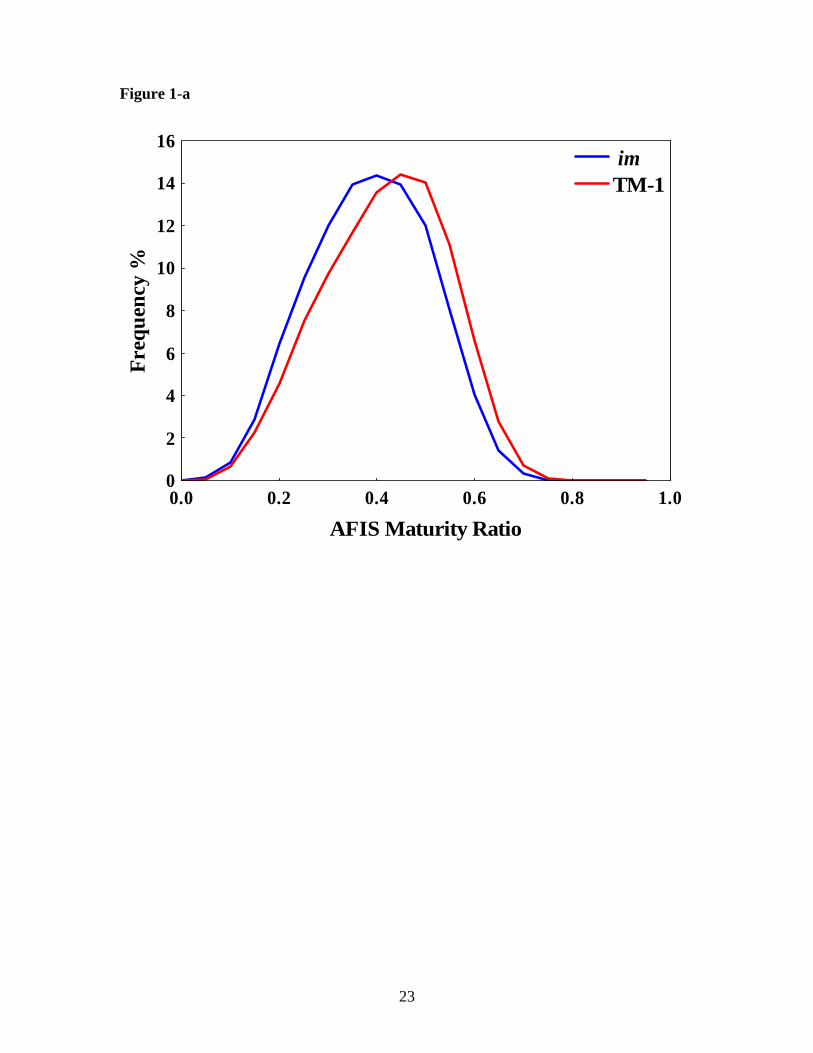
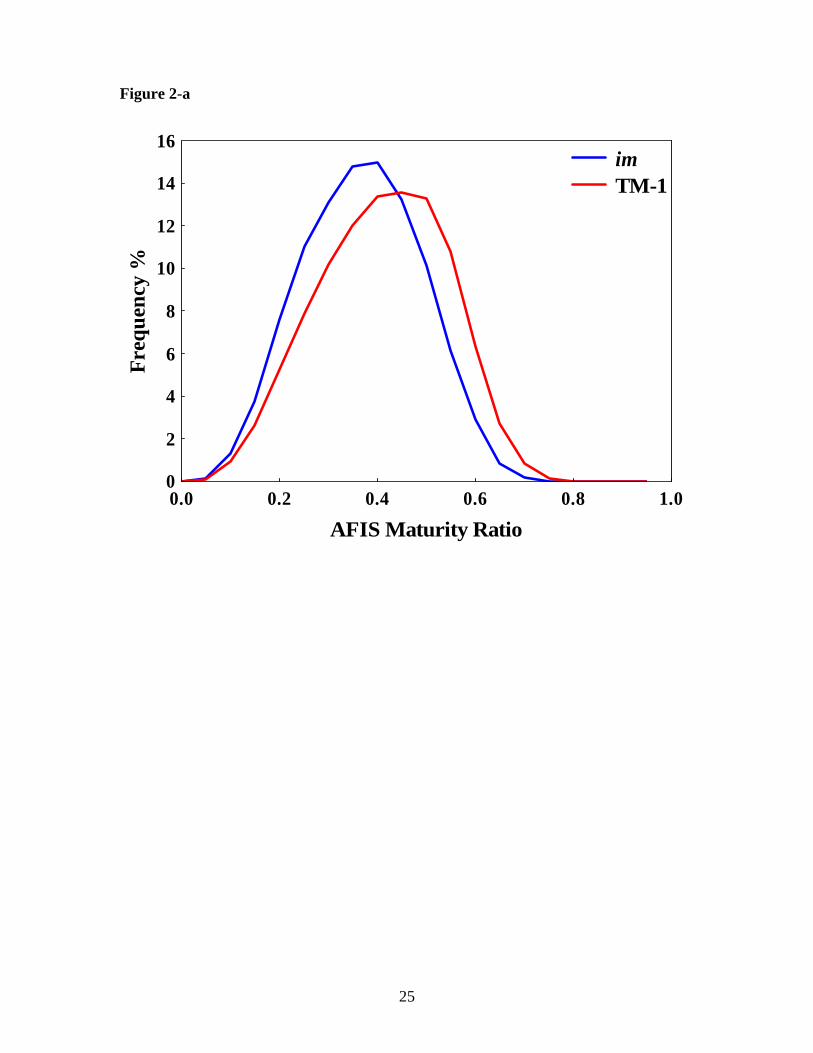
Maturity distributions also show better maturity for TM-1 compared to the im 1
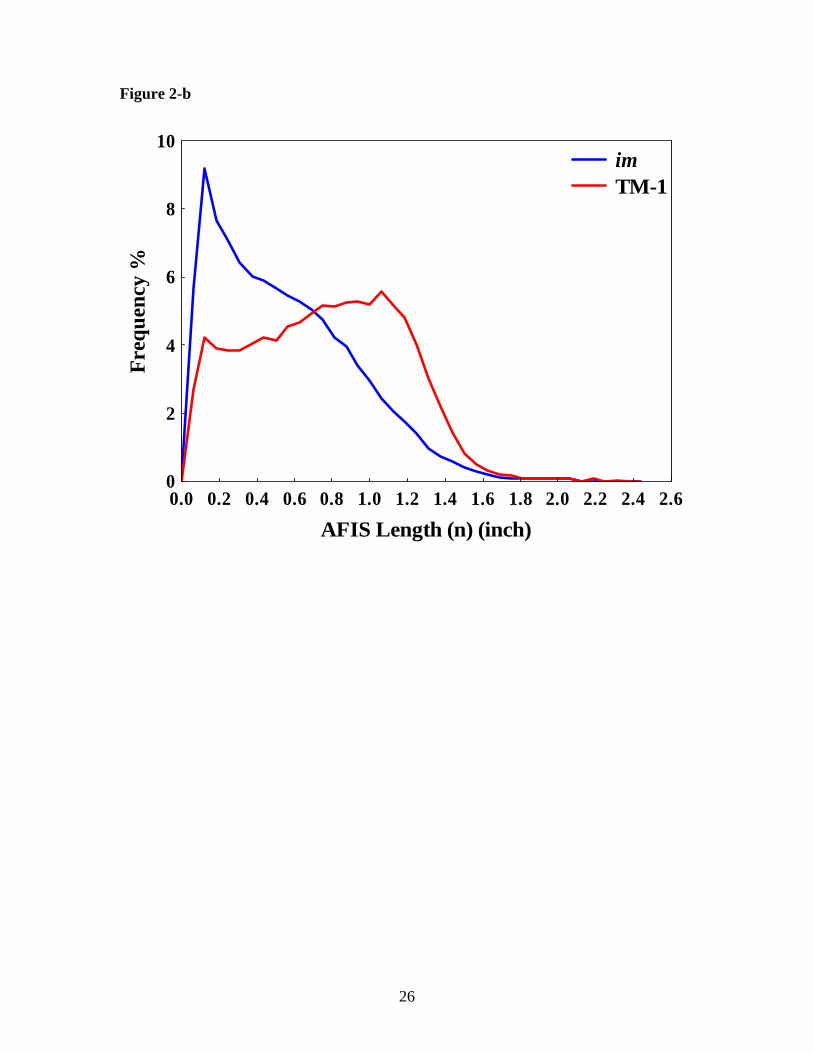
plants in the field as well as the green-house (Figures 1-a and 2-a). Length distributions 2
for the green-house and field-grown plants show a very high short fiber content for im 3
compared to TM-1 (Figures 1-b and 2-b). The high short fiber content is probably 4
resulting from fiber breakage (during ginning and/or in the AFIS opener) due to the 5
immaturity of the fibers. It seems unlikely for the im plants to have a genetic 6
predisposition to shorter fibers, since previous studies showed that im continues to grow 7
in the elongation phase up to 21dpa (Kohel, 1974). 8
Variability of fiber quality within a plant 9
We investigated fiber quality on twelve branches, on boll #1. The lint collected 10
was not sufficient for HVI testing and hence we performed only AFIS testing on these 11
samples and plotted length and maturity distributions. 12
For the different positions in the TM-1 plant, we found decreasing maturity ratio 13
from the bottom of the plant to the top of the plant as shown in Table 3-a. The number of 14
neps per gram and the immature fiber content steadily increased from the bottom to the 15
top of the plant while logically fiber fineness (mtex) decreased. The mean fiber length 16
also decreases from the bottom branch to the top. For im plants, AFIS data showed a low 17
maturity ratio for all the positions within the plant (Table 3-b). As expected, the nep 18
count was very high in most of the immature samples, with all the samples being 19
extremely fine and having a high immature fiber content. Length variation among bolls 20
does not vary much for im. 21
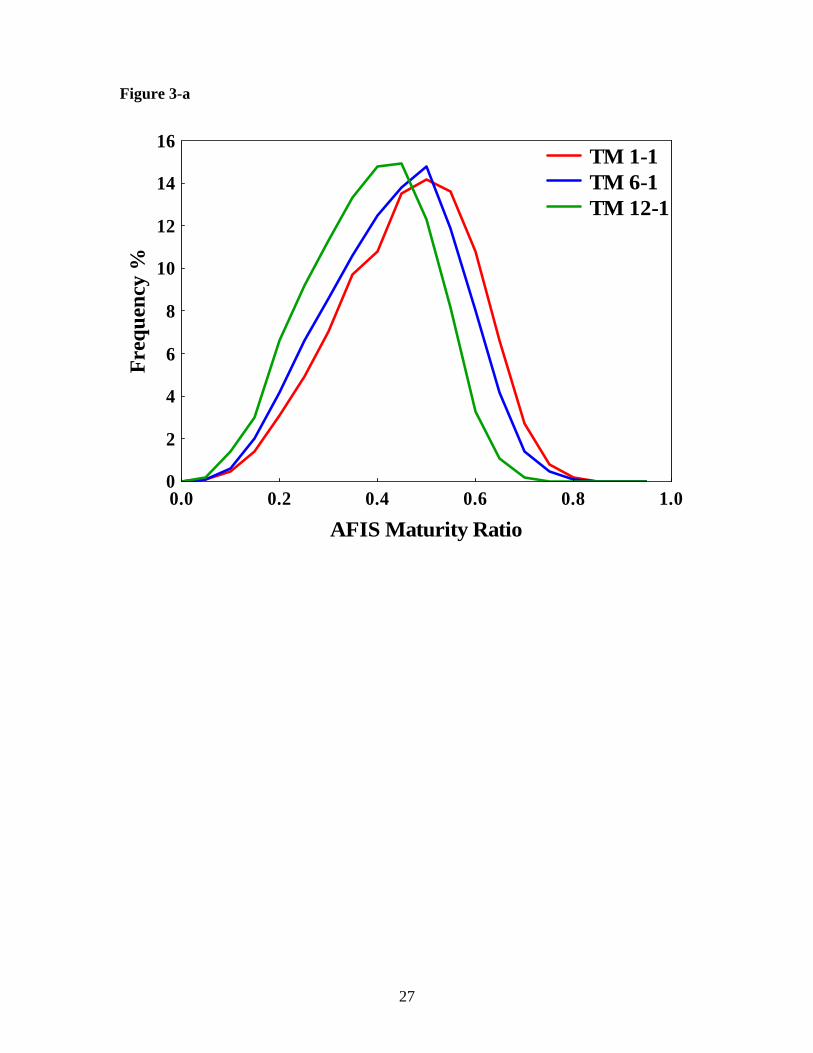
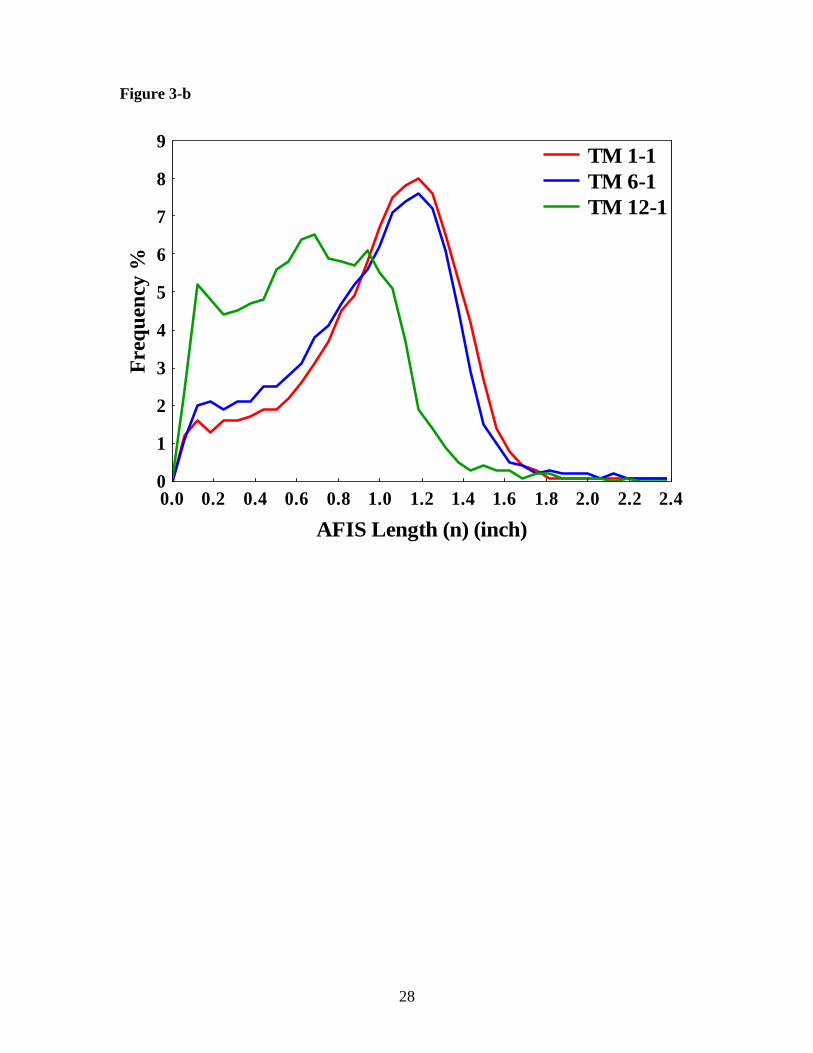
Maturity and length distributions were plotted using the data from the AFIS. For 22
TM-1, maturity ratio distribution shifts towards lower maturity from branch 1 to branch 23
12 plant (Figure 3-a). Fiber length distributions show a gradual increase in short fiber 24
10
content (Figure 3-b). It is reasonable to assume that decreasing maturity leads to weaker 1
fibers that break easily, generating more short fibers. 2
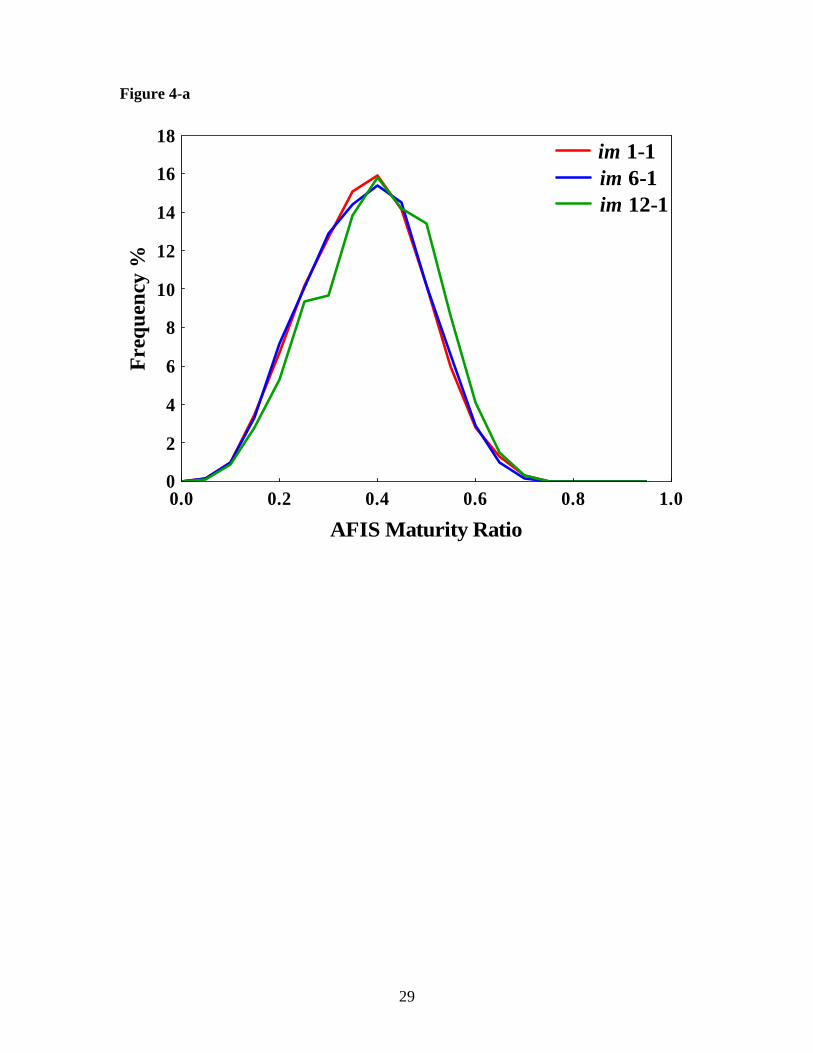
For im, maturity ratio distribution shows very low maturity regardless of the 3
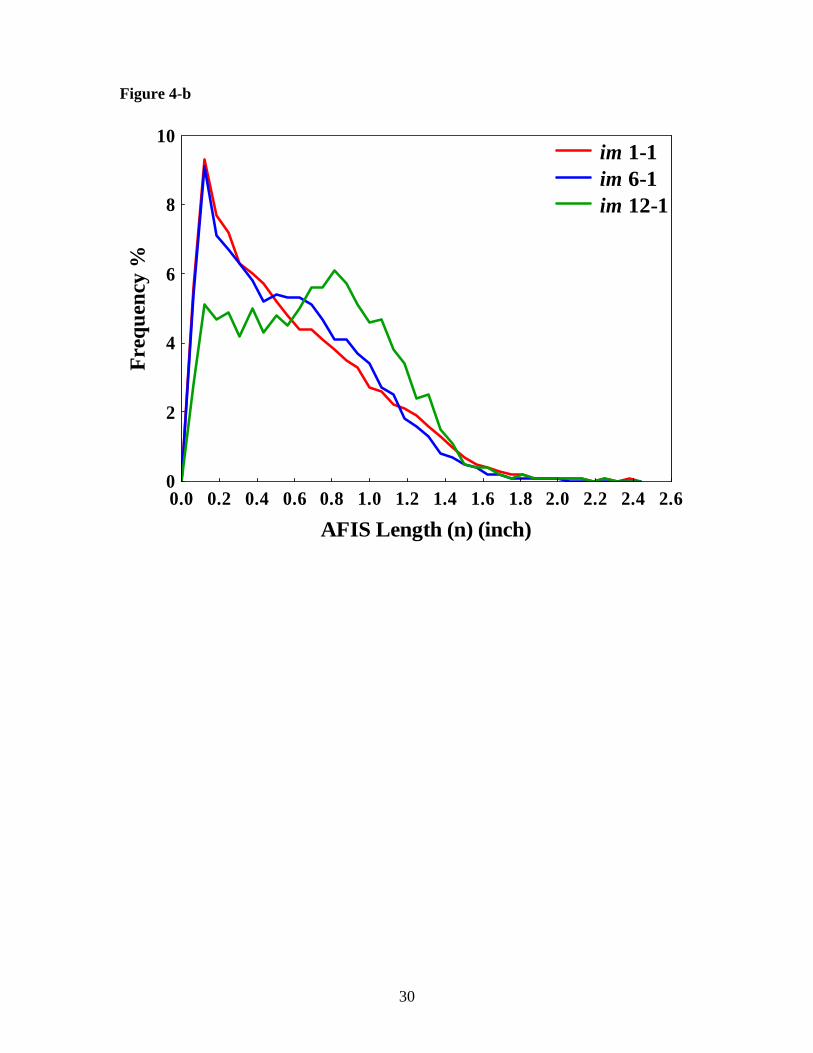
branch location within the plant (Figure 4-a). The length distribution show very high 4
short fiber contents, which tend to decrease at the top of the plant (Figure 4-b). It is 5
noteworthy that for im fibers, bolls located at the top of the plant have lower short fiber 6
content and better maturity ratios. 7
For the TM-1 field-grown plants, based on the average sample HVI micronaire, 8
one would conclude that this cotton is of poor quality. However, based on AFIS results, 9
we observe that not all bolls have poor quality. It is the production from the top of the 10
plant that brings down the overall fiber quality. Therefore, in order to take a 11
representative lint sample, sampling techniques are of utmost importance. For research 12
purposes and when dealing with individual plants, it is very important to apply an 13
appropriate sampling technique (with bolls from all parts of the plant) because of the 14
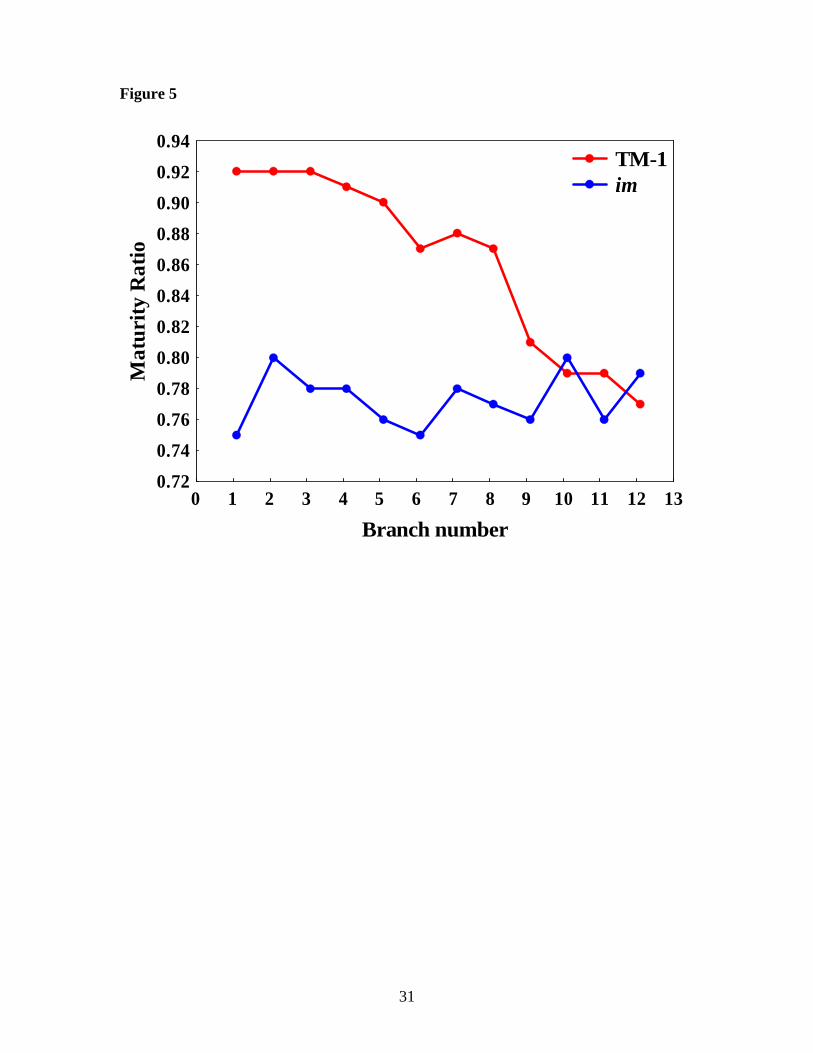
tremendous variation observed within a plant. Figure 5 shows the overall evolution of 15
the AFIS maturity ratio of cotton samples picked from branch 1 up to branch 12 for both 16
TM-1 and im. For im fibers, there is no variation in maturity ratio within the plant. 17
However, for TM-1 the maturity ratio varies from 0.92 for branch 1 position 1 down to 18
0.76 for branch 12, position 1. It is observed that TM-1 and im differ greatly, in their 19
distribution of fiber quality within a plant. 20
The declining quality of fibers from the bottom of the plant to the top is probably 21
due to the indeterminate growth of the cotton plant (Deterling and Kamal, 1982). The 22
lower branches receive maximum nutrition compared to the top branches. Also, UV 23
radiations weaken the fibers (Morton and Hearle, 1997) and the topmost branches are 24
11
exposed to direct sunlight a lot more than the bottom branches. We observe that at about 1
branch number ten, for TM-1 plants, the fiber quality begins to be very similar to that of 2
the im fibers (Figure 5). 3
The green-house grown cultivars have better quality compared to field-grown 4
cultivars due to more controlled environment in the green-house. The im plants also 5
show less severe phenotype in the green-house and looked healthier. The tight-lock boll 6
pattern described by Kohel et al, was observed in both the green-house and field-grown 7
plants (Kohel et al., 1974). 8
Based on the result of this preliminary study, we have suggested a sampling 9
protocol for breeders and biotechnologists to avoid errors in fiber quality analysis 10
contributed by fiber quality variability. This protocol involves harvesting all the bolls or 11
one lock/boll of the entire plant followed by ginning. The sample can be saw/roller/hand 12
ginned depending on the type of germplasm used or depending on the goal of the project. 13
The lint obtained, is then blended. This mixed sample would thus, be representative of 14
the overall fiber quality of the entire plant. 15
CONCLUSIONS 16
Fiber quality varies drastically depending on where the fibers are picked from 17
within the plant. Analyzed fibers need to be representative of the plant or genotype tested. 18
Therefore, an appropriate sampling protocol is very important for reliable fiber analysis. 19
This is needed particularly when dealing with individual plants, or a small volume of 20
fibers for analysis. Testing performed using HVI and AFIS suggested that for the TM-1 21
plants, the quality of the fibers declines from the bottom of the plant to the top. For im, 22
the fiber quality among bolls was less variable. 23
REFERENCES 24
12
Basra, A.S. and Malik, C.P. 1984. Development of the Cotton Fiber. International 1
Review of Cytology 89:65-113. 2
Behery, H.M. 1993. Short fiber content and uniformity index in cotton. Int. Cotton 3
Advisory Committee Rev. Article 4, CABI International, Wallingford, UK. 4
Bragg, C.K. and Shofner, F.M. 1993. A rapid, direct measurement of short fiber content. 5
Textile Res. J. 63:171-176. 6
Davidonis, G., Johnson, A., Landivar, J. and Fernandez, J. 2004. Cotton Fiber Quality is 7
related to Boll Location and Planting Date. Agronomy Journal. 96: 42-27. 8
Deterling, D. and El-Zik, K.M. 1982. How a Cotton Plant Grows. Progressive Farmer. 9
El Mogahzy, Y.E. 1998. Cotton blending: How the EFS® system can help in producing 10
optimum yarn quality. p. 79-104. In C. Chewning (ed.) Proc. 10th Annual 11
Engineered Fiber Selection System Conf., 8-10 June 1998. Raleigh, NC. Cotton 12
Incorporated, Cary, NC. 13
Elms, M., Green, C. and Johnson, P. 2001. Variability of Cotton Yield and Quality. 14
Commun. Soil Sci. Plant Anal., 32: 351–368. 15
Haigler, C., Zhang, D. and Wilkerson, C. 2005. Biotechnological improvement of cotton 16
fibre maturity. Physiologia Plantarum, 124: 285-294. 17
Hequet, E., Wyatt, B., Abidi, N., and D. Thibodeaux 2006. Creation of a Set of Reference 18
Material for Cotton Fiber Maturity Measurements. Textile Res. J. 76: 576-586. 19
Hequet, E. and Ethridge, D. 2000. Effects of cotton fiber Length distributions on Yarn 20
Quality. Proc. Beltwide Cotton Conference, National Council of America, San 21
Antonio, TX, USA, p.1527-1527, January. 22
Hequet, E.F., M.D. Ethridge, and R. Zhu. 1998. Evaluation of alternative instrument 23
measurements for selected cotton fiber properties. Proc. Beltwide Cotton 24
13
Conference, National Council of America, San Diego, CA, January 5-9, 1516-1
1526. 2
Johnson, R., Downer, R., Bardow, J., Bauer, P. and Sadler, E. 2002. Variability in Cotton 3
Fiber Yield, Fiber Quality, and Soil Properties in a Southeastern Coastal Plain. 4
Agronomy Journal 94:1305-1316. 5
Kohel, R.J., J.E. Quisenberry, and C.R. Benedict. 1974. Fiber Elongation and Dry Weight 6
Changes in Mutant Lines of Cotton. Crop Sci. 14:471-474. 7
Kohel., R.J. and McMichael, S.C. 1999. Immature Fiber Mutant of Upland Cotton. Crop 8
Sci. 30:419-421 (1990). 9
Kohel, R.J., Stelly, D.M., and Yu, J. 2002. Tests of Six Cotton Mutants for Association 10
with Aneuploids. The American Genetic Association 93: 130-132. 11
Krieg, D. R. 2005. Yield component analyses of cotton genetic and environmental causes 12
of variation. Proc. Beltwide Cotton Conference, National Council of America. 13
New Orleans, LA, January 4-7, p. 2022-2032. 14
MacAlister III, D. and Rogers, C. 2005. The Effect of Harvesting Procedures on Fiber 15
and Yarn Quality on Ultra-Narrow-Row Cotton. Journal of Cotton Science 9:15-16
23. 17
Mangialardi, G. J., Lalor, W.F., Basset, D.M. and Miravalle, R.J. 1987. Influence of 18
Growth period of Neps in Cotton. Textile Res. J. 57: 421-427. 19
May, L. and Jividen, G. M. 1999. Genetic Modification of Cotton Fiber Properties as 20
measured by Single- and High- Volume Instruments. Crop Sci. 39:328-333. 21
Morton, W.E. and Hearle, J.W.S. 1997, UK. Physical Properties of Textile Fibers, Textile 22
Institute, 3rd ed. 23
14
Robert, K.Q., J.B. Price, and X. Cui. 2000. Cotton cleanability: Part II. Effect of simple 1
random breakage on fiber length distribution. Textile. Res. J. 70:108-115. 2
Wilkins, T.A. and Jernstedt J.A.1999. Food Products Press, Chapter 9, Molecular 3
Genetics of Developing Cotton Fibers, In: Cotton Fibers Developmental Biology, 4
Quality Improvement, and Textile Processing. Ed. A.S. Basra, p. 231-269. 5
15
TABLE CAPTIONS 1
Table 1-a. HVI Data of green-house average samples. 2
Table 1-b. HVI Data of field-grown average samples. 3
Table 2-a. AFIS data of green-house average samples. 4
Table 2-b. AFIS data of field-grown average samples. 5
Table 3-a. AFIS data of TM-1 from branch #1 to branch #12. 6
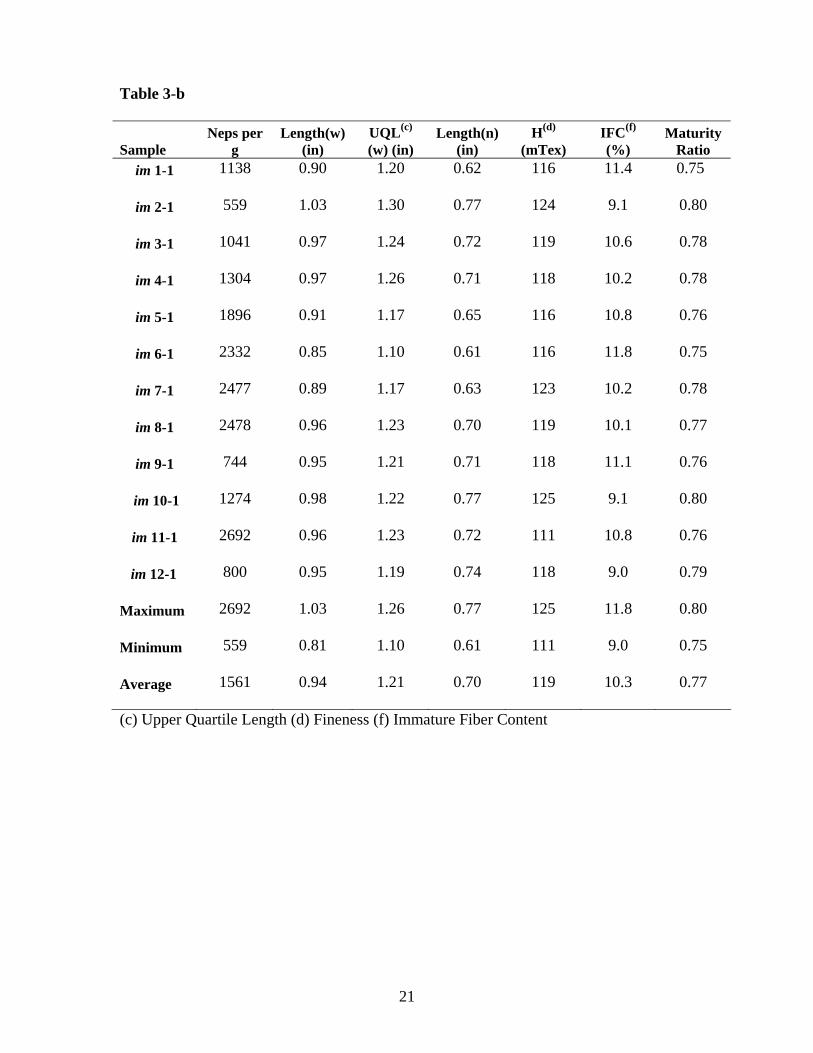
Table 3-b. AFIS data of im from branch #1 to branch #12. 7
16
Table 1-a 1
ID Rep Micronaire Index
Length (in)
Uniformity Index (%)
Strength (g/tex)
Elongation (%)
Short Fiber
Index(%) im(a) 1 2.0 1.23 80.0 25.2 5.5 8.6
im 2 2.0 1.20 81.1 26.9 6.2 8.3
im 3 -----------------------------------------no lint ------------------------------------
Average 2.0 1.22 80.5 26.0 5.8 8.4
TM-1(b) 1 3.4 1.24 85.5 27.1 7.0 6.4
TM-1 2 3.0 1.22 84.1 27.5 6.9 7.0
TM-1 3 3.1 1.24 84.5 27.9 7.6 6.7
Average 3.2 1.23 84.9 27.5 7.2 6.7
(a) im immature mutant; (b) Texas Marker -1 wild type 2
17
Table 1-b 1
ID Rep Micronaire Index
Length (in)
Uniformity Index( %)
Strength (g/tex)
Elongation (%)
Short Fiber Index (%)
im (a) 1 2.0 1.07 76.7 22.5 3.8 13.3
im 2 2.0 1.03 75.6 20.5 5.5 15.4
im 3 2.0 1.02 76.0 19.9 6.1 15.2
Average 2.0 1.04 76.1 21.0 5.1 14.6
TM-1(b) 1 2.9 1.17 81.8 28.2 5.8 8.7
TM-1 2 2.6 1.16 82.0 30.5 5.8 9.1
TM-1 3 2.8 1.18 82.8 31.2 5.6 7.8
Average 2.8 1.17 82.2 30.0 5.7 8.5
(a) im immature mutant; (b) Texas Marker -1 wild type 2

18
Table 2-a 1
ID Rep Neps per g
Length (w) (in)
UQL(c) (w) (in)
Length (n) (in)
H(d) (mTex)
IFC (f) (%)
Maturity Ratio
im(a) 1 606 0.91 1.18 0.65 124 10.7 0.77
im 2 678 0.95 1.21 0.70 130 10.1 0.78
im 3 --------------------------------------no lint---------------------------------------
Average 642 0.93 1.19 0.67 127 10.4 0.77
TM-1(b) 1 101 1.08 1.29 0.91 167 6.6 0.86
TM-1 2 199 1.02 1.26 0.83 155 8.1 0.82
TM-1 3 139 1.05 1.29 0.84 157 8.2 0.83
Average 146 1.05 1.28 0.86 160 7.6 0.84
(a) im immature mutant; (b) Texas Marker -1 wild type (c) Upper Quartile Length 2
(d) Fineness (f) Immature Fiber Content 3
4
19
Table 2-b 1
ID Rep
Neps per g
Length(w) (in)
UQL(c) (w) (in)
Length(n) (in)
H(d) (mTex)
IFC(f) (%)
Maturity Ratio
im(a) 1 2423 0.87 1.13 0.64 113 11.3 0.76
im 2 3620 0.78 1.02 0.55 112 13.8 0.72
im 3 3861 0.80 1.03 0.57 114 13.2 0.73
Average 3301 0.82 1.06 0.59 113 12.8 0.74
TM-1(b) 1 400 1.00 1.23 0.81 149 8.7 0.83
TM-1 2 565 0.96 1.22 0.75 141 9.3 0.81
TM-1 3 384 1.03 1.26 0.84 150 8.7 0.83
Average 450 1.00 1.24 0.80 147 8.9 0.82
(a) im immature mutant; (b) Texas Marker -1 wild type (c) Upper Quartile Length 2
(d) Fineness (f) Immature Fiber Content 3

20
Table 3-a 1
(c) Upper Quartile Length (d) Fineness (f) Immature Fiber Content 2
3
ID Neps per g
Length(w) (in)
UQL(c) (w) (in)
Length(n) (n)
H(d) (mTex)
IFC(f) (%)
Maturity Ratio
TM 1-1 79 1.17 1.37 1.04 177 5.0 0.92
TM 2-1 63 1.19 1.36 1.07 180 4.8 0.92
TM 3-1 59 1.17 1.35 1.05 178 4.9 0.92
TM 4-1 76 1.16 1.34 1.03 174 5.3 0.91
TM 5-1 73 1.20 1.37 1.07 172 5.6 0.90
TM 6-1 94 1.14 1.34 0.98 156 7.0 0.87
TM 7-1 81 1.13 1.31 0.98 159 6.7 0.88
TM 8-1 134 1.07 1.28 0.90 157 7.3 0.87
TM 9-1 216 1.05 1.28 0.86 135 9.4 0.81
TM 10-1 248 0.99 1.24 0.76 130 10.3 0.79
TM 11-1 338 1.01 1.23 0.79 128 9.9 0.79
TM 12-1 642 0.89 1.09 0.70 128 11.2 0.77
Maximum 642 1.19 1.37 1.07 180 11.2 0.92
Minimum 59 0.89 1.09 0.70 128 4.8 0.77
Average 175 1.10 1.30 0.94 156 7.3 0.86
21
Table 3-b 1
Sample Neps per
g Length(w)
(in) UQL(c) (w) (in)
Length(n) (in)
H(d) (mTex)
IFC(f) (%)
Maturity Ratio
im 1-1 1138 0.90 1.20 0.62 116 11.4 0.75
im 2-1 559 1.03 1.30 0.77 124 9.1 0.80
im 3-1 1041 0.97 1.24 0.72 119 10.6 0.78
im 4-1 1304 0.97 1.26 0.71 118 10.2 0.78
im 5-1 1896 0.91 1.17 0.65 116 10.8 0.76
im 6-1 2332 0.85 1.10 0.61 116 11.8 0.75
im 7-1 2477 0.89 1.17 0.63 123 10.2 0.78
im 8-1 2478 0.96 1.23 0.70 119 10.1 0.77
im 9-1 744 0.95 1.21 0.71 118 11.1 0.76
im 10-1 1274 0.98 1.22 0.77 125 9.1 0.80
im 11-1 2692 0.96 1.23 0.72 111 10.8 0.76
im 12-1 800 0.95 1.19 0.74 118 9.0 0.79
Maximum 2692 1.03 1.26 0.77 125 11.8 0.80
Minimum 559 0.81 1.10 0.61 111 9.0 0.75
Average 1561 0.94 1.21 0.70 119 10.3 0.77
(c) Upper Quartile Length (d) Fineness (f) Immature Fiber Content 2
3
22
FIGURE CAPTIONS 1
Figure 1-a. AFIS maturity ratio distributions of green-house average samples. 2
Figure 1-b. AFIS length (n) distributions of green-house average samples. 3
Figure 2-a. AFIS maturity ratio distributions of field-grown average samples. 4
Figure 2-b. AFIS length (n) distributions of field-grown average samples. 5
Figure 3-a. AFIS maturity ratio distribution of TM-1 field-grown samples. 6
Figure 3-b. AFIS length (n) distribution of TM-1 field-grown samples. 7
Figure 4-a. AFIS maturity ratio distribution of im field-grown samples. 8
Figure 4-b. AFIS length (n) distribution of im field-grown samples. 9
Figure 5. Comparison of maturity ratio at boll #1 at different branches of TM-1 and im. 10
23
Figure 1-a 1
2
3
4
5
6
7
8
9
10
11
12
0.0 0.2 0.4 0.6 0.8 1.0
AFIS Maturity Ratio
0
2
4
6
8
10
12
14
16Fr
eque
ncy
% imTM-1

24
Figure 1-b 1
2
3
4
5
6
7
8
9
10
11
12
0.0 0.2 0.4 0.6 0.8 1.0 1.2 1.4 1.6 1.8 2.0 2.2 2.4
AFIS Length (n) (inch)
0
1
2
3
4
5
6
7
8Fr
eque
ncy
% im TM-1
25
Figure 2-a 1
2
3
4
5
6
7
8
9
10
11
12
0.0 0.2 0.4 0.6 0.8 1.0
AFIS Maturity Ratio
0
2
4
6
8
10
12
14
16Fr
eque
ncy
% im TM-1
26
Figure 2-b 1
2
3
4
5
6
7
8
9
10
11
12
0.0 0.2 0.4 0.6 0.8 1.0 1.2 1.4 1.6 1.8 2.0 2.2 2.4 2.6
AFIS Length (n) (inch)
0
2
4
6
8
10Fr
eque
ncy
% im TM-1
27
Figure 3-a 1
2
0.0 0.2 0.4 0.6 0.8 1.0
AFIS Maturity Ratio
0
2
4
6
8
10
12
14
16Fr
eque
ncy
% TM 1-1 TM 6-1 TM 12-1
28
Figure 3-b 1
2
0.0 0.2 0.4 0.6 0.8 1.0 1.2 1.4 1.6 1.8 2.0 2.2 2.4
AFIS Length (n) (inch)
0
1
2
3
4
5
6
7
8
9Fr
eque
ncy
% TM 1-1 TM 6-1 TM 12-1
29
Figure 4-a 1
2
0.0 0.2 0.4 0.6 0.8 1.0
AFIS Maturity Ratio
0
2
4
6
8
10
12
14
16
18Fr
eque
ncy
% im 1-1 im 6-1 im 12-1
30
Figure 4-b 1
2
0.0 0.2 0.4 0.6 0.8 1.0 1.2 1.4 1.6 1.8 2.0 2.2 2.4 2.6
AFIS Length (n) (inch)
0
2
4
6
8
10Fr
eque
ncy
% im 1-1 im 6-1 im 12-1
31
Figure 5 1
2
3
0 1 2 3 4 5 6 7 8 9 10 11 12 13
Branch number
0.720.740.760.780.800.820.840.860.880.900.920.94
Mat
urity
Rat
io TM-1 im