Embed Size (px)
Citation preview
18 Spinal Cord Tumors on Magnetic Resonance Imaging
CLINICAL IMAGAGINGAN ATLAS OF DIFFERENTIAL DAIGNOSIS
EISENBERG
DR. Muhammad Bin Zulfiqar PGR-FCPS III SIMS/SHL
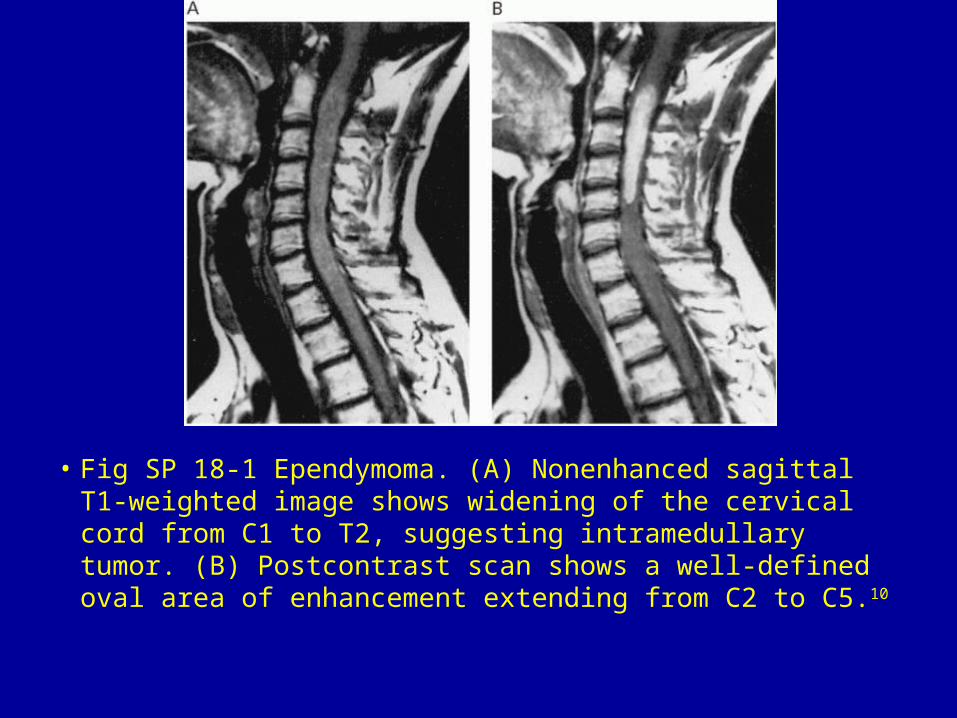
• Fig SP 18-1 Ependymoma. (A) Nonenhanced sagittal T1-weighted image shows widening of the cervical cord from C1 to T2, suggesting intramedullary tumor. (B) Postcontrast scan shows a well-defined oval area of enhancement extending from C2 to C5.10
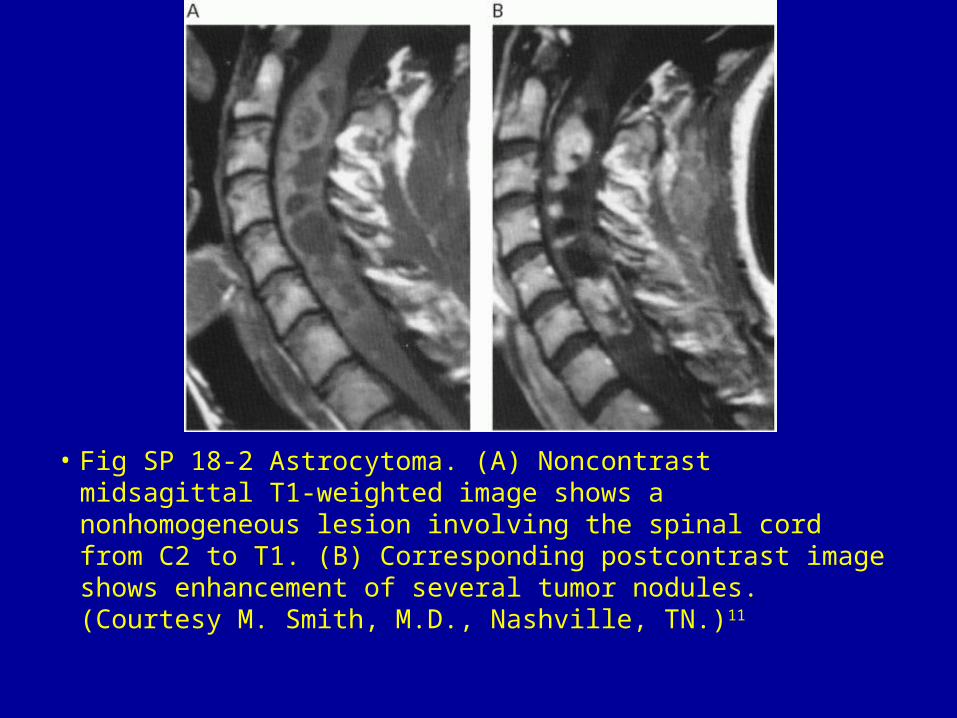
• Fig SP 18-2 Astrocytoma. (A) Noncontrast midsagittal T1-weighted image shows a nonhomogeneous lesion involving the spinal cord from C2 to T1. (B) Corresponding postcontrast image shows enhancement of several tumor nodules. (Courtesy M. Smith, M.D., Nashville, TN.)11
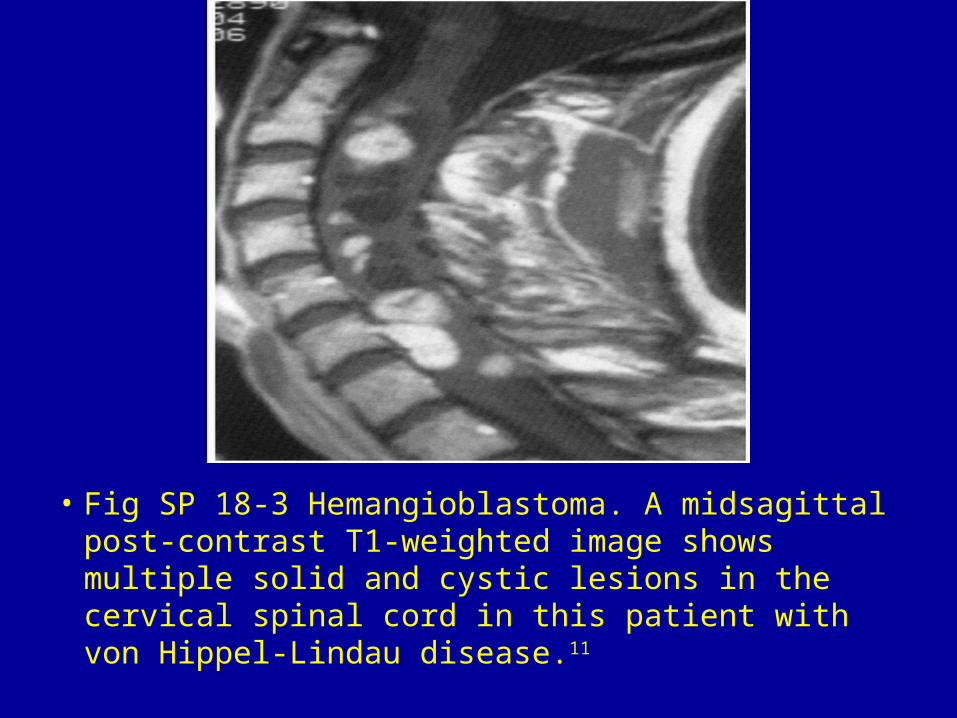
• Fig SP 18-3 Hemangioblastoma. A midsagittal post-contrast T1-weighted image shows multiple solid and cystic lesions in the cervical spinal cord in this patient with von Hippel-Lindau disease.11
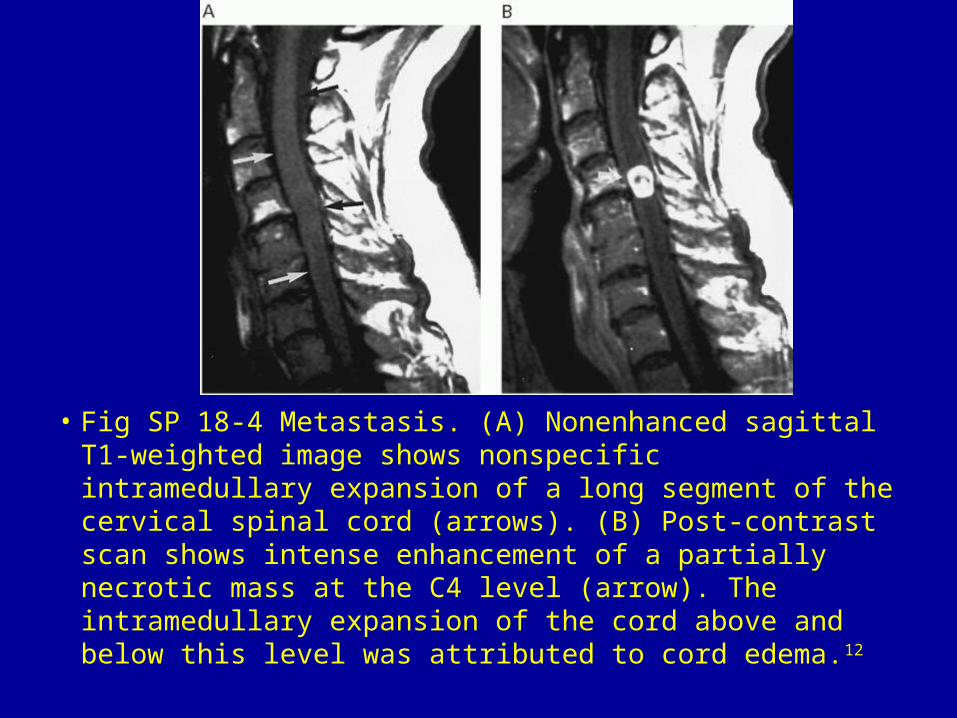
• Fig SP 18-4 Metastasis. (A) Nonenhanced sagittal T1-weighted image shows nonspecific intramedullary expansion of a long segment of the cervical spinal cord (arrows). (B) Post-contrast scan shows intense enhancement of a partially necrotic mass at the C4 level (arrow). The intramedullary expansion of the cord above and below this level was attributed to cord edema.12
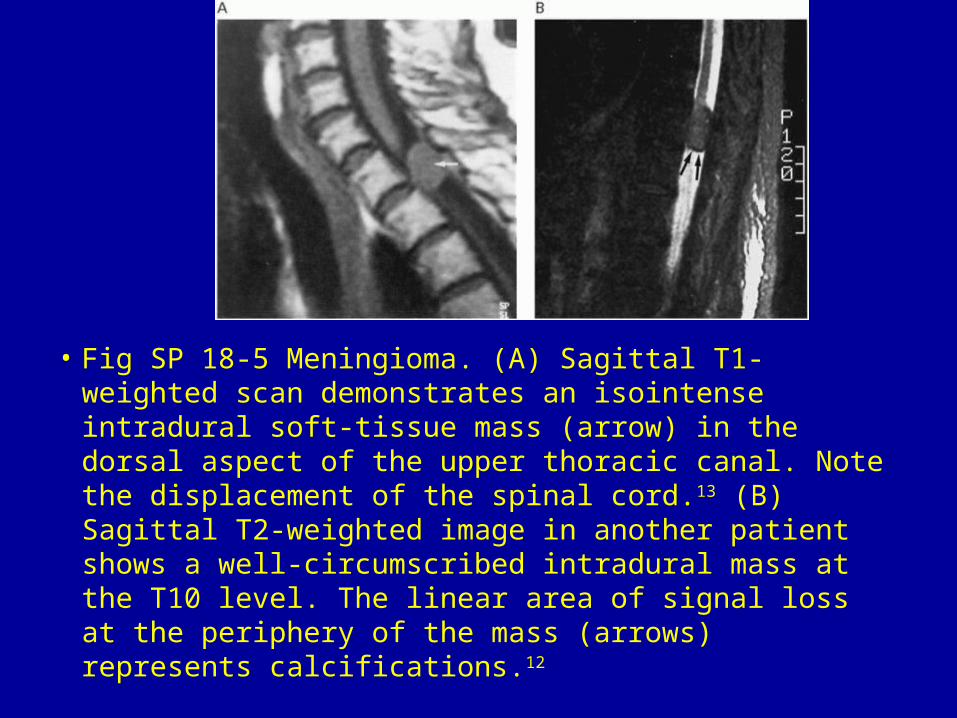
• Fig SP 18-5 Meningioma. (A) Sagittal T1-weighted scan demonstrates an isointense intradural soft-tissue mass (arrow) in the dorsal aspect of the upper thoracic canal. Note the displacement of the spinal cord.13 (B) Sagittal T2-weighted image in another patient shows a well-circumscribed intradural mass at the T10 level. The linear area of signal loss at the periphery of the mass (arrows) represents calcifications.12
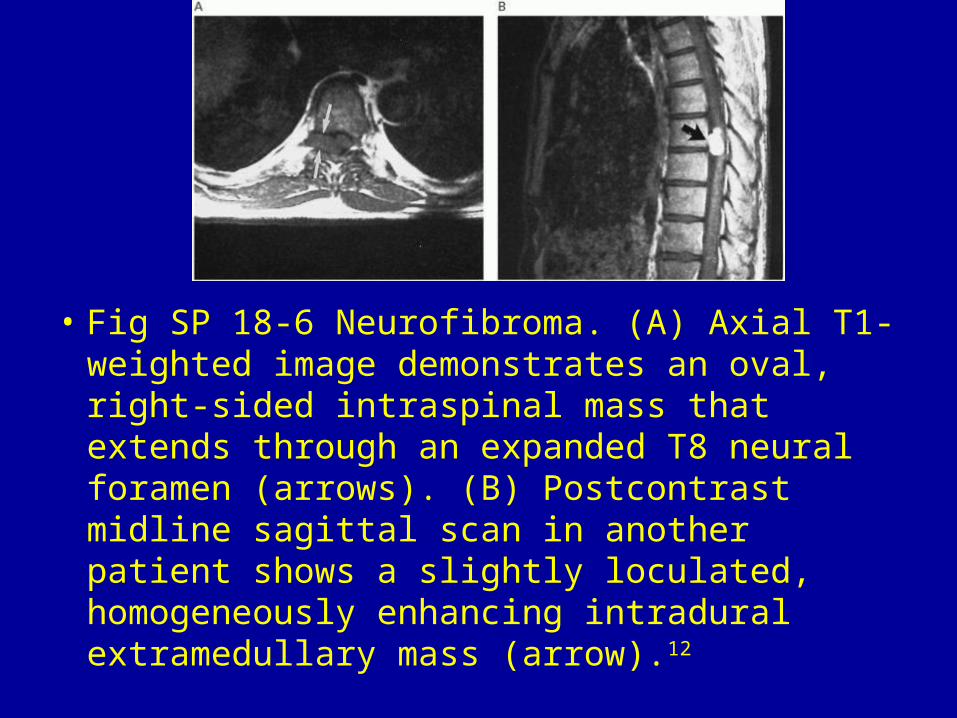
• Fig SP 18-6 Neurofibroma. (A) Axial T1-weighted image demonstrates an oval, right-sided intraspinal mass that extends through an expanded T8 neural foramen (arrows). (B) Postcontrast midline sagittal scan in another patient shows a slightly loculated, homogeneously enhancing intradural extramedullary mass (arrow).12
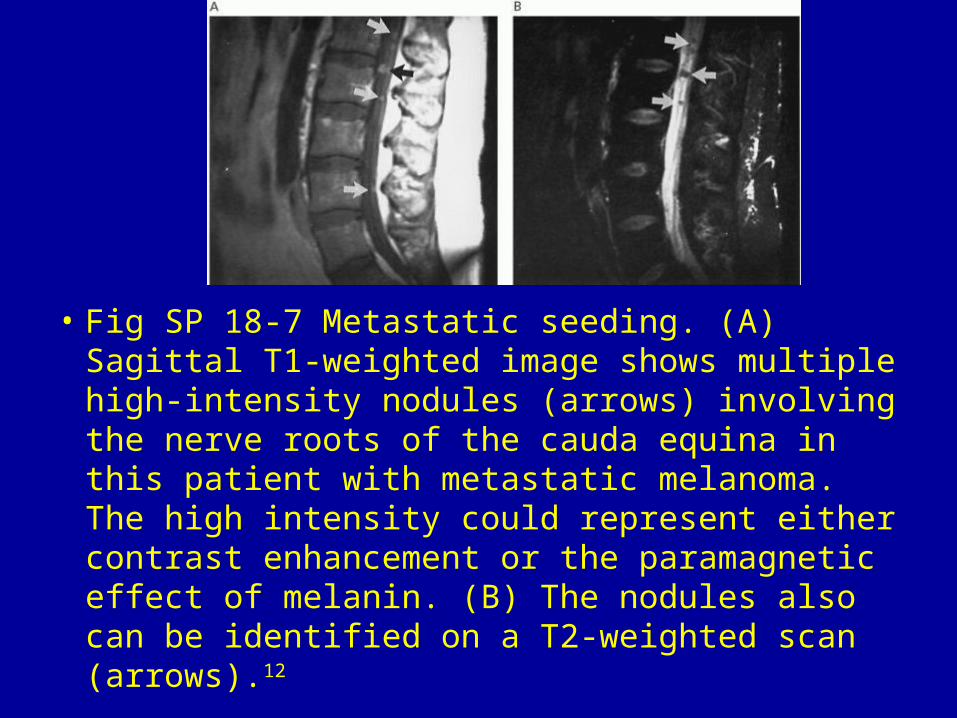
• Fig SP 18-7 Metastatic seeding. (A) Sagittal T1-weighted image shows multiple high-intensity nodules (arrows) involving the nerve roots of the cauda equina in this patient with metastatic melanoma. The high intensity could represent either contrast enhancement or the paramagnetic effect of melanin. (B) The nodules also can be identified on a T2-weighted scan (arrows).12
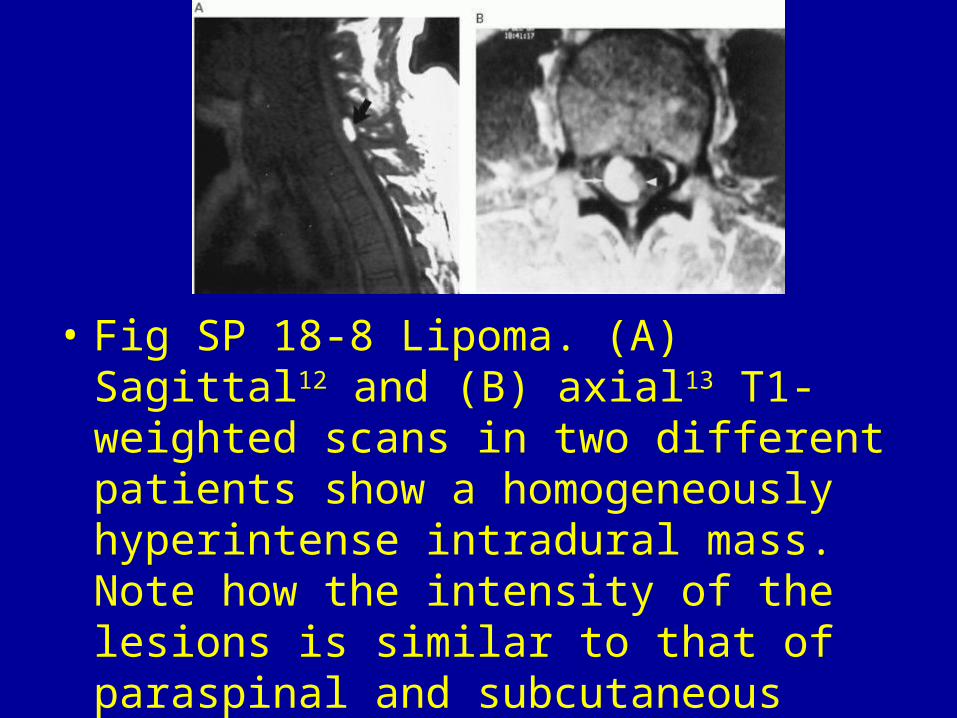
• Fig SP 18-8 Lipoma. (A) Sagittal12 and (B) axial13 T1-weighted scans in two different patients show a homogeneously hyperintense intradural mass. Note how the intensity of the lesions is similar to that of paraspinal and subcutaneous fat.
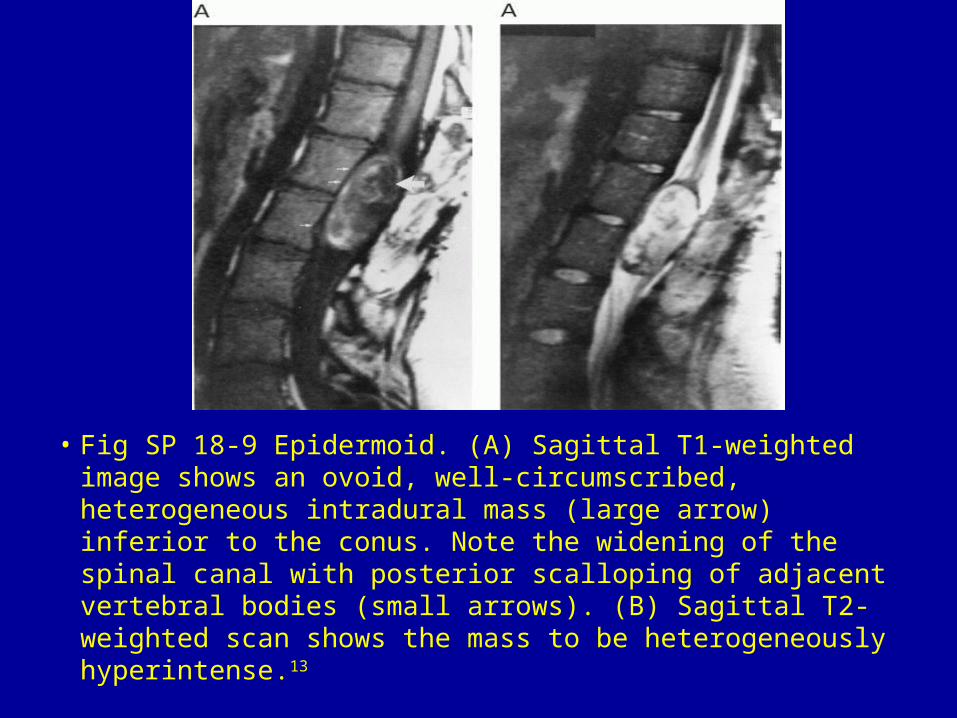
• Fig SP 18-9 Epidermoid. (A) Sagittal T1-weighted image shows an ovoid, well-circumscribed, heterogeneous intradural mass (large arrow) inferior to the conus. Note the widening of the spinal canal with posterior scalloping of adjacent vertebral bodies (small arrows). (B) Sagittal T2-weighted scan shows the mass to be heterogeneously hyperintense.13
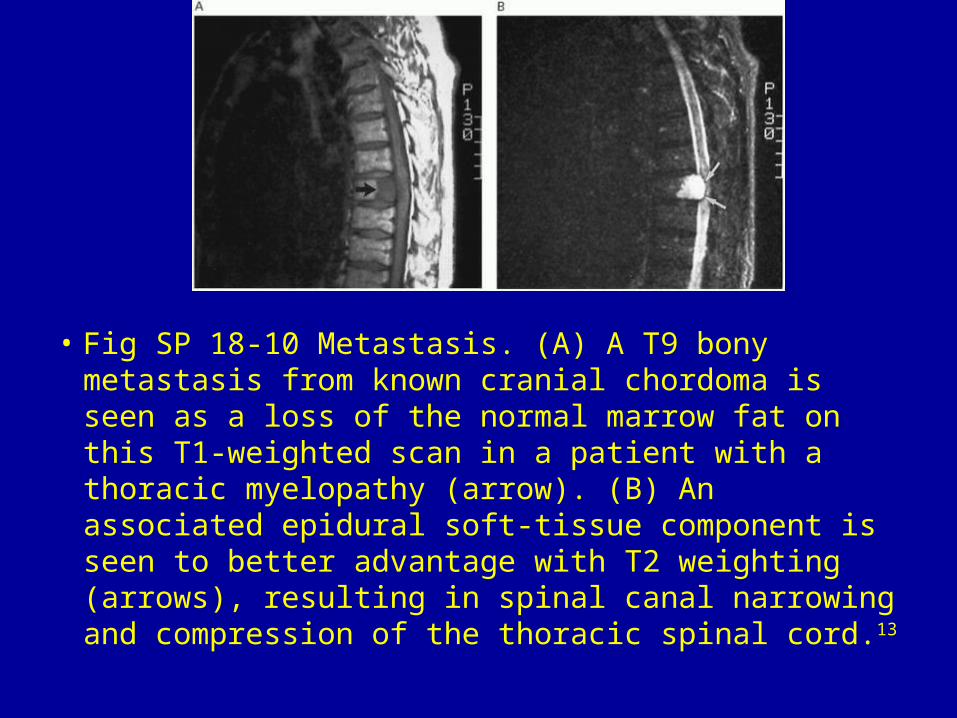
• Fig SP 18-10 Metastasis. (A) A T9 bony metastasis from known cranial chordoma is seen as a loss of the normal marrow fat on this T1-weighted scan in a patient with a thoracic myelopathy (arrow). (B) An associated epidural soft-tissue component is seen to better advantage with T2 weighting (arrows), resulting in spinal canal narrowing and compression of the thoracic spinal cord.13