Embed Size (px)
Citation preview

Determinants for Use of Certified Maize Seed and the Relative Importance of Transaction Costs
By
Bernard, Munyua; Hellin, Jon; Nyikal, Rose and Mburu, John
Contributed Paper presented at the Joint 3rd African Association of Agricultural
Economists (AAAE) and 48th Agricultural Economists Association of South Africa
(AEASA) Conference, Cape Town, South Africa, September 19-23, 2010.

Determinants for Use of Certified Maize Seed and the Relative Importance of Transaction Costs
Munyua. Bernard1, Jon Hellin2, Rose Nyikal3 and John Mburu4
1 Mr. Munyua, Bernard, Socio-Economics Program CIMMYT-Mexico
2 Dr. Jonathan Hellin, Socio-Economics Program CIMMYT-Mexico
3 Dr. Rose Nyikal, Chairman Department of Agricultural Economics University of Nairobi
4 Dr. John Mburu, ILRI-Nairobi
Abstract
The rising world prices for major tradable staples such as maize have been a concern for sub-Saharan countries such as Kenya which are maize deficit countries. Maize is a major staple food for over 80 percent of Kenya’s population. Kenya relies on maize for up to 40 percent of its dietary energy supply and is accordingly searching for ways to increase maize productivity. Maize productivity has been rising in the last decade manly as a result of the use of improved germplasm and fertilizer. However, the proportion of farmers using these technologies is low and the aggregate productivity in maize is low compared to other countries and its potential. Previous studies on input adoption have often assumed the existence of perfect supply and product markets, tending to ignore the important but significant role played by institutions as well as the role of transaction costs associated with market exchange. This study makes use of qualitative information from institutions and actors in seed input value chains as well as quantitative information collected from a sample of 150 farmers, in the Moist Transitional Maize Zones of Kenya. A two stage regression model was applied to analyze determinants of adoption and factors affecting degree of adoption of certified improved maize seed. The results show that as farmers adopt certified seeds, they incur higher transaction costs than non adopters, rural infrastructure, social capital such as membership in groups and trust play an important role in the decision of whether or not to use certified seed.
1. Introduction
Increasing agricultural productivity and hence production using improved agricultural technologies has been identified as a precondition for achieving food security (Langyintuo et al. 2000). As long as farmers continue to use traditional or low yielding crop varieties, agricultural productivity will remain low. Small-scale farmers depending especially on subsistence agriculture have the potential to increase their welfare and food security situation if they adopt improved production technologies. This is especially true for staple food crops such as maize cultivated by the majority of farmers in Kenya.
Maize is the most important staple food for Kenya. The crop supplies 40 to 45 percent and 35 to 40 percent of the calories and proteins respectively, consumed by an average Kenyan (GoK 2003). Maize is produced by over 90 percent of rural households accounting for more than 20 percent of all agricultural production and 25 percent of agricultural employment (MoA 2004) Small scale farmers account for 65 percent of total maize production which mainly goes to subsistence consumption, while large scale farmers contribute the largest share of marketed surplus (MoA 2004). The area under maize has stabilized at around 1.5 million hectares, producing about 26 million bags (23 million metric tonnes) of maize per annum (Ibid.).
Maize per capita consumption in Kenya is estimated at 98 kilograms which translates to approximately 27 to 31 million metric tons (30-34 million 90 kilogram bags) per year, Maize is also important as it accounts for 28 percent of gross farm output (Jayne et al. 2001). The domestic supply for maize has been on average 30 million bags annually. The demand, however,

has been on the increase, and outstrips domestic supply, making the country a net maize importer. With the country’s population projected to reach 43.1 million by 2020 (Jayne et al. 2001), this implies that the country will increasingly be relying on imports to meet the deficits. Figure 1 presents the trends in maize area, production and consumption figures where it can be seen that consumption is rising and area under maize is stagnant.
Whereas maize production has been generally fluctuating averaging 2 percent over the five years between 2001 and 2005, the marginal growth in production is driven more by use of productivity-enhancing technologies, than by increase in acreage (Smale & Jayne 2003, MoA 2004). Among agricultural inputs, seed is recognized to have the greatest ability of increasing on-farm productivity since seed determines the upper limit of crop yields and the productivity of all other agricultural inputs (MoA 2004). This means that to sustain as well as increase production volumes, it will be critical to find mechanisms that guarantee farmers access to high yielding certified seed varieties. Moreover, such a mechanism is paramount for successful variety improvement for sustainable agriculture (Hellin 2007)
The rising food and input prices in the world markets will further increase the import bill which has serious implications for food security and the country’s balance of payments. This underscores the importance of investing in use of high performance certified maize seed as well as increased use of yield-enhancing inputs such as fertilizer in maize production so as to boost the domestic maize output. Due to the dominant role of maize to Kenya’s agriculture and overall food security, the government has been keen to develop the maize subsector in order to contribute to the wider goals of national food and nutrition security policies (Muhammad 2003).
The rest of the paper proceeds as follows. The next section provides a description of the trends in maize seed use in Kenya, followed by description of methodology, the conceptual framework in

section 4. Section 5 discusses the econometric approach and links to economic theory. The empirical results are presented in the sixth section. Section seven discusses the implications to policy and the conclusion.
2. Trends certified maize seed use
The global maize productions trends shows that although 68 percent of the global maize area is in the developing world only 46 percent of the worlds maize production is grown there (Pingali & Pandey 2001). Low average yields in the developing world are responsible for this wide gap between global share of area and share of production. The average maize yield in developed countries is 8 tons per hectare while that of developing countries is below 3 tons per hectare. Disparities in climatic conditions as well as farming technologies account for the 5 tons per hectare yield differential between developed and developing world (ibid).
In spite of the efforts by international non governmental, local public and private institutions towards the research and development of improved crop technologies, many farmers are still not using improved seeds; Table 2 shows the seed type usage by agro regional zones in Kenya. Western transitional, High-potential maize zones and Western highlands lead in proportionate certified seed use. The marginal areas of eastern lowlands and coastal areas reported the lowest adoption rates of certified seed.
Table 2: Maize Seed Type Usage by Agro-Regional Zones in Kenya
Agro Regional Zone Certified seed Indigenous seed/Retained seed - percentage usage in the region-
Central highlands 41 59 High potential maize zones 61 39 Eastern lowlands 9 91 Western lowlands 48 52 Western transitional 85 15 Western highlands 60 40 Coastal lowlands 19 81 Source; M. Ayieko 2005, Tegemeo Household Survey 2004
A study comparing sales volumes for improved seed between 1997 and 2007 for countries in Eastern and Southern African countries indicated that there was a decline in the amount of seed sold. The countries percentage decline included Angola(-7), Zimbabwe(-2) Kenya(-1) while Mozambique, Malawi, Ethiopia, Tanzania, Uganda and Zambia reported increased improved seed sales ranging from 2 – 50 percent (Langyintuo et al. 2008). The unmet need for improved maize seed is met by recycling grain as seed. According to Pixley & Banziger 2001 when farmers recycle grain they are faced by risk of declined yields of between 5 percent for open pollinated varieties (OPV) and 30 percent for hybrids.
The introduction of many new technologies has been met with only partial success, as measured by observed rates of adoption. The benefits from technology development can only be realized if innovation diffusion will be successful and that farmers put to use these technologies on farm. Adesina & Zinnah (1993) observed that various institutional, economic, psychological and social factors are important in determining the adoption of improved crop technologies. They also postulate that farmers are more likely to adopt a given technology if the expected benefits are seen to outweigh those of existing alternatives. It is therefore important to have information on the factors that determine technology adoption by farmers as well as factors that may increase the probability of adoption for these innovations.
Studies on innovation diffusion have sought to investigate the factors that promote or constraint adoption of improved crop technologies including maize in Kenya. Conventional wisdom is that constraints to rapid technology adoption include factors such as lack of credit, limited access to information, risk aversion, small and fragmented land holding, inadequate incentives associated with tenure arrangements, insufficient human capital, absence of equipment that affects timeliness of production, untimely supply of complementary inputs, and inappropriate transportation infrastructure among others (Feder et al. 1985).
In a synthesis of 22 adoption studies in Eastern Africa, availability of information on the technology and profitability of the technology, were identified as the main obstacles to technology adoption (Doss et al. 2003). It was found that farmers did not appear resistant to using improved varieties and fertilizer in the region, however, much of the improved varieties were of recycled hybrids and from earlier varieties especially in Tanzania and Ethiopia (Doss et al. 2003). Due to this phenomenon the review concluded that although farmers gain some benefits from recycled varieties, they do not obtain all the agronomic benefits from improved varieties. Using newly purchased seed would presumably increase output albeit at some additional cost.
Besides the above mentioned weakness, many studies have assumed costless market exchange and zero transaction costs. Transaction Costs Economics School of economics argues that market exchange is not costless as has been assumed in the neoclassical economists. Transaction costs in the market for farm inputs such as certified seeds and productivity increasing inputs such as fertilizers may affect the decisions made by the farmer whereas transaction costs in output markets may influence the supply response as well as demand for inputs. This implies that high transaction costs in input and output markets for maize inputs and grains may constrain participation of smallholder farmers in maize production and marketing activities. There is, therefore, a need to study the relative importance of transaction costs on the use and intensity of certified maize seed adoption.
Methodology
Conceptual framework
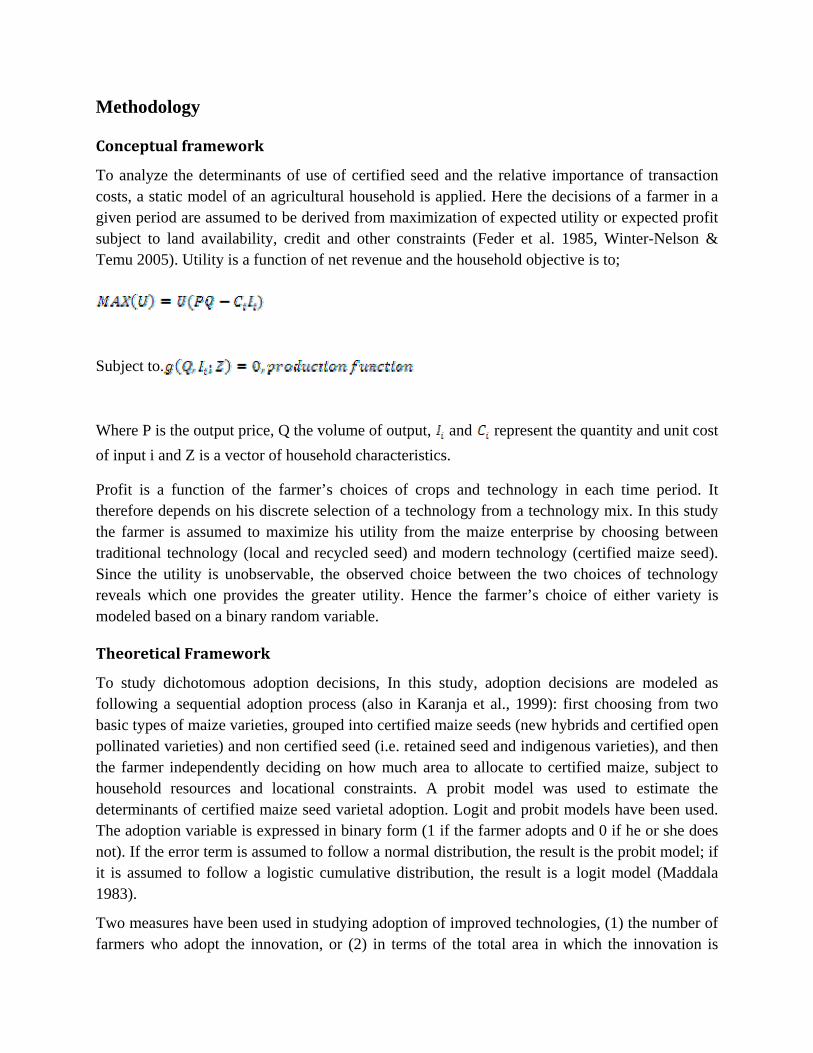
To analyze the determinants of use of certified seed and the relative importance of transaction costs, a static model of an agricultural household is applied. Here the decisions of a farmer in a given period are assumed to be derived from maximization of expected utility or expected profit subject to land availability, credit and other constraints (Feder et al. 1985, Winter-Nelson & Temu 2005). Utility is a function of net revenue and the household objective is to;
Subject to.
Where P is the output price, Q the volume of output, and represent the quantity and unit cost
of input i and Z is a vector of household characteristics.
Profit is a function of the farmer’s choices of crops and technology in each time period. It therefore depends on his discrete selection of a technology from a technology mix. In this study the farmer is assumed to maximize his utility from the maize enterprise by choosing between traditional technology (local and recycled seed) and modern technology (certified maize seed). Since the utility is unobservable, the observed choice between the two choices of technology reveals which one provides the greater utility. Hence the farmer’s choice of either variety is modeled based on a binary random variable.
Theoretical Framework
To study dichotomous adoption decisions, In this study, adoption decisions are modeled as following a sequential adoption process (also in Karanja et al., 1999): first choosing from two basic types of maize varieties, grouped into certified maize seeds (new hybrids and certified open pollinated varieties) and non certified seed (i.e. retained seed and indigenous varieties), and then the farmer independently deciding on how much area to allocate to certified maize, subject to household resources and locational constraints. A probit model was used to estimate the determinants of certified maize seed varietal adoption. Logit and probit models have been used. The adoption variable is expressed in binary form (1 if the farmer adopts and 0 if he or she does not). If the error term is assumed to follow a normal distribution, the result is the probit model; if it is assumed to follow a logistic cumulative distribution, the result is a logit model (Maddala 1983).
Two measures have been used in studying adoption of improved technologies, (1) the number of farmers who adopt the innovation, or (2) in terms of the total area in which the innovation is

adopted. The two measures may yield the similar outcomes but disparities in access to productive resources such as land may yield results where the proportion of farmers adopting may differ significantly from the proportion of the total cultivated area that is affected by the innovation. The proportion of households adopting an innovation measures the number of farmers who have adopted an innovation, whereas the proportion of the area that is under improved technology alludes to the potential aggregate economic benefits attributable to adoption.
Determinants of use of certified maize seed
To estimate the determinants of adoption of certified maize and the relative influence of transaction costs. A two stage Heckman selection model was specified, the first stage of Heckman involves a probit model used to estimate the determinants of certified maize seed adoption. The second stage of the model is a censored regression used to estimate the determinants of intensity of use. Probit models have been used to study use of inputs in developing countries such as improved seed, fertilizers, insecticides (Hattink, 1998, Kaliba et al., 2000) and influence of transaction costs on input use in coffee (Winter-Nelson et al., 2004). These models include the Linear Probability Model, the binary choice model and the binary logit model. The Linear Probability Model is the regression model applied to a binary dependent variable which has the general form as shown in equation 1:
Where xi is a vector of values for the ith observation, is a vector of parameters to be
estimated, is the intercept and is the error term. The dependent variable is a discrete
variable that represents a choice, or category, from a set of mutually exclusive choices or
categories. =1 when there is adoption of certified maize seed, and =0 when there is no
adoption.
The functional form of the Linear Probability Model is linear which means that a unit increase in
results in a constant change of k in the probability of an event, holding all other variables
constant. By making assumptions about the probability density of the residuals, the modeler can choose between several different binomial choice model formulations. Two types of binomial choice models are most common and found in practice: the logit and the probit models. The logit model assumes a logistic distribution of errors, and the probit model assumes a normal distributed errors. These models, however, are not practical for cases when there are more than two choices.
Recall that choice models involve a response with various levels (a set of choices or
classification), and a set of ’s that reflect important attributes of the choice decision or
classification. Usually the choice or classification of is a modeled as a linear function or
combination of the ’s. However since the dependent variable is unobserved, the model cannot
be estimated with OLS. Instead, Maximum likelihood methods are employed to solve for the betas in choice models
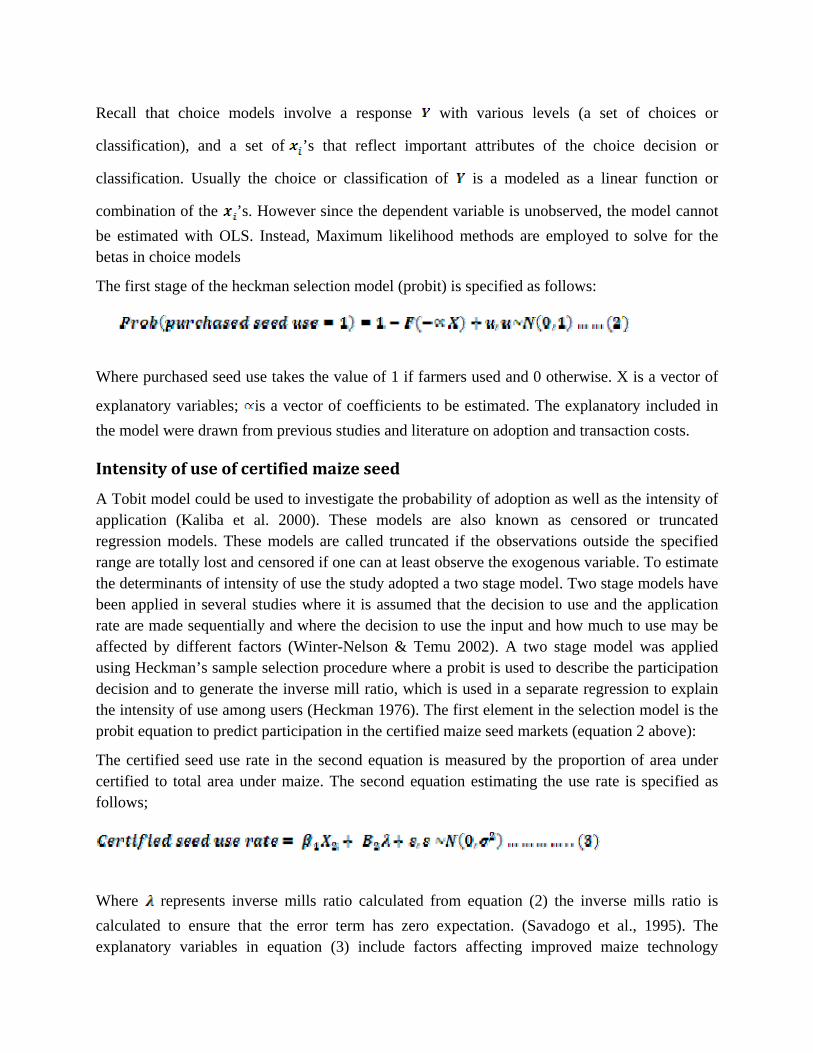
The first stage of the heckman selection model (probit) is specified as follows:
Where purchased seed use takes the value of 1 if farmers used and 0 otherwise. X is a vector of
explanatory variables; is a vector of coefficients to be estimated. The explanatory included in
the model were drawn from previous studies and literature on adoption and transaction costs.
Intensity of use of certified maize seed
A Tobit model could be used to investigate the probability of adoption as well as the intensity of application (Kaliba et al. 2000). These models are also known as censored or truncated regression models. These models are called truncated if the observations outside the specified range are totally lost and censored if one can at least observe the exogenous variable. To estimate the determinants of intensity of use the study adopted a two stage model. Two stage models have been applied in several studies where it is assumed that the decision to use and the application rate are made sequentially and where the decision to use the input and how much to use may be affected by different factors (Winter-Nelson & Temu 2002). A two stage model was applied using Heckman’s sample selection procedure where a probit is used to describe the participation decision and to generate the inverse mill ratio, which is used in a separate regression to explain the intensity of use among users (Heckman 1976). The first element in the selection model is the probit equation to predict participation in the certified maize seed markets (equation 2 above):
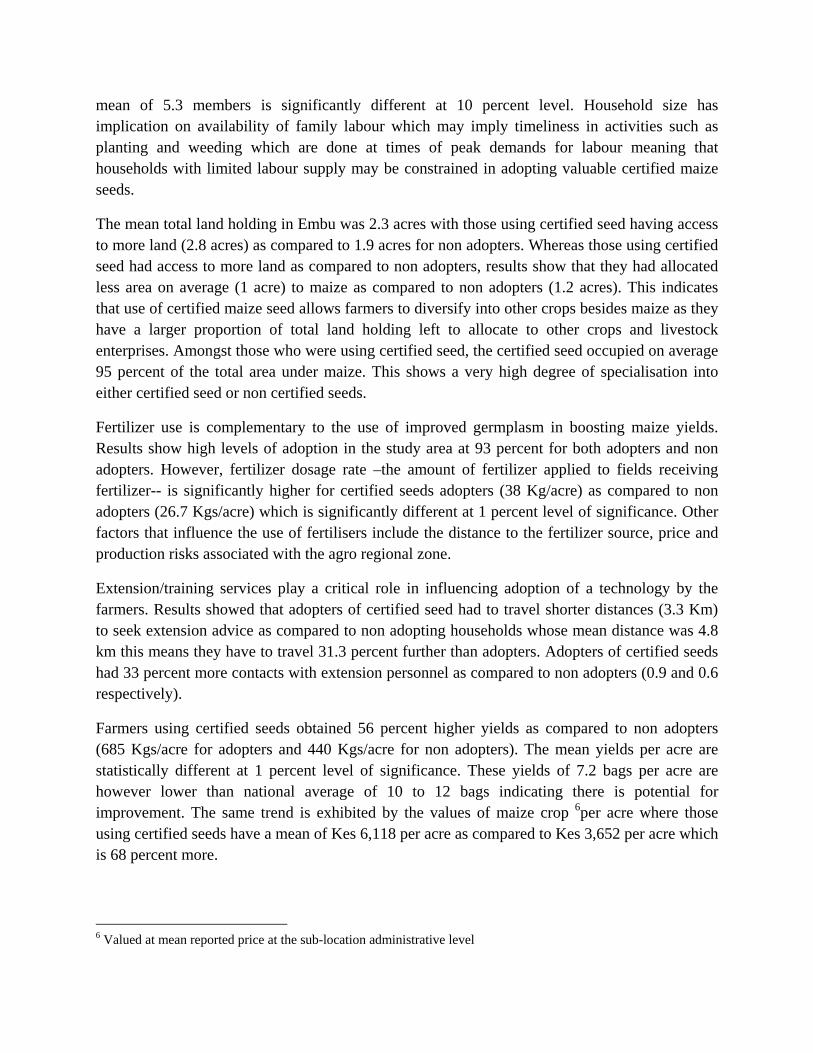
The certified seed use rate in the second equation is measured by the proportion of area under certified to total area under maize. The second equation estimating the use rate is specified as follows;
Where represents inverse mills ratio calculated from equation (2) the inverse mills ratio is
calculated to ensure that the error term has zero expectation. (Savadogo et al., 1995). The explanatory variables in equation (3) include factors affecting improved maize technology

adoption, measures of output price, transaction costs5, factors mitigating transaction costs and environmental factors affecting input responsiveness and farm and farmer characteristics influencing certified seed use.
This study made use of primary cross-sectional farm household data on farmer characteristics, maize farming practices as well as environmental and institutional characteristics relating to the households. These data covered the main maize crop season for 2007/08 cropping year. To evaluate the institutional context that influenced the functioning of maize seed markets, this study used both quantitative information as well qualitative data.
Data
This study made use of primary cross-sectional farm household data as well as qualitative information collected from the actors along the sed value chain. Data on farmer characteristics, maize farming practices as well as environmental and institutional characteristics relating to the households was collected from 150 households in Embu district. These data covered the main maize crop season for 2007/08 cropping year. To evaluate the institutional context that influenced the functioning of maize seed markets, this study used both quantitative information as well qualitative data. To gain from synergies between the qualitative and quantitative data processes, the study commenced with qualitative interviews with various stakeholders so as to gain familiarity with issues under study as well as to identify the issues that needed further quantitative data.
A multistage population-proportionate random sampling procedure was applied to select 150 farmers. The selection process comprised of the following steps: First the study area was alienated into three clusters of administrative units namely Gaturi south, Makingi and Kithimu locations. Census data from 1999 were used to arrive at the population of households for all non-urban sub-locations in Nembure division. The sampling frame was obtained from the Kenya National Bureau of Statistics (KNBS) pre-census household lists for Nembure division collated in December 2007. Two locations (Gaturi south and Kithimu) were chosen since they fall within the target Agro-Ecological Zone (AEZ). Makengi location falls on upper mid altitude zone more suitable for tea and coffee and therefore it was left out. The two selected locations had three sub-locations each as can be seen from the Table 2. All sub-locations lay in MT zone except Kithegi that was in a lower altitude and thus was left out of the selection.
Results
The following section presents the findings that emerged from the study. The section starts with a description of the structure of seed input chain and descriptive statistics of the socio-economic
5 computed using opportunity cost of time of searching for seed using average wage rate.

characteristics of the surveyed households. The regression estimation results of the factors that affect the use of certified maize seeds and the degree of adoption from the two stage Heckman selection model are then presented followed by a discussion on the results.
Summary Statistics on important Socioeconomic Characteristics
The following section presents a quantitative analysis result from the study from the main season for the cropping year 2007/08 for the surveyed households. These households were predominantly small-scale with 82 percent cultivating maize on an area less than 1.5 acres. The results show that more than half of the farmers (55.3%) used recycled and local varieties whereas the remaining 44.7% used certified maize seed.
Table 4: Descriptive Statistics for Explanatory Variables Used the Model
Variable N Minimum Maximum Mean Std.
Deviation Median
Total transanction costs 150 0.0 812.5 112.7 144.8 58.2Experience with certified seed (years) 150 0.0 58.0 12.6 12.8 7.5Experience with adulterated seed(0,1) 150 0.0 1.0 0.3 0.5 0.0Distance to motor‐able road (Kms) 150 0.0 2.0 0.4 0.4 0.3Distance in kms from hh to nearest seller of hybrid maize seed 150 0.1 21.0 1.4 1.8 1.0Distance to seed source 150 0.0 17.0 1.8 3.7 0.2Access to credit (0,1) 150 0.0 1.0 0.2 0.4 0.0Distance to extension service 149 0.2 13.0 4.1 3.3 3.0Membership in farmer group (0,1) 150 0.0 1.0 0.5 0.5 0.0Household size 150 1.0 12.0 5.0 2.2 5.0
Age of the head (Years) 150 20.0 188.0 53.4 19.5 51.0Gender of head(1=male 0=female) 150 0.0 1.0 0.7 0.4 1.0years of schooling for the head 150 0.0 23.0 6.4 4.9 7.0Yield per acre (kg/acre) 150 34 2406 550 437 405Value of harvest per acre (Ksh) 150 178.1 27624.4 4753.2 4523.3 3356.5
Degree of commercialization 150 0.0 1.0 0.2 0.3 0.0Total land holding (acres) 150 0.0 32.0 2.3 3.3 1.5Off‐farm income(0,1) 150 0.0 1.0 0.9 0.3 1.0Household Asset Wealth(Ksh) 150 10500.0 1809700.0 179475.1 229208.8 96150.0acreage under crops 150 0.1 11.0 0.8 1.0 0.5Mean fertilizer per acre(Kgs) 147 0.0 114.3 31.7 24.0 27.5Maize deficit household (1=Yes 0=No) 150 0.0 1.0 0.4 0.5 0.0Certified seed(0,1) 150 0.0 1.0 0.4 0.5 0.0Proportion of maize acres under certified seed 150 0.0 1.0 0.4 0.5 0.0
Dependent variable in the first stage of Heckman selection model

Source, survey results 2010
The average age of the household head was high at 53.4 years (table 4) reflecting out migration of young people. Experience with use of improved varieties showed that farmers had on average 12.5 years since they first used certified seed. This shows that farmers have been exposed to improved varieties for a long time. Fertilizer adoption was high in the area with 93 percent of the households used in-organic fertilizer on maize (Table 5). The mean application rate per acre was 31.7 kilograms per acre (Table 4). The mean yield per acre is 550 kgs which translates to 6.1 bags per acre. This yield is nonetheless lower as compared to the average yields obtained in high potential areas of 10 bags per acre. This indicates that there exists the potential to improve aggregate yields if a greater number of farmers adopt improved maize seed and fertilizer technologies or more area is allocated to improved technologies.
The mean asset wealth for the surveyed households was 179,475 Kshs. However, it was skewed to the right showing a high level of in equality when compared to the median income 96,150 Kshs which is about half the mean asset value. Most of the households had at least one member engaged in off-farm income activities this indicates that there exists opportunities for households to get additional income opportunities in the area.
The mean years of schooling in the area is 6.4 years which is primary level this is a good indicator of human capital. This is a high literacy level indicating that the farmers have the capacity to grasp information on improved maize technologies. Up to 70 percent of the house holds are male headed, Concerning quality of seed 30 percent of the respondents reported ever having had an encounter with bad or adulterated seed. It was can also be seen that the mean actual distance travelled to obtain seed (1.8 Km) is higher than the mean distance to the nearest stockiest (1.4 Km). This shows farmers are willing to travel further to obtain seed from reputable stockiest who are located in major centers as opposed to the seed stockist nearest to the farmer.
Infrastructure plays an important role in access to input and grain markets and the flow of information on new technologies. The mean distance to an extension service is 4.1 Kms there is also a wide variation in this indicator as it ranges from 0.2 to 13 Kms. This is an important indicator of access to extension. The current policy of demand-driven extension is such that for the farmer to travel to see the extension officer to get service as opposed to earlier approaches where the extension officers visited farmers on their farms. 50 percent of the farmers were involved in groups indication of increased social capital which increased information sharing and potential for collective action.
Table 5 below presents the results disaggregated by use (0,1) of certified seed for the sampled households. The statistics are for adopters (farmers growing certified seeds), non adopters (farmers using recycled and indigenous maize seed varieties) the overall means and significance level for a test for differences in the means.
Table 5: Disaggregated Descriptive Statistics by Certified Seed Usage

Means
Characteristic Non
adopters Adopters Total significance
Household Characteristics Age of the household head 55.9 50.3 53.4 *Years of schooling for the head 5.0 8.2 6.4 ***Total value of assets 138160.5 230656.0 179,475.10 ***
Number of hh members 4.7 5.33 5 * Value of crop per acre 3652.6 6116.7 4753 ***
Technology Adoption on Maize Proportion area under certified maize
seed(%) 0 0.95 0.4 ***Fertilizer adoption(%) 97 90 93 Fertilizer dosage(intensity‐Kg/acre) 26.72 38.03 31.7 ***Yield per acre 440.36 685.07 550 ***
Experience with adulterated seed 0.27 0.4 0.3 * Acess to credit for seed 0.17 0.27 0.2
Farming Practices Total household land holding(Acre) 1.91 2.79 2.3 Total cultivated maize acreage 1.2 1 0.8 Distance extension advice(Kms) 4.82 3.33 4.1 ***Total number extension contacts in the last
year 0.6 0.9 0.8 Degree of commercialization 0.19 0.30 0.2 **
Gender of household member (1‐ male) 0.64 0.87 0.7 ***
Transaction Costs(KES) Total transaction costs 86.8 144.8 112.7 ***
Infrastructural Characteristics(Kms) Distance to point of seed purchase 0.69 3.20 1.5 ***Distance to the nearest certified seed seller 1.38 1.36 1.4 Distance to where the household bought
fertilizer 2.3 2.6 2.5
Distance to nearest fertilizer seller 1.3 1.2 1.2 Distance to produce market 1.7 1.6 1.6 Distance to motor‐able road 0.49 0.30 0.4 ***
Distance in to tarmac road 3.8 2.1 3.1 ***
*Significance level *** 1 percent , ** 5 percent , * 10 percent
The mean age of the household head was 53.4 years overall, however those using certified seed were on average younger at 50.3 years as compared to 55.9 years for non adopters. The mean ages are statistically different at 10 percent level of significance. This indicates that as the household head becomes older they are less likely to be using certified seeds. Adopters of certified seed had on average more years of schooling as compared to non adopters (8 years and 5 years respectively), this indicates that education is important in the diffusion of agricultural technologies underscoring why it is important to package information on new technologies in an easy and comprehensible way for farmers whose average level of education about 6 years of schooling (primary level). Adopting households had on average larger household sizes whose
mean of 5.3 members is significantly different at 10 percent level. Household size has implication on availability of family labour which may imply timeliness in activities such as planting and weeding which are done at times of peak demands for labour meaning that households with limited labour supply may be constrained in adopting valuable certified maize seeds.
The mean total land holding in Embu was 2.3 acres with those using certified seed having access to more land (2.8 acres) as compared to 1.9 acres for non adopters. Whereas those using certified seed had access to more land as compared to non adopters, results show that they had allocated less area on average (1 acre) to maize as compared to non adopters (1.2 acres). This indicates that use of certified maize seed allows farmers to diversify into other crops besides maize as they have a larger proportion of total land holding left to allocate to other crops and livestock enterprises. Amongst those who were using certified seed, the certified seed occupied on average 95 percent of the total area under maize. This shows a very high degree of specialisation into either certified seed or non certified seeds.
Fertilizer use is complementary to the use of improved germplasm in boosting maize yields. Results show high levels of adoption in the study area at 93 percent for both adopters and non adopters. However, fertilizer dosage rate –the amount of fertilizer applied to fields receiving fertilizer-- is significantly higher for certified seeds adopters (38 Kg/acre) as compared to non adopters (26.7 Kgs/acre) which is significantly different at 1 percent level of significance. Other factors that influence the use of fertilisers include the distance to the fertilizer source, price and production risks associated with the agro regional zone.
Extension/training services play a critical role in influencing adoption of a technology by the farmers. Results showed that adopters of certified seed had to travel shorter distances (3.3 Km) to seek extension advice as compared to non adopting households whose mean distance was 4.8 km this means they have to travel 31.3 percent further than adopters. Adopters of certified seeds had 33 percent more contacts with extension personnel as compared to non adopters (0.9 and 0.6 respectively).
Farmers using certified seeds obtained 56 percent higher yields as compared to non adopters (685 Kgs/acre for adopters and 440 Kgs/acre for non adopters). The mean yields per acre are statistically different at 1 percent level of significance. These yields of 7.2 bags per acre are however lower than national average of 10 to 12 bags indicating there is potential for improvement. The same trend is exhibited by the values of maize crop 6per acre where those using certified seeds have a mean of Kes 6,118 per acre as compared to Kes 3,652 per acre which is 68 percent more.
6 Valued at mean reported price at the sub-location administrative level

Adopting farmers had a higher aggregate value of assets as compared to non adopters (significantly different at 5 percent level). They sold about on average 30 percent of the maize crop harvest as compared to 20 percent sold by non adopters. This indicates that improved seed technology can be used as an avenue for growing rural incomes as well as contribute to goals of rural poverty alleviation.
Infrastructure plays an important role in the rural agriculture and affects agricultural production. Good roads ensure easy access to input and produce markets. The distance to the point of purchase was further for adopters as compared to non-adopters. Results showed an interesting phenomenon where adopters were buying certified maize seeds and fertilizer from distant sources as opposed to buying from agro-dealers closest to them (table 4). Other infrastructure indicators such as distance to produce markets, distance to a motorable road and distance to tarmac road were all in favour of adopters of certified seeds as compared to non-adopters who had to travel longer distances to access these infrastructure. Infrastructure has a bearing on the resulting transaction costs of adopting certified seeds and complementary inputs since as the distance to the services increases, there is a higher incidence of transaction costs which may constrain adoption of new technologies.
An analysis on the transaction costs shows that farmers who used certified seed incurred more transaction costs ( i.e. costs incurred in searching for information on seed, searching for seed and those incurred in acquiring more information on management practices for maize crop). This can be explained by the fact that as opposed to those farmers using local seed and recycled hybrids, adoption farmers have to travel longer distances and therefore more time. A pair wise test of differences in the means for the two groups showed that means were statistically different at 1 percent level of significance.
Estimation results for Factors Influencing the Probability of use of Certified Seeds
This section presents the estimation results from the first stage of Heckman selection model (probit). The dependent variable is whether the household has adopted certified maize seed represented by 1 and 0 otherwise. The Marginal effects reported in percentage form represent the change in probability of adoption with regards to a unit change in the independent continuous (exogenous) variables (dF/dx). In case of dummies (i.e. 0 and 1) the marginal effects is the difference in probability because of belonging to a group rather than the other (difference between the benchmark compared to the other variable).
The results in Table 6 indicate that the following factors significantly affect the adoption of certified maize seeds in Moist Transitional Zones. They include; experience in years with certified seeds, previous experience with adulterated seeds, distance to motorable road, distance to the source of seed, distance to extension service, age of the household head, household size value of harvest per acre, degree of commercialization, household asset wealth and transaction costs of getting additional information on seeds. Overall regression is significant at 1 percent and the goodness of fit measured by adjusted R squared was 0.5758 indicating that the variations in

the independent variable explain 58 percent of the farmer’s choice to adopt or not to adopt certified maize seeds.
Table 6: Determinants of Certified Maize Seed Use
Coef. Std. error P>z
Marginal effects dF/dx
(%)
Total transanction costs* 0.00 0.00 0.082 0.06%
Experience with certified seed (years)*** 0.08 0.02 0 3.22%
Experience with adulterated seed(0,1) ‐0.32 0.34 0.349 ‐12.76%
Distance to motor‐able road (Kms)*** ‐1.42 0.49 0.004 ‐56.44%
Distance to seed source*** 0.66 0.16 0 26.46%
Access to credit (1=Yes 0=No) 0.46 0.38 0.224 18.09%
Maize net deficit household (0,1) 0.44 0.34 0.202 17.21%
Distance to extension service** ‐0.12 0.06 0.042 ‐4.66%
Membership in farmer group (0,1)* 0.20 0.34 0.568 7.83%
Age of the head (Years)*** ‐0.07 0.02 0 ‐2.86%
Gender of head(1=male 0=female)* ‐0.86 0.48 0.076 ‐32.36%
Years of schooling 0.03 0.05 0.483 1.28%
Household size*** 0.21 0.08 0.01 8.50%
Off‐farm income (0,1) 0.66 0.60 0.273 25.26%
Value of harvest per acre (Ksh)*** 0.00 0.00 0 0.01%
Degree of commercialization*** 1.37 0.55 0.013 54.64%
Total land holding (acres)** 0.16 0.07 0.029 6.20%
Asset quintile2 ‐0.73 0.52 0.158 ‐28.13%
Asset quintile3* ‐0.82 0.51 0.107 ‐30.97%
Asset quintile4*** 1.54 0.56 0.006 50.42%
Asset quintile5 0.42 0.51 0.405 16.59%
Constant ‐0.26 1.00 0.793
*Significance level *** 1 % , ** 5 % , * 10 %
Log pseudolikelihood = ‐43.489
Pseudo R2 = 0.5758
Prob > chi2 = 0.0000
Source survey results
As expected there is a positive and significant relationship between years of experience from using certified seed and adoption of certified seed. A unit increase in years of experience will result in a 3.2 percent increase in the probability of adoption of certified seed this relationship was significant at 1 percent level of significance.
There is a negative and significant relationship between adoption and the age of the household head. A unit increase in the age results in a 3 percent less likelihood in adoption of certified
maize seed. It is therefore important to look into those challenges faced by households that are headed by older farmers. These challenges may include complexity in new agricultural technologies, risk aversion and cultural beliefs associated with new technology, addressing such issues will lead to greater technology diffusion.
Infrastructure plays a complementary role in enhancing technology diffusion through improved access to input and output markets. From the survey an increase in distance to a motorable7 road by a kilometer diminishes the probability of adoption by 56 percent. This relationship is, statistically significant at 1 percent level (Table 6). The distance to extension service was found to be negatively related to adoption and statistically significant at 5 percent level of significance. An increase by a kilometer to extension services diminishes the probability of adoption by 4 percent. As opposed to expectation, distance to source of seed showed a positive and significant relationship to adoption of certified seed.
Information was collected on three levels of transaction costs i.e. Transaction costs (TCs) of initial information search, TCs of searching for seeds and TCs related to searching for additional information on the management of seed. These categories of costs were summed up to arrive at the total transaction costs. Results show a positive relationship but it not significant at 5 percent level. It is estimated that a unit increase in the transaction costs for more information will result in an increased probability of adoption of certified by 0.06 percent.
Other household characteristics that positively and significantly affected adoption of certified seed according to this study were; the degree of commercialization measured by the ratio of maize sale volume to harvests, value of harvests per acre which was representative of yields A unit increase in each of the above factors raised the probability of adoption of certified seed by 55 percent, 0.01 percent respectively.
Household asset wealth is positively related to use of certified maize seed. The bottom three wealth quintiles exhibit a negative relationship to the probability of using certified seeds. Its only the top two wealth quintiles that are positively related with use of certified seed. The fourth wealth quintile is positive and significant at 5 percent level. The highest quintile is positive but not significant.
Other variables that positively influence adoption but were statistically not statistically significant included access to credit, years of schooling, household size and whether a household had members involved in off-farm income. On the other hand female household headship diminished the probability adopting certified maize seed (table 6).
Determinants of Intensity of Use for Certified Maize Seed
7 A motorable road referred to an all weather road usable all year

Table 7 presents the specification results of the use intensity model. The dependent variable in this regression is the proportion of maize area under certified maize seed. Because input fixed costs should not influence the degree of seed use, distance to seed source was excluded from the model as there is no variable cost component involved. Total transaction costs are also excluded as they are considered to be fixed costs as they do not vary with increase in intensity.
Table 7: Determinants of Intensity of Use of Certified Maize Seed
pcertmn Coef. Std. P>z
Experience with certified seed (years)*** 0.044 0.013 0.001
Distance to motor‐able road (Kms)*** ‐0.909 0.334 0.007
Access to Credit (0,1) 0.055 0.311 0.860
Mean fertilizer per acre(Kgs) 0.007 0.006 0.297
Membership in farmer group (0,1)** 0.374 0.273 0.171
Maize deficit household (1=Yes 0=No) 0.445 0.294 0.130
Household size** 0.130 0.066 0.049
Age of the head (Years)*** ‐0.037 0.011 0.001
Gender of head(1=male 0=female) 0.199 0.339 0.557
Off‐farm income (0,1) 0.116 0.433 0.789
Years of schooling 0.011 0.035 0.754
Value of harvest per acre (Ksh) 0.000 0.000 0.194
Degree of commercialization** 1.134 0.480 0.018
Total land holding (acres) 0.049 0.079 0.530
Household Asset Wealth(Ksh)** 0.201 0.099 0.042
Constant ‐1.060 0.775
*Significant Level *** 1 % , ** 5 % , * 10 %
Mills lambda 0.553788 0.259529 0.033
Rho 1
Sigma 0.553788
Lambda 0.553788 0.259529
Uncensored observations= 69
Source: survey
Like in the probit model the statistically significant estimated coefficient affecting the use intensity included, degree of commercialization, membership in farmer groups, experience with certified seed, household asset wealth, age of the head and distance to motorable road. In addition household size and transaction costs incurred in searching for seed were found to be significant.
Infrastructure measured in the distance to motorable road has highly significant influence on the proportion of maize area allocated to certified maize seed. a unit in distance reduces the proportion of land under certified maize by 94 percent. Age of the head is also highly significant and as the household head ages by a year the proportion of area under certified maize is likely to fall by 4 percent.
Factors that positively influence proportion of land under certified maize include degree of commercialization significant at 5 percent, membership in farmer groups increase the proportion
under certified maize by 56 percent (Chart 2). An additional member in the household will likely increase the proportion under certified maize by 13 percent while experience an additional year using certified seed increases the intensity of using certified maize by 5 percent.
Transaction costs positively influence the intensity of certified seed use, although none of The more fertilizer the farmers were applying the more area they were likely to allocate to certified seed, this show complementarities between improved seed technology and yield increasing inputs such as fertilizers. Male headed households, total land holding and off-farm income are positively related to intensity of use of certified seed although they were not statistically significant. Unlike expectation access to credit and years of schooling were negatively but insignificantly related to intensity of use.
The coefficients for statistically significant variables are presented on Chart 2. The coefficients represent the estimated elasticity of certified seed use-intensity with respect to a unit change in the independent variables. Degree of commercialisation, membership in groups, household size and experience with certified seed positively influence the certified seed use intensity by the greatest magnitude while age of the head and distance to motorable road constraint the intensity of use by the highest magnitude.
Discussion
The following section presents a discussion of the results from arising from the study. The selection of the seed agents and distributor at the district level was a major point of concern. Those not in a particular chain cited that the process was not transparent especially the KSC whose varieties are most desired. There were only two distributors in Embu selected from a possible 5 disributors who had the capacity to act as distributors. This created uncompetitive market structure which in turn lengthened the seed value chain. The distributors out of KSC had to procure seed from those with KSC franchise this horizontal transaction for actors at the same level is otherwise unnecessary had the selection of distributors for these major varieties been open to all those who had the requisite capacity for a distributor/seed agent. The horizontal link potentially introduces more transaction costs, reduces competition, as well as profit margin for the distributor and above all leading to concentration of market power
Trust relationships played an important role in the seed procurement transactions. This was seen in farmers behavior opted to purchase seed from particular agro-dealers with whom they had an established trust relationships. Farmers also trusted agrodealers in major trading centers. Agrodealers also acted as a source of information on new varieties and the varieties suitable for the area to the farmers as they came to procure seed.
The pan-territorial policy of pricing seed in Kenya was a major concern for agro-dealers especially those who were further away from major trading centers. These stockists incurred higher costs in sourcing and transporting the seeds which diminished the market margins against recommended retail prices. Raising prices above advertised prices would cause mistrust by farmers whilst the recommended prices did not offer enough incentive to stock the seeds. This made the agro dealers in the periphery keep minimal stocks.
Lack of a policy for remaining stocks at the end of a planting season was a major concern for agro dealers. As it relates to seed viability, losses incurred from money sunk in unsold stocks and

appropriate stocking levels. Therefore the agrodealers were compelled to stock only seed volumes that they were sure to sell by the end of the season. This increased the probability of running out of certified seeds stocks if demand increases or loss of viability for the remaining seed when demand is low.
As observed earlier that farmers are more likely to adopt a technology if it can be demonstrated that the expected benefits outweigh the costs and superior to the existing methods (Adesina & Zinnah 1993). Farmers using certified seeds obtained 56 percent higher yields as compared to non adopters (685 Kgs/acre for adopters and 440 Kgs/acre for non adopters). The mean yields per acre are statistically different at 1 percent level of significance. These yields of 7.2 bags per acre are however lower than national studies such as Kibaara, 2005 where average national yield was 10 to 12 bags indicating there is potential for improvement. The same trend is exhibited by the values of maize crop 8per acre where those using certified seeds have a mean of Kes 6,118 per acre as compared to Kes 3,652 per acre which was 68 percent more. The higher value may be as a result of maize buyers’ preference for grains from certified varieties whose properties such as weight kernel size taste and colour was found to be more preferable that from other seeds thus fetching better prices in the market.
Fertilizer use is complementary to the use of improved germplasm in boosting maize yields. Results show high levels of adoption in the study area at 93 percent for both adopters and non adopters. However, fertilizer dosage rate –the amount of fertilizer applied to fields receiving fertilizer—was significantly higher for certified seeds adopters (38 Kg/acre) as compared to non adopters (26.7 Kgs/acre) which is significantly different at 1 percent level of significance. This application rate is nonetheless lower that what has been found in other studies in Kenya. Jayne (2008) found fertilizer application at 59.4 kg/acre for intercropped maize. Other factors that influence the use of fertilisers include the distance to the fertilizer source, price and production risks associated with the agro regional zone.
Studies show that social capital and collective action is higher in groups. Membership in farmer groups increases the chances for increased interaction among farmers thus facilitating the flow of information and learning for farmers. Household members belonging to groups have a high chance of adopting certified seeds compared to non-group members. A household that belongs to a group was 15 percent more likely to adopt certified seed as compared to the households that were not in groups. From the qualitative survey it was noted that extension agents and development practitioners cited that it was easier to reach farmers that are already organized in groups to disseminate information on technology, provide and demonstrate the technology and also offer extension services. In groups farmers have the potential to reduce transaction costs in accessing information and collective input purchases. However studies in Meso-America indicate that there may be little incentive for producers of commodities such maize to organize groups. This is because access to output markets is characterized by low transaction costs that may be outweighed by the transaction costs of organizing (Hellin et al., 2009). This underscores the observation by Williamson (2007) that if transaction costs are negligible the organization of economic activity is irrelevant, since the advantages that any mode of contracting appears to hold over another will be eliminated by costless contracting.
8 Valued at mean reported price at the sub-location administrative level

As opposed to expectation, distance to source of seed showed a positive and significant relationship to adoption of certified seed, this could be explained by the fact that mostly only the adopters of certified seed had to travel to buy seed as other seed varieties are from retained seed or bought from neighbors and nearby markets. However, this outcome may also be indicative of trust that farmers exhibit towards more established stockists who are found in larger trading centers, therefore farmers result to travelling longer distances for certified seed. This phenomenon came up from qualitative survey as well as from descriptive statistics on the distance to where the farmer bought seed as compared to the distance to the nearest seed seller. It was seen that the mean distance to actual source of certified seed was more than the mean distance to the nearest certified seed seller (table 6), this indicates that farmers do not necessarily buy from the nearest agro-dealer.
The relation ship between wealth and certified seed use raises the important question of the use of subsidies as a way of promoting technology adoption. It has been shown that poverty reduces the probability of adopting improved technologies, results have also shown that it is only at higher wealth levels (quintile 4 and 5) that the relationship was positive indicating that up to 60 percent of farmers require support to enable them take advantage of available technologies. Whereas this is presents an argument for input subsidies it can also be seen that untargeted subsidies to everyone will just displace the quantities that the wealthier two top quintiles would have otherwise bought. For this reason it can thus be concluded where subsidies are to be considered they should be targeted to the poor thus avoiding leakage to the non poor households (De Groote et al. 2008).
The positive and significant relationship between degree of commercialization and adoption of improved technology shows that, if product markets give favorable price signals, farmers will sell more thereby increase the likelihood of adopting improved production technologies. The higher the value of produce per acre a farmer gets the greater the likelihood of adopting improved maize it is therefore important to ensure that realized yields from certified maize seed at farm level be superior to other seed varieties otherwise if not, it will diminish the willingness to adopt certified seed in future. The more the wealth a household has the more likely it is to adopt certified maize seed. it is therefore important to consider strategies that will attempt to promote technology adoption to poor rural households or develop pro-poor technologies.
Transaction costs were found to be positive but not significant in the decision to use certified seed. The positive sign as seen earlier can be attributed to the fact adopters spent more time to procure seed and thus had consistently higher transaction costs as compared to non adopters. Although a pairwise t-test on the differences in the means was significant the estimation result did not find a significant relationship between certified seed use and total transaction costs. This shows that even thought adopting farmers incur higher transaction costs this study did not find sufficient evidence to conclude that transaction costs are a constraint to adoption of certified seed.
Summary and Conclusions
This study found uncompetitive market structure at the seed agent level of marketing where the rules for one to qualify to be an agent were not transparent thus introducing additional transactions between agents at the same level. The pan-territorial pricing of seed in the country does not take into consideration agro-dealers who are in more remote areas where the marketing

margins are not sufficient to cover costs. This means that farmers have to travel longer to procure certified seed where the profit margin does not cover the marketing costs for agrodealers.
Infrastructure was found to have a significant role in the adoption of seed as the distance to produce markets and motorable road was found to be negatively related to adoption of certified seed. Distance to certified seed source was found to significant and positively influence the decision to use certified seed. This was unlike the expectation. However, this phenomenon can be explained in that due to concern for quality of seed, farmers trust more established stockists in major trading centres and thus travelled further to obtain certified seed.
An analysis on the relationship between household asset wealth and used of certified maize seed showed that poverty reduces the probability of adopting improved technologies. Results also showed that it is only at higher wealth levels (quintile 4 and 5) where the relationship was positive indicating that up to 60 percent of farmers require support to enable them take advantage of available high yielding maize varieties.
By introducing elements of transaction costs this study has shown that as farmers adopt certified seeds, they incur higher transaction costs than non adopters. Although the transaction costs were significantly different for the two groups, the regression results did not find sufficient evidence to conclude that transaction costs are a constraint to adoption of certified maize seed.
Policy Implications and Recommendations
Increasing maize productivity and productivity remains an important goal for Kenya’s agricultural policies. There are several policy instruments open to the government in that may positively influence input use and maize production. The following are the policy recommendations that can be deduced fro m this study.
Seed companies should be encouraged to increase the number of seedagents/distributors at the district level by recruiting all those that meet a certain capacity threshold. This will inturn increase competiton, and shorten the seed value chain. This is especially so for the quasi-government owned Kenya Seed Company whose seed varieties form the bulk of marketed varieties.
The government should consider targeted input support programs for the poorer sections of the rural households who cannot afford inputs for maize. Where the seed is targeted to the poor it will reduce leakage to the non poor market segments and therefore be cheaper to the exchequer. Input support policies have also been seed to be cheaper to implement as compared to food relief programs.
Policies that increase the flow of information from the extension to farmers are also proposed e.g. increasing the number of contacts between extension and farmers through funding of field days and demonstrations. The government should also consider a maize pricing policy and access to markets policies as it was seen that farmers with a higher degree of commercialization were adopting more.
Farmers adopting certified seed, incur higher transaction costs than non adopters. Therefore, policies that minimize the incidence of transaction cost will reduce the burden on farmers and thus increase adoption. These include policies that limit the risk of adulteration through tighter policing of actors along the certified seed value chain. This will increase increasing trust for

certified seed regardless of the source and in turn reduce the distance that farmers travel to purchase seed.
Acknowledgements
The authors acknowledge the financial support from financial support received from Deutsche Gesellschaft für Technische Zusammenarbeit (GTZ) through the project entitled Developing and disseminating stress tolerant maize for sustainable food security in East and Central Africa. I would also like to appreciate the assistance received from the collaborative masters in agriculture and applied economics program, (CMAAE) my thesis committee and for the financial support in carrying out this study, as well as to Tegemeo Institute of Agricultural Policy and Development for time and material resources extended to me to complete this work.
References
Adesina, A.A. & Zinnah, M.M., 1993. Technology characteristics, farmers' perceptions and adoption decisions: A Tobit model application in Sierra Leone. Agricultural Economics, 9, 297-311.
De Groote, H. et al., 2008. Possibilities of segmenting seed market to reach resource poor farmers with royalty free technology. Paper presented at the Insect Resistant Maize for Africa (IRMA) Project End-of-Phase II Workshop, Nairobi, Kenya, 28-30 Oct 2008, Nairobi: CIMMYT.
Doss, C. et al., 2003. Adoption of Maize and Wheat technologies in East Africa: Synthesis of the Findings of 22 Case Studies, Mexico, D.F.: CIMMYT. Available at: http://www.cimmyt.org/english/docs /eco_wpaper/ewp03-06.pdf.
Feder, G., Just, R.E. & Zilberman, D., 1985. Adoption of Agricultural Innovations in Developing Countries: A Survey. Economic Development and Cultural Change, 33(2), 255. Available at: http://www.journals.uchicago.edu/doi/abs/10.1086/451461.
GoK, 2003. A Strategy for Economic Recovery: Ministry of Planning and National Development, Government of Kenya.
Heckman, 1976. Sample Selection Bias as a Specification Error Author ( s ): James J . Heckman Published by : The Econometric Society Stable URL : http://www.jstor.org/stable/1912352. Society, 47(1), 153-161.
Hellin, J., 2007. Maize value chains in East and Central Africa(ECA). A Draft background document.

Jayne, T. et al., 2001. Do Farmers Really Benefit From High Food Prices? Balancing Rural Interests in Kenya’s Maize Pricing and Marketing, Tegemeo Institute.
Kaliba, A.R., Verkuijl, H. & Mwangi, W., 2000. Factors Affecting Adoption of Improved Maize Seeds and Use of Inorganic Fertilizer for Maize Production in the Intermediate and Lowland Zones of Tanzania. , 32(1), 35-37.
Kibaara, B., 2005. Technical Efficiency in Kenya's Maize Production: A Stochastic Frontier approach,
Langyintuo, A.S. et al., 2008. An Analysis of the Bottlenecks Affecting the Production and Deploying of Maize Seed in Eastern and Southern Africa., Harare: CIMMYT.
Langyintuo, A.S. et al., 2000. Farmers Strategy for Sustainable Food Security Determinants of the adoption of improved rice varieties in the inland valleys of northern Ghana. A Tobit model application, Bamako: Savanna Agricultural Research Institute.
MoA, 2004. The Status of Maize Seed Industry in Kenya: A Value Chain Analysis.
Muhammad, L., 2003. The Seed Industry for Dryland Crops in Eastern Kenya The Seed Industry for Dryland Crops in Eastern Kenya. Production, (November).
Pingali, P.L. & Pandey, S., 2001. Meeting world maize needs: technological opportunities and priorities for the public sector. In Mexico, D.F.: CIMMYT.
Pixley, K. & Banziger, M., 2001. Open-Pollinated Maize Varieties: A Backward Step or a Valuable Option for Farmers. In Seventh Eastern and Southern African Maize Conference. Harare Zimbabwe, pp. 22-28.
Smale, M. & Jayne, T., 2003. Maize in Eastern and Southern Africa: "Seeds" of Success in Retrospect., Washington, D.C.: IFPRI.
Williamson, O.E., 2007. Transaction -Cost Economics The governance of Contractual relations. Governance An International Journal Of Policy And Administration, 22(2), 233-261.
Winter-Nelson, A. & Temu, A., 2005. Impacts of prices and transactions costs on input usage in a liberalizing economy: evidence from Tanzanian coffee growers. Agricultural Economics, 33, 243-253. Available at: http://www.ingentaconnect.com/content/bsc/agec/2005/00000033/00000003/art00001.
Winter-Nelson, A. & Temu, A., 2002. Institutional adjustment and transaction costs: product and inputs markets in the Tanzanian coffee system. , 30(4), 561-574. Available at: F:\Literature_CIMMYT Social Economics\WinterNelson and Temu_2002_Inst Adjust and trans Costs_Tz Coffee.pdf.