Embed Size (px)
Citation preview

Rubber & Plastics News ● November 12, 2012 17www.rubbernews.com
DesignInnovation Manufacturing
Excellence&INTERNAL MIXERS | TSRs | MILLS | CALENDERS | TILT-DISCHARGE MIXERS | REMANUFACTURING
•Full line of mixers, extruders, calenders, mills,
and tire test equipment
•Most advanced designs in rotors, including the patented
6-wing VCMT rotor, and new 4-wing N
•Remanufacturing/upgrading of used machinery
•Testing lab for customized mixing solutions
•Spare parts for all manufacturers
•Full turnkey installation, start-up assistance,
and support services
•24-hour field service
For more detail, visit our website at ksbiusa.com orcall 330-655-3111.
1600 Terex Road, Hudson, Ohio 44236 Tel: 330-655-3111 Fax: 330-655-298224-Hour Hotline: 1-800-464-0064 email: [email protected] website: www.ksbiusa.com
The Industry Leader in Rubber & Plastic Machinery...Service...Support
87-05-R1
Technical
Storage, loss modulus across elastomer compoundsExecutive summary
In this work, important experimental controls for using indentation equip-ment to characterize viscoelastic solids in the frequency domain are presentedalong with a demonstration of the ability to spatially characterize the viscoelas-tic properties of elastomer compounds in cross-sections of tires.
These objectives are achieved by: (1) presenting the key factors of experimen-tal control, (2) providing a basis for sample preparation of tires in cross-sectionand (3) spatially analyzing the viscoelastic properties of composite tire struc-tures in ambient conditions.
By Bryan A. Crawford,Nanomechanics Inc.
Harold J. HerzlichHerzlich Consulting Inc.
and Erik G. HerbertUniversity of Tennessee
Instrumented indentation testing,also termed nanoindentation, has beensuccessfully used for measuring theelastic modulus and hardness of ceram-ics, metals, plastics (E > 1 GPa) and thinfilms for many years1.
The primary advantages of the IITtechnique are the ability to characterizesmall volumes of material, measureproperties with high spatial resolutionand ease of sample preparation (all thatis required is an exposed flat surface).
In recent years, much work has beendone to extend the capabilities of inden-tation equipment to measure the vis-coelastic properties of elastomers thatare much less stiff than those materialstraditionally tested2,3,4.
This work has shown that nanoinden-tation is a viable characterization tech-nique for viscoelastic solids if careful ex-perimental controls are observed.
The viscoelastic properties are of criti-cal importance in tire materials becausethey describe how an elastomer storesenergy (storage modulus), like a spring,and how the internal network of poly-mer chains rub frictionally to convertmechanical energy into heat (loss modu-lus)–this is the energy that is lost toheat generation.
In this work, important experimentalcontrols for using indentation equip-ment to characterize viscoelastic solidsin the frequency domain are presentedalong with a demonstration of the abili-ty to spatially characterize the vis-coelastic properties of elastomer com-pounds in cross-sections of tires.
These objectives are achieved by: (1)presenting the key factors of experimen-tal control, (2) providing a basis for sam-ple preparation of tires in cross-sectionand (3) spatially analyzing the vis-coelastic properties of composite tirestructures in ambient conditions.
The dynamic indentation testThe instrumented indentation test al-
lows the penetration depth of an inden-ter tip to be continuously measuredwhile being loaded at a constant loadingrate, displacement rate or indentationstrain rate.
As the tip penetrates the sample dur-ing a dynamic indentation test a har-monic force oscillation is applied to thetip which generates an oscillatory har-monic displacement response at thesame frequency of force application; aphase lock amplifier is used to apply theharmonic force oscillation, measure thefrequency specific harmonic displace-ment response, and determine the phase
angle—also termed the phase lag—be-tween the two harmonic signals.
Fig. 1 shows the Force-Time historyfor a typical indentation test along withan outset that displays the super im-posed harmonic force oscillation usedduring dynamic indentation.
For contacts with perfectly elastic ma-terials the harmonic displacement is inphase with the harmonic force applica-tion–there is an instantaneous displace-ment response because of the force ap-plication.
As damping is introduced into thesample, such as in a viscoelastic poly-mer, the displacement response starts tolag behind the force application.
This lag is measured through thephase angle separation between the har-monic force application and the frequen-cy specific displacement response.
Fig. 2 displays the harmonic measure-ments for an elastic and viscoelastic con-tact. Using these data, the measured dy-namic stiffness, S, and measured damping,C�, respectively, of the contact are deter-mined as Equations 1 and 2, where F0 isthe harmonic force amplitude, h0 is theharmonic displacement amplitude, and �is the phase angle between the two har-monic signals.
The measured stiffness and dampingfrom an indentation test consists of acoupled response between the samplebeing measured and the instrument be-ing used to make the measurement;each nanoindenter instrument has stiff-ness and damping components that con-tribute to these measurements.
A phasor diagram in Fig. 3 is used toschematically illustrate the componentsof the combined instrument and sampleresponse of the stiffness and dampingmeasurements.
Fig. 1. The force versus time history ofa standard indentation test showingthe superimposed harmonic force os-cillation used during dynamic indenta-tion.
Equation 1.
Equation 2.
Fig. 2. Harmonic force and displace-ment responses measured in elasticand viscoelastic.
Fig. 3. Schematic illustration showingthe contributions of both the instru-ment and sample to the measurementsof stiffness and damping during a dy-namic indentation test.
Equation 3.
Equation 4.
See Modulus, page 18
TECHNICAL NOTEBOOKEdited by Harold Herzlichh
RPN20121112P017.qxp 11/8/2012 3:19 PM Page 1
18 Rubber & Plastics News ● November 12, 2012 www.rubbernews.com
Technical
To isolate the response of the sample,the instrument is modeled as a force,damped oscillator and the Vigot model,a spring and dashpot in parallel, is usedto model the viscoelastic sample2.
Fig. 4 provides a schematic illustra-tion of the dynamic model used to de-scribe the combined response of the in-strument and sample.
In the figure, Kinst. is the stiffness of theinstrument, Cinst. is the damping of theinstrument, and Ksample and Csample are, re-spectively, the stiffness and dampingcontributions of the sample.
The free hanging mass represents thecombined mass of the indenter columnand indentation tip; the moving mass ofthe sample is assumed to be negligiblein most nanoindentation tests.
Instrument contributions Kinst. andare Cinst. determined by performing directmeasurements of the stiffness anddamping in air, out of contact with thesample.
After subtracting the instrument con-tributions from the measured response,the resulting sample contributions canthen be used to determine the storageand loss moduli, E’ and E”, respectively,using Sneddon’s stiffness equation, ifthe contact is representative of linearviscoelasticity5, where � is Poisson’s ra-tio, � is a term based on the geometry ofthe contact, and A is the projected areaof the contact between the indenter tipand the sample (Equations 3 and 4).
The indenter tip used for soft poly-mers is most frequently a cylindrical flatpunch tip for which the punch area, A, isknown and the geometry factor for a cir-cular contact stipulates that � = 1.
While the theory behind using ananoindenter with a flat punch indentertip to perform measurements of E’ andE” is quite simple, there are three majorassumptions that are being made whenperforming these tests: (1) the test in-strument can be modeled as a forced,damped oscillator that is limited to one-degree of freedom, (2) the contact meas-urements must be made in the linearviscoelastic regime of the sample, and(3) measurements are only performedunder conditions of steady-state har-monic motion.
It is critical to the validity of the re-sults that all three assumptions are ver-ified.
Comprehensive techniques for verifi-cation of these assumptions are present-ed by Herbert et al 2.
Sample preparationThe nanoindentation test requires
only a flat exposed surface for testing. Each of the tire samples presented in
this report was cross-sectioned by firstcutting a section out of the tire using aband saw and then grinding the cross-section of the sample with a surfacegrinder to form a flat surface.
A two-step process was used for grind-ing each sample to a suitable finish.
First, the cross-section was ground atroom temperature to achieve a flatnessthat was uniform across the sample.
Secondly, the tire sample and holdingchuck were placed on dry ice (-78.5°C),allowed sufficient time to equalize, andwas cold-ground to produce a surfacethat was unaffected by the heat genera-tion produced during the grindingprocess.
Fig. 5 shows a picture of a cross-sec-tioned sample mounted in a 1.5-inchclamp ready for testing.
The multiple polymer layers are out-lined in the figure and the scale readsfrom the outside of the tire to the inside.
Test protocolTesting was performed in the Nanome-
chanics Inc. Analytical Services Labora-tory on the Agilent Technologies NanoIndenter G200 using the XP force trans-ducer.
This transducer has been shown tohave an operating range up to 50 Hz inaccordance to Assumption 1, above, andis appropriately modeled as a single de-gree of freedom forced, damped oscilla-tor2.
Cross-talk between lateral vibrationand vertical oscillation modes can inter-fere with the instrument calibrations ofstiffness, damping and phase angle atfrequencies higher than 50 Hz for thistransducer. Other transducers availablefor the Agilent nanoindenter system al-low frequencies up to 250 Hz to be ana-lyzed.
A 100 �m cylindrical flat punch wasinstalled in the transducer and used toperform all of the indentation tests.
A line scan was completed acrosseach sample with a separation distancebetween test locations of 200 �m; thiswas sufficient for providing details ofgradients across the individual polymerlayers and at the interfaces betweenlayers.
The test positions were selected under
a microscope to ensure that steel beltsand cords were not encountered.
After the test positions were selected,the sample was translated under theforce transducer and the tests pro-gressed in the following manner.
The indenter tip was brought into con-tact with the sample.
Force was applied to the tip until fullcontact between the tip and sample wasdetected.
The penetration depth into the sam-ple was held constant for a settle periodto allow dissipation of time dependentdeformation mechanisms.
The frequencies of 45 Hz, 20 Hz, 10Hz, 5 Hz, 3 Hz and 1 Hz were scanned.Data of harmonic force, harmonic dis-placement and phase angle were record-ed for each frequency for the determina-tion of storage and loss moduli.
The tip was lifted out of contact andthe sample was translated to the nexttest position.
Applications in tire analysisVerification of linear viscoelasticity
and steady-state harmonic motionThe two assumptions of a linear vis-
coelastic contact and steady-state har-monic motion are important and quitesimple to directly verify for the test pro-tocol and materials being tested.
Two elastomer layers, on the oppositeends of the scale for E’ and E”, of the tiresamples were used for verification ofthese assumptions.
Linear viscoelasticity was verified bybringing the tip into full contact withthe sample and making measurementsat multiple compression distances to en-sure that small increases in strain pro-vided a linear increase in stress, givingthe same results for E’ and E” at the dif-ferent compression distances.
Steady-state harmonic motion was de-termined by evaluating the results ofthe samples over multiple time scaleswhere the dissipation of creep and otherdeformation mechanisms could cause atransient response in the measure-ments.
The primary issue that affects steady-state harmonic motion in tire testingwith a flat punch tip is not allowing timedependent deformation mechanisms tosufficiently dissipate prior to conductingtest measurements.
Two conditions were used to deter-mine the sensitivity of the results totime dependent deformation. First, adwell period of 10 seconds was used dur-ing Step 3 in the test protocol to allowtime dependent deformation to subside,and, secondly, the displacement signalwas monitored during Step 3 and givenunlimited hold time until all time de-pendent deformation subsided—thisgenerally required hundreds of seconds.Fig. 6 shows the results of both tech-niques on two layers of a tire cross-sec-tion.
It is clear that both techniques pro-vide the same results and are represen-tative of steady-state harmonic motion.
Because of the extra time required toallow complete dissipation of the defor-mation mechanisms, a 10 second holdwas determined to be sufficient for thetests.
In circumstances when the tip haspenetrated too deep into the sample, anincrease in the mechanical propertiescan arise because of additional strainbeing imposed in the sample duringtesting.
It is important to determine the linearviscoelastic regime so that limits can beestablished to prevent over-strainingthe sample.
The small-strain assumption, or the
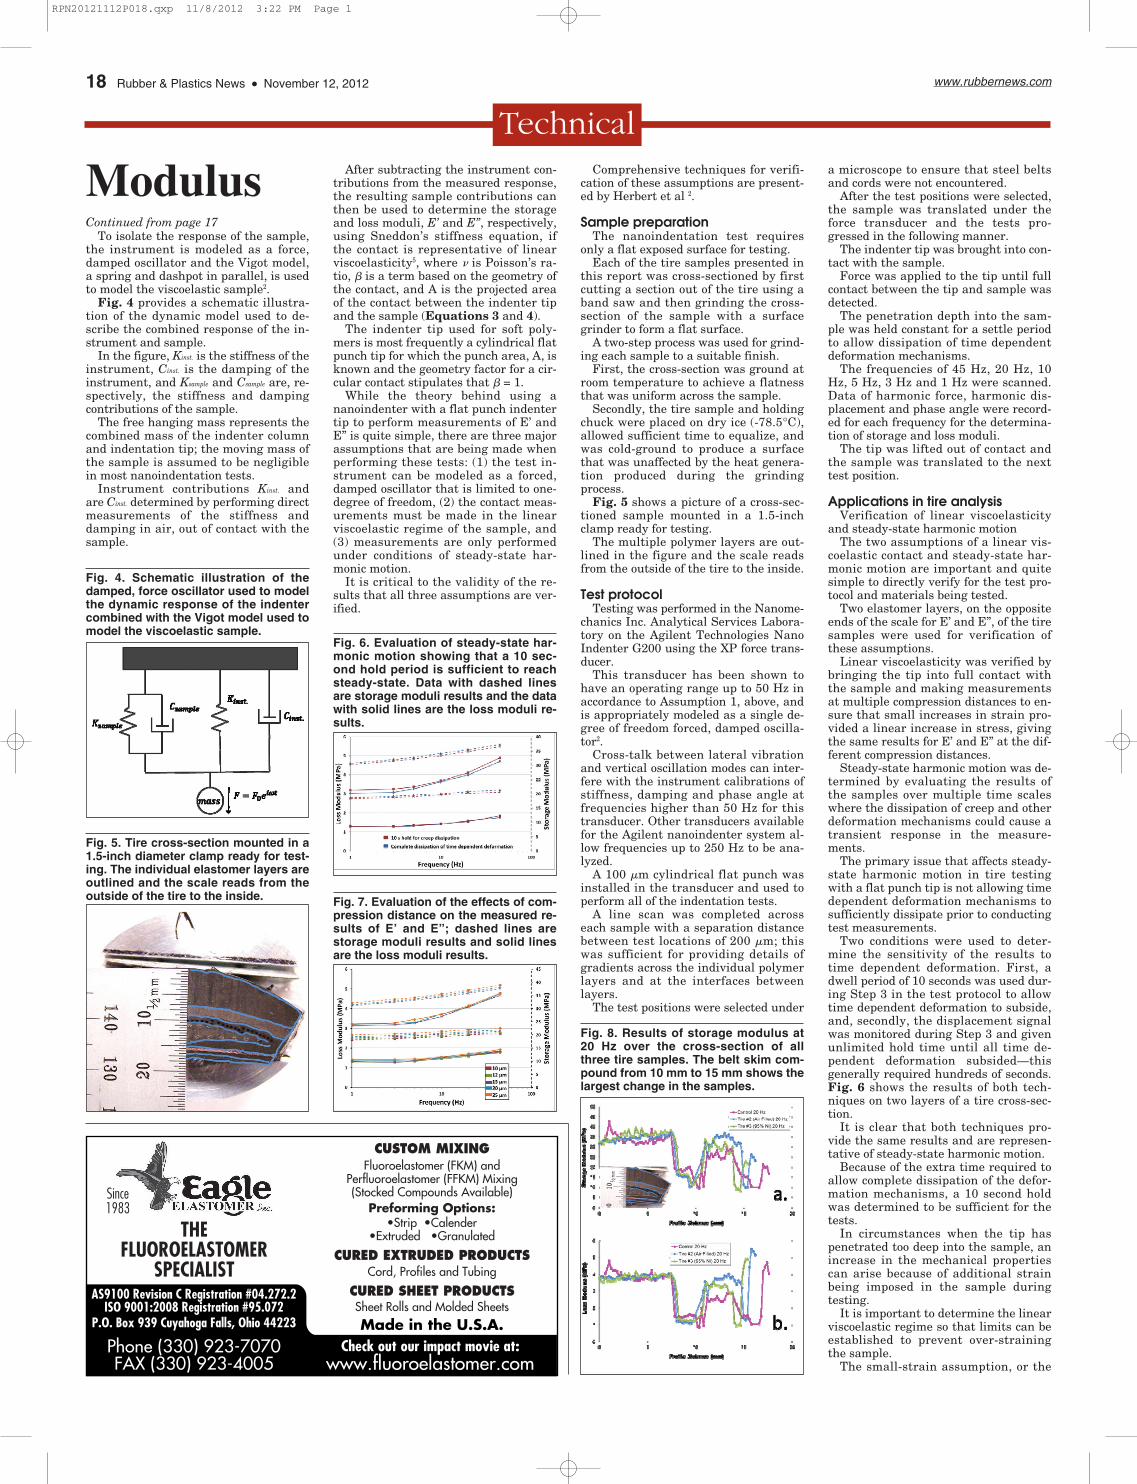
Fig. 4. Schematic illustration of thedamped, force oscillator used to modelthe dynamic response of the indentercombined with the Vigot model used tomodel the viscoelastic sample.
Fig. 5. Tire cross-section mounted in a1.5-inch diameter clamp ready for test-ing. The individual elastomer layers areoutlined and the scale reads from theoutside of the tire to the inside.
Fig. 6. Evaluation of steady-state har-monic motion showing that a 10 sec-ond hold period is sufficient to reachsteady-state. Data with dashed linesare storage moduli results and the datawith solid lines are the loss moduli re-sults.
Fig. 7. Evaluation of the effects of com-pression distance on the measured re-sults of E’ and E”; dashed lines arestorage moduli results and solid linesare the loss moduli results.
Fig. 8. Results of storage modulus at20 Hz over the cross-section of allthree tire samples. The belt skim com-pound from 10 mm to 15 mm shows thelargest change in the samples.
ModulusContinued from page 17
RPN20121112P018.qxp 11/8/2012 3:22 PM Page 1
Rubber & Plastics News ● November 12, 2012 19www.rubbernews.com
Technicalassumption that the tests are conductedin the linear viscoelastic regime, wastested by examining the test resultsover a range of penetration depths from10 �m to 25 �m.
Because of misalignments between theface of the indentation tip and the sam-ple, most of the tests on the tire samplesrequired a penetration depth of at least10 �m (often 15 �m, depending on thetopography left from cold-grinding) to re-liably establish full contact between a100 �m diameter cylindrical flat punchand the surface of the sample.
Fig. 7 provides the results of E’ andE” as a function of frequency at the dif-ferent penetration depths.
It is clear that for the storage modulusmeasured on the softer rubber layer,penetration depths over 20 �m of pene-tration caused significant differences inthe measurements because of the largerstrains that were applied.
For the rubber layer with the higher E’and E”, the tests did not exhibit signifi-cant differences (> 5 percent variation)even for penetration depths up to 25 �m.
Because of the results of storage mod-ulus on the softer layer, the tests werelimited to a maximum penetrationdepth of 20�m.
Cross profile analysisCross profile analysis was performed
on 13 tire samples, supplied by HerzlichConsulting Inc., of which the results onthree of the samples will be discussed inthis report.
The results for all of the tire samplescan be found at www.nanomechanic-sinc.com/tire-results.
The samples in this report consisted ofthree Bridgestone Insignia 200 tires(P215/60R16)—two were subjected to ag-ing and loading tests and one was used asa control. Table 1 lists the aging and load-ing test conditions for the tire samples.
After testing was complete, sectionswere removed from the intersection ofthe sidewall and tread region, preparedin cross-section, and dynamic nanoin-dentation testing was performed acrossthe sample over the frequency rangefrom 1 Hz to 45 Hz to examine any gra-dients and trends that formed in theelastomer compounds.
The results of the storage and loss mod-uli, determined at 20 Hz, over the cross-sections of the three tire samples areshown in Figs. 8a and 8b, respectively.
All three samples show consistent re-sults along the tread compound, but twoareas along the cross-profiles show dis-tinct differences among the samples: thebelt skim compound and the inner liner.In these regions, both the nitrogen andair-filled tires show increases in the stor-age and loss moduli, with the air-filled tireshowing the most significant increase.
Trends in the belt skim compound ofthe control and nitrogen-filled tires arevery similar.
Both samples show only minor varia-tions across this region, but the storagemoduli of the nitrogen-filled tire peaks outat about 5 MPa greater than the control.
This indicates some degradation ofthe belt skim compound has occurred.The air-filled tire has a completely dif-ferent trend over this region.
There is a strong gradient over the beltskim compound leading to a peak directlyin between the two runs of steel belts.
Storage moduli results on this samplepeaked out at 10 MPa higher than thecontrol. Similar trends are also appar-ent in the loss moduli results displayedin Fig. 8.
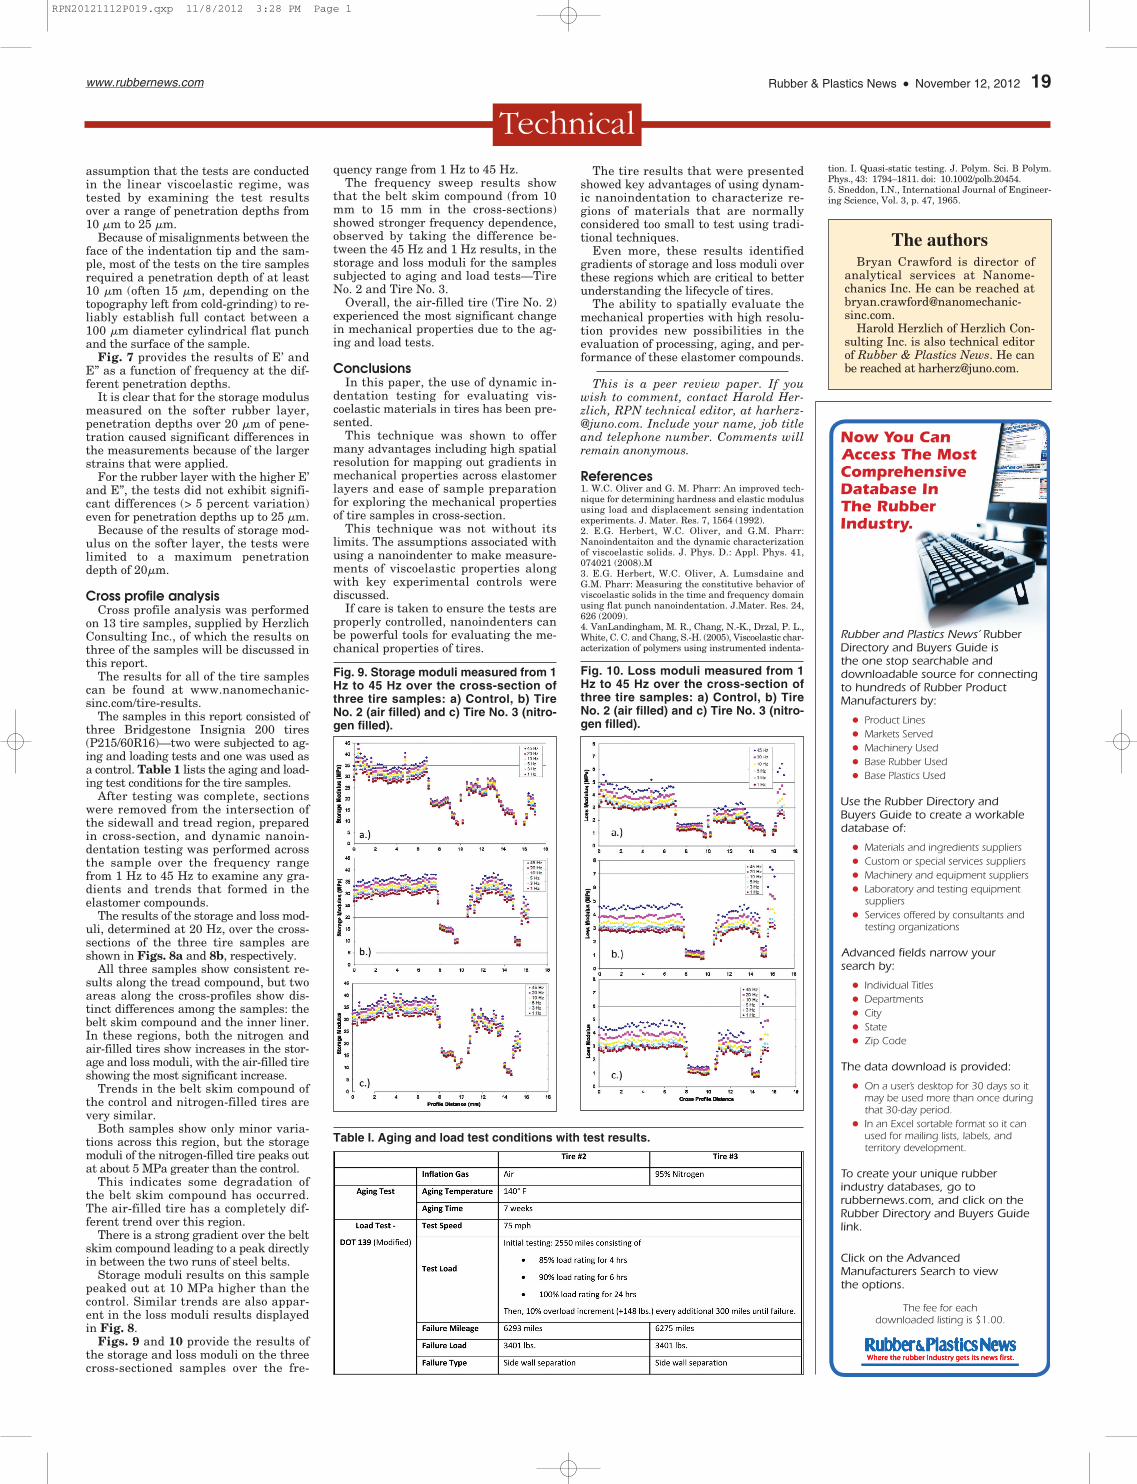
Figs. 9 and 10 provide the results ofthe storage and loss moduli on the threecross-sectioned samples over the fre-
quency range from 1 Hz to 45 Hz. The frequency sweep results show
that the belt skim compound (from 10mm to 15 mm in the cross-sections)showed stronger frequency dependence,observed by taking the difference be-tween the 45 Hz and 1 Hz results, in thestorage and loss moduli for the samplessubjected to aging and load tests—TireNo. 2 and Tire No. 3.
Overall, the air-filled tire (Tire No. 2)experienced the most significant changein mechanical properties due to the ag-ing and load tests.
ConclusionsIn this paper, the use of dynamic in-
dentation testing for evaluating vis-coelastic materials in tires has been pre-sented.
This technique was shown to offermany advantages including high spatialresolution for mapping out gradients inmechanical properties across elastomerlayers and ease of sample preparationfor exploring the mechanical propertiesof tire samples in cross-section.
This technique was not without itslimits. The assumptions associated withusing a nanoindenter to make measure-ments of viscoelastic properties alongwith key experimental controls werediscussed.
If care is taken to ensure the tests areproperly controlled, nanoindenters canbe powerful tools for evaluating the me-chanical properties of tires.
The tire results that were presentedshowed key advantages of using dynam-ic nanoindentation to characterize re-gions of materials that are normallyconsidered too small to test using tradi-tional techniques.
Even more, these results identifiedgradients of storage and loss moduli overthese regions which are critical to betterunderstanding the lifecycle of tires.
The ability to spatially evaluate themechanical properties with high resolu-tion provides new possibilities in theevaluation of processing, aging, and per-formance of these elastomer compounds.
This is a peer review paper. If youwish to comment, contact Harold Her-zlich, RPN technical editor, at [email protected]. Include your name, job titleand telephone number. Comments willremain anonymous.
References1. W.C. Oliver and G. M. Pharr: An improved tech-nique for determining hardness and elastic modulususing load and displacement sensing indentationexperiments. J. Mater. Res. 7, 1564 (1992). 2. E.G. Herbert, W.C. Oliver, and G.M. Pharr:Nanoindentaiton and the dynamic characterizationof viscoelastic solids. J. Phys. D.: Appl. Phys. 41,074021 (2008).M3. E.G. Herbert, W.C. Oliver, A. Lumsdaine andG.M. Pharr: Measuring the constitutive behavior ofviscoelastic solids in the time and frequency domainusing flat punch nanoindentation. J.Mater. Res. 24,626 (2009).4. VanLandingham, M. R., Chang, N.-K., Drzal, P. L.,White, C. C. and Chang, S.-H. (2005), Viscoelastic char-acterization of polymers using instrumented indenta-
tion. I. Quasi-static testing. J. Polym. Sci. B Polym.Phys., 43: 1794–1811. doi: 10.1002/polb.20454.5. Sneddon, I.N., International Journal of Engineer-ing Science, Vol. 3, p. 47, 1965.
Table I. Aging and load test conditions with test results.
Fig. 9. Storage moduli measured from 1Hz to 45 Hz over the cross-section ofthree tire samples: a) Control, b) TireNo. 2 (air filled) and c) Tire No. 3 (nitro-gen filled).
Fig. 10. Loss moduli measured from 1Hz to 45 Hz over the cross-section ofthree tire samples: a) Control, b) TireNo. 2 (air filled) and c) Tire No. 3 (nitro-gen filled).
The authorsBryan Crawford is director of
analytical services at Nanome-chanics Inc. He can be reached [email protected].
Harold Herzlich of Herzlich Con-sulting Inc. is also technical editorof Rubber & Plastics News. He canbe reached at [email protected].
RPN20121112P019.qxp 11/8/2012 3:28 PM Page 1