Embed Size (px)
Citation preview


17-1
17. PORT DEVELOPMENT SCENARIO 17.1 Industrial Development Potentials 17.1.1 Economic Activity Population of Jambi Province has stabilized at around 2.4 million (Table 17.1.1). Population density is quite low except Jambi City, the provincial capital (Table 17.1.2). Between 1993 and 2000, GRDP of Jambi Province showed an increase in both a market price and constant price calculation basis. The increase of GRDP from 1993 to 2000 was 32.0%, with the mining sector recording the highest increase of 177%. GRDP of Jambi Province reached its maximum level in 1997 at Rp3, 268,451 million in 1997. It recorded Rp3, 251,143 million in 2000, with the agricultural sector accounting for the largest portion, Rp886, 495 million or 27.3%, followed by processing industries (Rp578, 907 million, 17.8%), and the trade sector (Rp567, 762 million, 17.5%). Table 17.1.3and 17.1.4 show the GRDP by sector and type of expenditure. The regional income of Jambi still mainly relies on primary products such as mining, agriculture, and forest product. Natural resources have not been utilized in a sustainable manner, however. Natural forest has undergone a massive deforestation without replanting. 17.1.2 Land-use and Natural Resources Jambi Province has the potential for food crops, horticulture plants, plantation, livestock, and forestry. Of the total area, 2,179,440 hectares (42.7%) are secondary forest and agricultural area. Non-agricultural land is 2,920,560 hectares (57.3%). Gas and oil have been exploited at 14 sites. In addition, there are 22 potential sites for coal mining. Table 17.1.5 shows the land use in Jambi Province. Although the forestry sector is responsible for much of Jambi Province’s exports, log production is decreasing due to the rapid cutting of forests without serious efforts toward reforestation. In addition, this intensified logging has destroyed forest vegetation. Major plywood factories in the province actually relies on the logs produced in Kalimantan. Plantation, both state owned and small holders, is one of the major economic sectors of Jambi Province. Main commodities of plantation are rubber, palm tree, cassiavera and coconut. These products are all export-oriented.
The price of rubber has declined on the world market. In addition, productivity of the rubber plantation is low, less than 700 kilograms/hectares/year due to poor maintenance. As a result, farmers’ income is very low. This is also the case with smallholder coconut plantations.
Palm tree plantation is growing rapidly, though most of it is still unproductive. It is expected to become a main plantation commodity of the province. Similarly, Jambi Province has a production capacity of 35,000 tons/year for cassiavera, making Indonesia one of the biggest suppliers of this product in the international market. But this commodity has not been processed directly into semi-finished products or final products. Serious efforts have not been done to add value or increase its price. Table 17.1.6 shows


17-9
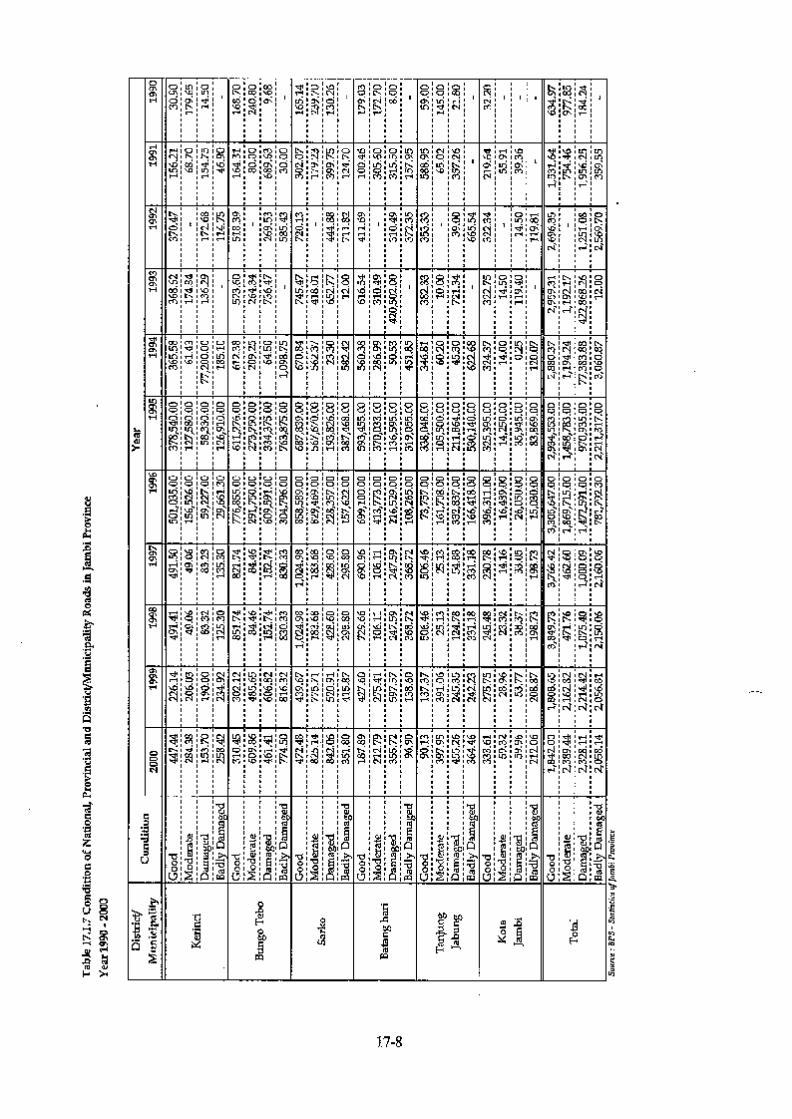
the composition of the forests in Jambi. 17.1.3 Roles of River Transportation Jambi Province has some geographical constraints for economic activities. Most of the land is mountainous terrain with many rivers, requiring bridges and water transportation. With respect to space planning, Jambi can be divided into three zones: East zone, Central zone and West zone. Inter-zone transportation network is needed to support the mobility of people and goods. Out of the 8,243 kilometers of roads in Jambi, around 10% is national roads, 14% is provincial roads and the rest is district roads. Among them, only 78% of the national roads, 25% of provincial roads and 30% of district roads can be categorized as being in a good condition (Table 17.1.7). Every one square kilometer of area in Jambi province is served only by 0.15 kilometers of road. This situation has made the region rely heavily on river transportation. Jambi can be divided into 4 river stream areas (DAS): Batanghari, Tungkal-Mendahara and Bayangkincir, and Jujuhan. The catchment area of Bayangkincir mainly belongs to South Sumatra. River transportation is developed alongside Batanghari River and its small rivers, because most parts of Jambi from Kerinci District to Berhala Bay belong to Batanghari DAS. This river serves to transport forest and plantation products. Some of the river ports have become centers of economic activities serving district/sub-district areas along the rivers. Due to sedimentation and tidal movement, some rivers are not navigable. Major ports are Jambi, Muara Sabak, Kuala Tungkal, and Nipah Panjang.
Table. 17.1.8 River Ports in Jambi Province River Ports District/Municipality Construction Year
Kota Jambi Jambi Municipality 1971 Suak Kandis Batanghari District 1971 Muara Tebo Bungo Tebo District 1971 Nipah Panjang Tanjung Jabung Timur District 1974 Bom Baru Jambi Municipality No data Talang Duku Jambi Municipality No data Kuala Tungkal Tanjung Jabung Barat District 1978 Kampung Laut Tanjung Jabung District 1978 Sei Bengkal Bungo Tebo District No data Sungai Puding Tanjung Jabung Timur District 1978 Muara Jambi Muaro Jambi District 1994 Muara Bulian Batanghari District 1994 Sungai Lokan Tanjung Jabung District 1998 Teluk Buan/Rantau Indah Tanjung Jabung Timur District 2000
Source: Transportation Division of Level I, 2001

17-10
Table 17.1.9 Major Ports in Jambi Province Ports Location Function
Talang Duku Jambi Municipality Export and import port Muara Sabak Tanjung Jabung Barat District Export and import port Kuala Tungkal Tanjung Jabung Barat District Export port and ferry serving distribution
and contribution inter provinces. Nipah Panjang Tanjung Jabung District Local Port
Source: City Planning, 1999/2000
Currently, trade activities are mostly carried out in Talang Duku Port. In addition to the major ports mentioned above, cargo handling is carried out at many special wharves (DUKS) along the Batanghari River and Pengabuan River. Actually, container throughput of the special wharves is larger than that of Talang Duku Port.
Table 17.1.10 Export Volume of Jambi Province by Port 1996-1998 (Tons) Ports 1996 % 1997 % 1998 %
Kuala Tungkal Muara Sabak Jambi Kampung Laut Nipah Panjang Kuah Pkl.Duri Simbur Naik
259,773 309,529 213,611
79 325
- -
33.16 39.51 26.80 0.01 0.04
- -
197.135 264.197 276.847
2.996 - - -
26.5 35.64 37.34 0.40
- - -
284.183 261.600 258.635
2.339 5 - -
35.18 32.39 32.02 0.29 0.00
- -
Total 783,317 100.00 741,175 100.00 1,093,545 100.00 Source: BPS of Jambi Province River ports in Jambi Province suffer from shallow stream and many sharp bends. As a result, vessel navigation greatly depends on the tide condition. Despite this, international trade has been increasing. Exports from Jambi in 1999 reached 1,020,433 tons with a value of US$ 445,288,000. Between 1990 and 1999, exports increased by 158% in volume and by 95% in value. Imports in 1999 reached 90,434 tons with a value of US$ 41,768,000. During the same period, import showed an increase of 158% in volume and an increase of 14% in value. 17.1.4 Capital Investments Economic development of Jambi has heavily relied on natural resources. Provincial and municipal government have tried to attract investors. Recently, investment in several sectors is increasing including agriculture, fishery, agro industry, simple fishery processing, and mining. Free trade agreement of ASEAN (AFTA), which will come into effect in 2003, is an opportunity to promote Jambi to the world market. With an open economic policy, Jambi province could invite more investment. In line with the decentralization process currently underway, Jambi Province should properly respond to this huge task.

17-11
Table 17.1.11 Domestic Capital Investment in 2000
Domestic Investment Sector Plan (Million Rp) Realization (million Rp)
Plantation 3,109,128 1,405,165 Agricultural products - - Forestry 274,022 614,880 Food Industry 380,363 24,479 Timber Industry 2,452,704 996,211 Chemical Industry 445,691 208,711 Basic Metal Industry 36,900 18,500 Pulp and Paper Industry 19,176,148 3,795,730 Tourism 1,660 - Transportation 125,350 - Mining 33,752 33,752 Mining services 108,343 729 Total 26,167,785 7,065,381
Source: BPS, 2000. Domestic capital investment in 2000 fell far short of the target amount (Table 17.1.11). In particular, there was a dearth of investment in forestry-related industries such as, timber, pulp, and paper. All in all, only 27% of the planned investment was realized. Foreign capital investment records show similar trends. Forestry and agriculture account for a major part of the foreign investment. Actual investment in 2000 was equivalent to only 13% of what was planned.
Table 17.1.12 Foreign Capital Investment in 2000 Foreign Investment
Sector Investment Plan (Million Rp.)
Investment Realization (Million Rp.)
Plantation 2,261,449 207,328 Food Industry 49,903 4,725 Timber Industry 2,493,932 340,560 Chemical Industry 41,680 370,341 Electricity 865,785 - Telecommunication Service 181,968 116,392 Tourism 43,500 37,031 Total 5,938,219 743,728
Source: BPS, 2000
Due to its strategic location, Jambi Province can expect a positive economic impact of the growth triangle including Malaysia and Singapore. Batam (one of PKN, national activity center) can be a node of the growth triangle and its economic impacts will be felt in Jambi Province. The city plan of Jambi identified two areas requiring priority in development (Table 17.1.13).

17-12
Table 17.1.13 Priority Development Areas in Jambi Province Province/Land Area Related Sea Area City in Land Area National City Function Muara Bulian Area and Surrounding Mainstay Sectors: -Industry -Plantation -Tourism -Food Crop -Fishery
Riau Mainstay Sector: Fishery Mining Tourism Orientation City: Kuala Tungkal
Jambi Muara Bulian Kuala Tungkal Muara Tembesi Muara Sabak Nipah Panjang
PKW PKL PKL PKL PKL PKL
Muara Bungo and Surrounding Mainstay Sectors: -Plantation -Food Crop -Forestry
Muara Bungo Bangkp Sarolangun Muara Tebo Sungai Penuh Tanah Tumbuh Sungai Bengkal
PKL PKL PKL PKL PKL PKL PKL
Source: Review and Revision of City Planning of Jambi Province, 2000 PKW: Territorial Activity Center, PKL: Local Activity Center
17.1.5 Prospects of Major Sectors (1) Mining Mining is an important economic sector in Jambi Province, producing coal, mineral, oil and gas, marble, granite, kaolin, and limestone. Main products are oil and coal. Coal mining will become increasingly important in the coming years.
1) Coal
Coal mines in Jambi Province produced 600,000 tons in 1998 and are expected to produce 2,080,000 tons in 2003. Coal mines in Jambi are spread out in several districts: Bungo Tebo (5 sites), Sarolangun Bangko (8 sites), Tanjung Jabung (2 sites), and Batanghari (5 sites). Coal deposits in Jambi are as follows:
- Measured deposit: 147.57 million tons in Bungo Tebo District and 36.5 million tons in Sorolangung Bangko.
- Indicated deposit: 98.1 million tons in Sarolangun Bangko and 72 million tons in Batanghari District.
- Estimated deposit: 9.75 million tons in Bungo Tebo. - PT Sari Andara Persada produces coal in Pelepat Sub-district, Bungo Tebo District with an area of
6000 hectares. It produces an average of 8000 tons of coal per month, marketed to PT Semen Padang.
2) Oil and Gas


17-15
The oil deposit in Jambi is estimated to be 1,270,956,240 barrel, found in 12 locations in Batanghari District. Natural gas deposit is estimated to be 5,060,097,240 m3, found in 10 locations. Mineral gas deposit in Tanjung Jabung Timur District amounts to1.2 trillion m3. (2) Plantation Plantation products significantly increased in volume during the period of 1993-1997. Plantation in Jambi Province comprises rubber, palm tree, coffee, tea, and cacao (Table 17.1.14, 15). Production increase is in line with an increase of the plantation area by 4.24% per year. Palm tree and rubber are main products and their plantation area has grown by 34% per year (palm tree) and 7% per year (rubber). Jambi is experiencing a gradual shift from rubber economy to palm plantation exporting crude palm oil (CPO). Production CPO in 1999 recorded 1,086,633 tons. Jambi Province expects steady growth in plantation and forestry products, among which oil palm is expected to increase most rapidly (Table 17.1.16, 17).
Table 17.1.16 Estimate of Rubber and Forest Products of Jambi, 1998-2010 (ton/m3)
Year Rubber Processed Woods *) By-product of Forest 1998 263,620 1,107,435 626 1999 281,714 1,135,121 795 2000 301,051 1,163,500 842 2001 321,714 1,192,587 893 2002 343,795 1,222,402 922 2003 367,394 1,252,962 939 2004 392,611 1,284,286 968 2005 419,559 1,316,393 1,069 2010 602,974 1,509,378 1,535
Source: BPS, Statistics of Jambi Province *)Plywood, Lumber for Timber, Block Board, etc.
Table 17.1.17 Estimate of Plantation Products of Jambi Province, 1998-2010 (ton)
Year Coconut Palm Trees Coffee Cassiavera Tea
1998 169,700 2,382,732 7,764 15,950 5,210 1999 174,632 3,095,635 7,806 16,559 5,252 2000 179,707 3,656,480 7,853 17,191 5,295 2001 184,930 4,104,733 7,898 17,847 5,338 2002 190,305 4,678,500 7,934 18,529 5,381 2003 195,836 5,324,600 7,988 19,236 5,425 2005 207,355 6,617,092 8,079 20,733 5,513 2010 239,325 9,847,589 8,312 25,004 5,741
Source: BPS, Statistics of Jambi Province

17-16
(3) Industry Jambi Province is developing the industrial sector to strengthen its economic structure focusing on agricultural products processing. Most of the industry in Jambi Province produces semi-finished products such as plywood, processed woods, and rubber (Table 17.1.18). In addition, there is a pulp plant which has an annual production capacity of 300,000 tons and crude palm oil industry growing by 40% a year.
Further industrial development requires good ports which can help distribute the products both domestically and internationally. Development of river ports aiming at export and import activities will realize the following benefits:
- To support the growth of the industrial sectors which require efficient export capacity. - To realize reduction of the transportation costs by shifting a loading port from neighboring
provinces to Jambi Province. - To provide efficient river transportation for various commodities including plantation products,
forestry products, and mining products. - To help realize the relocation of industries from industrialized nations to Jambi Province To sum up, the prospects of the Jambi economy in the next 5-10 years are promising, particularly in mining industries and agriculture development. On the other hand, measures should be taken to preserve the existing forests since the resources have been greatly depleted. Forest preservation will lessen the siltation in the rivers and can lead to the creation of an eco-tourism industry. Human resource development is also important to help the local labor force enter high value added industries. The competitive advantage of Jambi is the availability of various raw materials for different types of industrial development. This advantage can become greater if transportation infrastructure is properly developed.


17-18
17.2 Development Target 17.2.1 General Directions The development targets for Jambi Port can be summarized as follows: 1) To help achieve smooth and economical flow of cargo to/from Jambi Province. 2) To act as an impetus for the development of new industries in Jambi Province. Considering the present socioeconomic conditions of Indonesia as well as its policy of decentralization and privatization, the success of the development of Jambi Port depends on whether it will answer the urgent need to decrease dependence on the government sector. The central government needs to play a smaller role in the development and maintenance of port infrastructure. Since Jambi Port will continue to require maintenance dredging, a mechanism to realize sustainable port operation needs to be established. Competition with neighboring ports should be carefully examined as well to maximize the return of the port investment.
Fig. 17.2.1 Formulation of a Port Development Scenario
Identification of Prospective Economic Developments in Jambi Province
- Mining - Plantation - Manufacturing industry - Distribution
Preliminary Examination of Viability
Basic Policy of GOI Decentralization Privatization Future port network
Formulation of Port Development Scenario
Natural Resources of Jambi Province
Cost Sharing Mechanism for Port Development and Management
Spatial Plans of Port Hinterland
Identification of Port Functions needed at Jambi

17-19
It is also important to determine an appropriate demarcation of roles among the ports in Indonesia. Since various port projects are underway around the principal river ports, careful examination is needed to avoid duplication of investments and to materialize balanced regional development of the country. DGSC and IPCs are jointly preparing the Network Development Plan of Port Infrastructure in the National Port Arrangement. This was initially recommended by the JICA Study on the Port Development Strategy (March 1999). A draft plan was made available to the Study Team. The areas taken up in the study were port development, port finance and private sector participation, as well as port administration and operation. The Draft Network Development Plan basically follows the study and elaborates on the port development strategy. It identifies criteria for classifying the nation’s ports. These criteria are determined according to the cargo throughput in a port. The target ports are classified in the Draft Network Development Plan as shown below. This plan classifies Jambi Port as a tertiary trunk port for most port functions.
Table 17.2.1 Roles and Functions of Jambi Port Port functions Hierarchy Remarks Container Tertiary trunk port Container feeder port Conventional Secondary trunk port Conventional hub port Passenger - - Liquid bulk Tertiary trunk port Regional bulk trunk port Dry bulk Tertiary trunk port Regional bulk trunk port
Source: Draft Network Development Plan of Port Infrastructure in the National Port Arrangement, 2000, DGSC/IPCs Considering the economic activities alongside the Batang Hari River as well as the lack of an efficient road network in the province, Jambi Port needs to serve as a key transportation facility of the province. On the other hand, the shallow draft within the river and around the river mouth will not allow creation of a deep port. Consequently, the scale of port development at Jambi should be large enough to serve the economic needs of Jambi Province. However, excessive or unwarranted development needs to be avoided. This basically agrees with the port hierarchy proposed in the Draft Network Development Plan. Successful port development will bring about positive economic impacts through a sequence of events (Figure 17.2.2).

17-20
Development Targets
Fig. 17.2.2 Development Targets of Jambi Port
Creation of quay(s) at Jambi Port
Aggressive marketing
Increase in port users and vessel calls / Reduction of the transportation cost
Private investment around the port / Cost sharing mechanism among the central government, the local governments, and the private sector
Efficient and competitive services
Reduced burden on the government sector
Improved business environment
New private investment around the port / successful operation of the port and the private sector
Creation of new job opportunities
Increase in industrial output
Reduced dependence on the government sector
Smooth and economical flow of goods to/from Jambi Province
Further increase in terminal users and vessel calls
Creation of an industrial estate

17-21
17.2.2 Container Terminal The pace of the development of container terminals needs to be examined depending on the type of the terminal. As mentioned earlier, Jambi Port (both Talang Duku and Muara Sabak) will serve as a container feeder port catering for import/export containers of Jambi province. Although the demand forecast of containers provides a gradually growing cargo projection, the actual demand will grow suddenly when the port succeeds in attracting a new customer (See Figure 17.2.3). The master plan is required to enable the port to respond to these requirements.
Cargo Volume
Year Figure 17.2.3 Demand Growth and Phased Planning
17.2.3 Conventional Terminal Conventional terminals can act as a catalyst for regional development through providing efficient transportation of materials and products. The type and scale of the industrial development projects envisaged in the port hinterland will determine the need of the creation of additional conventional terminals. The dimensions and specifications of the conventional terminal widely differ depending on the industry it supports. Prospective industries therefore need to be identified before the planning of conventional terminals. In Talang Duku, a new coal terminal is expected to start its operation at the end of 2001. The new bulk terminal in Talang Duku will provide a considerable capacity when it becomes operational. Consequently, the timing of further expansion of the conventional terminal needs to be carefully examined so that it can keep pace with the needs of the industrial development projects without creating an excessive capacity. The provincial government has a development plan of an industrial estate at Parit Culum, which is within the hinterland of Muara Sabak (Figure 17.2.4). Although the development plan does not specify the industries to be developed, its targets seem to be the distribution industry and light industries (Table 17.2.2). These industries will require efficient container terminals. The Study Team learned that the provincial government hoped to invite a coal terminal to Muara Sabak. However, it
Demand Forecast
Actual Demand
Introduction of a New Customer
Terminal Capacity
Spare Capacity
Introduction of a New Customer

17-22
does not seem to be in line with the development strategy of Parit Culum.
Table 17.2.2 Parit Culum Industrial Development Plan up to 2010 Zone Land Use Area in 2005 (ha) Area in 2010 (ha) A1 Office 34.6 48.2 A2 Supporting Facility
- Hotel - Restaurant - Hospital - Park/Sports Center
106.5 134.6
B1 Export Processing Zone (EPZ) - Custom - Insurance/Surveyor - Ready-to-use Factory Buildings
53.8 75.1
B2 Export Processing Zone (EPZ) - Container Stacking Yard - Container Storage - Truck Terminal - Railway Station - Ready-to-use Factory Buildings
186.7 343.0
C1 Factory/Production 189.6 183.7 C2 Waste Treatment
- Fresh Water Treatment - Industrial Waste Treatment
24.1 33.5
C3 Factory/Production 161.4 187.1 C4 Housing 51.3 57.8
Source: Spatial Plan of Parit Culum Industrial Area, Jambi Province Jambi Province also has a spatial plan for the Muara Sabak port area. This plan proposes that the area (374 ha) should be used for port activities, offices, and energy supply (Figure 17.2.5 and Table 17.2.3). The spatial plan of Muara Sabak focuses on the development of container handling functions and does not seem to envisage the creation of a dry-bulk handling facility.
Table 17.2.3 Land Use Plan for Muara Sabak Port Area Zone Area (ha) Land use A1 41.5 Wharf, container depot, warehouse, CFS A2 39.3 Wharf, warehouse, CFS A3 53.3 Wharf, warehouse, CFS, oil tank B1 31.9 Office complex, commercial area, private facility B2 34.5 Container depot, office complex B3 87.7 Settlement, private facility, social facility C1 32.9 Container depot, commercial area C2 29.2 Truck terminal C3 24.2 Sports yard
Source: Spatial Plan of Muara Sabak Port Area 1999-2000, Jambi Province


18-1
18. DEMAND FORECAST 18.1 Capacity of the Existing Port In order to identify the need of port expansion, the Study Team identified the present capacity of the existing terminals. The baseline productivity (Table 18.1.1) and the maximum berth occupancy (Table 18.1.2) are the same as those used in evaluating the seven river ports.
Table 18.1.1 Baseline Productivity Cargo Type Productivity
General cargo 20 (t/gang/hour) Bagged Cargo 25 (t/gang/hour) Unitized Cargo 30 (t/gang/hour) Liquid Bulk 120 (t/hour) Dry Bulk 90 (t/hour) Container (Container Terminal) 20 (TEU/crane/hour) Container (Conventional Terminal) 10 (TEU/crane/hour)
Source: JICA Team
Table 18.1.2 Maximum Berth Occupancy Number of Berths in the Group Recommended Maximum Berth Occupancy (%)
1 40 2 50 3 55 4 60 5 65
6-10 70 Source: Port Development, UNCTAD 18.1.1 Talang Duku Talang Duku has two container wharves and one general cargo wharf at present. One of the container wharves is used to handle CPO too. A coal jetty is under construction and expected to start operation toward the end of 2001(Figure 18.1.1). (1) Container
Exiting facility: 2berths (67m x 2, one of which is shared with CPO barges) Average berthing time: 48hours = 2 days (Due to the current business practice) Working days: 365days Maximum cargo volume per call: 140 TEU (Due to the shallow draft) Recommended berth occupancy ratio: 0.5 (two-berth group), 0.4 for container and 0.1 for CPO
Capacity = 2 berths x 365 days / 2 days x 140TEU x 0.4 = 20,000 TEU

18-3
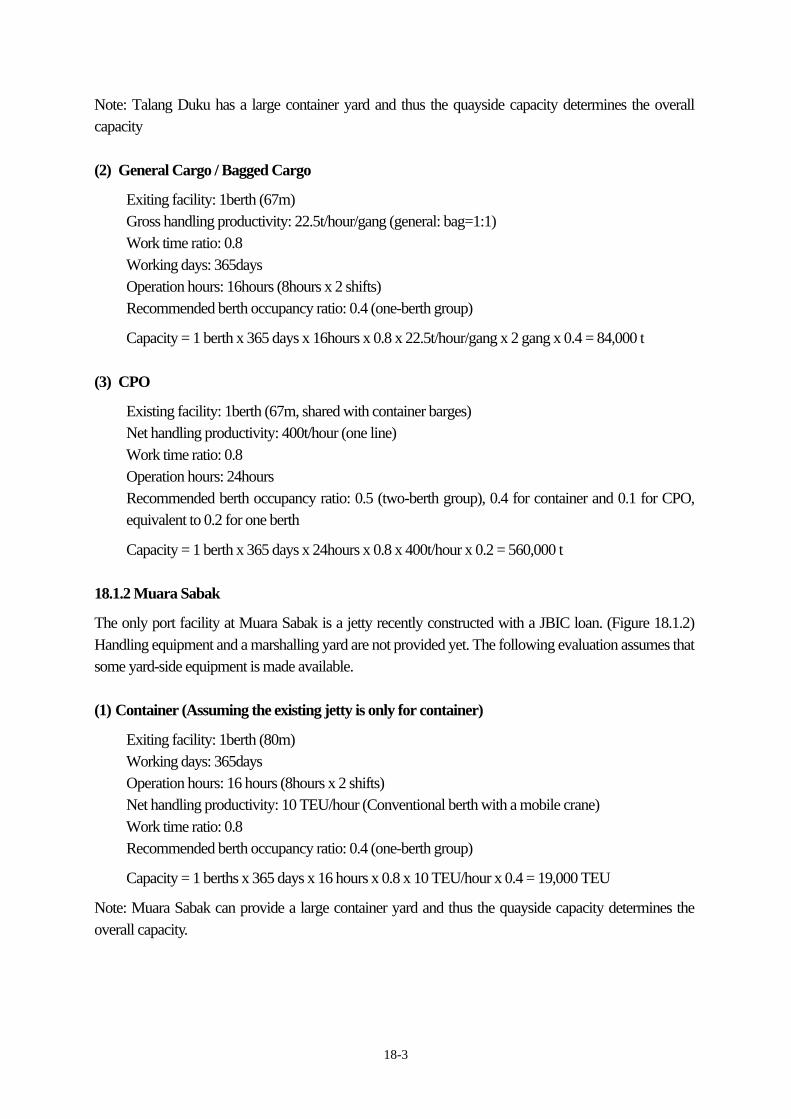
Note: Talang Duku has a large container yard and thus the quayside capacity determines the overall capacity (2) General Cargo / Bagged Cargo
Exiting facility: 1berth (67m) Gross handling productivity: 22.5t/hour/gang (general: bag=1:1) Work time ratio: 0.8 Working days: 365days Operation hours: 16hours (8hours x 2 shifts) Recommended berth occupancy ratio: 0.4 (one-berth group)
Capacity = 1 berth x 365 days x 16hours x 0.8 x 22.5t/hour/gang x 2 gang x 0.4 = 84,000 t
(3) CPO
Existing facility: 1berth (67m, shared with container barges) Net handling productivity: 400t/hour (one line) Work time ratio: 0.8 Operation hours: 24hours Recommended berth occupancy ratio: 0.5 (two-berth group), 0.4 for container and 0.1 for CPO, equivalent to 0.2 for one berth
Capacity = 1 berth x 365 days x 24hours x 0.8 x 400t/hour x 0.2 = 560,000 t
18.1.2 Muara Sabak The only port facility at Muara Sabak is a jetty recently constructed with a JBIC loan. (Figure 18.1.2) Handling equipment and a marshalling yard are not provided yet. The following evaluation assumes that some yard-side equipment is made available. (1) Container (Assuming the existing jetty is only for container)
Exiting facility: 1berth (80m) Working days: 365days Operation hours: 16 hours (8hours x 2 shifts) Net handling productivity: 10 TEU/hour (Conventional berth with a mobile crane) Work time ratio: 0.8 Recommended berth occupancy ratio: 0.4 (one-berth group)
Capacity = 1 berths x 365 days x 16 hours x 0.8 x 10 TEU/hour x 0.4 = 19,000 TEU
Note: Muara Sabak can provide a large container yard and thus the quayside capacity determines the overall capacity.


18-5
18.1.3 Kuala Tungkal The only public port facility at Kuala Tungkal is a passenger jetty called by daily Batam services (Figure 18.1.3). Currently, several boats are operated with the following dimensions: 65-338 GRT, 140-450 seats, and around 3m draft. (1) Passenger
Exiting facility: 1berth (75m) Working days: 365days Operation hours: morning departure Berthing time: 30 minutes Maximum number of vessels at berth: 3 Average passenger capacity: 300 persons Average load factor: 50 % Capacity = 1 berths x 365 days x 2 services x 300 x 0.5 x 2 (two-way shuttle service) x 3 vessels = 657,000 persons


18-7
18.2 Socio-Economic Framework for Jambi Forecasts
18.2.1 Economic Indicators
(1) Introduction
Economic indicators are important elements in any transport study as they serve to underpin transport developments and this is particularly so with ports which must considering trends, fluctuations in cargo volumes, likely future traffic growth and future development needs.
Indeed, GBHN and PROPENAS have major socio-economic objectives and these are described in Chapter 2.
The socio-economic context or framework provides both a basis to plan transport investment and a basis to make transport investment decisions.
(2) National GDP
This has been detailed in Sections 2 and 5 above and is not repeated here except where relevant or for emphasis.
If the recent political and economic instability continues to be overcome and progress can be made in restructuring the financial and banking sectors, then the economic future is bright.
It is hoped that the recent events of September 11 in the USA with its consequent negative impact on the world economy will be relatively short lived. It is therefore assumed that by 2007, with the proposed opening of the port development projects, the Indonesian and world economies will be well back on track.
Table 18.2.1 GRDP Growth in Sumatra and Jambi 1993 to 2000
GRDP (Rp Billions) at 1993 constant prices-Including Oil and Gas
Year 1993 1996 1997 1998 1999 2000
Riau 16,230 19,808 20,434 19,645 20,311 >4.8% Jambi 2,463 3,145 3,268 3,092 3,181 <2.5% South Sumatra 10,732 13,521 14,208 13,239 13,659 2.5-4.8% Indonesia 320,908 407,314 425,614 375,949 380,763 Annual Growth 26.9% 4.5% -11.7% 1.3% 4.8%
Source : BPS; Preliminary figures for 1999 and especially 2000
(3) Population
The population of Indonesia increased from 119 million in 1971 to 195 million in 1995.
On a regional basis, Sumatra and Kalimantan have grown faster than Java and this has been due to both regional variations in fertility and migration. Migration has been a

18-8
government promoted programme based on agricultural and industrial development in these regions.
Table 18.2.2 Regional Population Growth
Population (in Millions)
Region 1980 1990 % pa
1995 % pa
Sumatra 28.0 36.5 2.3
40.8 2.5
Kalimantan 6.7 9.1 2.9 10.5 3.0
Indonesia 146.9 178.6 1.7 193.9 1.9
Source: BPS
(4) Macro Economic Trends
After performing very strongly for many years, the Indonesian economy was badly hit by the economic crisis which started in mid 1997.
After GDP growth had reached over 8 percent in the first half of the 1990s, growth slowed in 1997 before contracting by about 13 percent in 1998 with a very modest recovery in 1999. Recovery began in 2000, with growth between 4 and 5 percent, based largely on growth in consumer spending and exports and this has continued into 2001 despite the political uncertainty in the middle of the year.
Before the crisis, the engines of growth differed by region of Indonesia. Java was fueled by manufacturing, construction and real estate. Kalimantan and Sumatra by oil and estate developments and Bali by tourism. Other, poorer areas, were fueled by infrastructure spending.
(5) National Development Plan
a) GBHN/PROPENAS GBHN (Broad State Guidelines) and PROPENAS (the 5Year Plan), together set out the basis for national development planning in Indonesia.
To accomplish its goals within Propenas, and based on GBHN, GOI has developed 5 national priorities. One of the key priorities, is the need to accelerate economic recovery and strengthen sustainable development.
Specifically, the general objectives of this priority policy include, by 2004: i) Growth in GDP to reach 6-7 % ii) Inflation to be between 3-5 percent iii) Unemployment to fall to 5 percent iv) The poorest section of the population to fall to under 14 percent
b) Sector Development Plans
18-9
High GDP growth in Indonesia was partly associated with ‘bubble-type’ industries including construction, utilities and services. Moreover, non-oil manufacturing had concentrated in electronics, shoes, textiles and garments, all of which relied heavily on imports of raw materials or components.
Domestically owned firms that relied on domestic inputs fared relatively badly, and for example, palm oil and wood based industries were subject to quotas and export taxes.
Oil and gas exports made up less than 20 percent of total exports by value and were subject to volatile world prices, although being priced in US dollars gave substantial support to the national budget.
c) Exports Since 1995, total exports by value have increased by 2 percent per year although in tonnage terms have been declining marginally, reflecting increases in higher value goods.
Due to the depreciation of the Rupiah, the value of exports in Rupiah terms has increased by over 350 percent between 1995 and 1999.
18.2.2 Purpose and Requirements for the Socio-Economic Framework
The purpose of the socio-economic framework is to provide a national development framework for the study.
(1) Macro-economy
Firstly, the framework helps in considering the national goals, from an economic perspective such as development of poorer areas, assistance to Eastern Indonesia and so on, thus ensuring that the study recommendations are consistent with the country’s macroeconomic objectives. In this regard it will assist in ensuring priority port selection is consistent with national objectives.
The development context forms a basis for the traffic forecasts.
A number of unknowns impact the making macro economic forecasts. For example, oil prices, depreciation of the Rupiah, real interest rates and decentralisation all pose risks, and of these, higher real interest rates could cause the most havoc.
Therefore, the fragile political climate and risks are reflected in the forecasts.
Table 18.2.3 Macro Economic Growth Scenarios
Base Case High Case FY 00 2001 2001 2003 2001 2001 2003
GDP % pa 4.0 4.0 4.0 4.0 4.0 5.0 6.0

18-10
A high growth case would result from greater economic and political stability and faster implementation of the reform programme.
Table 18.2.4 Trends and Forecasts in Provincial Economic Growth in Sumatra
GRDP (Rp Billions) at 1993 constant prices-Including Oil and Gas Actual Forecast
Province 1993 1996 1997 1998 1999 2000 2004 2009 2010 Est. % pa*
Riau 16,230 19,808 20,434 19,645 20,311 20,981 23,891 28,102 29,029 3.3% Jambi 2,463 3,145 3,268 3,092 3,181 3,331 4,002 5,035 5,272 4.7% S. Sumatra 10,732 13,521 14,208 13,239 13,659 14,301 17,185 21,621 22,638 4.7% Indonesia 320,908 407,314 425,614 375,949 380,763 400,182 488,279 626,155 658,089 5.1%
Percent Change 26.9% 4.5% -11.7% 1.3% 0.5% Source : BPS; Preliminary figures for 1999 and 2000 Forecast by TSSS
* % per annum 2000-2010
The following table shows similar data but in a different format.
Table 18.2.5 Growth Rates of GRDP in Sumatra
Annual Growth Rates Actual Forecast 1993-2000 1993-1996 1997-98 1998-99 2000-2010
Riau 3.7% 6.9% -3.9% 3.4% 3.3% Jambi 4.4% 8.5% -5.4% 2.9% 4.7% South Sumatra 4.2% 8.0% -6.8% 3.2% 4.7% Indonesia 3.2% 8.3% -11.7% 1.3% 5.1%
Source: BPS and TSSS
The following table shows the projected GRDP for Jambi up to 2025. Growth to 2010 is based on various national and international sources. After 2010, the Consultants have projected continuing and consistent growth.
This data has been used as the basis for the regression analysis. However, the regression analysis was of limited use since the main commodity forecasts are not related to GRDP and exports are related to world GDP or more specifically the GDP of importing countries. Imports and unloaded cargoes, which would be related to GRDP, were often relatively small in volume.

18-11
Table 18.2.6 Jambi GRDP – Historical And Projected
Jambi GRDP In Constant Prices
Year In Billion Rupiah
1989 1,850
1990 2,020
1991 2,132
1992 2,266
1993 2,463
1994 2,690
1995 2,918
1996 3,145
1997 3,268
1998 3,092
1999 3,181
2000 3,308
2007 4,563
2025 9,243
Annual Growth Rates in GRDP
2000-2007 4.7 %
2007-2025 4.0 %
Sources: BPS, Bappenas, ADB, TSSS, Consultants (2) Population
Population forecasts are based on assumptions about fertility, mortality, migration and economic development.
Current forecasts from sources such as UNDP, World Bank and GOI suggest that the longer term growth in population may be around 1.4 percent per year between 1995 and 2009. Regional growth is likely to remain higher in Sumatra and Kalimantan.
Table 18.2.7 Population Growth Forecasts by Province
Year Province 1999 2004 2009
Growth Rate in % pa
Riau 4.3 4.8 5.2 2.0 Jambi 2.6 2.9 3.1 1.9 South Sumatra 7.7 8.4 9.0 1.4
Source: BPS and TSSS
(3) Economic Prospects for Indonesia’s Major Trading Partners
World Bank indicates that Indonesia’s external environment is likely to become less favourable with world growth predicted to slow from 4% to 3 % by 2003. Further, the

18-12
growth in the economies of Indonesia’s largest trading partners is likely to slow or remain modest.
Indonesia’s largest markets are: i) North America ii) Japan iii) Europe and iv) Asia
Recent reports on the US economy indicate that a hard landing will be avoided and that there are signs of weak recovery at end 2001. The Japanese economy also remains relatively weak, with its own financial sector-restructuring programme being only slowly implemented.
The European economy also shows signs of slowing but seems likely to have a soft landing.
Asian markets are expanding but some of the developing countries in Asia have similar although not as serious structural problems as Indonesia. The newly industrialised countries in Asia have generally recovered strongly from the regional crisis that started in mid 1997. In 2000, GDP growth in some of the NICs was strong (10% and 14% in Korea and China respectively) and this is expected to continue, albeit at moderated levels.
Except for Indonesia and Thailand, GDP levels in Asia will likely recover to pre crisis levels by end 2000. Developing Asia GDP as a whole is likely to reach 6.0 % in 2001.
18.2.3 Industrial and Macro Economic Base of the Forecasts for Jambi
(1) Overview
Detailed industrial and macro economic data on Jambi province has been shown in Section 3 but further data is presented here.
Jambi is well located in Sumatra being relatively close to Singapore and having a possible role in the various growth zones or triangles such as IMS (Indonesia / Malaysia / Singapore) and SIBAJO (Singapore/Batam/Johore). Improved port access in Jambi would allow the area to benefit from development in those zones.
Natural resources in Jambi include oil, gas, coal and other minerals such as granite, kaolin and marble, as well as agricultural crops such as palm oil, pulp, tea, coffee and rubber, and higher value added fishery type products such as shrimp and shellfish.
Jambi has not developed any industry on any significant scale yet but has ambitious plans to do so under a proposed major industrial zone at Parit Culum. Initial industrial development is likely to be the processing or semi-processing of the commodities indicated above, for export or for subsequent export if finished in other regions in
18-13
Indonesia. Within the medium term, industrial development could widen significantly to include finished products, for export as well as for local and regional consumption.
(2) Parit Culum Industrial Estate
Jambi province is planning an industrial zone near Muara Sabak which would be a key development zone for the province, based on agro-forestry and other sectors and including export processing. There is no data on the level of production expected from this zone, but clearly if it were successful, the output from a 2,000 hectare area would be substantial by the year 2010.
(3) Implications For Port Development
The implications for port development are significant. The current system for much of the bulk cargoes to use private ports and loading at sea is likely to continue, and for much of the total shipping cargo to use Batanghari River. However, both in terms and of number and value, there will be an increasing need for common user port facilities for both incoming and outgoing traffic, much of which is likely to be containerised. Both containerised and non-containerised cargoes will consist of outgoing processed and semi-processed goods, and incoming of capital goods (machinery and equipment) and consumer goods for the growing economy.
(4) Use of the Industrial and Macro-Economic Data
Industrial and macro economic data and trends have been used in three ways in the forecasts:
a) Trends and forecasts for specific commodities to feed the commodity forecasts. b) Macro economic forecasts of regional/provincial GDP have been analysed and used
in the regression analyses for relevant traffic. c) Trends in industrial development in the province have also been used in the
forecasts of containerised traffic.

18-14
18.3 Cargo Forecasts
18.3.1 Introduction and Methodology
The scope of work for this study requires the Consultants to forecast future transport demand in the short term by 2007 and in the longer term by 2025.
In order to achieve those objectives, various forecasting methodologies have been applied for this study, based on the technical requirements, the port and cargo characteristics, regional aspects and the stage of the study. River ports have rather different characteristics than conventional sea-ports; hence, forecasting involves two stages.
In the first stage, for the preliminary forecasts for seven ports, the consultants considered that trends provided a suitable basis for forecasts, supplemented by commodity based forecasts.
The regional development context prepared in the Progress Report, and further expanded in the two Interim Reports, forms an essential plank of these forecasts. The preliminary socio-economic background prepared in the Progress Report remains valid but has been updated as a basis for forecasting traffic at the two priority ports.
The preliminary forecasts were reviewed for the two priority ports, and further detailed and amended as necessary, based on the current information and the results of regression analysis. As was stated at that time, regression analysis can be helpful as a further indicator, but that for specific bulk commodities it provides very little guidance.
The requirements for the two ports and the forecasts have been based on the following factors: a) National transport and port studies with up to date forecasts such as JICA Port
Study (1999) and TSSS (2000/01) and the Consultant’s reviews of the preliminary forecasts
b) Trends in cargo flows c) Regression, where this was found to be statistically sound, based on the socio
economic framework and d) Regional development plans and other information such as existing port master
plans and definite (under design or construction) new port facilities e) Trends in handling with special focus on containers f) Trends in public cargoes and in non-public cargo (khusus, rede, loading point) g) Trends in the major commodities at each port h) Discussions with major shipping, coal, timber, CPO and other companies in Jambi,
Samarinda and Jakarta i) Target commodity volumes in each location
Figures 18.3.1 and 18.3.2 outline this broad methodological approach.

BA
SE
AN
D F
OR
EC
AS
T Y
EA
RS
TR
AF
FIC
TY
PE
S F
OR
EC
AS
T
A. B
Y A
LL C
AR
GO
ES
EX
PO
RT
S/IM
PO
RT
S
TO
TA
L IN
TE
RN
AT
ION
AL
UN
LOA
DE
D/L
OA
DE
D
TO
TA
L D
OM
ES
TIC
B. A
ll C
ON
TA
INE
RS
C.
PU
BLI
C B
ER
TH
SP
ublic
Car
go
Pub
lic C
onta
iner
Oth
er S
peci
fied
carg
oes
Figu
re 1
8.3.
1 F
OR
EC
AST
ING
ME
TH
OD
OL
OG
Y F
OR
TH
E J
ICA
SE
VE
N R
IVE
R P
OR
T S
TU
DY
IN IN
DO
NE
SIA
18-15
PLU
S A
DD
ITIO
NA
L/ F
EW
ER
CO
NT
AIN
ER
S(W
here
The
re Is
Cco
mpe
titio
n F
rom
Oth
er B
erth
s)
TO
TA
L P
UB
LIC
CA
RG
O(In
clud
ing
Khu
sus
and
Pub
licC
onta
iner
s)
1. S
TA
TIS
TIC
AL
TR
EN
DS
2. R
EC
EN
T G
RO
WT
HR
AT
ES
;3.
OT
HE
R S
TU
DIE
S
1. S
TA
TIS
TIC
AL
TR
EN
DS
2. R
EC
EN
T G
RO
WT
HR
AT
ES
;3.
Rec
ent D
evel
opm
ent
For
ecas
ts4.
Exi
stin
g P
ort M
aste
rP
lans
2007
AN
D 2
025
1988
-200
0
TO
TA
L N
ON
PU
BLI
C C
AR
GO
(Incl
udin
g K
husu
s,R
ede,
Priv
ate
Con
tain
ers)
TO
TA
L C
AR
GO
-D
isag
greg
ated
by
inte
rnat
iona
l and
dom
esrti
can
d fu
rther
dis
aggr
egat
edby
exp
ort i
mpo
rt an
dU
nloa
d / L
oad
PU
BLI
C C
AR
GO
BA
SE
D O
N 2
000
VO
LUM
ES
AN
DT
YP
ES
PLU
ST
RA
NS
FE
RFR
OM
NO
NP
UB
LIC
eg
KH
US
US
,
CO
NT
AIN
ER
CA
RG
O F
OR
EC
AS
T1.
RE
CE
NT
TR
EN
DS
2.
CO
NT
AIN
ER
ISE
DC
AR
GO
3. C
ON
TA
INE
RIS
AB
LE C
AR
GO
4.
LIM
ITS
TO
CO
NT
AIN
ER
ISA
TIO
N

A. P
AS
SE
NG
ER
TR
AF
FIC
(1)
Pas
seng
ers
(2)
Pas
seng
er S
hip
Cal
ls
B. V
ES
SE
L T
RA
FF
ICS
hip
Cal
ls
-Inte
rnat
iona
l and
Dom
estic
-B
erth
Are
a/P
ublic
& P
rivat
e
Figu
re 1
8.3.
2 P
ASS
EN
GE
R F
OR
EC
AST
S A
ND
SH
IP C
AL
L F
OR
EC
AST
S
18-16
Det
erm
ine
from
Bas
e D
ata:
Tre
ndin
Cal
ls, T
onne
s pe
r C
all,
Ave
rage
GR
T a
nd L
oad
Fac
tors
by
Inte
rnat
iona
l and
Dom
estic
/Pub
lic&
Priv
ate
Fore
cast
Max
imum
GR
T a
t eac
h P
ort b
yR
equi
red
For
ecas
tTy
pe b
y Y
ear
Fro
m C
argo
For
ecas
t
App
ly g
row
th fa
ctor
s to
tonn
es p
erca
ll fro
m m
axim
um G
RT
and
futu
re L
oad
Fac
tors
Pas
seng
er S
hip
Cal
ls in
200
7 an
d20
25
(1)
By
Tren
ds a
nd O
ther
Stu
dies
(2)
By
Ass
umed
Pas
seng
erIn
terc
hang
e
By
Ass
umed
Pas
seng
erIn
terc
hang
e pe
r C
all
For
ecas
t shi
p ca
lls b
ypu
blic
priv
ate
and
by b
ert
area
FOR
EC
AS
T FO
R 2
007
AN
D 2
025
Fore
cast
Shi
p C
alls
in 2
007
and
2025
by
Inte
rnat
iona
lan
d D
omes
tic

18-17
18.3.2 Traffic Forecasts - General Approach
Cargo forecasts are made for each target year (i.e., short term by 2007 and long term by 2025).
Estimates of long-term cargo traffic reflect the concept that cargo is not likely to expand indefinitely. For example, 7 % growth every year over 25 years means an increase of 5 times the base year volume.
The impact of any likely changes in the provision of port facilities, and their impact on port traffic are taken into account. This includes proposals by the public or private sector, and proposal which may be anticipated as part of this project’s recommendations.
It should be remembered that the projections for 2025 are indicative estimates rather than definitive projections.
For each target year, the forecasts are prepared as follows: i) Total cargo, in tonnes, through the channel by: International-by Imports and Exports
Domestic-by Unload and Load ii) Total cargo, in tonnes, at the public port facilities by:
Container Remaining General cargo Specific Bulk Cargoes, mainly coal, CPO and logs and timber
18.3.3 General Assumptions for the Cargo Forecasts for Jambi
(1) All forecasts are related to the port development scenarios in this report. However, the forecasts are unconstrained (i.e., limitations of berths, channel or other constraints on achieving the forecast are not taken into account).
(2) Jambi has a natural hinterland but no impact is assumed by attraction or diversion of cargoes to/from other ports since, unlike Samarinda, there is no clear basis for making such an assumption. Even with continued draught limitations for the foreseeable future, we believe traffic is likely to be transhipped at Singapore, Batam or Jakarta rather than diverted to road or to other ports.
(3) For some cargoes, such as CPO there could be competition between neighbouring ports such as Kuala Enok. However, the port hinterland for public port facilities will remain largely as now (i.e., Jambi Province). Modern and efficient port facilities in the province are likely to attract traffic rather than lose traffic to other Sumatran ports.
The traffic forecasts try to follow a middle path between being too optimistic about attracted traffic and too pessimistic related to losing traffic should other neighbouring ports be developed.

18-18
(4) For each port, trend-based and regression analysis were undertaken. Where the statistical relationships for cargo were strong (R2 >0.75) they were used. However, if the relationships were weak, recent trend data, as well as master plans and other sources referred to above were used.
(5) These forecasts constitute a middle or best estimate scenario. Sensitivity analyses or other scenarios can be prepared for more optimistic and less optimistic total cargo scenarios in the feasibility study stage. In some cases, a variety of sub-scenarios for the division of public/private cargoes or distribution between port areas is considered.
(6) The forecasts assume continued macro economic recovery, as noted in the Progress Report, and no major economic or social dislocation. Where regression is used, such recovery is explicit and where trends are used such recovery is implicit.
The socio economic framework in Section 6.2 provides the basis for the forecasts and assumes average national GDP growth of between 4 and 5 % between 2001 and 2003 moving up to 5 % by 2005 and perhaps reaching 6 % to 7 % by 2009. On this basis, GDP and GRDP is expected to average about 5 % per year between 2000 and 2010.
(7) The base year, using existing data, is 2000.
(8) The target forecast years are 2007 and 2025.
(9) Modification of the initial forecast of international and domestic cargo is made to explicitly estimate:
Major bulk commodities Containers Cargoes through the public berths
(10) Commodities
All the commodities handled at Jambi (as itemised by the port) have been assessed. The main forecasts include only those commodities that either make up a significant proportion of total traffic (i.e., more than 10% currently), or those that will become significant in the future. These commodities include logs and wood products, pulp, CPO, coal, fertiliser and fuel/oil.
A further forecast is prepared, cross referenced against the initial one, that includes all the itemised commodities.
This also includes an analysis of ‘containerisability’ which shows the likely maximum percentage of containerisation assuming that any commodity that can be containerised will be containerised. Since this theoretical maximum is unlikely to be reached, the containerisability percentage acts as a check on Study forecasts.
(11) Containers

18-19
Container traffic has been expanding rapidly at most ports. Currently in Jambi, containers are handled at two types of locations: public port (Talang Duku) and dermaga khusus (various private wharves).
The assumptions for future proportion of containers handled in the public/other terminals are described below.
Tonnage has been converted to TEUs by assuming, from the medium term at the latest, 10 tonnes per TEU (average of full and empty) which is consistent with current port data in each port. This assumption is necessary because we note a wide variability in tonnes per TEU, even in the same port where containers are handled in different locations, and that usually the lower the container volume the lower the tonnes per TEU. However, our review of the 7 river ports, other Indonesian sea ports and Jambi container operations show a remarkable tendency to between 10.0 –11.0 tonnes on average per TEU. Hence, 10.0 tonnes per TEU is used in the Jambi port forecasts.
(12) Public Berth Cargo Forecasts
Recent trends in public cargo movements are not consistent and often not well documented.
Thus, it is also considered that, if new port facilities are provided, and management, marketing, productivity and tariffs are appropriate, then some private/khusus wharf operators may find it cheaper and more convenient to ship cargoes via the public port. A modern port will also encourage shipping companies to offer proper liner services, rather than the sometimes ad hoc operations in smaller ports, and this in turn should attract some producing companies to use these services. The very nature of the change in the economic structure in Sumatra (and Kalimantan) to produce higher value added processed or semi-processed products will also encourage diversion to container and public port services.
Therefore, varying levels of diversion of non-public berth traffic to the public port is entirely appropriate and this was also the approach taken in the Jambi port Master Plan.
Therefore, it is assumed that a proportion (9 % in Jambi) of the forecast total cargoes will transfer to the public port. In order not to over estimate these transferred cargoes, the forecasts start introducing such cargoes from 2006/7, assuming new/upgraded facilities might be available from that date. They are also introduced at a reduced rate so that the maximum of 9 % is only reached in 2009.
18.3.4 Specific Assumptions of the Traffic Forecasts for Jambi
The following specific assumptions have been made related to Jambi cargoes:
i) Jambi province will experience continued economic growth and generate substantial cargoes through its ports

18-20
ii) Coal, CPO and Pulp will be major growth export commodities iii) Traffic in Logs and timber products will grow only slowly iv) Currently, branch ports at Jambi operate at three main locations: Talang Duku,
Kuala Tungkal and Muara Sabak. Loading (ship to ship) outside the outer bar also takes place. However, public cargo is only handled at one common user facility at Talang Duku, the remaining areas being private facilities.
v) Kuala Tungkal traffic will largely continue to operate as it does now and will continue only to send out cargo from private wharves for the foreseeable future
vi) Kuala Tungkal will handle all the sea passenger traffic for Jambi, as at present, and this will continue to grow quite strongly
vii) Container traffic will be developed at the public facilities of Muara Sabak and container traffic will continue to grow at Talang Duku (although it may lose some traffic for a few years after Muara Sabak is opened)
viii) Some private wharf traffic is very likely to transfer to the public port because: - Regular liner services for container will become more established calling
mainly at the public wharves - The improved port facilities will attract some of these cargoes - Larger volumes of cargoes will require expenditure on more capital intensive
equipment ix) Kuala Tungkal cargo will not use Muara Sabak port due to the distance up river to
Muara Sabak and the ship size limitations which will remain there x) At present, Talang Duku only handles about 30 % of ALL containers. It is assumed
that by 2025 the public port facilities in Jambi will handle 50 % in the Study base case and perhaps 70% in the Study higher public container scenario
xi) It is also assumed that after implementation of this project, Talang Duku will handle 35 % of PUBLIC containers and Muara Sabak the remaining 65 % in the Base Case
xii) It is also assumed that after implementation of this project, Talang Duku will handle 25 % of PUBLIC containers and Muara Sabak the remaining 75 % in the Higher Case, as the additional containers are likely to go through Muara Sabak
18.3.5 Methodology for Jambi Port Cargo Forecasts
The forecasts for Jambi port are prepared as follows. i) Trends in port cargo are prepared for the previous 12 years (i.e., 1988 to 2000). This
data cover all cargoes through the public port and registered by the port as using private wharves.
ii) Cargo is also analysed by commodity from 1995 to 2000 and trends noted. iii) Meetings were held with shipping companies and major commodity producers to
identify how and where cargo is handled, operational problems and opportunities that might affect public port usage in the future and trends in production and shipping.
iv) Visits were also made to the public port and some private wharves areas to understand operational handling characteristics (i.e., how, what and where cargo is currently handled).

18-21
v) Total cargo (disaggregated by international and domestic) handled in previous years was also regressed against GRDP (Gross Regional Domestic Product) as well as national GDP to establish a correlation between cargo and economic factors. However, the regression analysis was of limited use since, for example, the main commodity forecasts are not related to GRDP and exports are related to world GDP or more specifically the GDP of importing countries. Imports and unloaded cargoes, which are related to GRDP, were often relatively small in volume.
Therefore, in some cases, the regression was a useful check on the forecasts made, but in other cases it was not. Cargo was also shown not to be correlated with national GDP in most cases.
vi) Where the regression could show a positive link (i.e., an R2 of greater than 0.75) the resulting cargo forecast based on forecast GRDP (shown in the socio economic framework) was compared with the forecasts based on trends made in preliminary study.
vii) In the case of international cargoes, GRDP was shown to be correlated with cargo and the original forecasts were modified. However, in some cases the forecasts appeared excessive especially in the last 10 years of the period, 2015 to 2025, and a compromise was made between realistic trends and the results of the regression.
18.3.6 Cargo Traffic Forecasts for Jambi Port
Table 18.3.1 provides an overview of the traffic forecasts.
Table 18.3.2 shows the summary of the results of the cargo forecast in relation to the development of container traffic. It assumes that there will be no public port at Muara Sabak in 2000. It also assumes: i) That the proportion of public containers will increase from the current 30% to 50 %
n the base case and to 70% in the Higher Scenario. ii) That as the proportion of public containers increases, the additional containers will
be handled at Muara Sabak and hence the percentage at Muara Sabak will rise. iii) The maximum containerisability is the maximum theoretical level assuming that
any commodity that can be containerised, will be containerised. iv) That the percent containerised is the Study team’s estimate of actual
containerisation when less than the maximum, but being consistent with it.

18-22
Table 18.3.1 Jambi Cargo Forecasts
Million Tonnes per Year Growth Rate Per Year (Average)
Cargo Type 2000 (Existing)
2007 2025 2000-2007 2007-2025
International Cargo 1.06 1.6 4.0 6.0 % 5.2% Domestic Cargo 2.45 4.0 9.4 7.3 % 4.9 % All Cargo 3.51 5.6 13.4 6.9 % 5.0 % Of which: 1. Batanghari River (Public and private)
2.57
4.3
11.3
7.6 %
5.5 %
2. Kuala Tungkal (All Private)
0.95 1.3 2.1 4.6 % 2.7 %
Public Cargoes through Muara Sabak / Talang Duku
0.16 (Base) 0.16 (High)
0.39(Base) 0.47 (High)
2.34 (Base) 3.10 (High)
5.1 % 6.2 %
10.5 % 11.0 %
NOTE: Public cargoes exclude the bulk cargoes below Base and High alternatives reflect different levels of ‘winning’ of private container traffic No public port at Muara Sabak in 2000 but assumed in full operation by 2007/8 Main Commodities (Total International and Domestic in Million Tonnes) Coal 0.0 0.6 2.0 0 % 8.0 % Logs and Timber 1.2 1.3 1.5 1.2 % 0.8 % CPO 0.3 0.8 1.8 15.0 % 4.6 % Pulp 0.4 0.6 1.4 6.0 % 4.8 %

18-23
Table 18.3.2 Summary of Container Analysis
Existing Projected Average Growth (% per Year)
YEAR 2000 2007 2025 2000-2007 2007-1025 Total Containers (Teus) 37,000 79,000 406,000 11.4% 9.5 % SCENARIO 1-BASE PUBLIC CONTAINERS Per Cent Public 30% 35% 50% At Muara Sabak (65% of Public)
0 18,000 132,000 0 11.7
At Talang Duku (35% of Public)-In teus
13,000 10,000 71,000 (3.5 %) 11.5 %
Total Public Containers-Base Case-Teus
13,000 28,000 203,000 11.6 % 11.6 %
Remaining Public General Cargo* (Tonnes)
86,000 117,000 309,000 4.5 % 5.5 %
Total Public Cargo (Tonnes)
161,000 394,000 2,335,000
SCENARIO 2 –HIGH PUBLIC CONTAINERS Per Cent Public 30% 45% 70% At Muara Sabak (teus) (75% of Public)
0 26,000 213,000 0 12.4 %
At Talang Duku (25% of Public) In teus
13,000 10,000 71,000 (3.7 %) 11.5 %
Total Public Containers-High Public Case-In teus
13,000 36,000 284,000 15.7 % 12.2 %
Total Public Cargo (Tonnes)
161,000 473,000 3,145,000
Maximum Containerisability (from Commodity Forecast)
47 % 43% 48%
Per cent of cargo Containerised in our forecasts by year
7% 16 % 35 %
* Remaining General Cargo is the same in both cases
The cargo forecasts were also made on a detailed commodity basis and cross referenced against the main forecasts for consistency.
Figures 18.3.3 and 18.3.4 show the forecast in chart form related to the Base and High scenarios respectively.
Tables 18.3.3 to 18.3.5 below show traffic forecasts for Base and High, and the commodity forecast which includes the estimates of maximum ‘containerisability’ as explained above.

Figu
re 1
8.3.
3 Ja
mbi
Car
go F
orec
asts
-Bas
e Sc
enar
io
0
2000
4000
6000
8000
1000
0
1200
0
1400
0
1600
0
2000
2001
2002
2003
2004
2005
2006
2007
2008
2009
2010
2011
2012
2013
2014
2015
2016
2017
2018
2019
2020
2021
2022
2023
2024
2025
Yea
r
000 Tonnes
All
Jam
bi C
argo
All-
Excl
udin
g K
T an
d B
ulks
Publ
ic C
argo
All
Con
tain
ers
Publ
ic C
onta
iner
18-24

18-25
Figu
re 1
8.3.
4 Ja
mbi
Car
go F
orec
asts
-Hig
h Sc
enar
io
0
2000
4000
6000
8000
1000
0
1200
0
1400
0
1600
0
2000
2001
2002
2003
2004
2005
2006
2007
2008
2009
2010
2011
2012
2013
2014
2015
2016
2017
2018
2019
2020
2021
2022
2023
2024
2025
Yea
r
000 Tonnes
All
Jam
bi C
argo
All-
Exc
ludi
ng K
T a
nd B
ulks
Publ
ic C
argo
All
Con
tain
ers
Publ
ic C
onta
iner

Tabl
e18.
3.3
PR
OJE
CTE
D P
UB
LIC
AN
D C
ON
TAIN
ER C
AR
GO
ES A
T JA
MB
I PO
RT
- BA
SE S
CEN
AR
IOIn
000
Ton
nes
or u
nits
PUB
LIC
BE
RT
HS
All
BE
RT
HS
Yea
rTo
nnes
TEU
S R
emai
ning
Gen
eral
Car
go T
otal
Pub
licC
argo
Ton
nes
TEU
S
RE
DE
Exis
ting
Exis
ting
+A
ttrac
ted
1,54
1
1989
-
-
1,50
0
1990
-
-
1,55
8
1991
-
-
1,85
3
1992
-
-
1,94
0
1993
15
1
2,
016
19
9418
7
187
59
6
3%
2,66
8
1,
451
1995
177
17
7
82
8
3%
6%2,
490
1,24
4
19
9620
1
3.2%
657
20
1
170
14
58%
7%14
%3,
075
1,40
3
19
9717
1
819
17
1
240
16
8%17
%3,
507
1,69
1
19
9817
5
858
17
5
258
24
7%15
%3,
118
1,45
2
19
9920
1
769
20
1
317
29
10%
22%
3,51
8
1,
414
2000
161
75
75
13
86
16
1
248
37
7575
30.2
%7%
18%
3,70
0
1,
487
2001
173
173
90
15
85
17
6
293
42
88
90
2
30.8
%8%
20%
3,99
1
1,
561
2002
186
186
109
16
83
19
2
346
43
104
10
9
5
31.5
%8%
22%
4,34
3
1,
637
2003
200
200
131
19
78
20
9
408
51
122
13
1
9
32.2
%9%
25%
4,80
5
1,
711
2004
215
254
158
20
109
268
48
1
53
14
4
158
14
32.9
%10
%28
%5,
064
1,78
7
20
0523
2
27
219
1
2410
1
29
2
568
63
170
19
1
20
33
.6%
11%
32%
5,33
7
1,
863
2006
249
291
230
26
90
31
9
670
67
201
23
0
29
34
.3%
12%
36%
5,61
3
1,
937
2007
268
355
277
28
117
394
79
1
79
23
7
277
40
35.0
%16
%41
%5,
886
2,04
2
20
0828
8
42
630
9
3116
6
47
5
866
87
260
30
9
49
35
.7%
17%
42%
6,17
3
2,
153
2009
309
503
345
35
219
564
94
8
95
28
5
345
61
36.4
%18
%44
%6,
474
2,27
1
20
1033
2
53
738
6
3922
5
61
1
1,03
9
10
4
312
38
6
74
37
.1%
18%
46%
6,79
0
2,
438
2011
357
577
431
43
236
666
1,
137
114
34
1
431
90
37.9
%19
%47
%7,
123
2,61
6
20
1238
4
62
048
1
4824
6
72
7
1,24
5
12
5
374
48
1
108
38
.6%
20%
48%
7,47
3
2,
803
2013
413
665
538
54
256
794
1,
364
136
40
9
538
12
8
39.4
%21
%49
%7,
841
3,00
0
20
1444
4
71
460
0
6026
6
86
6
1,49
3
14
9
448
60
0
152
40
.2%
22%
50%
8,22
7
3,
209
2015
477
766
671
67
276
946
1,
635
163
49
0
671
18
0
41.0
%23
%51
%8,
634
3,42
7
20
1651
3
82
274
9
7528
4
1,
033
1,79
0
17
9
537
74
9
212
41
.8%
24%
52%
9,06
2
3,
659
2017
552
881
836
84
293
1,12
9
1,
960
196
58
8
836
24
8
42.7
%25
%54
%9,
511
3,90
1
20
1859
3
94
493
4
9330
0
1,
234
2,14
7
21
5
644
93
4
290
43
.5%
27%
55%
9,98
5
4,
158
2019
637
1012
1,04
4
10
430
6
1,
350
2,35
1
23
5
705
1,
044
338
44
.4%
28%
57%
10,4
82
4,
429
2020
685
1084
1,16
6
11
731
2
1,
477
2,57
4
25
7
772
1,
166
393
45
.3%
29%
58%
11,0
06
4,
713
2021
737
1161
1,30
2
13
031
5
1,
617
2,81
8
28
2
846
1,
302
456
46
.2%
31%
60%
11,5
57
5,
014
2022
792
1243
1,45
4
14
531
7
1,
771
3,08
6
30
9
926
1,
454
528
47
.1%
32%
62%
12,1
37
5,
327
2023
851
1331
1,62
4
16
231
7
1,
941
3,37
9
33
8
1,01
4
1,
624
610
48
.1%
34%
63%
12
,748
5,66
2
20
2491
5
14
251,
814
181
314
2,12
8
3,
700
370
1,
110
1,81
4
70
4
49.0
%35
%65
%
13,3
64
6,
013
2025
984
1525
2,02
6
20
330
9
2,
335
4,05
2
40
5
1,21
6
2,
026
810
50
.0%
35%
67%
142
50
%40
2380
%
88%
ofc
onta
iner
isab
le c
argo
es c
onta
iner
ised
but
in fu
ture
con
tain
eris
able
will
incr
ease
50%
PUB
LIC
SH
AR
E of
CO
NTA
INER
S
Gro
wth
Rat
es P
er Y
ear
1989
/94-
2000
8.9%
3.
6%16
.7%
10.0
%28
.7%
2000
-200
76.
9%4.
6%
7.5%
24.9
%20
.5%
11.4
%4.
5%13
.6%
18.0
%11
.3%
18
.0%
11.3
%
2007
-202
54.
9%6.
5%
7.5%
8.4%
11.7
%11
.7%
5.5%
10.4
%9.
5%9.
5%
9.5%
18.3
%
2000
-202
55.
5%6.
0%
7.5%
12.8
%14
.1%
11.6
%5.
2%11
.3%
11.8
%10
.0%
11
.8%
18-26
TO
TA
LJA
MB
IC
AR
GO
(All
Loca
tions
)
AL
L B
ER
TH
S
Publ
ic C
argo
es P
ublic
and
Priv
ate
Con
tain
ers
TO
TA
LJA
MB
IC
AR
GO
(Exc
ludi
ngK
uala
Tun
gkal
and
maj
or B
ulks
)
Con
tain
ers
Publ
ic
*
All
CO
NT
AIN
ER
S
Car
go (i
n 00
0 to
nnes
)
Sha
re o
fPu
blic
Con
tain
ers
Con
tain
er D
ata
As
% o
f Tot
alw
ithou
t bul
ksA
s %
all
Car
go
Tonn
es if
30%
Shar
eM
aint
aine
d
Tonn
es if
70%
Shar
eR
each
ed b
y20
25
AD
DIT
ION
AL
CO
NT
AIN
ER
S/D
IFF
30-
70%

Tabl
e 18
.3.4
PR
OJE
CTE
D P
UB
LIC
AN
D C
ON
TAIN
ER C
AR
GO
ES A
T JA
MB
I PO
RT
- HIG
H S
CEN
AR
IOIn
000
Ton
nes
or u
nits
Yea
rTo
nnes
TEU
S R
emai
ning
Gen
eral
Car
go T
otal
Pub
licC
argo
Ton
nes
TEU
S
Exis
ting
Exis
ting
+A
ttrac
ted
1,54
1
1989
-
-
1,50
0
1990
-
-
1,55
8
1991
-
-
1,85
3
1992
-
-
1,94
0
1993
15
1
2,
016
19
9418
7
59
6
3%
2,
668
1,45
1
19
9517
7
82
8
3%
6%2,
490
1,24
4
19
9620
1
657
170
14
7%14
%3,
075
1,40
3
19
9717
1
819
240
16
8%17
%3,
507
1,69
1
19
9817
5
858
258
24
7%15
%3,
118
1,45
2
19
9920
1
769
317
29
10%
22%
3,51
8
1,
414
2000
161
75
75
13
86
16
1
248
37
7575
30.2
%7%
18%
3,70
0
1,
487
2001
173
173
94
16
85
17
9
293
42
88
94
6
32.0
%8%
20%
3,99
1
1,
561
2002
186
186
117
17
83
20
0
346
43
104
11
7
13
33
.8%
8%22
%4,
343
1,63
7
20
0320
0
20
014
6
2178
224
40
8
51
12
2
146
24
35.8
%9%
25%
4,80
5
1,
711
2004
215
254
183
23
109
292
48
1
53
14
4
183
38
37.9
%10
%28
%5,
064
1,78
7
20
0523
2
27
222
8
2910
1
32
9
568
63
170
22
8
58
40
.2%
11%
32%
5,33
7
1,
863
2006
249
291
285
32
90
37
5
670
67
201
28
5
84
42
.5%
12%
36%
5,61
3
1,
937
2007
268
355
356
36
117
473
79
1
79
23
7
356
11
9
45.0
%16
%41
%5,
886
2,04
2
20
0828
8
42
639
9
4016
6
56
5
866
87
260
39
9
140
46
.1%
17%
42%
6,17
3
2,
153
2009
309
503
448
45
219
667
94
8
95
28
5
448
16
4
47.3
%18
%44
%6,
474
2,27
1
20
1033
2
53
750
3
5022
5
72
8
1,03
9
10
4
312
50
3
192
48
.4%
18%
46%
6,79
0
2,
438
2011
357
577
565
56
236
800
1,
137
114
34
1
565
22
3
49.6
%19
%47
%7,
123
2,61
6
20
1238
4
62
063
4
6324
6
88
0
1,24
5
12
5
374
63
4
260
50
.9%
20%
48%
7,47
3
2,
803
2013
413
665
711
71
256
967
1,
364
136
40
9
711
30
2
52.1
%21
%49
%7,
841
3,00
0
20
1444
4
71
479
8
8026
6
1,
064
1,49
3
14
9
448
79
8
350
53
.4%
22%
50%
8,22
7
3,
209
2015
477
766
895
90
276
1,17
1
1,
635
163
49
0
895
40
5
54.8
%23
%51
%8,
634
3,42
7
20
1651
3
82
21,
005
100
284
1,28
9
1,
790
179
53
7
1,00
5
46
8
56.1
%24
%52
%9,
062
3,65
9
20
1755
2
88
11,
128
113
293
1,42
0
1,
960
196
58
8
1,12
8
53
9
57.5
%25
%54
%9,
511
3,90
1
20
1859
3
94
41,
265
127
300
1,56
5
2,
147
215
64
4
1,26
5
62
1
58.9
%27
%55
%9,
985
4,15
8
20
1963
7
10
121,
420
142
306
1,72
6
2,
351
235
70
5
1,42
0
71
5
60.4
%28
%57
%10
,482
4,42
9
20
2068
5
10
841,
594
159
312
1,90
5
2,
574
257
77
2
1,59
4
82
1
61.9
%29
%58
%11
,006
4,71
3
20
2173
7
11
611,
788
179
315
2,10
4
2,
818
282
84
6
1,78
8
94
3
63.5
%31
%60
%11
,557
5,01
4
20
2279
2
12
432,
007
201
317
2,32
4
3,
086
309
92
6
2,00
7
1,
081
65.0
%32
%62
%12
,137
5,32
7
20
2385
1
13
312,
252
225
317
2,56
9
3,
379
338
1,
014
2,25
2
1,
238
66.6
%34
%63
%12
,748
5,66
2
20
2491
5
14
252,
527
253
314
2,84
2
3,
700
370
1,
110
2,52
7
1,
417
68.3
%35
%65
%13
,364
6,01
3
20
2598
4
15
252,
836
284
309
3,14
6
4,
052
405
1,
216
2,83
6
1,
621
70.0
%35
%67
%
199
70
%40
2380
%
88%
ofc
onta
iner
isab
le c
argo
es c
onta
iner
ised
but
in fu
ture
con
tain
eris
able
will
incr
ease
70
%SH
AR
E
Gro
wth
Rat
es P
er Y
ear
1989
/94-
2000
7.8%
39
.7%
36
.1%
20
00-2
007
6.9%
4.6%
7.
5%24
.9%
24.9
%15
.5%
4.5%
16.6
%18
.0%
11.3
%
18.0
%11
.3%
20
07-2
025
4.9%
6.5%
7.
5%8.
4%12
.2%
12.2
%5.
5%11
.1%
9.5%
9.5%
9.
5%
20
00-2
025
5.5%
6.0%
7.
5%12
.8%
15.6
%13
.1%
5.2%
12.6
%11
.8%
10.0
%
11.8
%
18-27
PU
BL
IC B
ER
TH
SA
ll B
ER
TH
SA
LL
BE
RT
HS
Publ
ic C
argo
es P
ublic
and
Priv
ate
Con
tain
ers
TO
TA
LJA
MB
IC
AR
GO
(Exc
ludi
ngK
uala
Tun
gkal
and
maj
or B
ulks
)
Con
tain
ers
Publ
ic
*
All
CO
NT
AIN
ER
S
Car
go (i
n 00
0 to
nnes
)
As
% o
f Tot
alw
ithou
t bul
ksA
s %
all
Car
go
TO
TA
LJA
MB
IC
AR
GO
(All
Loca
tions
)
Sha
re o
fPu
blic
Con
tain
ers
Con
tain
er D
ata
Tonn
es if
30%
Shar
eM
aint
aine
d
Tonn
es if
70%
Shar
eR
each
ed b
y20
25
AD
DIT
ION
AL
CO
NT
AIN
ER
S/D
IFF
30-
70%

TRAFFIC PROJECTION BY COMMODITY MAXIMUM CONTAINERISABLE ESTIMATE2000 2007 2025 2000 2007 2025
EXPORTSSawn Timber - - - Crumb Rubber 41 58 139 41 58 139 Plywood 561 550 559 561 550 559 Moulding 18 49 75 18 49 75
Pulp 127 179 382 127 179 382 General 134 215 667 134 215 667 Coal 210 700
Agricultural Exports 54 328 54 328CPO 75 181Sub-Total 880 1,389 3,031 IMPORTS 1,389 3,031 Ashphalt 2 3 10 Glue 43 64 214 - - Methanol - - Spare Parts 13 20 65 13 20 65 General Cargo 126 191 636 126 191 636 Sub-Total 184 278 925 UNLOAD Rice 4.35 5 19 4 5 19 Sugar - - - - - Flour 25 31 111 25 31 111 Salt 6 7 27 6 7 27 Other Foodstuffs - - - - - Cooking Oil 100 361 - 100 361 Fertiliser 11 21 119 11 21 60 Cement 10 12 44 10 12 44 Glue 15 18 67 - - - Fuel 400 429 730 - - - Petrol etc. 150 255 - - - Methanol 4 5 18 4 5 18 General 106 130 471 106 130 471 Logs 438 440 500 Sub-Total 1,019 1,350 2,723 - - -
1341 2716LOAD Sawn timber 16 38 75 16 38 75 Logs 68 60 80 Crude Oil 545 626 1,066 Plywood 113 150 250 113 150 250 Pulp 259 416 1,018 259 416 1,018 General 5 76 423 5 76 423 Other 67 82 458 67 82 458 Miscellaneous 50 241 - 50 241 CPO 326 675 1,625 Glue 36 44 160 COAL 390 1,300 Sub-Total 1435 2,608 6,695
2,607 6,692 Maximum Containerisable and % of Total
GRAND TOTAL 3,518 5,625 13,374 1,646 2,440 6,427 47% 43% 48%
Totals from Main Cargo Forecast
Table 18.3.5 Cargo Forecast by Commodity to 2025 and Containerisability Estimates
18-28

18-29
18.4 Passenger Forecasts
18.4.1 Introduction
Sea passenger traffic in Indonesia has been increasing very rapidly over a number of years and this is also true for most of the Study ports.
These long term high growth rates in passenger sea travel occur everywhere whether by ferry under DGLC/ASDP and private companies, and by DGSC/Pelni and private companies.
Such long-term trends provide an implicit basis for the forecasts, along with more recent trends.
It is assumed that there are several driving forces behind these trends, including movement for economic and social purposes between islands and especially between Java and Sumatra/Kalimantan, population movements (transmigration) and general economic development. The reduction in air capacity and the high cost of air travel has also impacted sea transport demand in the initial years of the economic crisis.
Further, in recent years, GOI has purchased a fleet of modern large passenger vessels and this has no doubt encouraged or allowed rapid increases in passenger flows. In the current economic circumstances, slow expansion of the fleet may conversely curtail expected expansion of passenger volumes.
The existing and forecast passenger movements have implications for port planning in two ways. Firstly, there is the need to cater for these passengers and ships. Secondly, as the Pelni and private vessels generally use cargo port berths, there is the need to coordinate and organise facilities in a manner that is safe and efficient for both passengers and cargo.
Given the likely continued expansion of passenger volumes to the levels expected, this will probably mean the development of separate passenger facilities at all ports as soon as possible and as soon as passenger volumes justify it.
18.4.2 Passenger Forecast Methodology
Given high recent demand and likely constraints on continued growth rates at this level, the Consultants have followed a middle course between these two conflicting influences.
Passenger forecasts have been made on the basis of trend analysis followed by a review of the results to take into account likely passenger developments. This should make the forecasts as realistic as possible.
Further, the recent very rapid passenger growth rates at most ports may be related to the economic crisis and may not continue at such high rates.

18-30
At a few ports in Indonesia, passenger growth has been minimal in recent years and this needs further explanation as to whether it is decline in demand due to other transport modes such as competition with express buses to/from Java or other ferries providing services or general decline. Quite likely it is based on income substitution effects since reduced income causes changes in travel modes.
All river ports to some extent, suffer from quite long and slow journeys on the river part of the trip and in fact Jambi province is served by a combination of fast ferries and facilities at Kuala Tungkal and then onward by road to Jambi city and other locations(outside Kuala Tungkal). This seems a good compromise and a long and slow river journey for passengers direct to Jambi city, for example, is not suggested as part of the port plans.
Very few port studies include passenger forecasts and where there are forecasts, they are usually underestimated. It would however have been hard to predict the continued and substantial increases in sea passenger trips in the Krismon period. Therefore, our forecasts do not follow historical trends, but they still represent a robust level of demand, especially in the longer term by 2025.
Further, the forecasts will depend to some extent on the regulatory and tariff policies for sea passenger transport as well as the competitive air services and actual capacity provision for sea and air transport. Further, private sector participation and privatisation could have some impact on tariffs and capacity provision. Over 25 years such policies and impacts are impossible to predict.
Therefore, such long term forecasts are more indicative, whereas short or medium term forecasts are for planning purposes.
18.4.3 Passenger Ship Calls
Passenger ship calls are based upon the above passenger forecasts. The data on passenger ship size by GRT are very weak as these vessels are generally included in the domestic ship calls and are not disaggregated.
Nevertheless, ship calls are disaggregated by size in some ports and in others the number of calls is known. Further, the Pelni fleet, which transports a large proportion of, but not all, passengers, is also known in some detail.
Therefore, in some ways similar to the methodology for projecting cargo ship calls, the projected future passenger volume is divided by the expected passenger interchange per call. The interchange per call is based upon actual current data and supplemented by data on the existing Pelni vessel fleet. As passenger volumes increase, it is assumed that larger vessels will be placed on these routes up to the existing maximum vessel capacity. If this does not occur, there will be a larger number of smaller vessels or demand will be suppressed and both of these could occur together.
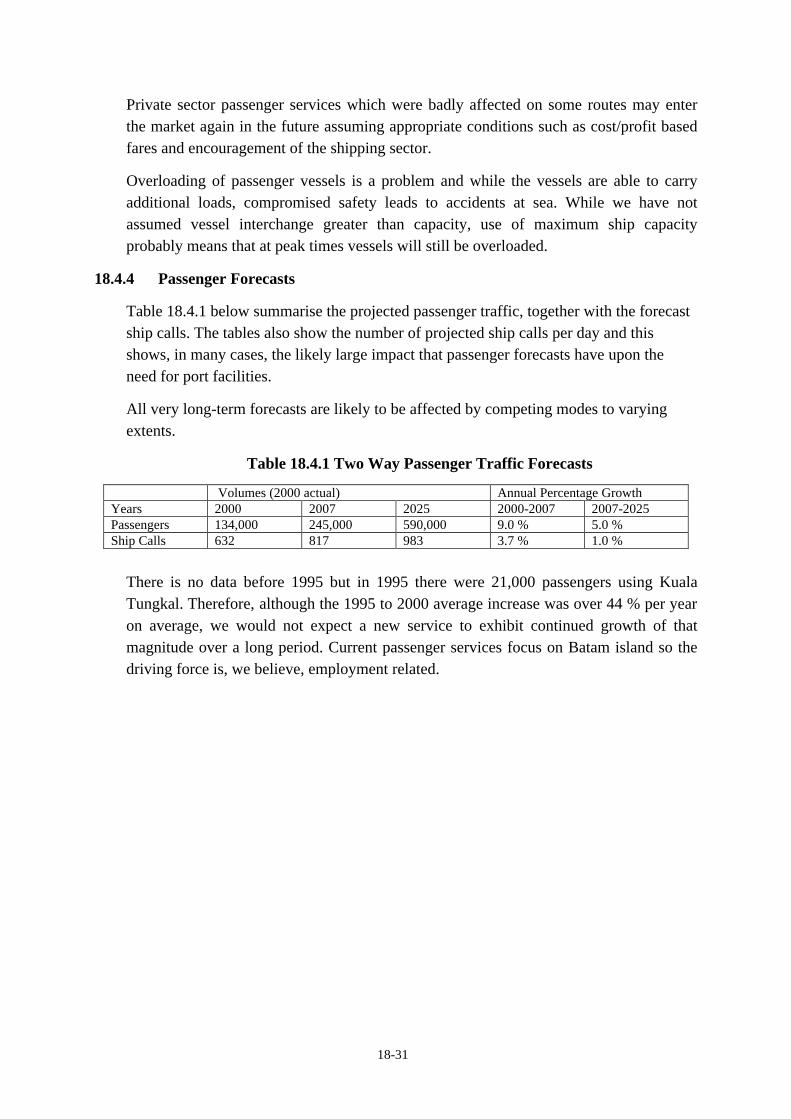
18-31
Private sector passenger services which were badly affected on some routes may enter the market again in the future assuming appropriate conditions such as cost/profit based fares and encouragement of the shipping sector.
Overloading of passenger vessels is a problem and while the vessels are able to carry additional loads, compromised safety leads to accidents at sea. While we have not assumed vessel interchange greater than capacity, use of maximum ship capacity probably means that at peak times vessels will still be overloaded.
18.4.4 Passenger Forecasts
Table 18.4.1 below summarise the projected passenger traffic, together with the forecast ship calls. The tables also show the number of projected ship calls per day and this shows, in many cases, the likely large impact that passenger forecasts have upon the need for port facilities.
All very long-term forecasts are likely to be affected by competing modes to varying extents.
Table 18.4.1 Two Way Passenger Traffic Forecasts
Volumes (2000 actual) Annual Percentage Growth Years 2000 2007 2025 2000-2007 2007-2025 Passengers 134,000 245,000 590,000 9.0 % 5.0 % Ship Calls 632 817 983 3.7 % 1.0 %
There is no data before 1995 but in 1995 there were 21,000 passengers using Kuala Tungkal. Therefore, although the 1995 to 2000 average increase was over 44 % per year on average, we would not expect a new service to exhibit continued growth of that magnitude over a long period. Current passenger services focus on Batam island so the driving force is, we believe, employment related.

18-32
18.5 Projection of Calling Vessels
18.5.1 Introduction
These forecasts are based on the base data, the forecast cargo, and the forecast maximum ship size for each port provided to the economist.
In the Interim Report 1, ship calls were forecast by total ship calls (public and non public) and disaggregated into international and domestic. In this report, due to the data needs of the Simulation model, initial forecasts and also forecast calls by port location, public and private, and by container, general cargo and the major bulk commodities were improved. Both results are internally consistent with each other.
18.5.2 Methodology for Estimating Ship Calls
(1) Analyse the last 5 years ship call data by international and domestic to provide base year data on calls, average GRT, tonnes per interchange and load factors. Cargo data either actual to 2000 (or after 2000 from the forecasts) is related to total international cargo and total domestic cargo.
(2) Estimate DWT from GRT by dividing by 0.7 (generally accepted ratio and confirmed by analysis of Indonesian ship data).
(3) Show the average GRT, cargo tonnes per call (interchange), vessel load factors for 1995-1999; (load factor is calculated by dividing the cargo tonnes handled by the total DWT capacity)
(4) Estimate the maximum GRT for each port-either from navigation rules which are available for some ports or from the estimates for the remainder
(5) Estimate the average GRT for 2007 and 2025 (based on maximum and trends). Note that for domestic, the average is usually substantially less than the maximum so there is no problem for domestic shipping. For international ships, it is estimated that the average ship size in future is between 80-90 % of the maximum.
(6) Estimate the future load factors for 2007 and 2025. For example if load factors are already high, no change; if low, some change based on trend.
(7) Modify cargo tonnes per call based on the forecast GRT and load factor growth (8) Divide the cargo forecast by the forecast cargo tonnes per call to obtain ship calls per
year (9) To obtain channel movements, ship calls must be doubled because one port call involves
a movement in and a movement out. (10) Using the updated output of the Interim Report 1 as a reference point, the projection of
ship calls, vessel sizes along with the traffic forecast is made as shown in Table 18.5.1 (11) For Jambi, there is another step as it is necessary to know the volume of traffic at the
difficult navigation section of river between Muara Sabak and Talang Duku. We have therefore estimated the traffic at Muara Sabak and Talang Duku/Jambi city according to the maximum GRT and the cargo estimated at these two locations. Although the

18-33
estimate is only approximate, it gives a reasonably good indication of the ship size and volume at these two locations. All Talang Duku/Jambi traffic must traverse the narrow and bending section of river.
18.5.3 Limitations of the Forecasts
(1) Ship call baseline data is not very reliable for ship call projection and is often only sufficiently disaggregated for very broad estimates of total international and domestic ship calls
(2) Although, Jambi is a smaller port, it turned out that the traffic is related to three distinct areas (namely, Kuala Tungkal, Talang Duku/Jambi and the downstream area of the Batanghari River in the Muara Sabak area). It was not easy to confirm that ship calls and cargo traffic had been recorded on exactly the same basis hence inconsistencies easily arose.
(3) 1995 to 1999 data includes the economic crisis in Indonesia (although 1995 and 1996 were normal years). While there is some variation in cargo volumes over that period, ship calls and ship sizes may have been more erratic.
(4) Also at Jambi, in extended dry periods, the river level drops even more than usual and can affect historical ship size and volumes.
(5) Maximum/Average GRT is based on: a) existing navigation rules
b) estimates based on ship sizes and channel characteristics c) adjustment where current average GRT is already very high,
relative to provided or derived maximum GRT in a. or b. above.
In some ports, the current, average GRT (especially for international ships) is greater than the stated or estimated maximum GRT. One reason is that ship calls at ‘loading point at sea’ or ‘rede/channel loading’ are included in total calls which would have the effect of over-estimating ship size. We have now excluded such traffic where it has a severely distorting affect as in Jambi. Tidal operations also impact this discrepancy and it is probable that both factors are at work.
Another reason may be because load factors for international ships appear quite low possibly suggesting larger vessels are part loaded when calling at smaller ports or inaccurate data. The load factors for the period 1995 to 1999 were reviewed and any trend assessed.
18.5.4 Other Factors
Whether ship calls increase, depends on the relative size of cargo growth relative to the increase in ship size or change in load factors. Therefore, the ship call forecast depends on both the growth in cargo and other factors.
18.5.5 Passenger Ship Calls

18-34
In addition to the forecast of cargo ships, the passenger ship forecast, estimated in Section 3.2 above, is shown. In Jambi, passenger ships are completely separate from the projected calls at Muara Sabak and Talang Duku, and hence are independent of cargo ship calls.
18.5.6 Ship Call Projections
The following tables show the estimated ship call and average GRT data with the relevant assumptions attached to each table.
Table 18.5.1 Forecast of Ship Calls according to Location and Main Handling Type (With Project, High Case)
SHIP CALLS AND CARGOES 2000 Location Cargo Type Cargo Volume
(000 tonnes) Ship Calls Average GRT
(not average tonnes) Talang Duku General 80 720 250
(Public) Container 130 260 50 (teu) Private Wharves
(Up stream Batanghari River )
General 2,214 812 1,745
Muara Sabak (Downstream)
General Cargo 146 260
438
Total 2000 All Cargoes 2,570 2052 908
Note: Private containers not distinguished by river location so all included as general cargo
SHIP CALLS AND CARGOES 2007
Location Cargo Type Cargo Volume (000 tonnes)
Ship Calls Average GRT
Talang Duku General 29 60 350 (Public) Container 89 73 1,000
Bulks (Coal/CPO) 719 512 1,150
Jambi Upstream General 453 290 1,090 Private Bulks (Coal/CPO) 419 293 1,150
Muara Sabak
Public General Cargo 88 85 900 Container 267 200 1,020
Muara Sabak Private
(Downstream) General Cargo 2,109 945 1,600
Bulk (Coal) 100 50 2,000
Total 2007 All Cargoes 4,273 2,508 1,258 Note: ‘With’ project, High Case; Tables on simulation give with and without project and high low scenarios to
avoid duplication

18-35
Table 18.5.1 (Continued) SHIP CALLS AND CARGOES 2025
Location Cargo Type Cargo Volume (000 tonnes)
Ship Calls Average GRT
Talang Duku Port General 77 120 750 (Public) Container 709 552 1,100
Bulks (Coal/CPO) 1,367 971 1,200
Jambi – private (Upstream)
General 262 185 1,200
Bulks (Coal/CPO) 967 722 1,260
Muara Sabak Public Port
General Cargo 232 48 3,300
Container 2,127 474 3,700
Muara Sabak Private
(Downstream)
General Cargo 4,333 773 3,855 Bulk (Coal) 1,200 217 4,500
Total 2007 All Cargoes 11,274 4,062 2,180
NOTE: From 2007, Batanghari private/khusus traffic is divided into upstream, called Jambi (city) area and
downstream called Muara Sabak area.
Data excludes Kuala Tungkal.
These data have been adapted to fit the simulation analysis’s data requirements and therefore may
not correspond in every case to other sources in this report.


![RED 17 Port [Converted]](https://img.dokumen.tips/doc/110x75/623a817e295fb240b62b7003/red-17-port-converted.jpg)


