Embed Size (px)
Citation preview

17 / 2145===

ANNEXURE
ENVIRONMENTAL STATEMENT FORM-V(See rule 14)
Environmental Statement for the financial year ending with 31st March -2019PART-A
1. Name and address of the owner/occupier of the industry /operation or process.
Shri Rajendra Jain,Executive Director,West Coast Paper Mills Ltd., Bangur nagar, Dandeli.
2. Industry category Primary-(STC Code) Secondary- (STC Code) -
3. Production category Units. 3,20,000 MT/A
4. Year of establishment 1955
5. Date of the last environmental statement submitted. 18-09-2018
PART -BWater and Raw Material Consumption
2017-2018 2018-2019
(I) Water consumption, m3/d
Process 26,615 20,081
Cooling 35,454 27,622Domestic (Mill colony + To villages + employees drinking inside premises) 5,437 5,873
Process water consumption per unit of productsDuring the previous financial year During the current financial year
Products
2017-2018 2018-2019
Paper & Paper boards 75 63
(II) Raw material consumption:Name of Raw materials Name of product Consumption of raw material per unit of
output
2017-2018 2018-2019
Attached as ANNEXURE –I
PART-CPollution discharged to environment/unit of output
(Parameter as specified in the Consent issued)Pollutants Quantity of Pollutants
discharged(Mass/day)
Concentration of Pollutants discharged
(Mass/volume)
Percentages of variation from prescribed standards
with reasons
(a) Water Attached as ANNEXURE -II
(b) Air Attached as ANNEXURE -III
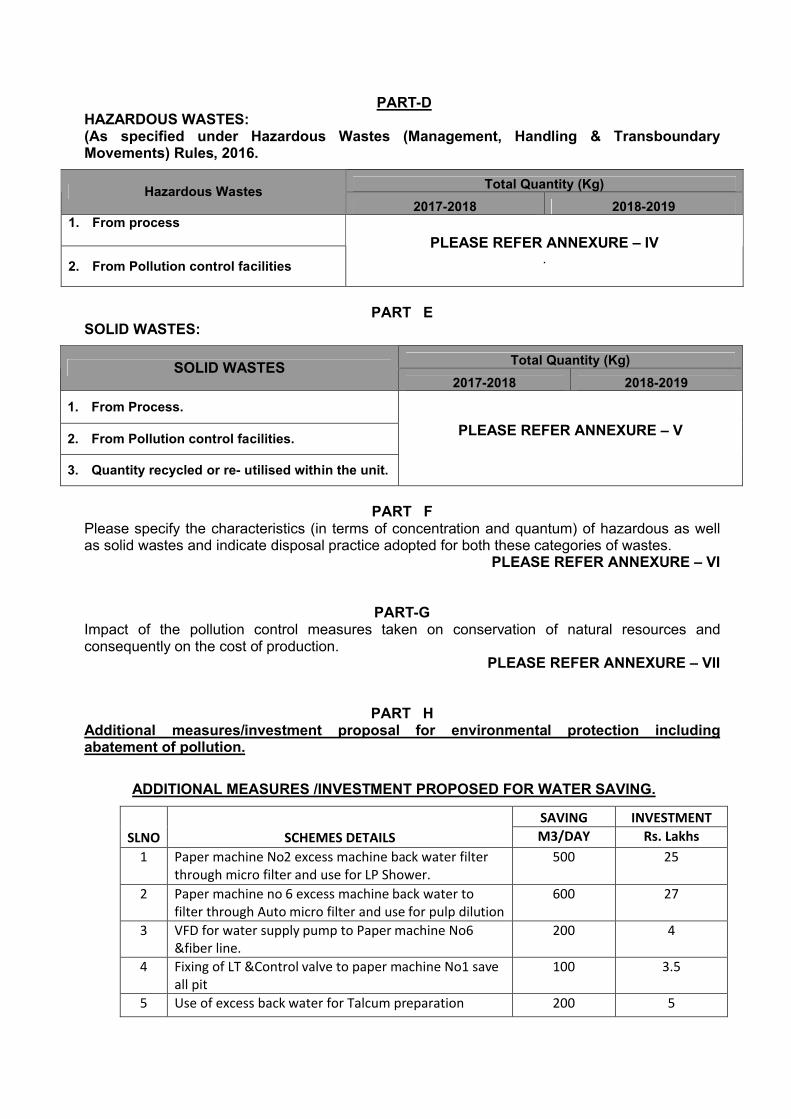
PART-DHAZARDOUS WASTES:(As specified under Hazardous Wastes (Management, Handling & Transboundary Movements) Rules, 2016.
Total Quantity (Kg)Hazardous Wastes
2017-2018 2018-20191. From process
2. From Pollution control facilities
PLEASE REFER ANNEXURE – IV.
PART ESOLID WASTES:
Total Quantity (Kg)SOLID WASTES2017-2018 2018-2019
1. From Process.
2. From Pollution control facilities.
3. Quantity recycled or re- utilised within the unit.
PLEASE REFER ANNEXURE – V
PART FPlease specify the characteristics (in terms of concentration and quantum) of hazardous as well as solid wastes and indicate disposal practice adopted for both these categories of wastes.
PLEASE REFER ANNEXURE – VI
PART-GImpact of the pollution control measures taken on conservation of natural resources and consequently on the cost of production.
PLEASE REFER ANNEXURE – VII
PART HAdditional measures/investment proposal for environmental protection including abatement of pollution.
ADDITIONAL MEASURES /INVESTMENT PROPOSED FOR WATER SAVING.
SAVING INVESTMENTSLNO SCHEMES DETAILS M3/DAY Rs. Lakhs
1 Paper machine No2 excess machine back water filter through micro filter and use for LP Shower.
500 25
2 Paper machine no 6 excess machine back water to filter through Auto micro filter and use for pulp dilution
600 27
3 VFD for water supply pump to Paper machine No6 &fiber line.
200 4
4 Fixing of LT &Control valve to paper machine No1 save all pit
100 3.5
5 Use of excess back water for Talcum preparation 200 5

SAVING INVESTMENTSLNO SCHEMES DETAILS M3/DAY Rs. Lakhs
6 Heat exchanger to provide for FFE condensate &use cooled water for New CD filter pump sealing
500 25
Total Fresh water saving M3/Day 2000 89.5 Lakhs
PART IAny other particulars in respect of environmental protection and abatement of pollution.
IMPLEMENTATION OF VARIOUS IN PLANT MEASURES FOR ENVIRONMENTALPROTECTION INCLUDING ABATEMENT OF POLLUTION:
1. All 6 presses hydraulic cooling water has been collected. Started reusing back in system.
2. Machine No. 4 back water collection and reuse in pulp mill scheme.
3. A scheme has developed for reusing machine 3 Mark save-all water.
4. Replacement of sealing make up mill water with used water i.e. with Enmas Boiler ID fan-A
hydraulic coupling oil heat exchanger outlet water.
5. Collection and recirculation of pump sealing water at BHEL Recovery Boiler.
6. Fresh water conservation of Enmas Boiler pumps and ID fan fluid coupling cooling water.
7. All condensate lines diverted from old condensate tank to new condensate tank and
existing MS lines replaced by SS lines.
8. System implemented to supply excess back water to Pulp Mill.
9. Three way valve is fixed in clear condensate line.
10. Reduction of make up water consumption for FFE-I water conservation system by diverting
RLK-I idler cooling water to water conservation pit.
11. Recycling of FFE-II vacuum pump sealing water.
12. Conservation of fresh water by utilizing Evaporator condensate.
13. Strengthening / modification of FFE-I existing water conservation system by installing a new
5m3 cap tank on ground floor, providing LT and LCV to tank to avoid wastage of water.
14. Replacement of pumps at pump house by energy efficient pumps against old energy
saving.
15. Replacement of pumps at filter house by energy efficient pumps with VFD driven energy
saving as well as water saving motor against old inefficient pumps.
16. Replacement underground water pipe line to over head pipe from Filter house to Jack well
header from of water pipe.
17. Replacement of water header at filter house from under ground to overhead.
18. Strengthening of FFE-II existing water conservation system to further reduce water
consumption by providing LT to water collection pit and level control valve to make up water
line.
19. Hydraulic cooling water is being repumped along with excess hot water to reservoir.
20. Modification of steam and condensate system of Air Pre-heater in Enmas Boiler to achieve
reduction in steam consumption.

21. Replacement of colony pumps at filter house by energy efficient pumps against old energy
saving inefficient pumps.
22. Providing conductivity sensor along with drain valve and drain pipe to FFE 1 water outlet
pipe to mist cooling tower.
23. Usage of super clear water for Vacuum sealing instead of fresh water.
24. New type Forbes Marshal rotary joints.
25. Additional pulps wash presses in Pulp Mill.
26. Hot liquor accumulator for steam & process balancing.
27. Installation of EDI mini panel diffusers in aeration tank.
28. Revamping of both the ESPs of 1100 TPD Recovery Boiler.
29. Installation of energy efficient motors - 106 Nos.
30. PM-2 Steam & condensate system modification.
Date : 13-08-2019
Signature :
Designation : President (Tech)
Address : West Coast Paper Mills Ltd., Bangur Nagar, Dandeli- 581325
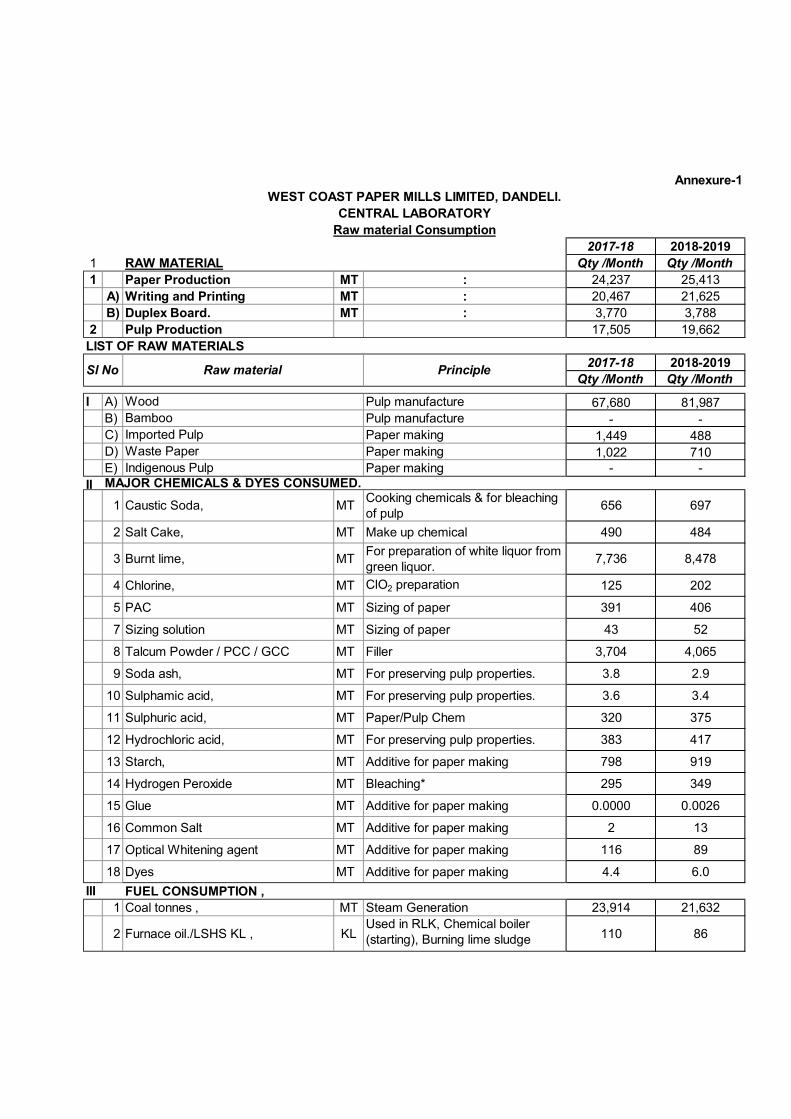
Annexure-1
2017-18 2018-20191 RAW MATERIAL Qty /Month Qty /Month1 Paper Production MT : 24,237 25,413
A) Writing and Printing MT : 20,467 21,625B) Duplex Board. MT : 3,770 3,788
2 Pulp Production 17,505 19,662LIST OF RAW MATERIALS
2017-18 2018-2019Qty /Month Qty /Month
I A) Pulp manufacture 67,680 81,987B) Pulp manufacture - -C) Paper making 1,449 488D) Paper making 1,022 710E) Paper making - -
II
1 Caustic Soda, MTCooking chemicals & for bleaching of pulp
656 697
2 Salt Cake, MT Make up chemical 490 484
3 Burnt lime, MTFor preparation of white liquor from green liquor.
7,736 8,478
4 Chlorine, MT ClO2 preparation 125 202
5 PAC MT Sizing of paper 391 406
7 Sizing solution MT Sizing of paper 43 52
8 Talcum Powder / PCC / GCC MT Filler 3,704 4,065
9 Soda ash, MT For preserving pulp properties. 3.8 2.9
10 Sulphamic acid, MT For preserving pulp properties. 3.6 3.4
11 Sulphuric acid, MT Paper/Pulp Chem 320 375
12 Hydrochloric acid, MT For preserving pulp properties. 383 417
13 Starch, MT Additive for paper making 798 919
14 Hydrogen Peroxide MT Bleaching* 295 349
15 Glue MT Additive for paper making 0.0000 0.0026
16 Common Salt MT Additive for paper making 2 13
17 Optical Whitening agent MT Additive for paper making 116 89
18 Dyes MT Additive for paper making 4.4 6.0
III FUEL CONSUMPTION ,1 Coal tonnes , MT Steam Generation 23,914 21,632
2 Furnace oil./LSHS KL , KLUsed in RLK, Chemical boiler (starting), Burning lime sludge 110 86
WoodBamboo
MAJOR CHEMICALS & DYES CONSUMED.
WEST COAST PAPER MILLS LIMITED, DANDELI.CENTRAL LABORATORY
Raw material Consumption
Sl No Raw material Principle
Imported PulpWaste PaperIndigenous Pulp

ANN- 2
Sl.No. Percentage variation Quantity Pollutant Quantity from prescribed
concentration std. with reason.Kgs / d. kgs/d
1 Flow, m3/day 85,885 - 45,415 -
2 Colour & Odour All efforts to remove colour & - Light Brown and -
odour as far as practicable odourless
3 Suspended solids mg/l 50 [max] 4,294 26 1,181 -73
4 Dissolved solids [inorganics] mg/l 2,100 [max] 180,359 713 32,381 -82
5 pH value 7.0 to 8.5 - 7.2 -
6 Oil & Greese mg/l 10 [max] 859 Nil Nil -100
7 Total residual Chlorine mg/l 1.0 [max] 86 Nil Nil -100
8 Ammonical Nitrogen [as N] mg/l 50.0 [max] 4,294 Nil Nil -100
9 Total Kjeldhal Nitrogen [as N] mg/l 100 [max] 8,589 1.2 54 -99
10 Free Ammonia [ as NH3] mg/l 5.0 [max] 429 Nil Nil -100
11 BOD5 at 20°C mg/l 30.0 [max] 2,577 16 727 -72
12 COD mg/l 250.0 [max] 21,471 131 5,949 -72
13 Chloride [as Cl] mg/l 350 [max] 30,060 156 7,085 -76
14 Dissolved Phosphate [as P] mg/l 5.0 [max] 429 Nil Nil -100
15 Sulphate [as SO4] mg/l 1,000 [max] 85,885 58 2,634 -97
16 Sulphide [as S] mg/l 2.0 [max] 172 Nil Nil -100
17 AOX kg/T 1.0 [max] 850 0.15 131 -85
(as specified in consent issued) Tolerance Limitof pollutants
concentration.
STATEMENT OF POLLUTION DISCHARGED TO ENVIRONMENT - WATER (2018-2019)ANNEXURE - II
Pollutants Stipulated Std. (as specified in consent) Pollutants discharged
Page 1

% Variation
Tollerence Tollerence Tollerence
Limits Limits Limits
1 Chemical Rec. Boiler-I SPM 3,000,000 2,513,308 150 64 450 161 -71
H2S - - 10 0.87 30 2 -92
2 Chemical Rec. Boiler-II SPM 5,417,280 3,428,534 150 72 813 247 -79
H2S - - 10 1.07 54 4 -95
3 Rotary Lime Kiln -I SPM 480,000 180,590 150 12 72 2 -98
4 Rotary Lime Kiln -II SPM 950,400 241,066 150 15 143 4 -98
5 F.B.C. boiler -I SPM 2,208,000 Shut 150 shut 331 shut -
6 F.B.C. boiler -II SPM 2,973,888 Shut 150 shut 446 shut -
7 F.B.C. boiler -III SPM 3,323,520 2,666,142 150 56 499 149 -82
8 F.B.C. boiler -IV SPM 3,458,592 2,980,438 150 63 519 188 -72
Pollutants Concentration,
mg/Nm3
SPM Quantity, kgs/D
Achieved Achieved Achievedfrom
Prescribed Std.
Part CSTATEMENT OF POLLUTION DISCHARGED TO ENVIRONMENT -AIR FROM
APRIL 2018-MARCH 2019Annexure -III
Sl.N
o.
Stack
Pol
luta
nts
Rate of Discharge,
Nm3/d

Part - D ANNEXURE - IV
SL.NO
DESCRIPTION OF SOLID WASTE
Qty KL 2018-19
DISPOSAL PRACTICE.
1 Lubricating Waste Oil 31.000
Taken by the Party having necessary approval from KSPCB, Bangalore,for reprocessing.
2 Waste Oil Sludge Nil -
WEST COAST PAPER MILLS LIMITED, DANDELI.
The Hazardous waste generation & disposal method is given hereunder:

ParticularsTotal Quantity
generated,
MT/Annum
Quantity Recycled
MT/Annum
Quantity Sold,
MT/Annum
Quantity filling
in abondoned quaries
MT/Annum
Total Quantity
generated,
MT/Annum
Quantity Recycled
MT/Annum
Quantity Sold,
MT/Annum
Quantity filling
in abondoned quaries
MT/Annum
A From Process
1 Saw Dust 13,187 2,299 10,888 - 16,179 3,324 12,855 -
2 Lime Sludge 144,609 144,609 - - 155,236 155,236 - -
3 Lime Grits containing Classifier grits
1,674 1,674 - - 1,912 1,912 - -
4 Dregs 3,320 3,320 - - 4,105 4,105 - -
B From Pollution Control Facility
1 Dust from CRP boiler 31,282 31,282 - - 35,521 35,521 - -
2 Ash from Power House 80,775 - 80,775 - 47,695 - 47,695 -
3 Sludge from P.Mill ETP 276 - 276 - 201 201 - -
4 Sludge from P.M/c ETP 11,039 - 11,039 - 13,306 - 13,306 -
Part -EAnnexure - V
SOLID WASTE
Sl. No. 2017-2018 2018-2019
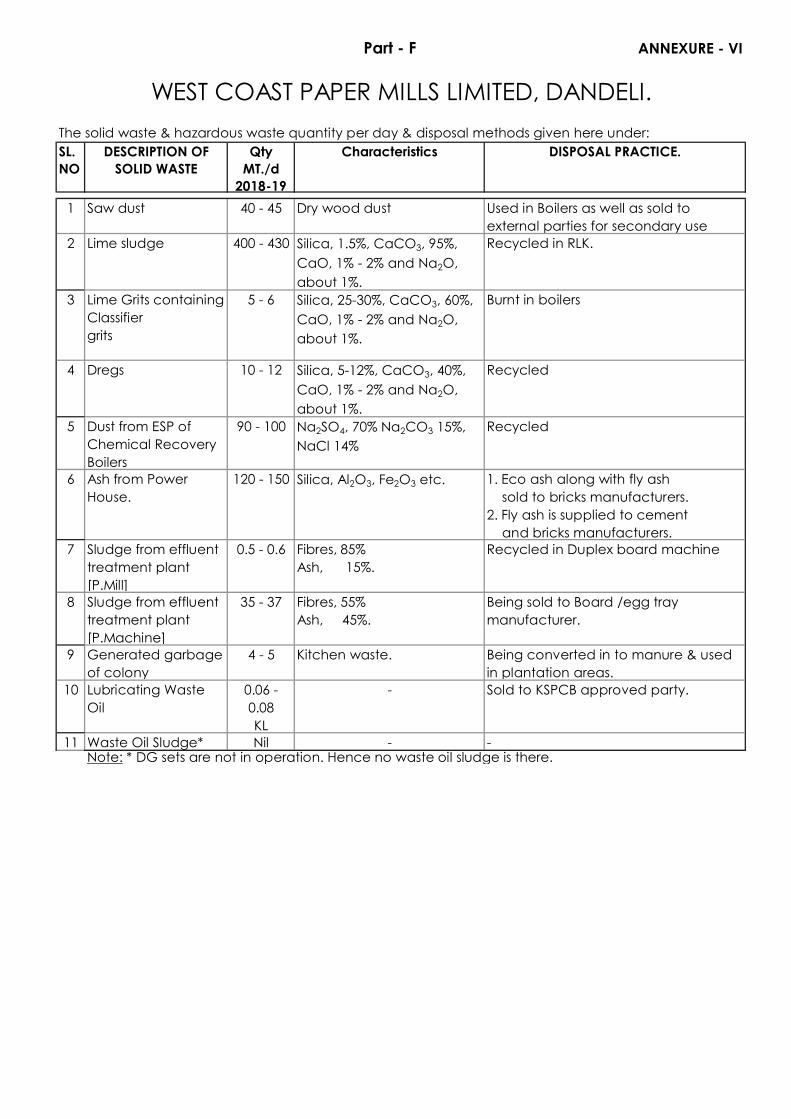
Part - F ANNEXURE - VI
The solid waste & hazardous waste quantity per day & disposal methods given here under:SL.NO
DESCRIPTION OF SOLID WASTE
Qty MT./d
2018-19
Characteristics DISPOSAL PRACTICE.
1 Saw dust 40 - 45 Dry wood dust Used in Boilers as well as sold to external parties for secondary use
2 Lime sludge 400 - 430 Silica, 1.5%, CaCO3, 95%, CaO, 1% - 2% and Na2O, about 1%.
Recycled in RLK.
3 Lime Grits containing Classifiergrits
5 - 6 Silica, 25-30%, CaCO3, 60%, CaO, 1% - 2% and Na2O, about 1%.
Burnt in boilers
4 Dregs 10 - 12 Silica, 5-12%, CaCO3, 40%, CaO, 1% - 2% and Na2O, about 1%.
Recycled
5 Dust from ESP of Chemical Recovery Boilers
90 - 100 Na2SO4, 70% Na2CO3 15%, NaCl 14%
Recycled
6 Ash from Power House.
120 - 150 Silica, Al2O3, Fe2O3 etc. 1. Eco ash along with fly ash sold to bricks manufacturers.2. Fly ash is supplied to cement and bricks manufacturers.
7 Sludge from effluent treatment plant [P.Mill]
0.5 - 0.6 Fibres, 85%Ash, 15%.
Recycled in Duplex board machine
8 Sludge from effluent treatment plant [P.Machine]
35 - 37 Fibres, 55%Ash, 45%.
Being sold to Board /egg tray manufacturer.
9 Generated garbage of colony
4 - 5 Kitchen waste. Being converted in to manure & used in plantation areas.
10 Lubricating Waste Oil
0.06 - 0.08KL
- Sold to KSPCB approved party.
11 Waste Oil Sludge* Nil - -Note: * DG sets are not in operation. Hence no waste oil sludge is there.
WEST COAST PAPER MILLS LIMITED, DANDELI.

Rs Lakhs Rs /T of paper
I Two Rotary Lime Kilns works to reburn the lime sludge and reuse the lime in process
there by eliminating the land pollution problem caused in the disposal of lime sludge. This 4,934 1,618
has also reduced the demand of Lime stone / Sea shell by around 1,34,917 MT
II To recover the cooking chemicals from the spent liquor, recovery Boilers (2 nos) are in
use. The recovered cooking chemicals are re-used in the process for pulping purpose. The
Recovery Boiler efficiently utilises the heat generated during the combustion of 20,146 6,606
spent liquor in to steam and minimises the environmental pollution problem. The Steam
generation from the Chemical Recovery Boiler in the Year 2018-19 was 15,82,152 MT
which has reduced the Coal demand by 3,51,589 MT
III The ESP provided to CRP boilers collect particulate matter from emission consisting of
Sodium Sulphate & Sodium Carbonate, which are used as make up chemical. The quantity 3,349 1,098
of ESP dust so collected corresponds to 35,521 MT .
IV Installation of FFE has reduced steam requirement by approximately 30,705 T/month
equivalent to 6,397 MT/Month of Coal. 4,399 1,442
V We are using the chipper dust as a fuel in boilers to be eco friendly. This in turn is
equivalent to 2,086 MT of Coal. 120 39
VI We are manufacturing Precipitated Calcium Carbonate for use in paper manufacturing
in place of high brightness Talcum powder. While manufacturing we are taking the flue gas
of Rotary Lime Kilns thus avoiding GHG emissions like CO2.
14,476 MT CO2 used to manufacture 32,922
MT of Precipitated Calcium Carbonate
PART - GANNEXURE - VII
Impact of Pollution Control Measures on conservation of natural resources and
consequently the cost of production.
Savings for 2018-19