Embed Size (px)
Citation preview

16/2014
Nano-Dissection and Sequencing of DNA at Single Sub-Nuclear Structures Y. Sun, D. P. Bazett-Jones, and co-workers
Gene Organization
A technique for extracting DNA from a cell nucleus is reported by Y. Sun, D. P. Bazett-Jones, and co-workers. The nano-dissection tool is shown above the specimen in a scanning electron microscope image before and after DNA extraction. On page 3267, extracted DNA is then identified by sequencing. Regions of interest identified by fluorescence microscopy are determined by correlative imaging and are precisely manipulated.
SMALL-10-16-frontispiece.indd 2 8/14/14 7:07 PM
3267© 2014 Wiley-VCH Verlag GmbH & Co. KGaA, Weinheim wileyonlinelibrary.com
Nano-Dissection and Sequencing of DNA at Single Sub-Nuclear Structures
Brandon K. Chen , David Anchel , Zheng Gong , Rachel Cotton , Ren Li , Yu Sun , * and David P Bazett-Jones *
1. Introduction
In recent years, it is accepted that spatial positioning of
chromosomes and genes within the cell nucleus is critically
important for accurate gene regulation and integrity of the
genome. However, it is unclear how multiple loci, separated
across large regions of the same chromosome, or across mul-
tiple chromosomes, are co-regulated and give rise to stable,
genome-wide transcription profi les that characterize a cell
DOI: 10.1002/smll.201400075
The relative positioning of gene loci within a mammalian nucleus is non-random and plays a role in gene regulation. Some sub-nuclear structures may represent “hubs” that bring specifi c genetic loci into close proximity where co-regulatory mechanisms can operate. The identifi cation of loci in proximity to a shared sub-nuclear structure can provide insights into the function of the associated structure, and reveal relationships between the loci sharing a common association. A technique is introduced based on the nano-dissection of DNA from thin sections of cells by high-precision nano-tools operated inside a scanning electron microscope. The ability to dissect and identify gene loci occupying a shared site at a single sub-nuclear structure is demonstrated here for the fi rst time. The technique is applied to the nano-dissection of DNA in vicinity of a single promyelocytic leukemia nuclear body (PML NB), and reveals novel loci from several chromosomes that are confi rmed to associate at PML NBs with statistical signifi cance in a cell population. Furthermore, it is demonstrated that pairs of loci from different chromosomes congregate at the same nuclear body. It is proposed that this technique is the fi rst that allows the de novo determination of gene loci associations with single nuclear sub-structures.
Gene Organization
Dr. B. K. Chen, [+] Dr. Z. Gong, Prof. Y. Sun Department of Mechanical Engineering University of Toronto M5S 3G8 E-mail: [email protected]
D. Anchel, [+] R. Cotton, R. Li, Prof. D. P. Bazett-Jones Genetics and Genome Biology Program The Hospital for Sick Children, M5G 1×8 E-mail: [email protected]
type. The location of a gene within the cell nucleus, both with
respect to other genes on the same chromosome (in cis ) or on
separate chromosomes (in trans ), and with respect to multi-
protein nuclear sub-structures (i.e., nuclear bodies or NBs),
is an actively regulated process that underlie a mechanism of
genetic control. [ 1–4 ] Examples of such locus associations are
chromosome loci associating with nuclear foci containing
high concentrations of their regulatory factors, [ 5 ] the shared
regulation of certain gene pairs requiring their inter-chromo-
somal convergence, [ 6 ] and NBs serving as regulatory centers
for the multiple convergent loci. [ 3,7 ] This has led to the idea
of the NB as a “gene hub”, [ 8–10 ] whereby the co-regulation
of multiple loci, separated across large regions of the same
chromosome or across multiple chromosomes, emerges by
virtue of their shared affi nity with a single NB.
Testing the gene hub model necessitates the identifi cation
of genomic regions that preferentially associate at a single
NB. The identifi cation of these gene locus sequences will
also provide insights into the function of the associated body,
and reveal novel co-regulatory relationships that may not
be detectable using conventional genome-wide transcription
[+] Both authors contributed equally
small 2014, 10, No. 16, 3267–3274

B. K. Chen et al.
3268 www.small-journal.com © 2014 Wiley-VCH Verlag GmbH & Co. KGaA, Weinheim
full papersprofi ling approaches. [ 11 ] Whereas fl uorescence in situ hybridi-
zation (FISH) is effective at identifying interactions between
specifi c loci or between specifi c loci and sub-nuclear struc-
tures (immuno-FISH), these methods require a priori infor-
mation for selection of loci to probe. Hence, immuno-FISH is
not appropriate for use in a naïve or unbiased context.
Although there are techniques available to detect protein/
DNA interactions, including ChIP (Chromatin Immuno Pre-
cipitaion), [ 12 ] the 3C technique and its variants, [ 13,14 ] e4C, [ 7 ]
and ImmunoTrap, [ 15 ] these approaches detect the associa-
tions of gene loci in cell populations, and are therefore not
suited for the de novo detection of pairs of loci that are con-
vergent at a single nuclear body. Moreover, there still remain
NBs, by virtue of their transience, [ 16,17 ] limited number
(e.g. embryos, [ 18 ] or structural heterogeneity within single
cells, [ 17,19,20 ] that cannot be assayed using the existing popu-
lation-based approaches. Particularly when these “aberrant”
or rare NBs occur in cell lines with concomitant genome-
wide disregulation, [ 21 ] they are particularly attractive models
for studying NBs as regulatory centers for multiple conver-
gent loci. The identifi cation of convergent sequences at these
otherwise inscrutable NBs requires an alternative approach,
one capable of determining the genomic neighbourhood of a
single NB in a single cell.
Physical extraction of sub-cellular structures under
optical microscopes using laser based microdissection [ 22 ] and
glass capillary needles [ 23 ] have been reported; however, the
minimum extractable area is limited to the micrometer scale.
Atomic force microscopy (AFM) has been used for imaging,
cutting, and extracting sub-micrometer-sized regions of an
isolated chromosome. [ 24–26 ] The use of a single cantilever tip
for both imaging and manipulation, however, leads to con-
cerns of contamination. Furthermore, material extraction
using AFM relies solely on adhesion to the sharp cantilever
tip, making the process poor in reproducibility.
We report a nano-dissection technique for determining
DNA in the immediate vicinity of a sub-nuclear structure
(e.g., NB) in a single cell. The technique involves using a
nano-manipulation system and custom made nano spatulas
for DNA extraction inside a scanning electron microscope
(SEM). The nano-manipulation system controls the motion
of nano spatulas, under real-time SEM imaging, to accurately
extract a minute amount of DNA that is then amplifi ed and
sequenced. As a proof-of-principle, we demonstrated the
technique’s feasibility in the dissection of minute volumes
in the vicinity of a single histone locus body (HLB). HLB
is an NB that has previously been shown to associate with
histone gene loci on both chromosomes 1 and 6. [ 27 ] From
nano-dissection of single HLBs in HT1080 cells, we obtained
sequences that are enriched for chromosomes 1 and 6,
including sequences within 500 kilobases (kb) and 30 kb of
their histone gene clusters, respectively.
We also applied the technique to the dissection of single
promyelocytic leukemia (PML) bodies in Jurkat cells. These
NBs have been shown to specifi cally associate with particular
gene loci in a cell population, [ 28,29 ] although it has yet to be
demonstrated that there are specifi c pairs of trans loci that
preferentially associate at a shared PML NB. Because there
are multiple PML bodies per nucleus in a mammalian cell
(typically between 10 and 20), our single body dissection
approach is ideally suited to fi nd these convergent trans asso-
ciated loci, as loci obtained via a population-based approach
would not necessarily originate at a shared body. Importantly,
the results confi rm our capability to recover multiple loci in
trans from the dissection of a single PML NB.
2. Results
DNA nano-dissection. Targeted regions within a single cell
nucleus are removed via nano-dissection inside an SEM, fol-
lowed by amplifying and sequencing of the extracted DNA.
Cell sample preparation (described in Experimental Sec-
tion) involves fi xation, immuno-labelling, post-fi xation, cryo-
ptrotection and freezing, before cryo-sectioning fi xed cells
into 300 nm-thick sections. The cell sections are fi rst imaged
by fl uorescence microscopy to locate structures of interest
before fi nding the same structures by correlative methods
in the SEM, prior to nano-dissection. Sections are supported
on a smooth and clean working surface of a doped silicon
substrate that is electrically conductive to reduce charging
effects caused by electron-solid interactions under SEM
imaging. This also mitigates the complex electrostatic force
interactions during nano-manipulation. To control for con-
taminating DNA that may be introduced to the sample prior
to PCR amplifi cation, the cells are pre-ligated with fl uores-
cent double-stranded DNA linkers that are complimentary to
primers used for the PCR (see Experimental Section).
The extraction tool, termed nano spatula, is made from
solid glass rods heated and pulled into a gradually tapered
needle, which is then precision grinded to produce a bev-
elled-shaped spatula with the tip end narrowed down to
<100 nm ( Figure 1 a, Experimental Section). The nano spatula
is then carbon coated to make it electrically conductive.
The cell sample is mounted on a piezoelectric nano-
manipulator (Figure 1 b), which provides nanometer motion
resolution along X, Y, and Z axes. [ 30 ] The assembly is then
transferred into the high vacuum chamber of SEM. The fi rst
step of the extraction process is to locate the cell of interest
by correlating the SEM and fl uorescence microscope images
(Figure 1 c,d). The target sub-nuclear region is then mechani-
cally extracted using the nano spatula (Figure 1 e-h). To ensure
the extracted biomaterial stays attached to the spatula tip
during SEM chamber venting and during manual handling, a
fi xation step called electron beam induced deposition (EBID)
is conducted to deposit a line of hydrocarbon across the bio-
material and nano spatula to enhance adhesion (Figure 1 i,j).
The SEM is then vented, and the nano spatula with adhered
chromatin fragments are carefully immersed into the buffer
solution inside a test tube. This process is repeated until all
desired sub-nuclear regions are dissected. The collected sam-
ples are then PCR amplifi ed and sequenced.
2.1. SEM Imaging, DNA Integrity, and Nano-Manipulation
Exposure to electrons of just tens of eVs is suffi cient to
alter the organic chemical and biochemical integrity of
small 2014, 10, No. 16, 3267–3274

Nano-Dissection and Sequencing of DNA at Single Sub-Nuclear Structures
3269www.small-journal.com© 2014 Wiley-VCH Verlag GmbH & Co. KGaA, Weinheim
DNA. Under electron beam irradiation inside the SEM,
DNA within the volume penetrated by the electron beam
is damaged and cannot be sequenced. Thus, minimizing the
electron penetration depth is critical, which can be con-
trolled by reducing the accelerating voltage at the cost of the
image signal-to-noise ratio. The signal-to-noise ratio can be
improved by increasing the number of irradiating electrons
(e.g., by increasing current, spot size, and aperture size), with
the trade-off of reduced imaging resolution. Increasing the
sample tilting angle also reduces electron penetration depth,
but requires image processing to compensate for the tilt-
induced image distortions. In summary, a balance between
preserving DNA’s biochemical integrity under electron irra-
diation and the ability to observe the extraction process must
be achieved.
In experiments, we systematically varied the SEM
imaging parameters (accelerating voltage, emission current,
spot size, aperture size, and sample tilting angle) and con-
ducted chromatin extraction under each set of parameters.
These parameters were correlated to the success rate of
DNA sequencing. We found that the optimal parameters for
nano-dissection are: 0.4 kV accelerating voltage, 2 to 5 µA
emission current, 50% spot size, 3 aperture size (50 µm diam-
eter), and sample tilt of 65 degrees. No accumulation of neg-
ative charge on the sample surface was observed due to the
low accelerating voltage used.
Despite the strong surface adhesion forces present
at micro and nanometer scales, [ 31 ] vibration induced by
the nano-manipulators and manual handling of the nano
spatula, and turbulence of the air fl ow from venting the
SEM vacuum chamber often detached the extracted mate-
rials from the nano spatula. To enhance the tool-sample
adhesion, the nano spatulas were constructed using different
materials (tungsten, glass, silicon, silicon dioxide, silicon
nitride), combined with chemical coating (poly-L-Lysine),
physical coating (carbon and gold fi lm), oxygen plasma
treatment, and an applied voltage to induce electrostatic
forces. However, none of these combinations provided a
consistent adhesion in the vacuum environment. Thus, we
used the EBID procedure to fi x the extracted cell fragments
onto the nano spatula. This worked effectively regardless
of the material and surface properties of the nano spatula
or the substrate. Prolonged exposure of the sample to elec-
tron beam during EBID did not lower the success rate of
obtaining sequenceable DNA, likely because the depth of
electron interaction volume does not increase signifi cantly
with longer exposure time.
To extract DNA successfully, nano-manipulation must be
properly performed. The thickness of the nano spatula tip
and its angle relative to the sample substrate dictate how the
fragment slides onto the bevelled surface of the nano spatula
tip. If the cell fragment curls up or fl ips over during extrac-
tion, both sides of the cell fragment would be exposed to
the electron beam thereby risking beam-induced specimen
damage. Having the collected cell fragment break away
cleanly from the rest of the cell when the nano spatula is
lifted is also critical. A high success rate was achieved when
the cell fragment was fi rst pushed to an area outside of the
cell, free of any surrounding tethering, before being lifted.
To extract a target in the center of the cell, unwanted mate-
rial is fi rst scraped away, after which the target material is
extracted.
small 2014, 10, No. 16, 3267–3274
Figure 1. Chromatin extraction setup and experimental process. a) SEM image of the nano spatula with tip size less than 100 nm in width. It is made from heated glass rod, mechanically grinded to produce a beveled surface. b) DNA extraction setup within the SEM. The cell sample is mounted on an XYZ nano-manipulator, facing the stationary nano spatula. c-d) Image correlation between SEM image and fl uorescence image. The arrows point to examples of matching features between the two images. e) Locating the cell of interest inside SEM, guided by correlated fl uorescence image (not shown). f) Landing the nano spatula tip onto the target of interest. g) Pressing the nano spatula against the sample causes cell fragments to slide onto the bevel surface. h) Lifting up the nano spatula along with the extracted cell fragment. i,j) To ensure the cell fragment does not get detached due to vibration or airfl ow during SEM chamber venting, electron beam induced deposition (EBID) is used to ‘glue’ it in place. The nano spatula is then removed from the SEM and stored in buffer solution.
B. K. Chen et al.
3270 www.small-journal.com © 2014 Wiley-VCH Verlag GmbH & Co. KGaA, Weinheim
full papers 2.2. Enrichment of Expected Sub-Chromosomal Regions from a Single Nano-Dissected Nuclear Body
To confi rm the feasibility of extracting nano-volumes of chro-
matin from a specifi c targeted region, a nuclear structure that
is known to associate with a particular gene locus is needed.
We chose the histone locus body (HLB) as a model sub-
nuclear target. These 0.5–1 µm diameter structures closely
associate in a large percentage of cells with the histone gene
clusters on both chromosomes 1 and 6. [ 27 ] The protein com-
ponent of the body is called NPAT, and immuno-labelling
against this protein was used to identify it in sections imaged
by fl uorescence microscopy. Structures of interest were iden-
tifi ed in the SEM by correlative imaging, and DNA was
extracted by nano-dissection of individual HLBs from 300 nm
cryosections of HT1080 cells (see Experimental Section).
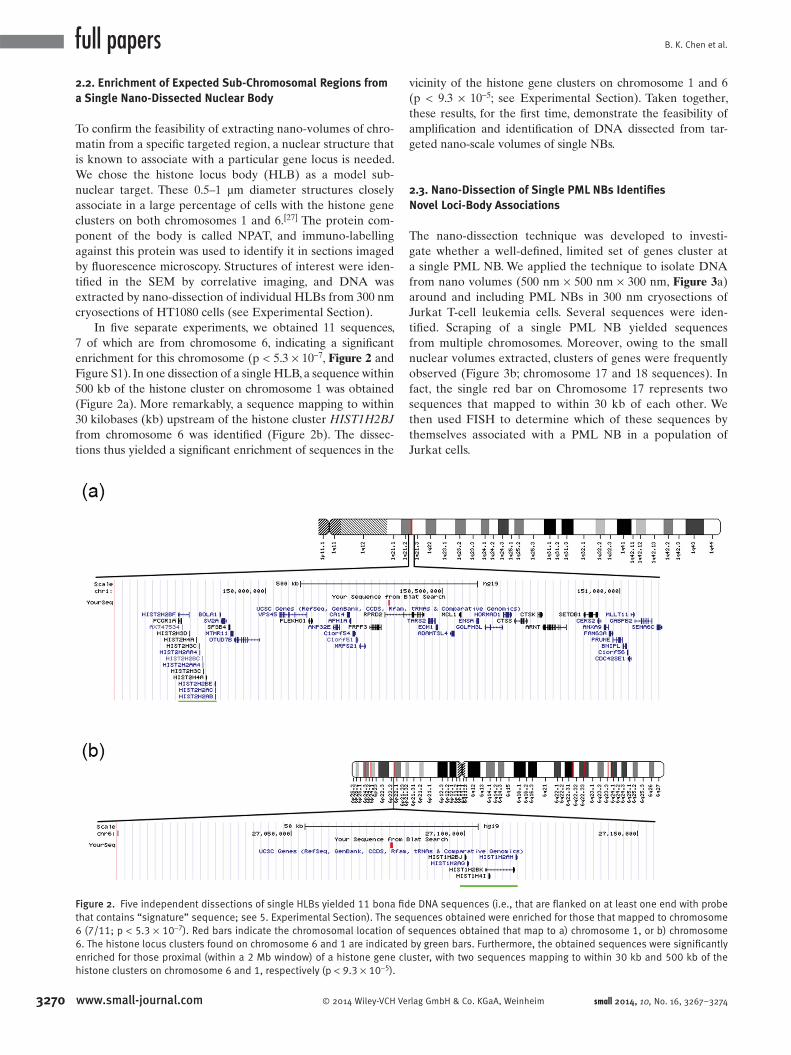
In fi ve separate experiments, we obtained 11 sequences,
7 of which are from chromosome 6, indicating a signifi cant
enrichment for this chromosome (p < 5.3 × 10 −7 , Figure 2 and
Figure S1). In one dissection of a single HLB, a sequence within
500 kb of the histone cluster on chromosome 1 was obtained
(Figure 2 a). More remarkably, a sequence mapping to within
30 kilobases (kb) upstream of the histone cluster HIST1H2BJ
from chromosome 6 was identifi ed (Figure 2 b). The dissec-
tions thus yielded a signifi cant enrichment of sequences in the
vicinity of the histone gene clusters on chromosome 1 and 6
(p < 9.3 × 10 −5 ; see Experimental Section). Taken together,
these results, for the fi rst time, demonstrate the feasibility of
amplifi cation and identifi cation of DNA dissected from tar-
geted nano-scale volumes of single NBs.
2.3. Nano-Dissection of Single PML NBs Identifi es Novel Loci-Body Associations
The nano-dissection technique was developed to investi-
gate whether a well-defi ned, limited set of genes cluster at
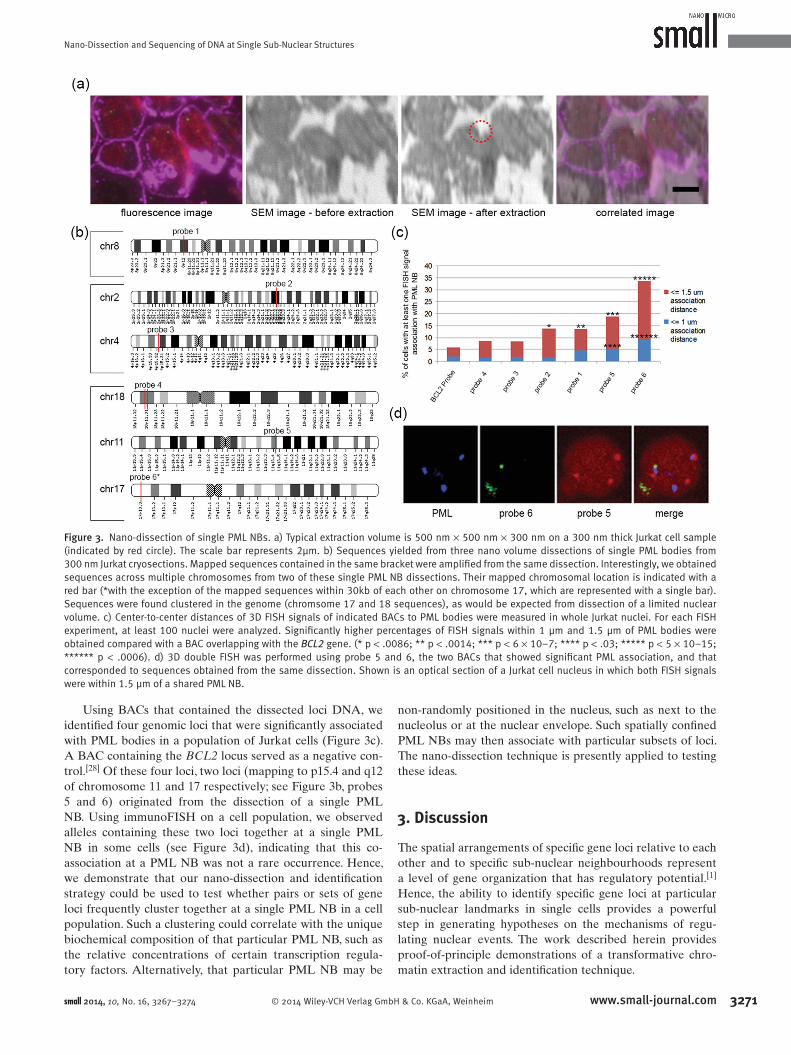
a single PML NB. We applied the technique to isolate DNA
from nano volumes (500 nm × 500 nm × 300 nm, Figure 3 a)
around and including PML NBs in 300 nm cryosections of
Jurkat T-cell leukemia cells. Several sequences were iden-
tifi ed. Scraping of a single PML NB yielded sequences
from multiple chromosomes. Moreover, owing to the small
nuclear volumes extracted, clusters of genes were frequently
observed (Figure 3 b; chromosome 17 and 18 sequences). In
fact, the single red bar on Chromosome 17 represents two
sequences that mapped to within 30 kb of each other. We
then used FISH to determine which of these sequences by
themselves associated with a PML NB in a population of
Jurkat cells.
small 2014, 10, No. 16, 3267–3274
Figure 2. Five independent dissections of single HLBs yielded 11 bona fi de DNA sequences (i.e., that are fl anked on at least one end with probe that contains “signature” sequence; see 5. Experimental Section). The sequences obtained were enriched for those that mapped to chromosome 6 (7/11; p < 5.3 × 10 −7 ). Red bars indicate the chromosomal location of sequences obtained that map to a) chromosome 1, or b) chromosome 6. The histone locus clusters found on chromosome 6 and 1 are indicated by green bars. Furthermore, the obtained sequences were signifi cantly enriched for those proximal (within a 2 Mb window) of a histone gene cluster, with two sequences mapping to within 30 kb and 500 kb of the histone clusters on chromosome 6 and 1, respectively (p < 9.3 × 10 −5 ).
Nano-Dissection and Sequencing of DNA at Single Sub-Nuclear Structures
3271www.small-journal.com© 2014 Wiley-VCH Verlag GmbH & Co. KGaA, Weinheim
Using BACs that contained the dissected loci DNA, we
identifi ed four genomic loci that were signifi cantly associated
with PML bodies in a population of Jurkat cells (Figure 3 c).
A BAC containing the BCL2 locus served as a negative con-
trol. [ 28 ] Of these four loci, two loci (mapping to p15.4 and q12
of chromosome 11 and 17 respectively; see Figure 3 b, probes
5 and 6) originated from the dissection of a single PML
NB. Using immunoFISH on a cell population, we observed
alleles containing these two loci together at a single PML
NB in some cells (see Figure 3 d), indicating that this co-
association at a PML NB was not a rare occurrence. Hence,
we demonstrate that our nano-dissection and identifi cation
strategy could be used to test whether pairs or sets of gene
loci frequently cluster together at a single PML NB in a cell
population. Such a clustering could correlate with the unique
biochemical composition of that particular PML NB, such as
the relative concentrations of certain transcription regula-
tory factors. Alternatively, that particular PML NB may be
non-randomly positioned in the nucleus, such as next to the
nucleolus or at the nuclear envelope. Such spatially confi ned
PML NBs may then associate with particular subsets of loci.
The nano-dissection technique is presently applied to testing
these ideas.
3. Discussion
The spatial arrangements of specifi c gene loci relative to each
other and to specifi c sub-nuclear neighbourhoods represent
a level of gene organization that has regulatory potential. [ 1 ]
Hence, the ability to identify specifi c gene loci at particular
sub-nuclear landmarks in single cells provides a powerful
step in generating hypotheses on the mechanisms of regu-
lating nuclear events. The work described herein provides
proof-of-principle demonstrations of a transformative chro-
matin extraction and identifi cation technique.
small 2014, 10, No. 16, 3267–3274
Figure 3. Nano-dissection of single PML NBs. a) Typical extraction volume is 500 nm × 500 nm × 300 nm on a 300 nm thick Jurkat cell sample (indicated by red circle). The scale bar represents 2µm. b) Sequences yielded from three nano volume dissections of single PML bodies from 300 nm Jurkat cryosections. Mapped sequences contained in the same bracket were amplifi ed from the same dissection. Interestingly, we obtained sequences across multiple chromosomes from two of these single PML NB dissections. Their mapped chromosomal location is indicated with a red bar (*with the exception of the mapped sequences within 30kb of each other on chromosome 17, which are represented with a single bar). Sequences were found clustered in the genome (chromsome 17 and 18 sequences), as would be expected from dissection of a limited nuclear volume. c) Center-to-center distances of 3D FISH signals of indicated BACs to PML bodies were measured in whole Jurkat nuclei. For each FISH experiment, at least 100 nuclei were analyzed. Signifi cantly higher percentages of FISH signals within 1 µm and 1.5 µm of PML bodies were obtained compared with a BAC overlapping with the BCL2 gene. (* p < .0086; ** p < .0014; *** p < 6 × 10⁻⁷; **** p < .03; ***** p < 5 × 10–15; ****** p < .0006). d) 3D double FISH was performed using probe 5 and 6, the two BACs that showed signifi cant PML association, and that corresponded to sequences obtained from the same dissection. Shown is an optical section of a Jurkat cell nucleus in which both FISH signals were within 1.5 µm of a shared PML NB.

B. K. Chen et al.
3272 www.small-journal.com © 2014 Wiley-VCH Verlag GmbH & Co. KGaA, Weinheim
full papers We demonstrate the feasibility of isolating nano volumes
of chromatin followed by amplifi cation and identifi cation of
the extracted DNA sequences. We fi rst showed that the dis-
section is accurate enough to target a single HLB, and enrich
for sequences previously shown to associate with it. We then
applied the technique to dissect chromatin from single PML
NBs. Combined with FISH, we were able to identify novel
loci that specifi cally associate with PML NBs in a cell popu-
lation. In its current state, the nano-dissection technique is
useful as a hypothesis generator, uncovering novel NB-gene
associations.
The nano-dissection technique is particularly suited for
asking whether pairs or sets of gene come together at specifi c
sub-nuclear structures. In these fi rst nano-dissection experi-
ments of single PML NBs, we identifi ed a pair of loci that were
together at a PML NB. When probing these two loci in a cell
population with immuno-FISH, we observed co-association at
single PML NBs, although this occurrence was less than each
locus being found at a different PML NB. We thus concluded
that these two loci, although spatially associated with PML
NBs, do not have to come together at the same body.
At present, the technique has a success rate of ∼16%
(Figure S2a), which represents the frequency of dissections
yielding bona fi de DNA sequences (i.e. those sequence that
originated from the dissected region by virtue of the presence
of a “signature” sequence; see Experimental Section) that can
be unambiguously mapped to a genomic locus. The present
accuracy of the scrape, based on the accuracy of correlative
imaging, is +/– 350 nm. Further optimization of the technique is
expected to improve the extraction accuracy and success rate.
Density and porosity of the cell nucleus plays a key
role in the depth of electron interaction volume. To mini-
mize the electron beam induced damage on DNA in future
studies, cell samples can be “encapsulated” to fi ll the pores,
or coated with a thin conformal material layer deposited over
the sample to act as the electron shield. Encapsulation with
Tween-20 detergent for example, has recently shown promise
as a means to protect biological specimens from the ionizing
damage of the SEM beam. [ 32 ]
In this study, we used correlative microscopy (i.e., cor-
relating SEM and fl uorescence microscopy images) to fi nd
structures of interest to nano-dissect. Imperfections in image
alignments can lead to reduction of spatial resolution in dis-
secting the material of interest. A possible improvement is
to immuno-label the target sub-nuclear structure with gold
nano particles, which can be directly visualized within the
SEM and hence, eliminate the need for correlative imaging.
It is possible that we successfully amplifi ed only a por-
tion of DNA that was dissected onto the tip of nano spatulas.
Independent of electron-induced DNA damage, we suspect
two other factors that could have limited the amplifi cation
effi ciency. First, our approach used to reduce DNA contami-
nation may have limited the sensitivity of the PCR amplifi ca-
tion (See Experimental Section). DNA contained on the tip
that is otherwise amplifi able (i.e., not damaged by the SEM
beam) but not fl anked by ligated probe, may be insuffi ciently
amplifi ed due to a lack of sites complimentary to the PCR
primer, or discounted after sequencing by a lack of probe
“signature” sequence (See Experimental Section). Thus, the
sensitivity of PCR amplifi cation is dependent on the propor-
tion of DNA that is fl anked by ligated probe. The proportion
of DNA ligated with fl anking probe may be improved by
employing a staggered-ended probe instead. Second, because
single molecule amplifi cation requires a high number of PCR
cycles for suffi cient yields for cloning or direct sequencing,
the fi nal detectable PCR amplifi cation products may only
represent those dominant species that emerge over succes-
sive PCR cycles. As an alternative approach, a more repre-
sentative population of template can be obtained by reducing
the number of PCR cycles to yield suffi cient amounts of
DNA enough for either microarray analysis or next genera-
tion sequencing.
Our technique complements the scope of the present
tools available to interrogate spatial relationships of gene
loci (i.e. ChIP, 3C). It offers unprecedented sensitivity (e.g.,
the identifi cation of genomic sequences converging on a
single NB) and captures chromatin loci associations that may
occur at distances that preclude direct or indirect chemical
cross-linking to each other or a protein constituent of the
nuclear substructure, as required by 3C and ChIP, respec-
tively. This allows for the interrogation of chromatin in an
arbitrary vicinity of a nuclear structure, which may reveal
otherwise undetectable transient or indirect chromatin asso-
ciations. This work thus far serves as a proof-of-principle and
is intended as a basis for further investigation. In addition to
being particularly suited to the detection of pairs or limited
sets of loci that converge at single NBs, our approach can be
used to fi nd novel chromatin/nuclear body associations that
cannot be detected by the present population-based methods,
either because of limiting starting material (embryos and
tissue), or because the NB in question cannot be biochemi-
cally isolated. PML NBs, for example, show differences in
the ratios of particular PML protein isoforms from body to
body, [ 19 ] as well as other factors, and these compositional dif-
ferences may refl ect the preferential association of genomic
loci to a particular variant of a PML NB among the several
found within a single cell. Such associations would not neces-
sarily be detected by ChIP because it relies on the immuno-
precipitation of a pooled population of cells.
The question of specifi c locus associations with PML NBs
originally motivated the development of the nano-dissection
technique. However, we expect that this technique has wide
applicability and can be useful as a novel assay for general
questions of interactions of chromatin with sub-nuclear
domains that are so far intractable.
4. Conclusion
We report a novel technique that allows for the targeted dis-
section and sequencing of DNA obtained from a nanoscale
region of a single cell nucleus using high-precision nano-
tools operated inside a scanning electron microscope. We
demonstrated, for the fi rst time, the ability to identify loci
occupying a shared site at a single sub-nuclear structure. As
a proof-of-principle, we nano-dissected the vicinity of single
nuclear sub-structure known to colocalize with the histone
gene clusters on chromosomes 1 and 6 (histone locus bodies)
small 2014, 10, No. 16, 3267–3274

Nano-Dissection and Sequencing of DNA at Single Sub-Nuclear Structures
3273www.small-journal.com© 2014 Wiley-VCH Verlag GmbH & Co. KGaA, Weinheim
and obtained a signifi cant enrichment of DNA that mapped
to within 500 kb and 30 kb of these clusters respectively.
We applied the technique to a PML NB in Jurkat cells and
yielded four novel loci that were found to have a signifi cant
frequency of association with PML NBs in a population of
cells. Furthermore, we showed that a pair of these loci from
different chromosomes can converge at the same PML NB.
Because our approach allows for the dissection and identifi -
cation of DNA in the vicinity of a single nuclear sub-structure,
we propose that it is uniquely suited for identifying specifi c
sets of loci that converge non-randomly at a shared NB. We
expect that if the “gene hub” model is a general feature of
nuclear organization, then our technique, applied in this
manner to other NBs, will reveal specifi c sets of convergent
loci that may refl ect novel gene co-regulatory relationships.
5. Experimental Section
Sample Preparation : Cells are fi xed in 2% formaldehyde for fi ve minutes and washed in PBS. Cell is pelleted and prepared for cryosectioning as previously described. [ 15 ] Cryosections (300 nm thick) are then washed with PBS, and restriction digested with Sau96I and MSE1 enzymes. The resultant double strand breaks are then blunted with Klenow fragment for 1 hour at room temper-ature, washed 3 × 5 minutes in PBS and then ligated overnight at room temperature with the following fl uorescently tagged double stranded oligo: Link1 5′ (Cy3)AGT GGG ATT CTT GCT GTC AGT TA G CTG 3′, Link2 5′ CAG C TA ACT GAC AG(ddC) 3′ (ddC: dideoxy C). Note that this oligo Linker contains the priming sites for the PCR amplifi cation. The section is then washed 3 × 5 minutes with 0.1% Tween 20/2XSSC solution at 42 °C, and 3 × 5 minutes at 60 °C with 0.5XSSC solution. The effi ciency of the ligation is confi rmed by the Cy3 signal under fl uorescence microscopy. Now the genomic DNA is fl anked by priming sites specifi c to those primers used for the PCR amplifi cation. Contaminating DNA introduced during downstream processing steps will not be recognized by the linker specifi c primers and thus not be amplifi ed. By performing this pre-ligation step prior to the nuclei scraping we were able to reduce the background amplifi cation problem. Invariably, contaminants do get amplifi ed by mispriming events; however, the presence of a 4bp “signature sequence” in the ligated linker (denoted by the italicized subsequences of Link1 and Link2), allowed us to distin-guish bona fi de amplicons that originated from DNA in the sample from those that arose from a mispriming event (see Figure S2b).
Nano Spatula Fabrication : We used a micropipette puller (P-97 Sutter Instrument) to process 1 mm diameter solid glass rod (GR100–4 from World Precision Instruments) for creating nano spatula tools. Fabrication parameters are summarized in Table S1. With the fi rst recipe, a neck structure is created. With the second recipe, the sharp tip is created (Figure S3a). The sharp tip is then mechanically grinded using a beveler (BV-10 Sutter Instrument) to create the beveled surface. The nano spatula is mounted on the nanomanipulation system (see Figure S3b) for DNA extraction.
DNA Extraction and PCR Amplifi cation : Samples are incubated overnight at 42 °C in 4.5 µL of DNA extraction buffer as used in Langer et al. 2005 [ 33 ] : 0.5 µl of 10 One-Phor-All-Buffer-Plus (Amersham Pharmacia Biotech), 0.13 µl 10% Tween 20 (Sigma, Germany), 0.13 µl 10% Igepal CA-630 (Sigma), 0.13 µl Proteinase
K (10 mg ml −1 , Sigma). Proteinase K is then inactivated with an 80 °C incubation for ten minutes. PCR is performed in 50 µl total volume using the Titanium Taq polymerase kit (Clonetech) under the following conditions: 72 °C 1 minute, 68 °C 3 minutes, then 14 cycles of 94 °C 40 seconds, 57 °C 30 seconds, 68 °C 1 minute 30 seconds increasing by one second each cycle. Then 8 cycles of 94 °C 40 seconds, 57 °C 30 seconds, 68 °C 1 minute 45 sec-onds increasing by one second each cycle. Then 22 cycles of 94 °C 40 seconds, 65 °C 30 seconds, 68 °C 1 minute 53 seconds increasing by one second each cycle. Then 68 °C for 3 minutes 40 seconds. Primer sequence is as follows: 5′ AGTGGGATTCTTGCT-GTCAGTTA 3′. Then 10 µl of the amplifi cation product is analyzed on a 2% agarose gel, and 2 µl is cloned for sequencing using the CloneJET PCR cloning kit (Thermo Scientifi c).
3D FISH and Imaging : For Jurkat cells immuno fl ouresence and FISH was preformed as previously described. [ 15 ] BACs corre-sponding with the mapped location of Jurkat sequences (Figure 3 b) are described as follows: BCL2 Probe- rp11–299P2, Probe 1- rp11–164H24, Probe 2- rp11–881M16, Probe 3- rp11–366H2, Probe 4− rp11–66P2, Probe 5- rp11–15D18, Probe 6- rp11–510P20. Confocal stacks with a Z increment of 0.1 µm were taken with an Olympus IX81 microscope.
3D FISH Measurements and Statistics : The percentage of cells with at least one BAC signal associating with a PML NB (using thresholds of 1 and 1.5 µm) was determined by measuring the Euclidian center to center distances between FISH signals and PML with ImageJ. Signifi cant differences (p < 0.05) in association fre-quencies were determined by taking the two-tailed p value under an exact Fisher test. To determine if the shared association at a PML NB of two BACs was not due to their independent association, the frequency of their association (using a 1.5 µm threshold) was com-pared to a model in which the loci associations are independent and equally likely between any PML NB within a cell. This gives a probability of association of two BACs at the same PML NB in a cell as: (frequency of BAC A)X(frequency of BAC B)/(Avg. # of PML bodies per cell). We use this as the probability of success in a bino-mial distribution test to determine the p value for the frequency of paired associations at a single PML NB. To calculate lower estimate for the p value associated with fi nding two sequences within 500 kb of the two histone clusters on chromosome 6 and 1 (P insidewindow ), we considered it as the complement probability of a sequence not being within either of 2 Mb windows centered on these two histone clusters (P outsidewindow ). This gives us: P insidewindow = 1− P outsidewindow = 1− [((number of base pairs in human haploid genome) – (2 × 2 Mb))/(number of base pairs in human haploid genome)] ≈0.0013. We then used this value as the probability of success in a binomial test. To determine a p value for the enrichment of chromo-some 6 sequences obtained from the HLB dissections, we consid-ered an upper estimate of the chance of getting a sequence from chromosome 6 as: (size in base pairs of chromosome 6)/(size of haploid genome) ≈ (171 × 10 6 )/(3 × 10 9 ) = 5.7 × 10 −2 . We then used this value as the probability of success in a binomial test.
Supporting Information
Supporting Information is available from the Wiley Online Library or from the author.
small 2014, 10, No. 16, 3267–3274

B. K. Chen et al.
3274 www.small-journal.com © 2014 Wiley-VCH Verlag GmbH & Co. KGaA, Weinheim
full papers
small 2014, 10, No. 16, 3267–3274
Acknowledgements
This work was supported by Canadian Institutes of Health Research – Catalyst Grant, and Canada Research Chair Program.
[1] R. Zhao , M. S. Bodnar , D. L. Spector , Curr. Opin. Genet. Dev. 2009 , 19 , 172 .
[2] C. S. Osborne , L. Chakalova , K. E. Brown , D. Carter , A. Horton , E. Debrand , B. Goyenechea , J. A. Mitchell , S. Lopes , W. Reik , P. Fraser , Nat. Genet. 2004 , 36 , 1065 .
[3] C. S. Osborne , L. Chakalova , J. A. Mitchell , A. Horton , A. L. Wood , D. J. Bolland , A. E. Corcoran , P. Fraser , PLoS Biol. 2007 , 5 , e192 .
[4] M. Dundr , J. K. Ospina , M. H. Sung , S. John , M. Upender , T. Ried , G. L. Hager , A. G. Matera , J. Cell Biol. 2007 , 179 , 1095 .
[5] T. Takizawa , K. J. Meaburn , T. Misteli , Cell 2008 , 135 , 9 . [6] C. Spilianakis , M. Lalioti , T. Town , G. Lee , R. Flavell , Nature 2005 ,
435 , 637 . [7] S. Schoenfelder , T. Sexton , L. Chakalova , N. Cope , A. Horton ,
S. Andrews , S. Kurukuti , J. Mitchell , D. Umlauf , D. Dimitrova , C. Eskiw , Y. Luo , C. Wei , Y. Ruan , J. Bieker , P. Fraser , Nat. Genet. 2010 , 42 , 53 .
[8] R. Ching , G. Dellaire , C. Eskiw , D. Bazett-Jones , J. Cell Sci. 2005 , 118 , 847 .
[9] W. de Laat , F. Grosveld , Chromosome Res. 2003 , 11 , 447 . [10] S. V. Razin , A. A. Gavrilov , E. S. Ioudinkova , O. V. Iarovaia , FEBS
Lett. 2013 , 587 , 1840 . [11] J. Levsky , S. Shenoy , R. Pezo , R. Singer , Science 2002 , 297 , 836 . [12] P. M. Das , K. Ramachandran , J. vanWert , R. Singal , BioTechniques
2004 , 37 , 961 . [13] M. Simonis , J. Kooren , W. de Laat , Nat. Methods 2007 , 4 , 895 . [14] N. van Berkum , J. Dekker , Methods Mol. Biol. 2009 , 567 , 189 . [15] R. Ching , K. Ahmed , P. Boutros , L. Penn , D. Bazett-Jones , J. Cell
Biol. 2013 , 201 , 325 . [16] J. Luciani , D. Depetris , Y. Usson , C. Metzler-Guillemain ,
C. Mignon-Ravix , M. Mitchell , A. Megarbane , P. Sarda , H. Sirma , A. Moncla , J. Feunteun , M. Mattei , J. Cell Sci. 2006 , 119 , 2518 .
[17] M. Ebrahimian , M. Mojtahedzadeh , D. Bazett-Jones , H. Dehghani , Cells Tissues Organs 2010 , 192 , 374 .
[18] D. Torok , R. Ching , D. Bazett-Jones , Front Biosci. 2009 , 14 , 1325 .
[19] W. Condemine , Y. Takahashi , J. Zhu , F. Puvion-Dutilleul , S. Guegan , A. Janin , H. de Thé , Cancer Res. 2006 , 66 , 6192 .
[20] K. Lee , M. Chang , J. Ahn , D. Yu , S. Jung , J. Choi , Y. Noh , Y. Lee , M. Ahn , Biochem. Biophys. Res. Commun. 2002 , 296 , 1125 .
[21] J. Zhao , B. Kennedy , B. Lawrence , D. Barbie , A. Matera , J. Fletcher , E. Harlow , Genes Dev. 2000 , 14 , 2283 .
[22] M. R. Emmert-Buck , R. F. Bonner , P. D. Smith , R. F. Chuaqui , Z. Zhuang , S. R. Goldstein , R. A. Weiss , L. A. Liotta , Science 1996 , 274 , 998 .
[23] C. S. Wesley , M. Ben , M. Kreitman , N. Hagag , W. F. Eanes , Nucleic Acids Res. 1990 , 18 , 599 .
[24] H. G. Hansma , J. Vesenka , C. Siegerist , G. Kelderman , H. Morrett , R. L. Sinsheimer , V. Elings , C. Bustamante , P. K. Hansma , Science 1992 , 256 , 1180 .
[25] J. Hu , Y. Zhang , H. Gao , M. Li , U. Hartmann , Nano Lett. 2001 , 2 , 55 .
[26] J. Lü , H. An , H. Li , X. Li , Y. Wang , M. Li , Y. Zhang , J. Hu , Surf. Interface Anal. 2006 , 38 , 1010 .
[27] J. Zhao , B. Kennedy , B. Lawrence , D. Barbie , A. Matera , J. Fletcher , E. Harlow , Genes Dev. 2000 , 14 , 2283 .
[28] Y. Sun , L. Durrin , T. Krontiris , Genomics 2003 , 82 , 250 . [29] J. Wang , C. Shiels , P. Sasieni , P. Wu , S. Islam , P. Freemont ,
D. Sheer , J. Cell Biol. 2004 , 164 , 515 . [30] Y. L. Zhang , Y. Zhang , C. Ru , B. K. Chen , Y. Sun , IEEE/ASME Trans.
Mechatron. 2013 , 18 , 230 . [31] B. K. Chen , Z. Yong , S. Yu , J. Microelectromech. Syst. 2009 , 18 ,
652 . [32] Y. Takaku , H. Suzuki , I. Ohta , D. Ishii , Y. Muranaka , M. Shimomura ,
T. Hariyama , PNAS 2012 , 110 , 7529 . [33] S. Langer , J. Geigl , R. Gangnus , M. Speicher , Lab Invest. 2005 , 85 ,
582 .
Received: January 10, 2014 Revised: March 5, 2014 Published online: May 3, 2014

![Dissection-BKW · 2018. 6. 1. · Dissection. Wereplaceournaive c -sumalgorithmbymoreadvancedtime-memorytechniqueslike Schroeppel-Shamir[34]anditsgeneralization,Dissection[11],toreducetheclassicrunningtime.Wecall](https://img.dokumen.tips/doc/110x75/5ffc5cc4c887922f656f708b/dissection-bkw-2018-6-1-dissection-wereplaceournaive-c-sumalgorithmbymoreadvancedtime-memorytechniqueslike.jpg)