Embed Size (px)
Citation preview


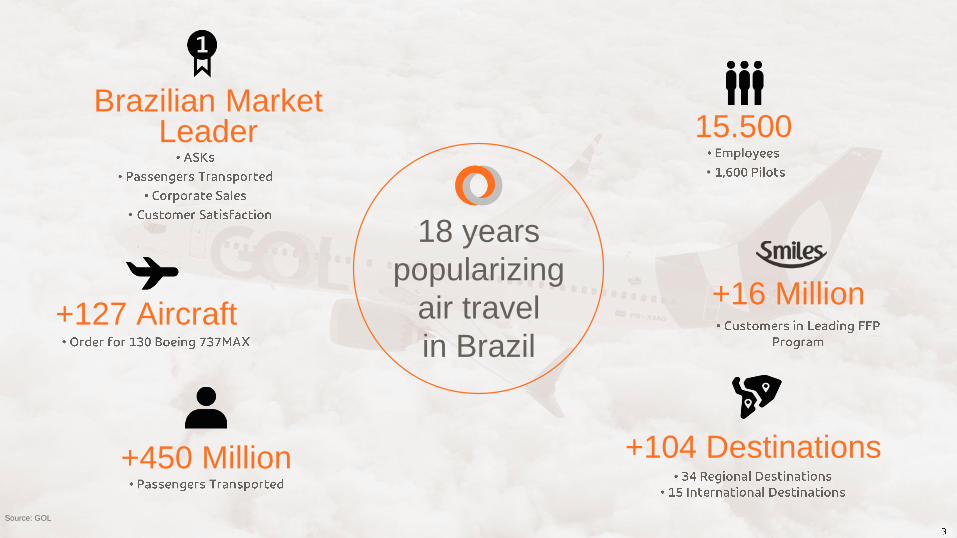
+16 Million
Brazilian Market Leader
•
+127 Aircraft
15.500
+450 Million +104 Destinations
18 years
popularizing
air travel
in Brazil
Source: GOL
•


• Experience: over 60 years of combined tenure at GOL
• Consistency: experience managing through all economic cycles
• Commitment: only all-Brazilian team
• Productivity: highly efficient; unique corporate culture
Years of Business
Experience
Paulo Kakinoff
Chief Executive Officer9
Richard Lark
Chief Financial Officer17
Eduardo Bernardes
Vice President, Sales and Marketing18
Captain Celso Ferrer
Vice President, Operations17
22
30
23
19
• CEO 2012 – present
• Board member 2011 – 2012
• CFO 2003 – 2008, 2016 – present
• Board member 2008 – 2016
• VP Sales & Marketing, 2015 – present
• VP, Planning 2015 – 2019
• Active GOL B737 Pilot
Years at GOL
5

Market Leader with Irreplaceable, Highly Defendable Network1
World-Class Low Cost Operator: Better than Peers2
Right-sized Balance Sheet with Strong Liquidity Position5
Track Record in Delivering Results and Guiding Investors6
Best-in-Class Operations and Service: Driving Loyalty3
Best Positioned to Benefit from Brazil Economic Scenarios4

RS
PR SP
MG
DF
RJ
BA
PE
CE
Source: ANAC.
GD
P p
er
Stat
e a
s %
of
Tota
l GD
P(1
) 32,5%
10,2%8,7%6,5% 6,4%
4,1% 3,8% 2,7% 2,2% 2,2%
SP RJ MG RS PR BA DF PE PA CE
GOL is the #1 player in Brazil’s main airports
GOL’s network covers over 80% of Brazil’s GDP
High-value network focused on higher-yielding business traffic: the #1 airline for business travelers
Leading Market Positioning
GOL network covers over 80% of Brazilian GDP
GOL’s Network Covers the Majority of Brazil’s Population and GDP
GOL’s network is structured to take advantage of Brazil’s geographic and demographic characteristics

+34 New Destinations
+9 New Destinations
+R$ 420 MM

••

1.699
1.914
1.392
1.551
1.6441.615 1.627
1.453
1.850
1.731
1.648
1.698
1.587
1.729
1.676
1.770
1.688
1.840
2.027
SetMai
1.582
Mar
1.676
Jan Fev Dez
1.584
1.785
NovAbr OutAgoJulJun
1.512
+12,7%
+13,6%
+6,0%+10,8%
+0,8%
-8,3%
-6,4%
+3,0%+8,9%
+5,6% +5,7%
+10,1%
2018 2019
GRU Airport Supply Growth

GOL is the only true LCC model operating in Brazil:
Based on 1Q19LTM
Sources: Company’s earnings release

•
•
•
•
•
•
•
•=

Costs / Net Revenue (total, %)
Fuel
Variable Costs*
Fixed Costs*

EBITDA Margin(%)
– CASM(US$ cents)
Latam Gol Copa Azul Gol Azul Latam Copa Gol Azul Latam Copa

Passengers claims for each 100
thousand passengers transported1Completion 2018 1
98,5%
97,9%INDÚSTRIAEX- GOL
17,5
30,8INDÚSTRIAEX- GOL
Source: https://www.anac.gov.br/noticias/2019/anac-divulga-
dados-de-manifestacoes-de-passageiros-do-transporte-aereo
http://panorama.abear.com.br/1ANAC 2018
2 ICAO 2018 and GOL Database
98,5%
97,9%INDÚSTRIAEX- GOL
17,5
30,8INDÚSTRIAEX- GOL
Lost and damaged baggage for
each 1.000 passengers¹

17
Smiles Diamond Premium Economy Entertainment
On-board Services Premium LoungeWi-Fi and +Pitch

Note: (1) First class
Best-in-class product positioning…
CUSTOMER MIXLeisure /
Business / SMEs
LeisureLeisure /
SMEsLeisure / Business
Leisure / Business
Leisure / Business
Leisure / Business
On-board Wi-Fi
Live TV
Free beverages (non-alcoholic)
Free snacks
On-board sales
Tier Elite
Cabin segmentation
Airport lounges
Designated seats
Seat pitch 34’’ / 30’’ 28’’ / 30’’ 30’’ 29’’ 34’’ / 30’’36’’(1) / 34’’
/ 31’’33’’ / 31’’
…combined with leadership across all brand metrics in the eyes of HVC’s
Top of Mind HVC – 1Q’19
BRAND PREFERENCE HVC – 1st Mention Q’19
BRAND MOMENTUM HVC – Q’19
18

(*) Source: IATA (million O-D passengers journeys | to, from and within)
• Single B737 Fleet
• Newest fuel-efficient
aircraft;
• Low fleet age and
increased stage
length
• Most attractive:
product, experience
& best fares
• Sustainable:
corporate and
leisure travelers
Brazil: one of the
largest air passenger
markets
(1stUS; 2nd China; 3rd India; & 4th UK)*

(1) Source Airbus Global Market Forecasts 2017-2036
(2) United States and Canada
(3) Airbus - 2016 – 2036
1,76
1,21
1,17
0,53
0,52
0,43
0,43
0,39
0,38
0,36
0,09
- 0,5 1,0 1,5 2,0 2,5
North America
Japan
Europe
Chile
Colombia
Brazil
Peru
Mexico
Argentina
China
India
North America has over 4.1x the number
of flights per capita compared to Brazil
20-Year Annual Growth 3Flights per capita 1
5,6%
4,8%
4,1%
3,4%
2,4%
0,0%
1,0%
2,0%
3,0%
4,0%
5,0%
6,0%
Asia-Pacific Brazil LatinAmerica
Europe NorthAmerica
2

GDP Growth (%)Inflation Rate (%)
Interest Rates (%) Domestic Passenger Demand Growth (% RPK)
5,9% 6.3% 5,8% 5,9% 6,4%
10,7%
6,9%
3,0%3,8% 3,3% 3,6%
2010 2011 2012 2013 2014 2015 2016 2017 2018 2019E2020E
Inflation at historical lows… 7,5%
4,0%
1,9% 3,0%0,5%
-3,5% -3,5%
1,0% 1,1% 0,9%2,0%
2010 2011 2012 2013 2014 2015 2016 2017 2018 2019E 2020E
… GDP growth
23,6%
15,9%
6,9%1,4%
5,8%1,1%
-5,7%
3,2% 4,4% ~5%5-9%
2010 2011 2012 2013 2014 2015 2016 2017 2018 2019E 2020E
10,7% 10,8% 10,9%9,8%
11,6%
14,1% 13,6%
7,0% 6,5%4,5%
2010 2011 2012 2013 2014 2015 2016 2017 2018 2019E
Source : IBGE, Bacen, ANAC and Focus October 7, 2019
Interest rates at lowest levels…
Demand ~2.-3x GDP
Growth
3.1x 4.0x 3.6x 0.5x nm nm11.6x 4.0x

22
2019 – 2023 Plan
Liability
management
Optimizing
balance sheet
Fleet
transformation
• +R$2 Bn debt reduction
• +R$300 MM annual interest
expense reduction
• No relevant maturities in
next 5 years
• Access to diverse funding
sources
• 100% CAPEX financing for
PDPs and engine overhaul
• Improving working capital
and availability of credit
• Maximize use of capital
deployed and tax credits
• Improved interest coverage
• Achieve BB- credit rating
• Maintenance capex: lower
by modernization of fleet
• Building free equity on 60%
of 135 MAX order


Corporate Rating (global): B1
Local Rating: n/a
Outlook: Stable
Corporate Rating (global): B+
Local Rating: A-
Outlook: Stable
Corporate Rating (global): B
Local Rating: brA
Outlook: Stable


±

-30%
-20%
-10%
0%
10%
20%
30%
40%
50%
-100
-50
0
%


Market Leader with Irreplaceable, Highly Defendable Network1
World-Class Low Cost Operator: Better than Peers2
Right-sized Balance Sheet with Strong Liquidity Position5
Track Record in Delivering Results and Guiding Investors6
Best-in-Class Operations and Service: Driving Loyalty3
Best Positioned to Benefit from Brazil Economic Scenarios4