Embed Size (px)
Citation preview

15th International Congress on the Chemistry of CementPrague, Czech Republic, September 16–20, 2019
Determining viability of industrial byproducts in alkali activatedsystems
Hugo Uvegi1,a, Brian Traynor1,b, Piyush Chaunsali2,c, Elsa Olivetti1,d
1Materials Science and Engineering, Massachusetts Institute of Technology, Cambridge, United States2Civil Engineering, Indian Institute of Technology Madras, Chennai, India
[email protected]@[email protected]
ABSTRACTWhile cement production continues to increase globally, alternatives, such as alkali activated andgeopolymeric binders, provide an important opportunity to diminish environmental concerns associatedwith production while retaining requisite physical properties. This work focuses on characterization andcalculation of reaction product chemistry in aluminosilicate systems synthesized from siliceous Indianbiomass ash and metakaolin. Siliceous ash was used both as a solid silicate source and in theproduction of Na-silicate solution through dissolution in up to 6M aqueous NaOH solution. Dissolutionand reaction studies of such precursors in aqueous NaOH and Na-silicate solutions were observed toproduce geopolymeric and zeolitic products. By coupling solution analysis via ICP-OES with solidscharacterization via 27Al and 29Si MAS-NMR and XRD, we illustrate the utility of previously developedmethodology for calculating reaction product chemistry. Dissolution studies quantify elementalavailability of precursor materials, and, through comparative analysis, reaction product chemistry.Physicochemical characterization of solids provides insight into the properties driving reactivity andverifies product structure and previously calculated chemistry. In this study, 6M NaOH and associatedsilicate solutions produced zeolitic products with Si/Al=1 regardless of silica concentration. Presence ofsolid ash was observed to yield zeolitic species with different structure (EDI) than in simple Na-silicate(FAU) due to its role as a heterogeneous nucleation site. This study verified the utility of comparativesolution analysis for separating dissolution and reaction phenomena and for calculating reactionproduct chemistry during synthesis of such aluminosilicate materials.
15th International Congress on the Chemistry of CementPrague, Czech Republic, September 16–20, 2019
1. INTRODUCTION
In recent years, the large environmental footprint of the cement industry (Barcelo et al. 2014) has generated interest in the synthesis and properties of alternative binders such as geopolymers and alkali activated materials. Use of industrial byproduct-derived precursors to produce such binders yields reduced environmental footprints (Habert et al. 2011) and is a primary driver for the emergent awareness of the research community. Focusing on the synthesis of metakaolin-based aluminosilicates, this paper builds on a growing body of work dedicated to precursor dissolution and reactivity.
Following previous work by the authors (Uvegi et al. 2019), this study uses comparative analysis of solution chemistry to determine utility of precursor materials in synthesizing aluminosilicate products. Arguably the most well-studied precursor for geopolymer synthesis, metakaolin is known to be a reactive aluminosilicate material due to its predominantly amorphous nature (Palomo et al. 1999). Aqueous, alkali-rich solutions, such as those composed of NaOH or KOH, quickly hydrolyze Si-O and Al-O bonds in the amorphous matrix, releasing silicate and aluminate species into solution. Such species then polymerize to form covalently bound aluminosilicate network products (De Silva et al. 2007, Chen et al. 2017) such as geopolymers, zeolitic minerals, or some combination thereof (Davidovits 2015, Palomo et al. 1999, Provis et al. 2005). Previous work has demonstrated Si/Al molar ratio as an important determinant of geopolymer physico-chemical properties (Duxson et al. 2007). Such Si/Al ratios are similarly important in determining expected zeolite structure and chemistry (Lippmaa et al. 1981, Davis & Lobo 1992). In this work, we use previously studied Indian biomass ash—the result of agricultural residue incineration (Chaunsali et al. 2018, Chaunsali et al. 2019, Uvegi et al. 2019)—as the external source of silica. In the authors’ previous work, this ash was used in the synthesis of calcium silicate hydrate products through reaction with calcium hydroxide. Here, the ash is used both to prepare a sodium silicate solution and as a direct solid source. The use of rice husk ash—compositionally similar to the ash of focus—and other glassy, siliceous materials have previously exhibited success in the production of sodium silicate solutions for geopolymer synthesis (Kamseu et al. 2017, Gevaudan et al. 2017) and as a silica source for zeolite synthesis (Vempati et al. 2006, Lee et al. 2017). In this work, we accomplish two goals:
Compute aluminosilicate reaction product chemistry through comparison of elemental dissolution and apparent consumption as measured through ICP-OES.
Compare and contrast reaction product physico-chemical properties when employing either simultaneous or multi-step synthesis procedures (i.e. dissolution and reaction of ash and metakaolin together in NaOH vs. production of Na-silicate prior to dissolution and reaction of metakaolin)
The first goal introduces a new method for calculation of reaction product chemistry, established previously for a calcium silicate system (Uvegi et al. 2019), while the second illustrates the importance of synthesis process design.
Experiments were conducted in three different aqueous NaOH solutions (1M, 3M, and 6M), and liquid-to-solid ratios of at least 25. In order to successfully accomplish the first goal, our experimental setup required dilute precursor concentrations, thereby ensuring dissolution and precipitation would occur in controlled and primarily separate fashions. 1M NaOH solution was observed to be insufficiently caustic to dissolve the metakaolin network, resulting in limited, if any, product formation. 3M and 6M solutions successfully promoted the production of a mixture of geopolymeric and zeolitic species, as expected (Gevaudan et al, 2017). In all cases, by comparing solution chemistries of isolated raw material dissolution with those in which reaction product was observed to form, it was possible to calculate product chemistries (i.e. Si/Al ratios), which, at late age, agree with chemistries indicated by solids analysis.
2. MATERIALS AND METHODS
2.1 Materials
This study focuses on the application of a previously utilized methodology (Uvegi et al. 2019) to a new material system. While the previous study involved the dissolution of siliceous Indian biomass ash (SA)
15th International Congress on the Chemistry of CementPrague, Czech Republic, September 16–20, 2019
for use as a silica source in C-S-H synthesis, we focus here on geopolymeric and zeolitic products. Metakaolin (MK) (provided by Advanced Cement Technologies, PowerPozzTM (HRM)) is used as a reactive aluminosilicate source, while the siliceous biomass ash (SA) is used as a source of reactive silica. SA is sourced from Silverton Pulp & Papers Pvt. Ltd. in Muzzafarnagar, Uttar Pradesh, India.
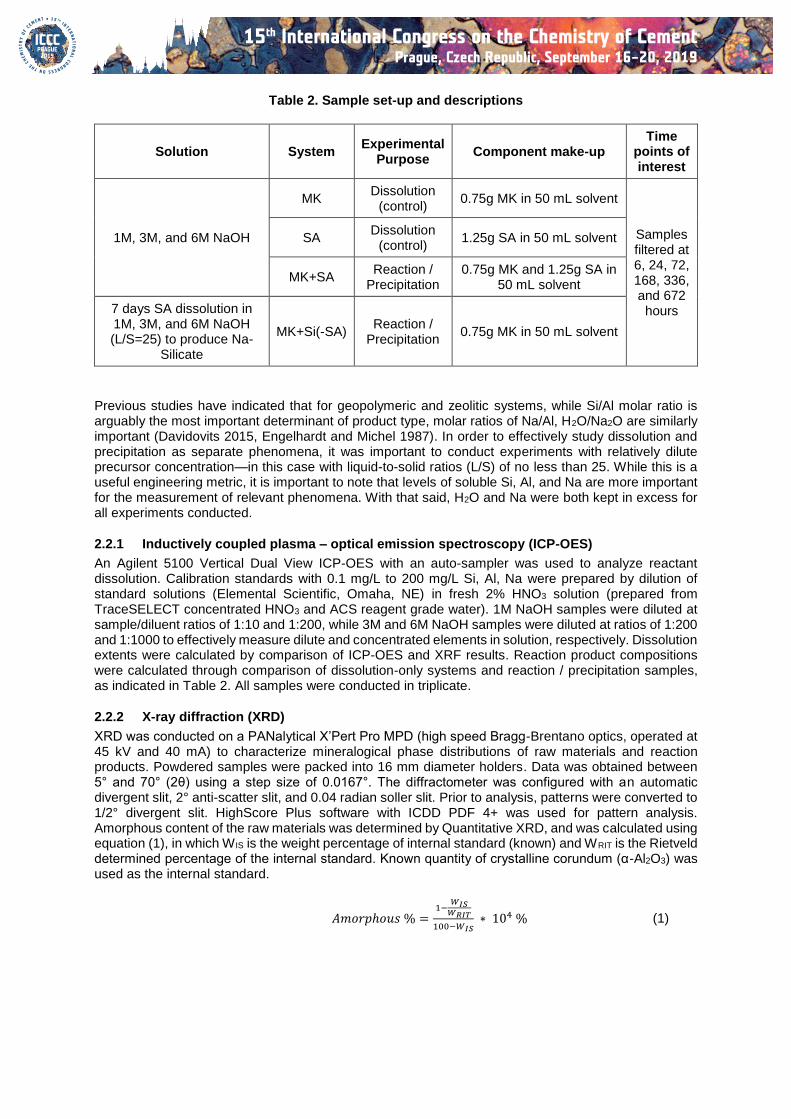
Oxide composition determined by X-ray florescence is presented below in Table 1. X-ray diffraction patterns are presented in Figure 1 and depict primarily amorphous material with minor crystalline phases. SA is composed primarily of SiO2 and C, both of which contribute to the amorphous halo observed in Figure 1 (Uveg et al. 2019). MK, on the other hand, is composed of close to equal parts by mass SiO2 and Al2O3 (Si/Al molar ratio of 1). Minor crystalline phases are listed in Figure 1.
Table 1. SA and MK composition (oxide %) as measured through XRF. Average of four SA samples; Uncertainty represents one standard deviation. MK as reported by ACT
Oxide (%)
SiO2 Al2O3 Fe2O3 Na2O K2O CaO MgO P2O5 SO3 Trace LOI Amorphous Content
SA 61.2
±1.2
1.6
±0.5
0.69
±0.09
0.22
±0.08
2.5
±0.3
1.59
±0.09
0.80
±0.07
0.91
±0.07
1.89
±0.13
0.19
±0.05
28.4
±1.5
90%
MK 52.45 43.63 1.52 0.08 0.29 0.11 0.11 --- 0.04 1.6 0.17 90%
Figure 1. X-ray diffraction patterns of Metakaolin (MK) and Silverton biomass ash (SA)
2.2 Methods
Experiments were designed to allow for reaction product chemistry quantification from ICP-OES results. Measurement of apparent precursor dissolution and comparison with reaction-prone solution chemistries allowed for such quantification. Four systems were tracked from 6 to 672 hours in 1M, 3M, and 6M NaOH (NaOH ≥97%, Sigma Aldrich; ACS Reagent Grade water, RICCA Chemical Company), as presented in Table 2.
Samples were mixed in a tube rotator (FisherbrandTM Multi-Purpose Tube Rotator, Fisher Scientific) to indicated residence time, after which they were filtered through a 0.2 μm membrane (Pall membrane, VWR), washed with ACS Reagent Grade water, immersed in isopropyl alcohol for 24 hours to stop reaction, filtered once more through 2.5 μm filter paper (Quantitative filter paper, ashless, Grade 42, Whatman) for solid retention, dried at 40 °C for 3 hours, and finally stored in a vacuum desiccator. Solid samples were ground and sieved through a No. 325 sieve to ensure particulate size of <45 μm. Initial sample filtrates were diluted in 2% HNO3 and analyzed as described in 2.2.1. Solids were stored for XRD, spectroscopic, and microscopic analyses as described below.
15th International Congress on the Chemistry of CementPrague, Czech Republic, September 16–20, 2019
Table 2. Sample set-up and descriptions
Solution System Experimental
Purpose Component make-up
Time points of interest
1M, 3M, and 6M NaOH
MK Dissolution
(control) 0.75g MK in 50 mL solvent
Samples filtered at 6, 24, 72, 168, 336, and 672
hours
SA Dissolution
(control) 1.25g SA in 50 mL solvent
MK+SA Reaction /
Precipitation 0.75g MK and 1.25g SA in
50 mL solvent
7 days SA dissolution in 1M, 3M, and 6M NaOH (L/S=25) to produce Na-
Silicate
MK+Si(-SA) Reaction /
Precipitation 0.75g MK in 50 mL solvent
Previous studies have indicated that for geopolymeric and zeolitic systems, while Si/Al molar ratio is arguably the most important determinant of product type, molar ratios of Na/Al, H2O/Na2O are similarly important (Davidovits 2015, Engelhardt and Michel 1987). In order to effectively study dissolution and precipitation as separate phenomena, it was important to conduct experiments with relatively dilute precursor concentration—in this case with liquid-to-solid ratios (L/S) of no less than 25. While this is a useful engineering metric, it is important to note that levels of soluble Si, Al, and Na are more important for the measurement of relevant phenomena. With that said, H2O and Na were both kept in excess for all experiments conducted.
2.2.1 Inductively coupled plasma – optical emission spectroscopy (ICP-OES)
An Agilent 5100 Vertical Dual View ICP-OES with an auto-sampler was used to analyze reactant dissolution. Calibration standards with 0.1 mg/L to 200 mg/L Si, Al, Na were prepared by dilution of standard solutions (Elemental Scientific, Omaha, NE) in fresh 2% HNO3 solution (prepared from TraceSELECT concentrated HNO3 and ACS reagent grade water). 1M NaOH samples were diluted at sample/diluent ratios of 1:10 and 1:200, while 3M and 6M NaOH samples were diluted at ratios of 1:200 and 1:1000 to effectively measure dilute and concentrated elements in solution, respectively. Dissolution extents were calculated by comparison of ICP-OES and XRF results. Reaction product compositions were calculated through comparison of dissolution-only systems and reaction / precipitation samples, as indicated in Table 2. All samples were conducted in triplicate.
2.2.2 X-ray diffraction (XRD)
XRD was conducted on a PANalytical X’Pert Pro MPD (high speed Bragg-Brentano optics, operated at 45 kV and 40 mA) to characterize mineralogical phase distributions of raw materials and reaction products. Powdered samples were packed into 16 mm diameter holders. Data was obtained between 5° and 70° (2θ) using a step size of 0.0167°. The diffractometer was configured with an automatic divergent slit, 2° anti-scatter slit, and 0.04 radian soller slit. Prior to analysis, patterns were converted to 1/2° divergent slit. HighScore Plus software with ICDD PDF 4+ was used for pattern analysis. Amorphous content of the raw materials was determined by Quantitative XRD, and was calculated using equation (1), in which W IS is the weight percentage of internal standard (known) and WRIT is the Rietveld determined percentage of the internal standard. Known quantity of crystalline corundum (α-Al2O3) was used as the internal standard.
𝐴𝑚𝑜𝑟𝑝ℎ𝑜𝑢𝑠 % =1−
𝑊𝐼𝑆𝑊𝑅𝐼𝑇
100−𝑊𝐼𝑆 ∗ 104 % (1)
15th International Congress on the Chemistry of CementPrague, Czech Republic, September 16–20, 2019
2.2.3 Solid state 27Al and 29Si magic angle spinning nuclear magnetic resonance spectroscopy (MAS-NMR)
Solid state 27Al and 29Si MAS-NMR spectra were obtained at room temperature on a Bruker Avance III WB 500 MHz spectrometer (field strength of 11.74 T) equipped with a 4.0 mm 2-channel broadband HX solid state probe.
27Al spectra were obtained in single-pulse experiments, with the spectrometer tuned to 130.316 MHz, a spinning speed of 12 kHz, 1 s relaxation delays, up to 1024 scans, a π/4 pulse of 1.7 μs, with 80 kHz of 1H spinal-64 decoupling applied during acquisition. 27Al chemical shifts were referenced externally to 1M Al(NO3)3 at 0.00 ppm.
29Si spectra were similarly obtained in single-pulse experiments, with the spectrometer tuned to 99.325 MHz, a spinning speed of 10 kHz, 20 s relaxation delays, up to 3072 scans, a π/2 pulse of 4 μs, with 49 kHz of 1H spinal-64 decoupling applied during acquisition. 29Si chemical shifts were referenced externally to hexamethylcyclotrisiloxane at -9.00 ppm. 29Si resonances were analyzed according to Qn(mAl) classification, where n corresponds to the connectivity of silicate tetrahedra and can vary from 1 to 4, while m<n is the number of tetrahedra with Al replacement of the Si atom.
2.2.4 Scanning electron microscopy (SEM)
A Zeiss Merlin High Resolution Scanning Electron Microscope equipped with an in-lens and high-efficiency secondary electron detectors was used for SEM. Powder samples were adhered to carbon tape and introduced into the SEM vacuum chamber. Images were captured with electron beam set to
10 kV accelerating voltage and 400 pA beam current, at a working distance of 10.00.2 mm.
3. RESULTS AND DISCUSSION
The results that follow rely on the observation that siliceous ash (SA) and metakaolin (MK) will release Si and Al into alkali solution without precipitating any reaction products (i.e. simple dissolution) when undersaturated in solution, as described in Table 2. Upon comparison of such solution chemistries post-dissolution with solutions in which precipitation of reaction product is expected and observed to occur, it is possible to calculate the degree to which specific elements have been included in the reaction products. In other words, through such comparison, it is possible to calculate reaction product chemistry. This is carried out through ICP-OES measurement as described in Section 2.2.1. Through further analysis of solids XRD and MAS-NMR results, we can verify the accuracy of such composition calculations and supplement with product structure characterization. In what follows, we first present observed dissolution and precipitation as monitored through ICP-OES, and subsequently present further solids analysis.
15th International Congress on the Chemistry of CementPrague, Czech Republic, September 16–20, 2019
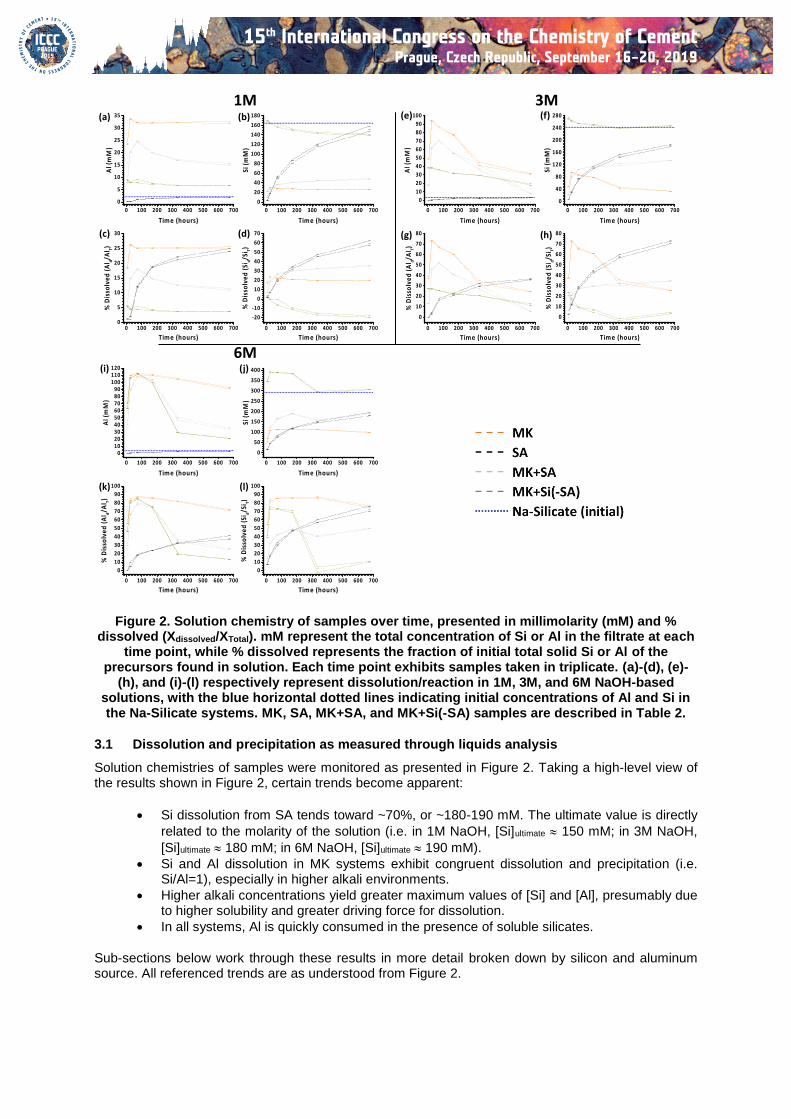
Figure 2. Solution chemistry of samples over time, presented in millimolarity (mM) and % dissolved (Xdissolved/XTotal). mM represent the total concentration of Si or Al in the filtrate at each
time point, while % dissolved represents the fraction of initial total solid Si or Al of the precursors found in solution. Each time point exhibits samples taken in triplicate. (a)-(d), (e)-
(h), and (i)-(l) respectively represent dissolution/reaction in 1M, 3M, and 6M NaOH-based solutions, with the blue horizontal dotted lines indicating initial concentrations of Al and Si in the Na-Silicate systems. MK, SA, MK+SA, and MK+Si(-SA) samples are described in Table 2.
3.1 Dissolution and precipitation as measured through liquids analysis
Solution chemistries of samples were monitored as presented in Figure 2. Taking a high-level view of the results shown in Figure 2, certain trends become apparent:
Si dissolution from SA tends toward ~70%, or ~180-190 mM. The ultimate value is directly
related to the molarity of the solution (i.e. in 1M NaOH, [Si]ultimate 150 mM; in 3M NaOH,
[Si]ultimate 180 mM; in 6M NaOH, [Si]ultimate 190 mM).
Si and Al dissolution in MK systems exhibit congruent dissolution and precipitation (i.e. Si/Al=1), especially in higher alkali environments.
Higher alkali concentrations yield greater maximum values of [Si] and [Al], presumably due to higher solubility and greater driving force for dissolution.
In all systems, Al is quickly consumed in the presence of soluble silicates.
Sub-sections below work through these results in more detail broken down by silicon and aluminum source. All referenced trends are as understood from Figure 2.
0 100 200 300 400 500 600 700
0
10
20
30
40
50
60
70
80
90
100
Al (
mM
)
Time (hours)
0 100 200 300 400 500 600 700
0
10
20
30
40
50
60
70
80
% D
isso
lve
d (
Al d
/Al T
)
Time (hours)
0 100 200 300 400 500 600 700
0
40
80
120
160
200
240
280
Si (
mM
)
Time (hours)
0 100 200 300 400 500 600 700
0
10
20
30
40
50
60
70
80
% D
isso
lve
d (
Sid/S
i T)
Time (hours)
3M
0 100 200 300 400 500 600 700
0
5
10
15
20
25
30
35
Al (
mM
)
Time (hours)
0 100 200 300 400 500 600 7000
5
10
15
20
25
30
% D
isso
lve
d (
Al d
/Al T
)
Time (hours)
0 100 200 300 400 500 600 700
0
20
40
60
80
100
120
140
160
180
Si (
mM
)
Time (hours)
0 100 200 300 400 500 600 700
-20
-10
0
10
20
30
40
50
60
70
% D
isso
lve
d (
Sid/S
i T)
Time (hours)
1M
0 100 200 300 400 500 600 700
0102030405060708090
100110120
Al (
mM
)
Time (hours)
0 100 200 300 400 500 600 700
0
10
20
30
40
50
60
70
80
90
100
% D
isso
lve
d (
Al d
/Al T)
Time (hours)
0 100 200 300 400 500 600 700
0
50
100
150
200
250
300
350
400
Si (
mM
)
Time (hours)
0 100 200 300 400 500 600 700
0
10
20
30
40
50
60
70
80
90
100
% D
isso
lve
d (
Sid/S
i T)
Time (hours)
6M
(a)
(c)
(e)
(g)
(i)
(k)
(b)
(d)
(f)
(h)
(j)
(l)
15th International Congress on the Chemistry of CementPrague, Czech Republic, September 16–20, 2019
3.1.1 Metakaolin (MK)
In the 1M system (orange dashed lines in Figures 2(a)-(d)), we observe maximum values of Al and Si dissolution— ~26% and ~24% of total content, respectively, corresponding to concentrations of ~34 mM
and ~31 mM—after 24 hours. Thereafter we observe a slight drop in [Si] ([Si]ultimate 26 mM) and almost
no drop in [Al] through 672 hours ([Al]ultimate 32 mM).
Dissolution in 3M NaOH (Figures 2(e)-(h)) is more significant, reaching ~73% (~95 mM) of both Si and Al after 24 hours. This quickly drops off, presumably due to the formation of reaction product ([Si]ultimate
34; [Al]ultimate 31 mM).
In 6M NaOH (Figures 2(i)-(l)), [Al]max of ~112 mM (~87%) is observed after 72 hours, after which there
is observable, yet small decline in concentration ([Al]ultimate 92 mM). [Si]max of ~113 mM is observed at
168-336 hours, and decreases to an even lesser degree by 672 hours ([Si]ultimate 99 mM). The fact that [Al] drops earlier than [Si] agrees with previous observations regarding the precipitation of Al-rich gels at early age (Provis et al. 2005, Chen et al. 2017).
It is clear from the equimolar concentrations of Si and Al in each system that MK undergoes congruent dissolution (i.e. XRF and ICP-OES results both indicate molar Si/Al ratios equal to 1). Still, it is interesting to note the clear differences in solubility of Si and Al in these three systems and the ramifications of such differences. In 1M NaOH, both Si and Al experience minimal solubility, as indicated by low [Si]max and [Al]max. Slight decreases in such concentrations thus suggest only marginal, if any, reaction product formation. In 3M NaOH, while we observe higher solubility of both elements, the severe decline in [Si] and [Al] after reaching maximum concentrations implies steady reaction product precipitation. In 6M NaOH, while observed [Si] and [Al] attain greater absolute values than either of the previous solutions, it is clear again from the limited drop in concentrations that reaction product formation is similarly limited, indicating higher solubility (i.e. lower driving force for product precipitation).
Considering qualitative observations of solid sample quantities post-dissolution, it is also clear that higher NaOH concentrations result in increased MK consumption. It is possible then, that undissolved MK in the 3M NaOH system provided nucleation sites for reaction product formation, while such nucleation sites did not present themselves in the 6M system, resulting in more limited decline in observed [Si] and [Al]. This agrees with previous observations that, especially in solutions with low silicate solubility, heterogeneous nucleation is favored (Cournoyer et al. 1975, Serrano & van Grieken 2001).
3.1.2 Silverton Ash (SA)
As SA is primarily composed of amorphous Si and unburnt carbon, it is no surprise that observed [Al]max is small regardless of alkali concentration and [Si]max approaches a large value, following an apparently asymptotic dissolution trend. [Si]ultimate represents up to 70% of total Si in SA, and up to 80% of amorphous Si. This agrees with previous results obtained by the authors for 0.5M and 1M NaOH systems (Uvegi et al. 2019), and indicates SA’s utility as a silica source.
3.1.3 MK+Si(-SA)
With the introduction of an external Si source in the form of SA-derived Na-silicate, reaction product was expected to form readily. This occurred, particularly in the 6M NaOH system. Initial solution concentrations as measured by ICP-OES are presented in Table 3. Similar to the MK systems, different trends are observed for 1M, 3M, and 6M systems. As observed in Figures 2(a) and 2(e), respectively, in 1M and 3M systems, initial [Al] was lower than the minimum [Al] observed in the MK systems and continued to decreases monotonically with time, indicating immediate and continued consumption of Al by soluble silicate species. This agrees with previous studies in which solubilized aluminates were observed to immediately oligomerize with available silicates (Chen et al. 2017). Similarly, in 1M and 3M systems, [Si]max was observed at the earliest measured time point (6 hours), decreasing steadily with time—again indicating consumption (Figures 2(b) and 2(f)). The quickly achieved maxima agree with results from MK systems: while [Al]max and [Si]max were achieved more quickly in MK+Si(-SA), this can be explained by the high levels of available Si provided by the Na-silicate solution.

15th International Congress on the Chemistry of CementPrague, Czech Republic, September 16–20, 2019
Table 3. Initial elemental concentrations in Na-Silicate used for MK+Si(-SA) systems
Sample ID [Na]initial [Si]initial [Al]initial
1M_MK+Si(-SA) 990 mM 160 mM 2.1 mM
3M_MK+Si(-SA) 3000 mM 240 mM 3.2 mM
6M_MK+Si(-SA) 6000 mM 290 mM 3.9 mM
The 6M system, exhibiting largest Si and Al solubilities in both MK and SA dissolution experiments, here presents clear and dramatic consumption of such elements following initial dissolution. This, therefore, allows for the most straightforward analysis of reaction product chemistry as dictated by the first goal in Section 1. The rest of the paper will thus focus on comparisons between 6M samples, leading to product chemistry quantification.
Given the apparently higher solubility of both Al and Si in 6M NaOH, it is no surprise that [Al]max and [Si]max are observed after extended residence time, after which such concentrations decrease, coinciding with product formation, as observed in Figures 2(i)-(l). This indicates a dormant period during which reactants dissolve to an appropriate solution concentration and after which reaction products must begin to gel, aggregate, and crystallize, consuming a bulk of the available Al and an appropriate amount of Si. This is in agreement with previously described results (Dokter et al. 1995).
Given high initially available silicate concentration in 6M_MK+Si(-SA), we expected immediate consumption of liberated aluminates through oligomerization (Chen et al. 2017), yielding products with
high Si/Al. However, repeated experiments consistently exhibited the formation of products with Si/Al 1, as observed by both ICP-OES calculations (Section 3.1.5) and solids analysis (Section 3.2). Further analysis of silicate species in solution through liquid state NMR might elucidate these observations.
3.1.4 MK+SA dissolution/precipitation
Simultaneous introduction of both MK and SA was expected to bear different results from the introduction of MK into a Na-silicate solution (as discussed in 3.1.3), yielding a product with decreased Si/Al due to limited initial Si availability. While Na-silicate provided high levels of soluble Si, as shown in Table 3, Si availability in MK+SA was expected to follow combined Si dissolution trends of MK and SA as observed separately. However, as is clear from Table 4, Si/Al values for MK+SA were calculated to be larger than those observed in the MK+Si(-SA) systems. Considering the faster dissolution rate of MK than SA, this is hypothesized as due to one of the following phenomena, or some combination thereof:
(1) Ash particles serve as nucleation sites, allowing for different reaction product formation than what was observed in MK+Si(-SA) with higher Si/Al
(2) Soluble Si and Al (from MK dissolution) oligomerize on ash particle surfaces, forming a surface layer and trapping otherwise reactive Si
(3) Slower Si release from ash provides Si at a rate allowing for the formation of a higher Si/Al reaction product
Researchers have previously utilized both carbon (Garcia-Martinez et al. 2001) and a wide variety of aluminosilicate materials (Provis et al. 2005, Serrano & van Grieken 2001) as nucleation sites, giving credence to option (1). Option (2) has also been observed in literature (Fernández-Jimenez et al. 2005, Cournoyer et al. 1975), and follows quite naturally from (1). Given a silicate ash surface with potential heterogeneous nucleation sites, underlying Si will no longer be exposed to the alkaline solution, thereby ceasing dissolution from that region. Option (3) follows from Ostwald’s law in that the kinetics of Si availability must be considered to determine the most likely zeolite structure (Davis and Lobo 1992). These hypotheses are further clarified by the results and discussion presented in Section 3.2 in association with solids characterization.
15th International Congress on the Chemistry of CementPrague, Czech Republic, September 16–20, 2019
3.1.5 Calculation of Si/Al from ICP-OES
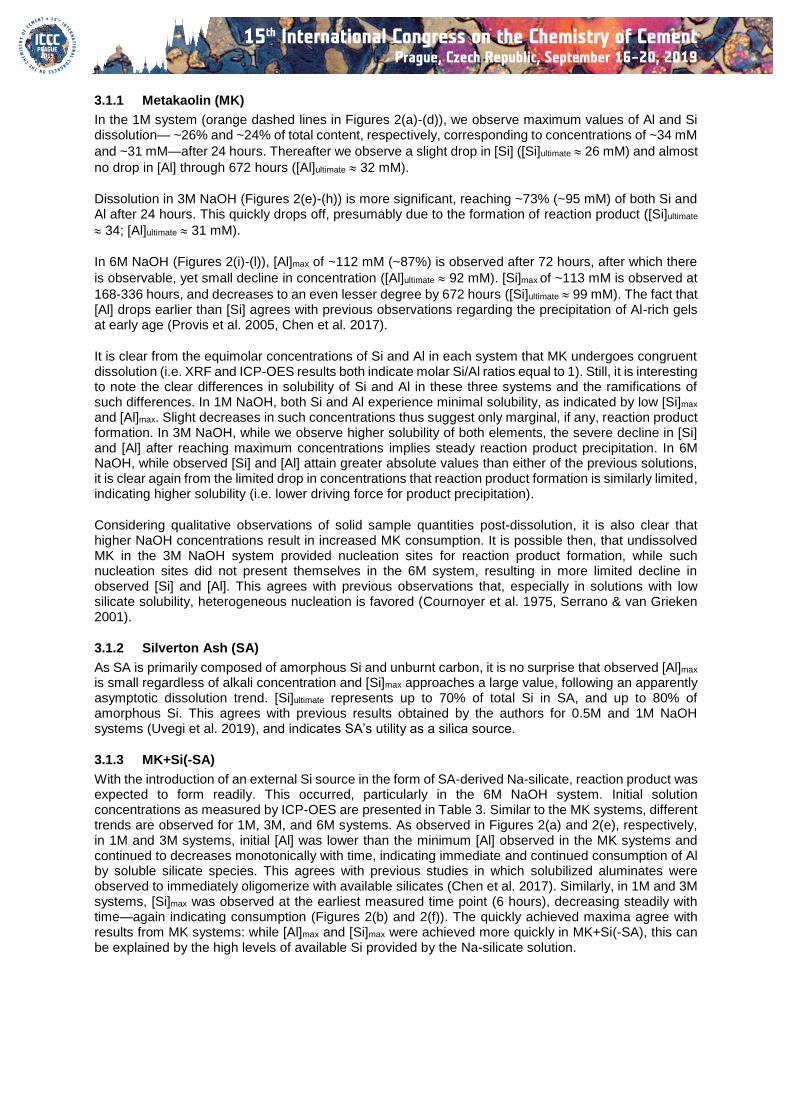
In order to use results presented in Figure 2 to calculate Si/Al of reaction products, we must compare proper quantities. More explicitly, while the control experiments were designed to allow MK and SA to dissolve in isolation, it is clear that some precipitation occurred in MK systems. Drops below [Si]max and [Al]max in control experiments indicate consumption of associated species. To account for this, when calculating reaction product chemistry, observed [Si]max and [Al]max in MK and SA should be carried forward and compared with observed [Si] and [Al] in MK+Si(-SA) and MK+SA systems. Figure 3 presents such a comparison, showing three trends:
In red: sums of [X]observed from MK and SA or produced Na-Silicate solution, as relevant, where X=Si or Al
In black: as in red, sums of [X]observed, carrying maximum observed values forward in time to account for species’ consumption
In blue: observed solution concentrations for MK+Si(-SA) and MK+SA, as labeled
Calculated Si/Al values are shown in Table 4. It is clear that use of [Si]max and [Al]max affects late-age Si/Al values, as illustrated by divergence between black and red lines. Using the same methodology, an Si/Al ratio of ~0.7 can be calculated for just MK reaction in 6M NaOH based on the divergence between observed and max [Si] and [Al] values at 672 hours. This value not only agrees with prior observations regarding early-age precipitation of Al-rich gels (Provis et al. 2005, Chen et al. 2017), but is also reasonable considering the only precursor was MK, exhibiting Si/Al=1.
Taking a closer look at Table 4, the trend at early to middle age seems to diverge from such expectations, while later age values (336, 672 hours) make more sense. This is in line with the major drop off in [Si] and [Al] observed in Figure 3, indicating reaction product formation. From early age, however, [Si] diverges from control values to a greater degree than [Al] (as indicated by increasing Si/Al), contrary to the expectation that an Al enriched gel should precipitate first. Accounting for the possibility of oligomeric silicate units in the MK+Si(-SA) system and the possibility of surface nucleation in the MK+SA system, the higher early age Si/Al values seem more plausible, but do not necessarily reflect the composition of the precipitated product. Given these observations and the large uncertainties in early age samples, only later age (336, 672 hours) values should be considered valid, with earlier values presented for illustrative purposes only. Late-age values are further verified by solids analysis, presented in Section 3.2 .
Table 4. Si/Al ratios of solid reaction products as calculated from ICP-OES results. Calculated values for 6-168 hours maintained for illustrative purposes; 336, 672 hours reflect reasonable
product chemistries, as corroborated by solids analysis.
MK+Si(-SA) (Figure 3(a)) MK+SA (Figure 3(b))
Time (hours)
Si/Al as observed (Red-Blue)
Si/Al from max (Black-Blue)
Si/Al as observed (Red-Blue)
Si/Al from max (Black-Blue)
6 1.66±0.15 1.66±0.15 1.16±0.12 1.16±0.12
24 4±2 4±2 1.67±0.19 1.67±0.19
72 6.1±1.8 6.1±1.8 5.8±1.5 5.8±1.5
168 1.51±0.16 1.36±0.14 4.9±0.6 4.1±0.6
336 1.39±0.05 1.28±0.05 1.79±0.09 1.60±0.08
672 1.14±0.03 1.050±0.015 1.53±0.12 1.33±0.09
15th International Congress on the Chemistry of CementPrague, Czech Republic, September 16–20, 2019
Figure 3. Solution concentration in mM of Al and Si for (a) the MK+Si(-SA) system and (b) the MK+SA system.
3.2 Solids analysis: XRD, 27Al and 29Si MAS-NMR, and SEM
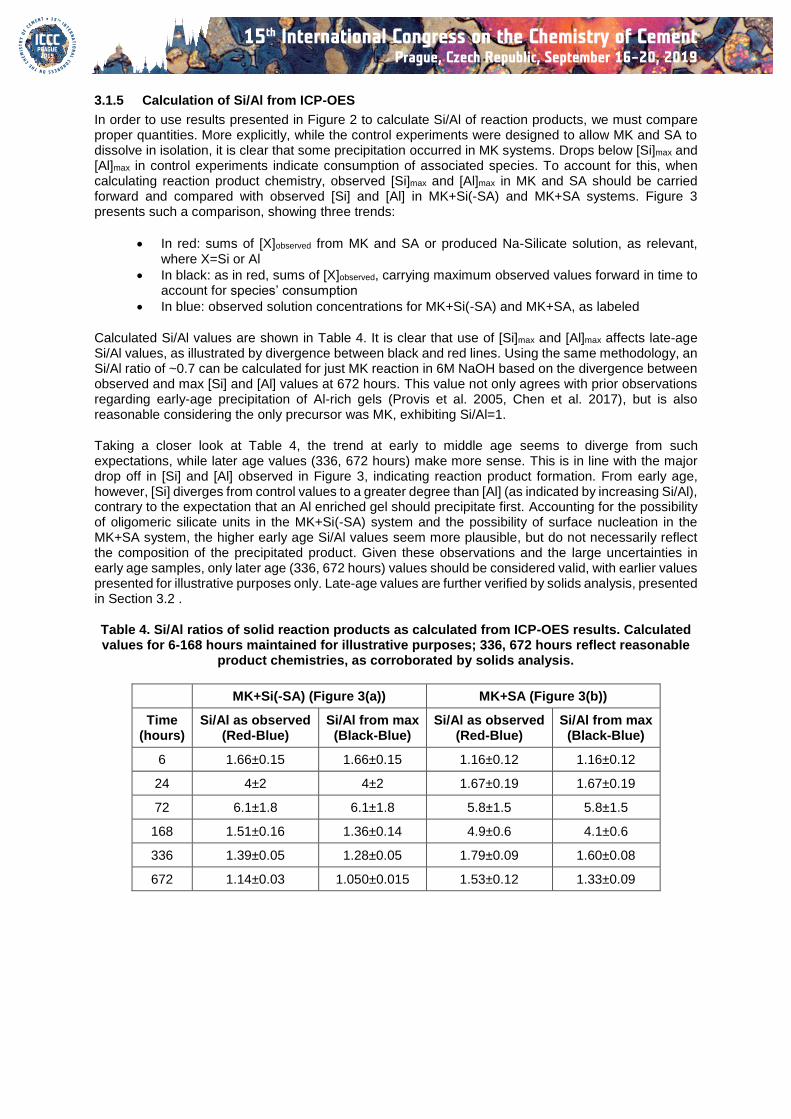
In order to verify Si/Al ratios of solid reaction products as calculated from the ICP-OES results, we characterize reaction products via two other methods; X-ray diffraction patterns and nuclear magnetic resonance spectra of solid post-reaction material. Solid state 27Al and 29Si MAS-NMR are presented in Figure 4. XRD patterns for early and late-age 6M samples as well as 672-hour 1M and 3M samples are presented in Figure 5.
27Al MAS-NMR results presented in Figure 4 illustrate the oft-observed dissolution stages of MK (Chen et al. 2017, Duxson et al. 2005). Al(IV), Al(V), and Al(VI) peaks are observed at ~58-60 ppm, ~27-29 ppm, and ~3-4 ppm, respectively. Demonstrating their relative stabilities, the Al(V) peak is the first to disappear across all systems, indicating the speedy consumption of Al(V) species, owing to their strained coordination in MK (Duxson et al. 2005). Al(VI) species are apparently consumed at different rates across the three systems displayed: MK+Si(SA) > MK+SA > MK from fastest to slowest, in line with levels of available Si in solution. As expected, by 672 hours, the primary remaining peak is that of Al(IV), reminiscent of tetrahedral Al-coordination in both geopolymers and zeolitic species. It is important to note that even though minimal dissolution was observed in 1M and 3M systems, the Al(IV) peak was the only remaining peak observed in such systems as well (not shown).
While in isolation, such 27Al NMR spectra do not indicate formation of a specific reaction product, when viewed in conjunction with 29Si MAS-NMR (Figure 4(e)) and XRD (Figure 5) results, they clearly depict formation of zeolite products after 672 hours (Engelhardt and Michel 1987). Figure 4(e) includes the spectra of 336 and 672 hour 6M MK samples to illustrate that only after 336 hours does product fully form in the MK system. Furthermore, comparison of the 6M_MK 29Si spectra with that of the raw MK presented in Figure 4(d) indicates that while the peak at ~-106 ppm, reminiscent of Q4(0Al) Si units (e.g. due to the presence of quartz), is included under the broad peak typical of raw MK, the relative concentration of such Q4 units is high at 336 hours (before major product precipitation), but decreases after 672 hours due to the precipitation of other species associated with the emerging new peak at ~-83 ppm. Still, given continued observance of the small yet existent peak in the ~-110 ppm region, it is clear that while such Q4(0Al) species lose relative abundance, they remain present, in agreement with XRD results depicting the continued presence of quartz throughout reaction.
0 100 200 300 400 500 600 7000
20
40
60
80
100
120
Al (
mM
)
Time (hours)
0 100 200 300 400 500 600 70020
40
60
80
100
120
Al (
mM
)
Time (hours)
0 100 200 300 400 500 600 700
280
300
320
340
360
380
400
420
Si (
mM
)
Time (hours)
0 100 200 300 400 500 600 70040
80
120
160
200
240
280
320
Si (
mM
)
Time (hours)
(a)
(b)
6M_MK+Si(-SA)_Al 6M_MK+Si(-SA)_Si
6M_MK+SA_Al 6M_MK+SA_Si
15th International Congress on the Chemistry of CementPrague, Czech Republic, September 16–20, 2019
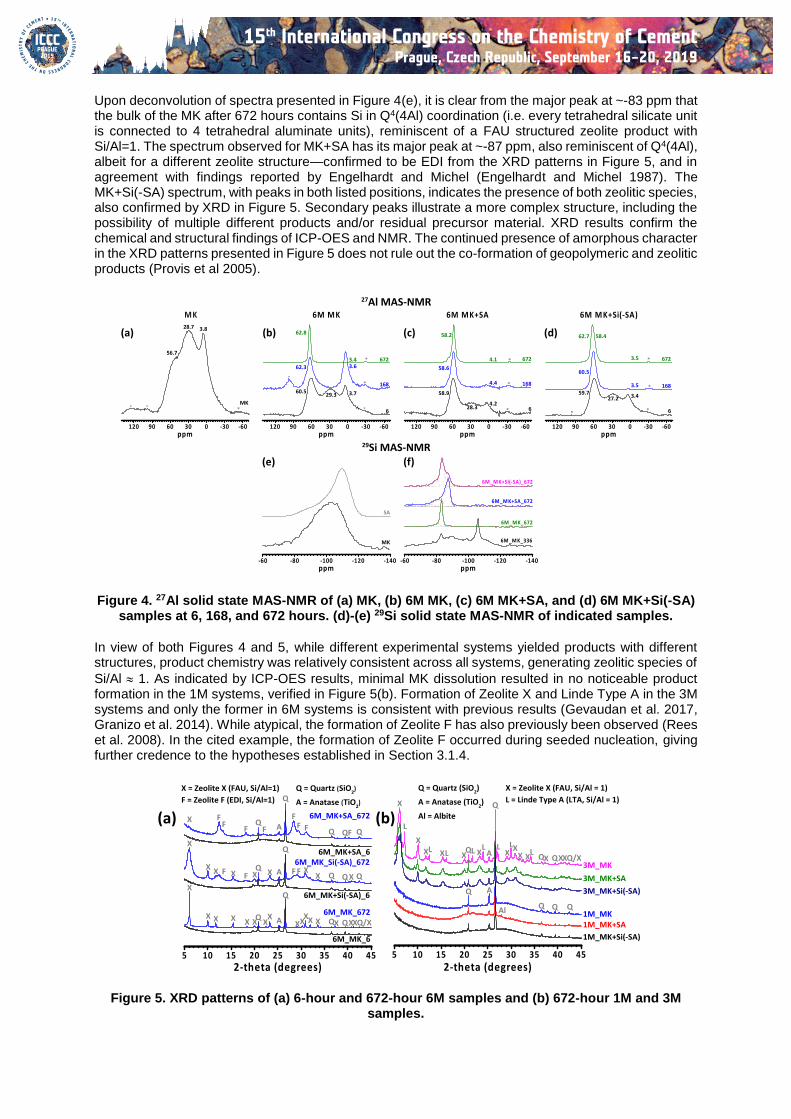
Upon deconvolution of spectra presented in Figure 4(e), it is clear from the major peak at ~-83 ppm that the bulk of the MK after 672 hours contains Si in Q4(4Al) coordination (i.e. every tetrahedral silicate unit is connected to 4 tetrahedral aluminate units), reminiscent of a FAU structured zeolite product with Si/Al=1. The spectrum observed for MK+SA has its major peak at ~-87 ppm, also reminiscent of Q4(4Al), albeit for a different zeolite structure—confirmed to be EDI from the XRD patterns in Figure 5, and in agreement with findings reported by Engelhardt and Michel (Engelhardt and Michel 1987). The MK+Si(-SA) spectrum, with peaks in both listed positions, indicates the presence of both zeolitic species, also confirmed by XRD in Figure 5. Secondary peaks illustrate a more complex structure, including the possibility of multiple different products and/or residual precursor material. XRD results confirm the chemical and structural findings of ICP-OES and NMR. The continued presence of amorphous character in the XRD patterns presented in Figure 5 does not rule out the co-formation of geopolymeric and zeolitic products (Provis et al 2005).
Figure 4. 27Al solid state MAS-NMR of (a) MK, (b) 6M MK, (c) 6M MK+SA, and (d) 6M MK+Si(-SA) samples at 6, 168, and 672 hours. (d)-(e) 29Si solid state MAS-NMR of indicated samples.
In view of both Figures 4 and 5, while different experimental systems yielded products with different structures, product chemistry was relatively consistent across all systems, generating zeolitic species of
Si/Al 1. As indicated by ICP-OES results, minimal MK dissolution resulted in no noticeable product formation in the 1M systems, verified in Figure 5(b). Formation of Zeolite X and Linde Type A in the 3M systems and only the former in 6M systems is consistent with previous results (Gevaudan et al. 2017, Granizo et al. 2014). While atypical, the formation of Zeolite F has also previously been observed (Rees et al. 2008). In the cited example, the formation of Zeolite F occurred during seeded nucleation, giving further credence to the hypotheses established in Section 3.1.4.
Figure 5. XRD patterns of (a) 6-hour and 672-hour 6M samples and (b) 672-hour 1M and 3M samples.
-60 -80 -100 -120 -140
6M_MK+Si(-SA)_672
ppm
6M_MK_336
6M_MK_672
6M_MK+SA_672
-60 -80 -100 -120 -140
SA
MK
ppm
120 90 60 30 0 -30 -60
6M MK+Si(-SA)
3.5
60.5
3.427.259.7
*
*
** 6
168
ppm
6723.5
58.462.7
120 90 60 30 0 -30 -60
6M MK
3.4
62.8
3.6*
*
*
*
62.3
3.729.360.5
ppm
6
168
672
120 90 60 30 0 -30 -60
6M MK+SA
*
*
*4.1
58.2
4.228.3
ppm
6
168
672
58.9
58.6
4.4
120 90 60 30 0 -30 -60ppm
3.828.7
56.7
* **MK
(d)(a) (b)
(e)
(c)
(f)
MK
29Si MAS-NMR
27Al MAS-NMR
5 10 15 20 25 30 35 40 45
6M_MK_672
2-theta (degrees)
6M_MK_6
6M_MK_Si(-SA)_672
6M_MK+Si(-SA)_6
6M_MK+SA_672
6M_MK+SA_6
QFQQFFAFQ
FX
FFF
Q
X
X X F X F XQ
X A
Q
F F XX Q QX Q
X
X X X X XQ
XX A
Q
XXXX X QX QXXQ/X
Q = Quartz (SiO2)
A = Anatase (TiO2)
X = Zeolite X (FAU, Si/Al=1)
F = Zeolite F (EDI, Si/Al=1)
5 10 15 20 25 30 35 40 45
LL
L LLLL
1M_MK+Si(-SA)
1M_MK+SA
2-theta (degrees)
1M_MK
3M_MK+Si(-SA)
3M_MK+SA
3M_MK
X
X
X X XQ X A
Q
XX
X X QX QXXQ/X
L
X = Zeolite X (FAU, Si/Al = 1)
L = Linde Type A (LTA, Si/Al = 1)
Q = Quartz (SiO2)
A = Anatase (TiO2)
Al = Albite
Q A
Q QQAl
(a) (b)

15th International Congress on the Chemistry of CementPrague, Czech Republic, September 16–20, 2019
SEM micrographs are presented in Figure 6. By comparing Figures 6(b) and 6(c), it is clear that while only one zeolite species forms in the MK+SA system, an additional species with distinct morphology forms in the MK+Si(-SA), consistent with the XRD results presented in Figure 5(a). Furthermore, these micrographs allow for further discussion of the hypotheses originally raised in Section 3.1.4. It is clear from Figure 6(a) that in the MK+SA system, product nucleation is driven primarily by heterogeneous nucleation at the ash surface, in agreement with hypothesis (1). While hypothesis (2) is not directly addressed by the images below, it is clear from Figure 6(a) that product growth on the ash surface in MK+SA results in significant surface coverage. Assessed in light of the elevated Si/Al as calculated from ICP-OES results, as well as the indication from XRD and NMR results that the reaction product Si/Al values are in fact closer to 1 than ICP-OES results would suggest, this further supports hypothesis (2). Hypothesis (3) is the most tenuous and can neither be verified nor refuted by the evidence.
Figure 6. SEM Micrographs of (a)-(b) MK+SA and (c) MK+Si(-SA). Notice surface-driven precipitation in (a) and existence of two morphological species in (c) as compard to one in (b)
4. CONCLUSIONS
From the multifaceted characterization approach, it is clear that, as shown previously (Uvegi et al. 2019), one can effectively quantify reaction product chemistry through comparative analysis of dissolution- and reaction-prone samples. In this way, new precursors can both be analyzed for their utility and reactivity in aqueous environments while simultaneously investigating the types of reaction products formed and consumption of available elemental species. In this study, metakaolin was dissolved and reacted in 1M, 3M, and 6M NaOH solutions as well as in the presence of additional reactive silica (i.e. either solid siliceous biomass ash or sodium silicate solution produced through dissolution of said ash). Reaction in 6M NaOH resulted in the highest levels of silica and alumina release from both the metakaolin and the ash, yielding precipitation of zeolitic reaction products. Of note was the different structure of the products formed with and without the presence of solid ash, which seemed to provide heterogeneous nucleation sites. It is also interesting to note that elevated silicate concentrations did not yield higher Si/Al values than 1 in the reaction product. Most importantly, the Si/Al values as calculated by comparative solution analysis yielded values consistent with those observed by secondary solids analysis.
(a) (b)
(c)

15th International Congress on the Chemistry of CementPrague, Czech Republic, September 16–20, 2019
5. ACKNOWLEDGMENTS
We would like to acknowledge the financial support of The MIT Tata Center for Technology and Design (Cambridge, MA), The MIT Environmental Solutions Initiative (Cambridge, MA), as well as the National Science Foundation CAREER award number 1751925. The authors thank Advanced Cement Technologies (Blaine, WA) and Mr. Pankaj Agrawal of Bindlas Duplux LTD. (Muzaffarnagar, India) for providing the materials used in this study. This work made use of the MRSEC Shared Experimental Facilities at MIT, supported by the National Science Foundation under award number DMR-1419807. NMR experiments were carried out by Dr. Caitlin Quinn at the University of Delaware NMR Facility. We would also like to thank Charlie Settens, Bassel Tarabay, and Josh Dennison for their contributions.
6. REFERENCES
Barcelo L, Kline J, Walenta G, & Gartner E (2014). Cement and carbon emissions. Materials and Structures, Volume 47, Issue 6, pp 1055-1065.
Chaunsali P, Uvegi H, Osmundsen R, Laracy M, Poinot T, Ochsendorf J, & Olivetti E (2018). Mineralogical and microstructural characterization of biomass ash binder. Cement and Concrete Composites, Volume 89, pp 41-51.
Chaunsali P, Uvegi H, Traynor B, & Olivetti E (2019). Leaching characteristics of biomass ash-based binder in neutral and acidic media. Cement and Concrete Composites, Volume 100, pp 92-98.
Chen X, Sutrisno A, Zhu L, & Struble L (2017). Setting and nanostructural evolution of metakaolin geopolymer. Journal of the American Ceramic Society, Volume 100, Issue 5, pp 2285-2295.
Cournoyer R, Kranich W, & Sand L (1975). Zeolite crystallization kinetics related to dissolution rates of quartz reactant. The Journal of Physical Chemistry, Volume 79, Issue 15, pp 1578-1581.
Davidovits J (2015). Geopolymer chemistry and applications. Saint-Quentin, France, Institut Géopolymère.
Davis M, & Lobo R (1992). Zeolite and molecular sieve synthesis. Chemistry of Materials, Volume 4, Issue 4, pp 756-768.
De Silva P, Sagoe-Crenstil K, & Sirivivatnanon V (2007). Kinetics of geopolymerization: Role of Al2O3 and SiO2. Cement and Concrete Research, Volume 37, Issue 4, pp 512-518.
Dokter WH, van Garderen HF, Beelen TPM, van Santen RA, & Bras W (1995). Homogeneous versus heterogeneous zeolite nucleation. Angewandte Chemie International Edition in English, Volume 34, Issue 1, pp 73-75.
Duxson P, Lukey GC, Separovic F, & van Deventer JSJ (2005). Effect of alkali cations on aluminum incorporation in geopolymeric gels. Industrial and Engineering Chemistry Research, Volume 44, Issue 4, pp 832-839.
Duxson P, Mallicoat SW, Lukey GC, Kriven WM, & van Deventer JSJ (2007). The effect of alkali and Si/Al ratio on the development of mechanical properties of metakaolin-based geopolymers. Colloids and Surfaces A: Physicochemical and Engineering Aspects, Volume 292, Issue 1, pp 8-20.
Engelhardt G, & Michel D (1987). High-resolution solid-state NMR of silicates and zeolites. Chichester [West Sussex], Wiley.
Fernandez-Jimenez A, De La Torre AG, Palomo A, Lopez-Olmo G, Alonso MM, & Aranda MAG (2006). Quantitative determination of phases in the alkali activation of fly ash. Part I. Potential ash reactivity. Fuel, Volume 85, Issue 5-6, pp 625-634.

15th International Congress on the Chemistry of CementPrague, Czech Republic, September 16–20, 2019
García-Martínez J, Cazorla-Amorós D, Linares-Solano A, & Lin YS (2001). Synthesis and characterisation of MFI-type zeolites supported on carbon materials. Microporous and Mesoporous Materials, Volume 42, Issue 2-3, pp 255-268.
Gevaudan JP, Campbell KM, Kane TJ, Shoemaker RK, & Srubar WV (2017). Mineralization dynamics of metakaolin-based alkali-activated cements. Cement and Concrete Research, Volume 94, pp 1-12.
Granizo N, Palomo A, & Fernandez-Jiménez A (2014). Effect of temperature and alkaline concentration on metakaolin leaching kinetics. Ceramics International, Volume 40, Issue 7, pp 8975-8985.
Habert G, d’Espinose de Lacaillerie JB, & Roussel N (2011). An environmental evaluation of geopolymer based concrete production: reviewing current research trends. Journal of Cleaner Production, Volume 19, Issue 11, pp 1229-1238.
Kamseu E, Beleuk à Moungam LM, Cannio M, Billong N, Chaysuwan D, Melo UC, & Leonelli C (2017). Substitution of sodium silicate with rice husk ash-NaOH solution in metakaolin based geopolymer cement concerning reduction in global warming. Journal of Cleaner Production, Volume 142, pp 3050-3060.
Lee Y-R, Soe JT, Zhang S, Ahn J-W, Park MB, & Ahn W-S (2017). Synthesis of nanoporous materials via recycling coal fly ash and other solid wastes: A mini review. Chemical Engineering Journal, Volume 317, pp 821-843.
Lippmaa E, Maegi M, Samoson A, Tarmak M, & Engelhardt G (1981). Investigation of the structure of zeolites by solid-state high-resolution silicon-29 NMR spectroscopy. Journal of the American Chemical Society, Volume 103, Issue 17, pp 4992-4996.
Palomo A, Blanco-Varela MT, Granizo ML, Puertas F, Vazquez T, & Grutzeck MW (1999). Chemical stability of cementitious materials based on metakaolin. Cement and Concrete Research, Volume 29, Issue 7, pp 997-1004.
Provis JL, Lukey GC, & van Deventer JSJ (2005). Do geopolymers actually contain nanocrystalline zeolites? A reexamination of existing results. Chemistry of Materials, Volume 17, Issue 12, pp 3075-3085.
Rees CA, Provis JL, Lukey, GC, & van Deventer, JSJ (2008). The mechanism of geopolymer gel formation investigated through seeded nucleation. Colloids and Surfaces A: Physicochemical and Engineering Aspects, Volume 318, Issue 1-3, pp 97-105.
Serrano D, & van Grieken R (2001). Heterogeneous events in the crystallization of zeolites. Journal of Materials Chemistry, Volume 11, Issue 10, pp 2391-2407.
Uvegi H, Chaunsali P, Traynor B, & Olivetti E (2019). Reactivity of industrial wastes as measured through ICP-OES: A case study on siliceous Indian biomass ash. Journal of the American Ceramic Society, Volume 00 (Early View), pp 1– 11.
Vempati RK, Borade R, Hedge RS, & Komarneni S (2006). Template free ZSM-5 from siliceous rice hull ash with varying C contents. Microporous and Mesoporous Materials, Volume 93, pp 134-140.


![15th International Congress of Therapeutic Drug Monitoring ...IATDMCT2017]Sponsorbook.pdf · The 15th Congress of the International Association of Therapeutic Drug Monitoring & Clinical](https://img.dokumen.tips/doc/110x75/5f4c7ffcea82c067f448d4b0/15th-international-congress-of-therapeutic-drug-monitoring-iatdmct2017sponsorbookpdf.jpg)