Embed Size (px)
Citation preview

PAN AMERICAN SILVER CORP. ANNUAL REPORT 2010
15 Years of Harvesting Silver
VANCOUVER OFFICECORPORATE HEADQUARTERS
Pan American Silver Corp.1500 – 625 Howe StreetVancouver, British ColumbiaCanada, V6C 2T6
T. 604-684-1175 F. [email protected]
www.panamericansilver.com
MEXICO OFFICE
Plata Panamericana S.A. de C.V.T. 52-618-128-0709 x 101F. 52-618-128-0692 x 102Country Manager – Chris Warwick
PERU OFFICE
Pan American Silver Peru S.A.C.T. 51-1-618-9700 F. 51-1-618-9729Country Manager – Jorge Ugarte
ARGENTINA OFFICE
Pan American Silver ArgentinaT. 54-11-4816-3220F. 54-11-4816-3227Country Manager – Bret Boster
BOLIVIA OFFICE
Pan American Silver (Bolivia) S.A.T. 59-1-2-279-6690 F. 59-1221-54216Country Manager – Andres Gonzales
PAN
AM
ER
ICA
N S
ILVE
R C
OR
P. A
NN
UA
L RE
POR
T 2010

DIRECTORSRoss J. Beaty – ChairmanGeoff Burns – President & Chief Executive Officer Michael Carroll (Independent)Bill A. Fleckenstein (Independent)Michael J.J. Maloney (Independent)Robert Pirooz – General CounselDavid Press (Independent)Walter Segsworth (Independent)Paul B. Sweeney (Independent)
EXECUTIVE MANAGEMENT – VANCOUVERGeoff Burns – President & Chief Executive OfficerSteven Busby – Chief Operating Officer Andres Dasso – Sr. VP, Mining OperationsRob Doyle – Chief Financial Officer Delaney Fisher – Corporate Secretary & Legal CounselGeorge Greer – VP, Project DevelopmentSean McAleer – VP, Human Resources & SecurityRobert Pirooz – General CounselMichael Steinmann – Executive VP, Geology & ExplorationWayne Vincent – VP, Accounting & Financial ReportingMartin Wafforn – VP, Technical Services
AUDITORSDeloitte & Touche LLP, Chartered Accountants2800 – 1055 Dunsmuir StreetVancouver, British ColumbiaCanada, V7X 1P4
LEGAL COUNSELBorden Ladner Gervais1200 – 200 Burrard StreetVancouver, British Columbia,Canada, V7X 1T2
AUTHORIZED CAPITAL200,000,000 common shares without par value
ISSUED CAPITALDecember 31, 2010: 107,791,368 common shares
TRADING INFORMATIONNASDAQ: PAASTSX: PAA
REGISTRAR & TRANSFER AGENTComputershare Investor Services Inc.510 Burrard Street, 3rd FloorVancouver, British ColumbiaCanada, V6C 3B91-800-564-6253
ANNUAL GENERAL MEETINGWednesday, May 18, 2011Four Seasons Hotel, Seasons Ballroom 791 West Georgia St. Vancouver, BC
EXECUTIVE MANAGEMENT – VANCOUVER (L to R) Wayne Vincent, Sean McAleer, Delaney Fisher, Steve Busby, George Greer, Geoff Burns, Rob Doyle, Martin Wafforn, Michael Steinmann, Robert Pirooz, Andres Dasso.
DIRECTORS (L to R) Bill A. Fleckenstein, David Press, Robert Pirooz, Ross Beaty, Geoff Burns, Walter Segsworth, Michael Carroll, Paul Sweeney. Not pictured: Michael Maloney.
TABLE OF CONTENTS
Financial Highlights 02
Operations/Projects Map 03
Chairman’s Message to the Shareholders 04
President’s Message to the Shareholders 06
The Silver Market 2010 08
Exploration 10
Project Development: Navidad 13
Social Responsibility 16
Cautionary Note to US Investors 20
Properties at a Glance 21
Financial Statements 22
Corporate Information IBC
CAUTIONARY NOTE REGARDING FORWARD-LOOKING STATEMENTS
CERTAIN OF THE STATEMENTS AND INFORMATION IN THIS ANNUAL REPORT CONSTITUTE “FORWARD-LOOKING STATEMENTS” WITHIN THE MEANING OF THE UNITED STATES PRIVATE
SECURITIES LITIGATION REFORM ACT OF 1995 AND “FORWARD-LOOKING INFORMATION” WITHIN THE MEANING OF APPLICABLE CANADIAN PROVINCIAL SECURITIES LAWS RELATING
TO THE COMPANY AND ITS OPERATIONS. ALL STATEMENTS, OTHER THAN STATEMENTS OF HISTORICAL FACT, ARE FORWARD-LOOKING STATEMENTS. WHEN USED IN THIS ANNUAL
REPORT THE WORDS, “BELIEVES”, “EXPECTS”, “INTENDS”, “PLANS”, “FORECAST”, “OBJECTIVE”, “OUTLOOK”, “POSITIONING”, “POTENTIAL”, “ANTICIPATED”, “BUDGET”, AND OTHER SIMILAR
WORDS AND EXPRESSIONS, IDENTIFY FORWARD-LOOKING STATEMENTS OR INFORMATION. THESE FORWARD-LOOKING STATEMENTS OR INFORMATION RELATE TO, AMONG OTHER
THINGS: FUTURE PRODUCTION OF SILVER, GOLD AND OTHER METALS; FUTURE CASH COSTS PER OUNCE OF SILVER; THE PRICE OF SILVER AND OTHER METALS; THE EFFECTS OF LAWS,
REGULATIONS AND GOVERNMENT POLICIES AFFECTING PAN AMERICAN’S OPERATIONS OR POTENTIAL FUTURE OPERATIONS, INCLUDING BUT NOT LIMITED TO, LAWS IN THE PROVINCE
OF CHUBUT, ARGENTINA, WHICH, CURRENTLY HAVE SIGNIFICANT RESTRICTIONS ON MINING; FUTURE SUCCESSFUL DEVELOPMENT OF THE NAVIDAD PROJECT, THE LA PRECIOSA
PROJECT, AND OTHER DEVELOPMENT PROJECTS OF THE COMPANY; THE SUFFICIENCY OF THE COMPANY’S CURRENT WORKING CAPITAL, ANTICIPATED OPERATING CASH FLOW OR ITS
ABILITY TO RAISE NECESSARY FUNDS; THE ACCURACY OF MINERAL RESERVE AND RESOURCE ESTIMATES; ESTIMATED PRODUCTION RATES FOR SILVER AND OTHER PAYABLE METALS
PRODUCED BY THE COMPANY; TIMING OF PRODUCTION AND THE CASH AND TOTAL COSTS OF PRODUCTION AT EACH OF THE COMPANY’S PROPERTIES; THE ESTIMATED COST OF
AND AVAILABILITY OF FUNDING NECESSARY FOR SUSTAINING CAPITAL; ONGOING OR FUTURE DEVELOPMENT PLANS AND CAPITAL REPLACEMENT, IMPROVEMENT OR REMEDIATION
PROGRAMS; THE ABILITY OF THE COMPANY TO REDUCE ENVIRONMENTAL IMPACTS, INCLUDING A REDUCTION IN GREENHOUSE GAS EMISSIONS, AND TO IMPROVE SUSTAINABILITY IN ITS
OPERATIONS AND PROJECTS; THE ESTIMATES OF EXPECTED OR ANTICIPATED ECONOMIC RETURNS FROM THE COMPANY’S MINING PROJECTS, AS REFLECTED IN TECHNICAL REPORTS
OR OTHER ANALYSES PREPARED IN RELATION TO DEVELOPMENT OF PROJECTS; ESTIMATED EXPLORATION EXPENDITURES TO BE INCURRED ON THE COMPANY’S VARIOUS PROPERTIES;
FORECAST CAPITAL AND NON-OPERATING SPENDING; FUTURE SALES OF THE METALS, CONCENTRATES OR OTHER PRODUCTS PRODUCED BY THE COMPANY; AND THE COMPANY’S PLANS
AND EXPECTATIONS FOR ITS PROPERTIES AND OPERATIONS.
THESE STATEMENTS REFLECT THE COMPANY’S CURRENT VIEWS WITH RESPECT TO FUTURE EVENTS AND ARE NECESSARILY BASED UPON A NUMBER OF ASSUMPTIONS AND ESTIMATES
THAT, WHILE CONSIDERED REASONABLE BY THE COMPANY, ARE INHERENTLY SUBJECT TO SIGNIFICANT BUSINESS, ECONOMIC, COMPETITIVE, POLITICAL AND SOCIAL UNCERTAINTIES
AND CONTINGENCIES. MANY FACTORS, BOTH KNOWN AND UNKNOWN, COULD CAUSE ACTUAL RESULTS, PERFORMANCE OR ACHIEVEMENTS TO BE MATERIALLY DIFFERENT FROM
THE RESULTS, PERFORMANCE OR ACHIEVEMENTS THAT ARE OR MAY BE EXPRESSED OR IMPLIED BY SUCH FORWARD-LOOKING STATEMENTS CONTAINED IN THIS ANNUAL REPORT
AND THE COMPANY HAS MADE ASSUMPTIONS AND ESTIMATES BASED ON OR RELATED TO MANY OF THESE FACTORS. SUCH FACTORS INCLUDE, WITHOUT LIMITATION: FLUCTUATIONS
IN SPOT AND FORWARD MARKETS FOR SILVER, GOLD, BASE METALS AND CERTAIN OTHER COMMODITIES (SUCH AS NATURAL GAS, FUEL OIL AND ELECTRICITY); FLUCTUATIONS IN
CURRENCY MARKETS (SUCH AS THE PERUVIAN SOL, MEXICAN PESO, ARGENTINE PESO, BOLIVIAN BOLIVIANO AND CANADIAN DOLLAR VERSUS THE U.S. DOLLAR); RISKS RELATED
TO THE TECHNOLOGICAL AND OPERATIONAL NATURE OF THE COMPANY’S BUSINESS; CHANGES IN NATIONAL AND LOCAL GOVERNMENT, LEGISLATION, TAXATION, CONTROLS OR
REGULATIONS AND POLITICAL OR ECONOMIC DEVELOPMENTS IN CANADA, THE UNITED STATES, MEXICO, PERU, ARGENTINA, BOLIVIA OR OTHER COUNTRIES WHERE THE COMPANY MAY
CARRY ON BUSINESS IN THE FUTURE; RISKS AND HAZARDS ASSOCIATED WITH THE BUSINESS OF MINERAL EXPLORATION, DEVELOPMENT AND MINING (INCLUDING ENVIRONMENTAL
HAZARDS, INDUSTRIAL ACCIDENTS, UNUSUAL OR UNEXPECTED GEOLOGICAL OR STRUCTURAL FORMATIONS, PRESSURES, CAVE-INS AND FLOODING); RISKS RELATING TO THE CREDIT
WORTHINESS OR FINANCIAL CONDITION OF SUPPLIERS, REFINERS AND OTHER PARTIES WITH WHOM THE COMPANY DOES BUSINESS; INADEQUATE INSURANCE, OR INABILITY TO OBTAIN
INSURANCE, TO COVER THESE RISKS AND HAZARDS; EMPLOYEE RELATIONS; RELATIONSHIPS WITH AND CLAIMS BY LOCAL COMMUNITIES AND INDIGENOUS POPULATIONS; AVAILABILITY
AND INCREASING COSTS ASSOCIATED WITH MINING INPUTS AND LABOUR; THE SPECULATIVE NATURE OF MINERAL EXPLORATION AND DEVELOPMENT, INCLUDING THE RISKS OF
OBTAINING NECESSARY LICENSES AND PERMITS AND THE PRESENCE OF LAWS AND REGULATIONS THAT MAY IMPOSE RESTRICTIONS ON MINING, INCLUDING THOSE CURRENTLY IN
THE PROVINCE OF CHUBUT, ARGENTINA; DIMINISHING QUANTITIES OR GRADES OF MINERAL RESERVES AS PROPERTIES ARE MINED; GLOBAL FINANCIAL CONDITIONS; THE COMPANY’S
ABILITY TO COMPLETE AND SUCCESSFULLY INTEGRATE ACQUISITIONS AND TO MITIGATE OTHER BUSINESS COMBINATION RISKS; CHALLENGES TO, OR DIFFICULTY IN MAINTAINING, THE
COMPANY’S TITLE TO PROPERTIES AND CONTINUED OWNERSHIP THEREOF; THE ACTUAL RESULTS OF CURRENT EXPLORATION ACTIVITIES, CONCLUSIONS OF ECONOMIC EVALUATIONS,
AND CHANGES IN PROJECT PARAMETERS TO DEAL WITH UNANTICIPATED ECONOMIC OR OTHER FACTORS; INCREASED COMPETITION IN THE MINING INDUSTRY FOR PROPERTIES,
EQUIPMENT, QUALIFIED PERSONNEL, AND THEIR COSTS; AND THOSE FACTORS IDENTIFIED UNDER THE CAPTION “RISKS RELATED TO PAN AMERICAN’S BUSINESS” IN THE COMPANY’S
MOST RECENT FORM 40-F AND ANNUAL INFORMATION FORM FILED WITH THE UNITED STATES SECURITIES AND EXCHANGE COMMISSION AND CANADIAN PROVINCIAL SECURITIES
REGULATORY AUTHORITIES. INVESTORS ARE CAUTIONED AGAINST ATTRIBUTING UNDUE CERTAINTY OR RELIANCE ON FORWARD-LOOKING STATEMENTS. ALTHOUGH THE COMPANY
HAS ATTEMPTED TO IDENTIFY IMPORTANT FACTORS THAT COULD CAUSE ACTUAL RESULTS TO DIFFER MATERIALLY, THERE MAY BE OTHER FACTORS THAT CAUSE RESULTS NOT TO BE AS
ANTICIPATED, ESTIMATED, DESCRIBED OR INTENDED. THE COMPANY DOES NOT INTEND, AND DOES NOT ASSUME ANY OBLIGATION, TO UPDATE THESE FORWARD-LOOKING STATEMENTS
OR INFORMATION TO REFLECT CHANGES IN ASSUMPTIONS OR CHANGES IN CIRCUMSTANCES OR ANY OTHER EVENTS AFFECTING SUCH STATEMENTS OR INFORMATION, OTHER THAN AS
REQUIRED BY APPLICABLE LAW.

Our mission is to be the largest low-cost primary silver producer in the world and our strategy to
achieve this is to continuously increase our silver reserves and our low-cost silver production through
the efficient operation of our existing mines and the responsible development of our projects. In 2010,
our fifteenth consecutive year of production growth, we produced a record 24.3 million ounces of
silver and generated the highest financial returns in our history. At the same time, we earned several
awards for our commitment to the safety of our operations and the sustainable development of the
communities where we operate. Fifteen years on, Pan American Silver remains as committed as
ever, to generating solid returns for our shareholders and well-being for all of our stakeholders.

HIGHLIGHTS OF 2010PRODUCTION 2010 2009
Silver ounces 24,285,794 23,043,539
Gold ounces 89,556 100,704
Zinc tonnes 43,103 44,246
Lead tonnes 13,628 14,328
Copper tonnes 5,221 6,446
Cash costs per silver ounce1 $ 5.69 $ 5.53
Total cost per silver ounce1 $ 9.51 $ 9.57
Average silver price (London fix) $ 20.14 $ 14.67
FINANCIAL (millions except per share amount)
Sales $ 632.0 $ 454.8
Mine operating earnings2 $ 239.8 $ 126.0
Net income $ 112.6 $ 62.0
Net income per share (basic) $ 1.05 $ 0.71
Cash flow from operating activities3 $ 218.3 $ 151.7
STAKEHOLDERS
Common shares outstanding at Dec 31 (millions) 107.8 105.1
Employees and Contractors 7,068 6,729
1 Cash costs per silver ounce and total costs per silver ounce are non-GAAP measures. A reconciliation is
included in the Company’s MD&A on page 44.2 Mine operating earnings are equal to sales less cost of sales less depreciation and amortization.3 Net cash flow from operations is shown before adjustments for non-cash working capital items.
A SENIOR SILVER PRODUCER
WITH AN OUTSTANDING
GROWTH PROFILE
In 2010, Pan American Silver produced 24.3 million
ounces of silver. With seven operating mines
and two key development projects, Pan American
offers outstanding exposure to silver and a growth
profile that is second to none in its industry.
PAN AMERICAN SILVER CORP. | ANNUAL REPORT 20102
ALAMO DORADO | MEXICO

HEAD OFFICE, VANCOUVER
1 ALAMO DORADO
2 LA PRECIOSA (JV)
3 LA COLORADA
4 QUIRUVILCA
5 HUARON
6 MOROCOCHA
7 PICO MACHAY
8 SAN VICENTE
9 CALCATREU
10 NAVIDAD
11 MANANTIAL ESPEJO
CANADA
MEXICO
NORTH AMERICA
SOUTH AMERICA
PERU
BOLIVIA
ARGENTINA
MINING OPERATIONS
DEVELOPMENT PROJECTS
1
2
3
4
5
6
7
8
9
10
11
3OPERATIONS / PROJECTS MAP

CHAIRMAN’S MESSAGE
TO SHAREHOLDERS
It is again my absolute pleasure to write to our shareholders and express my delight at how well our Company is performing. We had another record year in 2010 and, quite frankly, I genuinely feel that Pan American’s future has never been more promising. This is mainly due to three things:
(1) Our exceptional financial condition. We ended 2010 with cash and near-cash holdings of $360 million, working capital of $434 million and no debt. We are generating very significant amounts of cash today and I expect we will be able to readily finance our future growth plans and our growing dividends.
(2) Our enormous Navidad silver project in Argentina.I believe that we will be able to commence Navidad’s development near the end of 2011, which will lead to a dramatic increase in our silver production from today’s level of about 24 million ounces annually to over 40 million ounces. This should position Pan American as the world’s largest primary silver mining company and allow us to deliver even greater financial returns to our shareholders. Navidad’s plus billion ounces of silver reserves and resources will profoundly increase our leverage to higher silver prices.
(3) Our extraordinary management team. We have built or done major expansions at five mines in the last seven years, on budget and on schedule. This is much easier said than done. Our record is a testament to the high quality of our operating, development, administrative and
financial teams. Pan American is blessed to have such fine men and women working to build our enterprise, and to have tremendous support of the communities and countries where we work and the outstanding service companies and contractors that assist our operations.
Pan American Silver Corp. is now one of the world’s “senior” silver producers, and is seen as a market and management leader in the silver mining industry. I hope all shareholders feel as proud as I am about this achievement, and at our having done it while:
Preserving healthy and safe working conditions for our workers,
Applying honest and ethical business practices, and,
Maintaining open and transparent reporting, and good corporate governance.
We have an excellent reputation in the mining industry and we have earned it with good practices. This alone is worth celebrating, but we have also delivered to our shareholders excellent financial returns and none better than the year just ended.
With Navidad, we are today poised to take another great leap forward – kind of like we made in 2002 when we began an aggressive mine development program that moved us from being a one-mine company to a seven-mine company by 2009. I hope you share my excitement
“We ended 2010
with cash and
near-cash holdings
of $360 million,
working capital of
$434 million and
no debt.”
Ross J. Beaty Chairman
PAN AMERICAN SILVER CORP. | ANNUAL REPORT 20104

about this potential and will watch as we execute it. Development of Navidad will give Pan American something it has never had: a world-class, long-life and low-cost silver mine. We expect we will have the same positive experience we have had with our Manantial Espejo Mine, located like Navidad in the great silver mining country of Argentina – a country that, after all, has
“silver” embedded in its name.
Silver prices are in an amazing up trend for fundamental reasons: more demand than supply. Silver prices, like gold prices and most other commodities, are responding to secular forces – long-term weakness in the US dollar; extraordinary industrial demand growth in China; unprecedented investor demand for silver coins, bars and ETF silver bullion and new commodity asset classes that are bringing more investment funds into physical metal ownership. All of these factors are giving us robust metals markets, with none as strong as the silver market. Silver has outperformed gold in recent months and many are calling for even higher prices ahead. Our record silver production could not have been better timed to coincide with such good silver markets!
I know I speak for all our shareholders when I extend my thanks to all of Pan American’s Board of Directors for their hard work and dedication, and to our management teams and employees at all our operations and project locations for such outstanding results in 2010. By the same token I extend my thanks to our shareholders for their support – in good times like now, and in the tough
times we had to live through from 1997-2002 and during the global financial meltdown in late 2008 and early 2009. We are today laying the building blocks for our next “great leap forward” with development of Navidad and other growth projects in the coming years, and I look forward to reporting on these projects in my next message to you in 2012.
Ross J. Beaty Chairman
5CHAIRMAN’S MESSAGETO SHAREHOLDERS
LA COLORADA | MEXICO

PRESIDENT’S MESSAGE
TO SHAREHOLDERS
When Pan American Silver was created in 1994, the silver market was vastly different from what it is today. Silver demand far exceeded new mine supply, an ounce of silver sold for approximately $5 and there were only a handful of mining companies that focused on silver mining and offered real exposure to the metal. Fast forward 15 years and the face of the silver industry has changed dramatically: the number of companies focused on silver has multiplied, competition for silver deposits has intensified, silver has regained its role as a store of value and the price of silver has been on a tear, hitting new records almost daily.
Just like the silver industry, through this time Pan American has also experienced a dramatic change. From being a newcomer to the industry with just one mining operation in Peru, in just 15 years we have become the second-largest primary silver producer in the world, with seven mining operations in four different countries across Latin America and over 7,000 employees worldwide.
But we have not just grown; we have matured as an organization, forging ourselves a reputation as a well-founded and experienced mining Company that delivers on its production targets; generating solid financial returns for our shareholders and well-being for the communities where we operate. This was never more evident than in 2010, when once again we delivered on the forecasts we set at the beginning of the year and rewrote several important records.
Last year, our 15th consecutive year of production growth, we increased our annual silver production by 5% to a record 24.3 million ounces of silver at a cash cost of $5.69 per ounce, we generated record net income of approximately $113 million or $1.05 per share and our cash flow from operations increased to a record $218 million or $2.04 per share. As a consequence we ended 2010 with $360 million in the bank and our working capital reached an all-time high of $434 million.
Building on our operational and financial strength we were also able to achieve a historic milestone when we declared our first semi-annual cash dividend in February of 2010, and although it may have seemed modest at $0.025 per share, just a few months later we increased the frequency of our dividend distributions from semi-annual to quarterly, effectively doubling the total amount paid out to each of our shareholders annually.
Instituting a cash dividend was not only a way to reward your continued support; it was also an expression of confidence in our ability to carry on generating healthy financial returns without jeopardizing our future growth. Our fiscal discipline has enabled us to grow in an orderly and managed way. We are at the brink of what we expect will be the largest growth phase in our history, by a couple of orders of magnitude, and we are confident that we can continue to deliver superior financial returns, while we take on the task of responsibly developing the world class Navidad silver project in Argentina.
“Last year we
generated record
net income of
approximately
$113 million
or $1.05 per
share.”
Geoff Burns President & Chief Executive Officer
PAN AMERICAN SILVER CORP. | ANNUAL REPORT 20106

For Pan American, 2010 was also a year of awards. For the second time in their history, each of our Mexican operations (Alamo Dorado and La Colorada) received the prestigious “Casco de Plata” award as safest open cut and underground mining operations, respectively, in the country. Our Peruvian operations were distinguished with a prestigious award for our work with our local communities on sustainable development and our San Vicente mine in Bolivia was ranked 3rd in the entire country, across all business sectors for its efforts to support community-driven sustainable development programs. For me, these awards are as important as any of our other production or financial records, because they reflect our commitment to being fully fledged members of the communities where we work and sharing our good fortune with those who generate or contribute to it by working with us or hosting us.
Our objectives for 2011 are well defined. Our silver production will remain stable at between 23 to 24 million ounces, while we expect our gold production will be between 76,000 to 78,000 ounces. We do expect our cash costs to increase to the $7.00 to $7.50 per ounce range, as a direct consequence of the inflationary pressures that all companies which operate in the resource sector are facing. Given the current metal price environment we should continue to generate excellent cash flows and healthy net income quarter after quarter throughout 2011.
While we work to optimize our maturing operating asset base, we will continue with the technical work we initiated
at our two development projects. We intend to produce a Preliminary Assessment for the La Preciosa project by mid-year, and a full Feasibility Report for the Navidad project in the fourth quarter of this year. We remain confident that our policy of open and frank communication with the local communities, the provincial and federal governments and our demonstrated construction and social integration capabilities in Argentina will ultimately lead to an amendment of the mining law in Chubut, which will pave the way for the responsible development of Navidad.
I would like to close by taking this opportunity to personally thank all of our employees and contractors whose unwavering commitment to the principles of operational excellence and safety have been the single most important driver of our success. Of course, there are our shareholders whose confidence continues to push us forward, to create or find new value through exploration, innovation and simple hard work.
Geoff Burns President & Chief Executive Officer
7PRESIDENT’S MESSAGETO SHAREHOLDERS
GOBERNADOR GREGORES | ARGENTINA

SILVER IS SHINING BRIGHT
In 2010, silver performed exceedingly well. It began the year selling at US$17.17 per ounce on the London Bullion Market and finished the year at a decades-long record of $30.63 per ounce on December 31st.
The deep economic woes in the US and Europe, coupled with worldwide fears of inflation and historically low interest rates fuelled investment demand and provided strong support for the price of silver, which remained firmly above 2009’s annual average of US$14.67 per ounce throughout the first half of 2010.
The second half of the year saw a surge in silver prices after the summer, when silver broke above the US$20 per ounce mark and never looked back. Fueled by China’s seemingly insatiable appetite for industrial metals, in particular copper, silver benefited from the “contagion effect”, which focused on silver’s industrial characteristics, particularly in the fabrication of consumer electronics.
But the main driver of silver’s strong performance has been and continues to be investment demand. The incredible
amount of cash issued in recent years by the US and some European countries is finally being re-deployed to both stock markets and commodities like gold and silver. According to the CPM Group, in 2010, investors added 123 million ounces to their silver ETFs and the combined silver ETFholdings totaled almost 600 million ounces at March 11, 2011.
Silver averaged $20.16 per ounce during 2010 and so far, in 2011 silver has remained firmly above the $30 per ounce mark, repeatedly setting new single day highs.
According to Goldfields Mineral Services (GFMS), this year the silver market will be in a small surplus; however, expectations of tight fiscal policies to curb spending and reign in the sovereign debt in the US and Europe, coupled with the rising costs of energy, fuel and food, plus the recent instability in some areas of Africa and the Middle East should be very favourable for silver as it continues to be a strategic investment for those looking to preserve their wealth. In this scenario, silver and quality silver equities should enjoy another great year.
As a primary silver producer, Pan American derives most of its revenues from silver, which contributed
65% to the Company’s total sales in 2010. At current metal prices, silver will represent approximately
66% of the Company’s total revenues in 2011, while gold is expected to be the second-largest source
of revenue accounting for approximately 15% of total sales.
40
35
30
25
20
15
10
5
0
JAN–0
6
MAR–0
6
MAY
–06
JUL–
06
SEP–06
NOW–0
6
JAN–0
7
MAR–0
7
MAY
–06
JUL–
06
SEP–06
NOV–06
JAN–0
8
MAR–0
8
MAY
–08
JUL–
08
SEP–08
NOV–08
JAN–0
9
MAR–0
9
MAY
–09
JUL–
09
SEP–09
NOV–09
JAN–1
0
MAR–1
0
MAY
–10
JUL–
10
SEP–10
NOV–10
JAN–1
1
MAR–1
1
SILVER PRICE (US$/OZ AG)
PAN AMERICAN SILVER CORP. | ANNUAL REPORT 20108

Through on-going research and the
advent of nanotechnologies, the
use of silver in new environmentally
friendlier technologies is growing
fast. Did you know silver is used in
the following applications?
MEDICINAL: silver’s antimicrobial
and bactericidal properties are put
to use in bandages and dressings
to prevent infections. With the onset
of super-bugs (antibiotic-resistant
bacteria), silver-based cleaning
agents are also used to sanitize
medical facilities and silver oxide is
also being used to treat a number of
bacterial and viral diseases.
WATER PURIFICATION: silver-
based water purifiers prevent the
buildup of bacteria and algae in
filters. Combined with oxygen, silver
is a powerful sanitizer which can
eliminate the need for chlorine in
swimming pools.
SOLAR ENERGY: environmental
concerns are driving people to look
for sources of renewable energy.
Thanks to its superior conductive
properties, silver is used in 90% of all
crystalline silicon photovoltaic cells,
the most common type of solar cell.
RECHARGEABLE BATTERIES:rechargeable lithium-ion batteries
are being replaced by silver-oxide
batteries that are safer, because
silver-zinc batteries do not contain
lithium or flammable liquids.
Also, silver micro-batteries offer
significantly more energy than
conventional batteries and are up to
95% recyclable.
THINK GREEN; THINK SILVER!
9THE SILVER MARKET

EXPLORATION
Why is it important to differentiate between Mineral Reserves and Resources? It is very important to differentiate between Mineral Resources and Mineral Reserves. Every exploration project will define first Mineral Resources, which are categorized into Inferred, Indicated and Measured Resources with increasing geological information and confidence. Mineral Resources have not proven their feasible economic extraction yet. A Mineral Reserve is the economically mineable part of a Measured or Indicated Mineral Resource demonstrated by at least a Preliminary Feasibility Study. This Study must include adequate information on mining, processing, metallurgical, economic and other relevant factors that demonstrate, at the time of reporting, that economic extraction can be justified. A Mineral Reserve includes diluting materials and allowances for losses that may occur when the material is mined. Mineral Reserves is what we extract, what generates cash flow and earnings for the company and are the base for our business.
What is the difference between brown field and green field exploration? Brown field exploration takes place in and around our producing mines on the land package surrounding the operation. It is the exploration which replaces our Reserves
mined during the year and adds Resources for future production or plant expansions. Green field exploration happens on new projects in zones where we currently don’t have an operation or any Resources. It explores for new ore bodies and if successful will ultimately prompt the construction of a new operation.
How many people are involved in Pan American’s exploration programs? We are currently employing about 70 geologists, 54 at our mine-site geology departments, or brown field exploration programs, and 16 in our green field exploration programs. In addition, we employ about 255 individuals in support functions like sampling, field assistance, diamond drilling, resource modeling, etc.
Can you summarize Pan American’s 2010 exploration results and this year’s programs?2010 was yet another successful brown field exploration year for us. We drilled over 110,000 meters at our operations and discovered 27.0 million ounces of new Proven and Probable silver Reserves, which was almost sufficient to fully replace the 28.3 million contained ounces we mined during a record production year. As of January 1st
2011, the Company had a Proven and Probable Reserves of
Michael Steinmann, Executive Vice-President Geology and Exploration speaks about Pan American’s
recent exploration success and the Company’s green field and brown field exploration programs
going forward.
Michael Steinmann Executive Vice-President Geology & Exploration
“Green field
exploration is
a way to add
value for our
shareholders”
PAN AMERICAN SILVER CORP. | ANNUAL REPORT 201010

230.8 million ounces of silver and 698,000 ounces of gold. The small Reserve decrease of 1.4% compared to last year was mainly caused by a reclassification from Reserves to Resources of about 1.9 million ounces of silver from the Pyrite Stock Piles in Peru due to the shutdown of the La Oroya smelter.
How much does Pan American spend in its exploration programs and how does this compare to other companies in the silver sector?While our Reserves are sufficient to sustain our current production levels for the next 10 years, our goal every year is obviously to keep replacing what we mine. In order to achieve this in 2011, we will spend approximately $11 million on brown field exploration, including a 108,000 meter drill program at our seven operations. Green field exploration is another way to add value for our shareholders. In 2010, we spent about $5 million on a few green field projects and in 2011 we will more than double that to about $12 million. The new properties we plan to explore are in Mexico, Peru and Argentina.
Since 2004, when it produced 11.2 million ounces of silver, Pan American has more than doubled its silver production. In fact last year the Company produced 24.3 million ounces of silver. How much of this production growth was due to exploration success? In 2004 we produced over 11 million ounces of silver and had reserves of 147.5 million ounces, supporting 10 years of production at 2004 levels. In 2010 we produced over 24 million ounces of silver and we have 230 million ounces
silver Reserves, supporting 10 years of production at current levels. Over the last 7 years we have been very successful with our brown field exploration programs. We have added a total of 169 million ounces of new silver Reserves since 2004, 21% more than what we mined in the same period. We spent a total of $46.3 million during that period for brown field exploration, which means that we added new reserves at a cost of about $27 cents per ounce, while delivering new production records year after year.
The company has seven producing mines. Which ones have the most exploration potential and how will this potential translate into their future? Our assets are covering a wide variety of types of mineralization. Epithermal low sulphidation vein deposits, skarns, mantos and limestone replacements. Most of them have proved their large exploration potential by replacing mined reserves year after year. Vein deposits like La Colorada, Manantial Espejo, Huaron, Morococha or San Vicente have characteristically long mine lifes and very large exploration potential. I believe our best exploration potential is at La Colorada, Huaron, Morococha and Manantial Espejo.
Finding new deposits to maintain or grow production is vital for the long-term success of any mining company. How competitive is the silver space? Exploration success is the base of our business and the base of any mining and exploration company, hence it is extremely competitive. It is very difficult to find good primary silver deposits as they are extremely rare. Many silver deposits in the world battle with narrow veins, deep
11EXPLORATION 11
NAVIDAD | ARGENTINA

locations, difficult metallurgy and high costs. That’s what makes Navidad such a valuable and important deposit as it has high grade ore that is amenable to low strip ratio surface mining.
Navidad is a big bet for Pan American Silver. Why is it so important and how would you describe it from a geologists’ perspective?It is very difficult to find silver deposits and large deposits are extremely rare. As a matter of fact there are only a
SILVER (MILLIONS OF OUNCES OF CONTAINED SILVER)
RESERVES Dec 31, 2009 MINED 2010 GAINED/LOST RESERVES Dec 31, 20103
Morococha (92.2%) 37.98 (3.03) 2.68 37.62
Huaron 64.23 (3.86) (1.08) 59.29
Quiruvilca 3.93 (1.47) 1.48 3.94
La Colorada 30.43 (4.21) 12.11 38.34
Alamo Dorado 30.89 (7.90) 4.17 27.17
San Vicente (95%) 28.39 (3.39) 3.05 28.04
Manantial Espejo 36.13 (4.41) 4.60 36.32
Silver Stockpiles 2 1.94 - - -
TOTAL4 233.92 (28.27) 27.01 230.72
1 For the complete breakdown of reserves and resources by property and category, please refer to pages 54 and 55 of this annual report
2 Pan American believes that Doe Run’s La Oroya smelter, the only buyer of the Pyrite Stockpiles, is unlikely to resume operations in the near future. As a result, management decided to write off the book value of that asset at
December 31, 2010 and has reclassified the 1.94 million ounces of Silver contained in the Pyrite Stockpiles from Reserves to Resources
3 Proven and Probable Mineral Reserves were estimated using appropriate cut-off grades based on assumed metal prices of Ag: $18.00/oz, Au: $1,100/oz,Pb: $1,950/tonne, Cu: $6,500/tonne, Zn: $1,950/tonne
4 Totals may not add up due to rounding
handful of deposits known with over 700 million ounces of total silver Resources and most of them are already in, or will soon be in production, creating substantial shareholder value. To my knowledge, Navidad is currently the world’s largest undeveloped silver deposit in the world. It will help to create a far larger and more profitable Pan American Silver with a very big, long-life and low-cost asset. I am also excited about our very large land holdings around Navidad, which have an incredible exploration potential to add new Resources and Reserves in the future.
PAN AMERICAN SILVER CORP. | ANNUAL REPORT 201012
NAVIDAD | DRILL CORE SAMPLE

PROJECT DEVELOPMENT:
NAVIDAD
What is the history of Navidad?In Late 2002, Daniel Bussandri, a geologist working for IMA Exploration Inc., discovered untouched outcropping mineralization on a hill located in the North-central plateau of the Chubut Province while he was following-up on sample data collected the year before by Normandy Geologists. Soon he found surface exposed mineralization over what later became known as the Navidad Hill, Connector Zone, Galena Hill and Barite Hill deposits. IMA geologists conducted additional geologic mapping and surface sampling of the area until the first discovery drill hole was completed in late 2003 on Navidad Hill; a 58.4 meter intercept of ore with an average silver grade of 111 grams per tonne. Aquiline Resources Inc. successfully challenged IMA’s use of Normandy’s data in a British Columbia courtroom arguing that IMA had breached a confidentiality agreement signed as part of a Newmont sale for another project in Argentina (Newmont acquired Normandy and then withdrew work in the area). Except for the legal disruption in which Navidad was handed over to Aquiline Resources Inc. in July 2006, geologic efforts and intensive drilling continued for 6 years resulting in the current mineral Resource, which is arguably the single largest undeveloped silver Resource in the world. We
gained control over Navidad when we acquired Aquiline in January 2010.
What are Pan American’s plans for Navidad?We are committed to developing Navidad into a profitable silver mine. It has the potential to essentially double our production and profits, but it also possesses the ability to provide significant economic stimulus for the local communities in an isolated rural region that has been facing steady population declines. In 2010, we produced a Preliminary Assessment which illustrated that Navidad is unquestionably technically and economically robust enough to justify immediate development; however, there is a Provincial law in Chubut banning the use of open pit mining, which must be reformed before development can proceed. We are focused on sharing the concepts of the Project with the local and provincial residents describing the potential benefits and predicted impacts Navidad would have on the region anticipating this will persuade a reform to the current Provincial ban on open pit mining. Meanwhile we are taking full advantage of the time to optimize and enhance the project design, incorporating comments, concerns, and suggestions from the Chubut residents. The province of Chubut is fortunate to have abundant natural resources and by partnering with a responsible mine developer
Steve Busby Chief Operating Officer
Steve Busby, Chief Operating Officer, discusses the Navidad deposit, arguably the largest
undeveloped primary silver deposit in the world, and how Pan American is advancing this project
into the development stage.
“Navidad has
the potential to
essentially double
our production
and profits.”
13PROJECT DEVELOPMENT: NAVIDAD

like Pan American, it has an opportunity to improve the infrastructure, provide adequate employment opportunities, create successful businesses, and make vast improvements in basic services such as access to health care, schools, water distribution, and improved transportation networks.
Why is there a ban in Chubut on Open Pit Mining?The open pit mining ban is the result of a legislative act passed in April of 2003, aimed at stopping an open pit cyanide leach gold mine development near the picturesque town of Esquel, located 200 kilometers west of Navidad in the foothills of the Andes. The legislation was a response to severe public opposition against a gold mine project near Esquel because there was insufficient public participation in the design of the project. The initial legislation included a provision to allow zoning of the Province into areas where open pit mine developments could proceed, which has yet to be acted on. It is important to note that the Navidad Project does not require the use of cyanide for development. We believe there is significant public support growing for Navidad which will sway the legislators of Chubut to reform the open pit mining ban during 2011, specifically in the area of the Central Plateau, where Navidad is situated.
This is a significant project, larger than anything your Company has ever undertaken. Is Pan American capable of building Navidad?Yes, we are a silver mining and development company currently operating seven different mines that we had developed in four different Latin American countries. We also have two development stage projects, one in Mexico (La Preciosa) and one in Argentina (Navidad). By far the most important of these projects is Navidad. We employ over 7,000 people directly at our mines and development projects. In Argentina we employ over 800 people in Argentina, 99% of them are Argentinean, 650 in Santa Cruz, 150 in Chubut and several others elsewhere in the country, including our regional headquarters in Buenos Aires. Our reputation for excellence, both in our technical ability to develop environmentally sensitive operations, and also for our commitment to integrate with the local communities where we operate, is well known and we have been recognized with numerous awards for employee safety and sustainable development programs. We have been in Argentina since 2002 with the successful development of the Manantial Espejo mine in Santa Cruz, which has had a tremendous positive impact in the nearby community of Gobernador Gregores. Finally, we have and continue generating significant financial resources and means to secure the Project financing.
Can you briefly describe the Navidad Project and its impact?Navidad is located just south of Route 4, some 40kms west of the community of Gan Gan and 40kms east of the community of Gastre in the central plateau of Chubut. So far we have invested close to US$35 million in Navidad to better understand the deposit, to study the best and most environmentally sensitive methods to safely mine and produce silver and to complete a Preliminary Assessment describing the Project. The Assessment estimates that a total of 431 million tonnes of material could be surface mined from eight deposits to generate 89.4 million tonnes of ore, which could be treated in a 15,000 tonne per day floatation concentrator for a period of 17 years. The project would produce two concentrates: a silver-rich copper concentrate and a lead concentrate containing silver values. Production is expected to average 19.8 million ounces of silver annually at a cash cost of just over $6 per ounce during the first 5 years and 17 million ounces of silver at a cash cost of nearly $7 per ounce over the life of the mine, with estimated total silver recovered being 275.5 million ounces. We estimate that construction and commissioning activities would demand approximately 1,500 individuals between employees and contractors, which would represent approximately $167 million in direct wages. Navidad’s total capital estimate of $760 million includes approximately $450 million in local wages and benefit payments as well as locally-supplied goods and services. Once in commercial production, Navidad is expected to provide direct employment to approximately 500 employees and contractors. Mindful of the environment, it is our intention to obtain most of the water required to run the processing plant by recycling water from the tailings facility, adding a limited amount of fresh water from surface mine dewatering systems and to a lesser degree from nearby ground water wells. Technical field work carried out to date indicates that there is more than sufficient ground water at or near the Project to provide water for the life of the operation without impacting the needs of local communities and ranches. Energy for the Project could be supplied from a twin 330 KV power line that runs approximately 100 kilometers south.
Are there any unique aspects to the Navidad Project?Navidad has a very large Resource of over 630 million ounces of silver and nearly 3 billion pounds of lead in the Measured and Indicated category and over 100 million more ounces of silver and nearly 600 million pounds of lead in the Inferred category, making it the world’s largest undeveloped primary silver Resource. The mineralization outcrops to the surface and has attractive grades, ideal for surface
PAN AMERICAN SILVER CORP. | ANNUAL REPORT 201014

mining and conventional floatation processing. We have a large 10,000 hectare land position immediately surrounding the existing known deposits and feel there are significant opportunities to grow the Resources by continuing exploration in remaining untested prospective terrain. There are significant opportunities to improve silver recoveries above the levels described in our Preliminary Assessment, as there is a significant amount of silver trapped in pyrites that are not amenable to conventional floatation and off-shore concentrate sales. We are learning more about the deposits and the mineralization and we are discovering new opportunities for reducing operating costs and enhancing profitability with our increasing knowledge. Navidad is truly a rare and uniquely rich primary silver Project.
What are your specific plans for 2011 at Navidad?First and foremost we are focused on working to disseminate descriptions of the Project to the residents of Chubut and invite them to join us in optimizing the designs to accommodate their needs and concerns. This includes conducting numerous site visits with local residents and initiating a comprehensive communications campaign. Simultaneously we will continue efforts to prepare the Project’s Environmental Impact Assessment, and assemble a feasibility study. We are also advancing additional definition drilling and have initiated basic engineering so we could move rapidly into development once the law reforms are passed and the permits are received. Overall we are expecting to spend nearly $45 million in 2011 inclusive of the efforts of 150 local individuals assigned to Navidad. We anticipate significant improvements to the Project from the optimization studies currently underway, particularly in respect to reducing operating costs and improving metal recoveries.
15PROJECT DEVELOPMENT: NAVIDAD

SOCIAL RESPONSIBILITY
Through sustainability we try to create value for all of our stakeholders, because it is clear that our responsibility towards our host communities extends beyond the life of our operations. Our mission is to conduct our activities in an environmentally responsible manner and to help develop sustainable economic activities in the areas around operations that we influence.
Geoff Burns, President & CEO, believes, “Fundamental responsibility to and accountability for the environment are core values. We have a history of investing in new sustainable technologies to help mitigate the environmental impact of our activities. In addition, Pan American takes great pride in the productive, proactive and open relationships that have forged with the communities in the areas where we operate.”
Pan American Silver recognizes that the skills and the dedication of our employees and contractors are the most important drivers of our success. We also recognize the vital contribution they make to the economic prosperity of the communities in which we operate. As such, we offer career development opportunities through specialized training,
competitive remuneration, an engaging working environment and a supportive culture where fairness, respect, safety, and diversity are valued and practiced.
Our number one priority at all of our mines, development projects and exploration prospects is the safety of our employees. Our approach is to implement the highest safety standards possible and to undertake comprehensive and continuous safety training. We also comply with, and in most cases surpass, all applicable safety regulations and industry standards in the countries were we operate. This has allowed us to dramatically improve our safety record over the past five years.
We are committed to operating our mines and developing our new projects in an environmentally responsible manner. We take every measure practical to minimize and mitigate environmental impacts during all phases of the mining cycle, from exploration through project development, into full mining operations and ultimately to mine closure and reclamation. This is accomplished through careful engineering and design, prudent operating practices, continuous monitoring and by providing ongoing training
At Pan American Silver, we believe that sustainability is not a secondary activity but a principle that
drives us towards the ongoing improvement of our business. Sustainability is achieved by treating our
employees as we would like to be treated, by treating the environment with the respect it deserves, and
by acting as good neighbour and active member in the communities where we operate.
PAN AMERICAN SILVER CORP. | ANNUAL REPORT 201016

17SOCIAL RESPONSIBILITY
QUIRUVILCA | PERU

MEXICO:LA COLORADA MINE – 2009 “Casco
de Plata” Safety Award (Silver
Hard Hat) by the Mexican Chamber
of Mines for safest underground
operation with more than 501 workers
ALAMO DORADO MINE – 2009
“Casco de Plata” Safety Award
(Silver Hard Hat) by the Mexican
Chamber of Mines for safest open pit
operation with less than 500 workers
LA COLORADA MINE – Attained the
Clean Industry Certification
ALAMO DORADO MINE –
Successfully renewed its Socially
Responsible Business certification
PERU:The National Chamber of Mining,
Petroleoum and Energy awarded PAN
AMERICAN SILVER PERU the 2010
Sustainable Development Award for
the campaign for the improvement
of the nutritional health of the
population around the Morococha
mine
BOLIVIA:The National Chamber of Industry
awarded the SAN VICENTE MINE
the 3rd place in the category Best
CSR Community Driven Project,
for its community-driven business
development programs
PAN AMERICAN SILVER2010 AWARDS AND
RECOGNITIONS
and education for the employees and contractors who work at our facilities and our projects.
OUR PROGRAMS: 1. We recognize that water is a finite resource, essential to sustain life and a healthy environment. We are committed to ensuring that sources of water are not negatively impacted by our operations by making sure that water is used in the most efficient way possible and recycled as much as possible, that natural water courses are maintained as much as possible, and that the quality of the water that we return to the environment is consistently better than regulatory requirements.
2. We are well aware of the challenges and risks associated with climate change and are committed to reducing our Greenhouse Gas (GHG) emissions through improvements in energy efficiency and the use of renewable energy.
3. We have intensified our efforts to reduce the amount of wastes generated by our operations by continually upgrading our waste management and disposal programs. We investigate and then apply alternative procedures and technologies to reduce waste and work with local companies to increase the amount of waste that is reclaimed and reused.
4. Our community outreach programs are consistent with a “good neighbour attitude.” Our programs are born out of local contact and the information obtained by our local offices. We typically focus on education, health, infrastructure improvements and the promotion of alternative economic activities. We maintain offices with knowledgeable staff in each of our host communities to make it easy for residents to ask questions, find out more about our operations and provide feedback and suggestions. A strong local presence also ensures that we are better able to understand community issues and priorities.
The practices employed by Pan American Silver have demonstrated that care for our employees, our environment and our communities not only makes good business sense but also provides long lasting benefits to the land and its people.
Ross Beaty, Chairman of the Board, adds, “The term “sustainable mining” might seem an oxymoron to some: how can extraction of non-renewable resources ever be sustainable? But Pan American Silver Corp. is proving this can be achieved, through its dedication to community engagement, health, safety and environmental excellence, and fair-minded, transparent and collaborative management practices.”
PAN AMERICAN SILVER CORP. | ANNUAL REPORT 201018

19SOCIAL RESPONSIBILITY
MANANTIAL ESPEJO | ARGENTINA

TECHNICAL INFORMATION
MICHAEL STEINMANN, P.GEO., EXECUTIVE VP GEOLOGY & EXPLORATION, AND MARTIN WAFFORN, P.ENG., VP TECHNICAL SERIVCES, EACH OF WHOM ARE QUALIFIED PERSONS, AS THE
TERM IS DEFINED IN NATIONAL INSTRUMENT 43-101 “NI 43-101”, HAVE REVIEWED AND APPROVED THE CONTENTS OF THIS ANNUAL REPORT. TECHNICAL INFORAMATION WITH RESPECT
TO NAVIDAD IS DERIVED FROM THE NI 43-101 TECHNICAL REPORT ON THE PROPERTY PREPARED BY SNOWDEN, UNDER THE SUPERVISION OF PAMELA DE MARK, P.GEO., SR. CONSULTANT
OF SNOWDEN MINING INDUSTRY CONSULTANTS. MINERAL RESOURCE ESTIMATES FOR HOG HEAVEN AND WATERLOO ARE BASED ON HISTORICAL THIRD PARTY ESTIMATES. TECHNICAL
INFORMATION FOR THE LA PRECIOSA PROPERTY IS BASED ON PUBLICLY AVAILABLE INFORMATION PUBLISHED BY ORKO SILVER.
CAUTIONARY NOTE TO US INVESTORS CONCERNING ESTIMATES OF RESERVES AND RESOURCES
THIS ANNUAL REPORT HAS BEEN PREPARED IN ACCORDANCE WITH THE REQUIREMENTS OF CANADIAN PROVINCIAL SECURITIES LAWS, WHICH DIFFER FROM THE REQUIREMENTS OF U.S.
SECURITIES LAWS. UNLESS OTHERWISE INDICATED, ALL MINERAL RESERVE AND RESOURCE ESTIMATES INCLUDED IN THIS ANNUAL REPORT HAVE BEEN PREPARED IN ACCORDANCE
WITH CANADIAN NATIONAL INSTRUMENT 43-101 – STANDARDS OF DISCLOSURE FOR MINERAL PROJECTS (‘‘NI 43-101’’) AND THE CANADIAN INSTITUTE OF MINING, METALLURGY AND
PETROLEUM CLASSIFICATION SYSTEM. NI 43-101 IS A RULE DEVELOPED BY THE CANADIAN SECURITIES ADMINISTRATORS THAT ESTABLISHES STANDARDS FOR ALL PUBLIC DISCLOSURE
AN ISSUER MAKES OF SCIENTIFIC AND TECHNICAL INFORMATION CONCERNING MINERAL PROJECTS.
CANADIAN STANDARDS, INCLUDING NI 43-101, DIFFER SIGNIFICANTLY FROM THE REQUIREMENTS OF THE UNITED STATES SECURITIES AND EXCHANGE COMMISSION (THE “SEC”),
AND INFORMATION CONCERNING MINERALIZATION, DEPOSITS, MINERAL RESERVE AND RESOURCE INFORMATION CONTAINED OR REFERRED TO HEREIN MAY NOT BE COMPARABLE
TO SIMILAR INFORMATION DISCLOSED BY U.S. COMPANIES. IN PARTICULAR, AND WITHOUT LIMITING THE GENERALITY OF THE FOREGOING, THIS ANNUAL REPORT USES THE TERMS
‘‘MEASURED RESOURCES’’, ‘‘INDICATED RESOURCES’’ AND ‘‘INFERRED RESOURCES’’. U.S. INVESTORS ARE ADVISED THAT, WHILE SUCH TERMS ARE RECOGNIZED AND REQUIRED BY
CANADIAN SECURITIES LAWS, THE SEC DOES NOT RECOGNIZE THEM. UNDER U.S. STANDARDS, MINERALIZATION MAY NOT BE CLASSIFIED AS A ‘‘RESERVE’’ UNLESS THE DETERMINATION
HAS BEEN MADE THAT THE MINERALIZATION COULD BE ECONOMICALLY AND LEGALLY PRODUCED OR EXTRACTED AT THE TIME THE RESERVE DETERMINATION IS MADE. U.S. INVESTORS
ARE CAUTIONED NOT TO ASSUME THAT ANY PART OF A “MEASURED RESOURCE” OR “INDICATED RESOURCE” WILL EVER BE CONVERTED INTO A “RESERVE”. U.S. INVESTORS SHOULD
ALSO UNDERSTAND THAT “INFERRED RESOURCES” HAVE A GREAT AMOUNT OF UNCERTAINTY AS TO THEIR EXISTENCE AND GREAT UNCERTAINTY AS TO THEIR ECONOMIC AND LEGAL
FEASIBILITY. IT CANNOT BE ASSUMED THAT ALL OR ANY PART OF “INFERRED RESOURCES” EXIST, ARE ECONOMICALLY OR LEGALLY MINEABLE OR WILL EVER BE UPGRADED TO A HIGHER
CATEGORY. UNDER CANADIAN SECURITIES LAWS, ESTIMATED “INFERRED RESOURCES” MAY NOT FORM THE BASIS OF FEASIBILITY OR PRE-FEASIBILITY STUDIES EXCEPT IN RARE CASES.
DISCLOSURE OF “CONTAINED OUNCES” IN A MINERAL RESOURCE IS PERMITTED DISCLOSURE UNDER CANADIAN SECURITIES LAWS. HOWEVER, THE SEC NORMALLY ONLY PERMITS
ISSUERS TO REPORT MINERALIZATION THAT DOES NOT CONSTITUTE “RESERVES” BY SEC STANDARDS AS IN PLACE TONNAGE AND GRADE, WITHOUT REFERENCE TO UNIT MEASURES.
THE REQUIREMENTS OF NI 43-101 FOR IDENTIFICATION OF “RESERVES” ARE ALSO NOT THE SAME AS THOSE OF THE SEC, AND RESERVES REPORTED BY THE COMPANY IN COMPLIANCE
WITH NI 43-101 MAY NOT QUALIFY AS “RESERVES” UNDER SEC STANDARDS. ACCORDINGLY, INFORMATION CONCERNING MINERAL DEPOSITS SET FORTH HEREIN MAY NOT BE
COMPARABLE WITH INFORMATION MADE PUBLIC BY COMPANIES THAT REPORT IN ACCORDANCE WITH U.S. STANDARDS.
20 PAN AMERICAN SILVER CORP. | ANNUAL REPORT 2010
SANTA CRUZ | ARGENTINA

21
operating mines
propertY tYpe LoCationproVen & proBaBLe reserVes1 2010 proDUCtion2 2011 proDUCtion ForeCast3
Huaron Underground Pasco, Peru 59.29 Moz Ag 2.6 Moz Ag at cash cost of $12.35/oz
3.1 to 3.2 Moz Ag at cash cost of $11.10 to $13.00 per oz Ag
Morococha (92.2%) Underground Junin, Peru 37.62 Moz Ag
2.6Moz Ag at cash cost of $4.43
2.6 to 2.7 Moz Ag at cash costs of $4.80 to $6.60 per oz Ag
Quiruvilca Underground La Libertad, Peru3.94 Moz Ag; 18 Koz Au
1.2 Moz Ag at cash cost of $5.87/oz
1.0 to 1.1 Moz Ag at cash cost of $8.80 to $9.90 per oz Ag
Alamo Dorado Open Pit Sonora, Mexico 27.17Moz Ag; 100.52 Koz Au
6.7 Moz Ag at cash cost of $3.16/oz
4.8 to 5.1 Moz Ag at cash cost of $5.30 to $5.70 per oz Ag
La Colorada Underground Zacatecas, Mexico38.34 Moz Ag; 44.48 Koz Au
3.7 Moz Ag at cash cost of $8.59/oz
4.1 to 4.2 Moz Ag at cash cost of $7.60 to $8.50 per oz Ag
San Vicente (95%) Underground Potosi, Bolivia 28.04 Moz Ag
3.0 Moz Ag at cash cost of $8.21/oz
3.2 to 3.3 Moz Ag at cash cost of $7.60 to $8.60 per oz Ag
Manantial Espejo
Combination Open Pit & Underground Santa Cruz, Argentina
36.32 Moz Ag; 534.11 Koz Au
4.0 Moz Ag at cash cost of $1.61/oz
4.2 to 4.5 Moz Ag at cash cost of $4.80 to $5.60 per oz Ag
1 At December 31, 2010 2 Cash costs per payable ounce of silver produced net of by-product credits 3 Cash costs per ounce of Ag, net of by-product credits. Price assumptions: Au $1,320/oz, Zn $2,050/tonne, Pb $2,050/tonne, Cu $7,000/tonne
DeVeLopment projeCts
resoUrCes
propertY oWnersHip LoCation measUreD & inDiCateD inFerreD 2011 oBjeCtiVes
Navidad 100% Chubut, Argentina632.36 Moz Ag; 2,914 M pounds Pb
119 Moz Ag; 580 M pounds Pb
Invest $44.7 million for continued diamond drilling and to complete an Environmental Impact Assessment and ultimately a full Feasibility Report in Q4 2011
La Preciosa
55% Joint Venture Interest Durango, Mexico 63 Moz Ag; 92 Koz Au
72 Moz Ag; 97 Koz Ag
Invest $1 million to complete a Preliminary Assessment by mid-year 2011
Pico Machay 100% Huancavelica, Peru 265 Koz Au 446 Koz AuLimited in-fill drilling, resource model development and advance scoping study
Calcatreu 100% Rio Negro, Argentina 6.6 Moz Ag; 676 Koz Au1.8 Moz Ag; 226 Koz Au Monitor Provincial legislation evolution
properties at a gLanCe

2222
taBLe oF Contents
Management’s Discussion and Analysis 22
Introduction 23
Core Business and Strategy 24
Highlights of 2010 25
2011 Project Development Objectives 25
2011 Operating Outlook 26
2010 Operating Performance 29
Overview of 2010 Financial Results 38
Liquidity Position 40
Investments and Investment Income 41
Capital Resources 41
Financial Instruments 41
Asset Retirement Obligations 42
Contractual Commitments and Contingencies 42
general and Administrative 43
Exploration and Project Development 43
Non-gAAP Measures 44
governance and Corporate Social Responsibility 45
Risks and Uncertainties 46
Critical Accounting Policies and Estimates 49
Future Accounting Changes 50
Subsequent Events 52
Disclosure Controls and Procedures 52
Mineral Reserves and Resources 54
Management’s Responsibility for Financial Reporting 58
Auditors’ Reports 59
Consolidated Balance Sheets 61
Consolidated Statements Of Operations 62
Consolidated Statements Of Shareholders’ Equity 63
Consolidated Statements Of Cash Flows 64
Notes to Consolidated Financial Statements 65

MANAgEMENt'S DISCUSSION AND ANALYSIS 23
introDUCtionManagement’s discussion and analysis (“MD&A”) is intended to help the reader understand the signifi cant factors that have affected Pan American Silver Corp.’s and its subsidiaries’ (“Pan American” or the “Company”) performance and such factors that may affect its future performance. the MD&A should be read in conjunction with the Company’s Audited Consolidated Financial Statements for the year ended December 31, 2010 and the related notes contained therein. All amounts in this MD&A and in the consolidated fi nancial statements are expressed in United States dollars (“USD”), unless identifi ed otherwise. the Company reports its fi nancial position, results of operations and cash fl ows in accordance with Canadian generally accepted accounting principles (“Canadian gAAP”). Pan American’s signifi cant accounting policies are set out in Note 2 of the Audited Consolidated Financial Statements. Differences between Canadian and United States generally accepted accounting principles (“US gAAP”) that would have affected the Company’s reported fi nancial results are set out in Note 21 of the Audited Consolidated Financial Statements. this MD&A refers to various non-gAAP measures, such as “cash and total cost per ounce of silver”, which are used by the Company to manage and evaluate operating performance at each of the Company’s mines and are widely reported in the silver mining industry as benchmarks for performance, but do not have standardized meaning. to facilitate a better understanding of these measures as calculated by the Company, we have provided detailed descriptions and reconciliations where applicable.
Except for historical information contained in this MD&A, the following disclosures are forward-looking statements within the meaning of the Private Securities Litigation Reform Act of 1995 or are future oriented fi nancial information and as such are based on an assumed set of economic conditions and courses of action. Please refer to the cautionary note regarding the risks associated with forward looking statements at the back of this MD&A and the “Risks Related to Pan American’s Business” contained in the Company’s most recent Form 40-F and Annual Information Form on fi le with the US Securities and Exchange Commission and the Canadian provincial securities regulatory authorities. Additional information about Pan American and its business activities, including its Annual Information Form, is available on SEDAR at www.sedar.com
the scientifi c or technical information in this MD&A, which includes reserve estimates for the Huaron, Morococha, Quiruvilca, Alamo Dorado, La Colorada, Manantial Espejo, and San Vicente properties were based upon information prepared by or under the supervision of Michael Steinmann, P.geo., Executive Vice President geology & Exploration and Martin g. Wafforn, P.Eng., Vice President technical Services, who are “Qualifi ed Persons” for purposes of National Instrument 43-101. Navidad Resource estimates were prepared by Pamela De Mark, P. geo. Mineral Resource estimates for Hog Heaven and Waterloo are based on historical third party estimates.
the Company’s 2011 forecast and the resultant forecast numbers contained in this MD&A include estimates of future production rates for silver and other metals and future cash and total costs of production at each of the Company’s properties, which are forward-looking estimates. these forecasts are based on the following key assumptions: (i) silver: $20.65 per ounce, gold: $1,320 per ounce, zinc: $2,050 per tonne ($0.93 per lb), lead: $2,050 per tonne ($0.93 per lb), and copper: $7,000 per tonne ($3.18 per lb); (ii) that we are able to ship and sell all of our 2011 production in the 2011 fi nancial year; (iii) the Company’s forecast production for each individual mine is achieved; (iv) there is no disruption in production, increase in costs or disruption due to, among other things: natural phenomena and hazards; technological, mechanical or operational disruptions; changes in local governments, legislation, taxation or the political or economic environment; fl uctuations in the price of silver, gold or base metals; fl uctuations in the local currencies of those countries in which the Company carries on business; unexpected work stoppages or labour disputes; fl uctuations in the price for electricity, natural gas, fuel oil, and other key supplies; or transportation disruptions.
No assurance can be given that the indicated quantities of silver and other metals will be produced, or that projected cash costs or forecast capital costs will be achieved. Expected future production, cash costs and capital costs are inherently uncertain and could materially change over time. If actual results differ from the assumptions set out above, the Company’s mineral production and cash costs may differ materially from the forecasts in this MD&A. Readers should review those matters discussed herein under the heading “Risks and Uncertainties” and are advised to read the “Cautionary Note Regarding Forward Looking statements” contained herein.
march 22, 2011

PAN AMERICAN SILVER CORP. | ANNUAL REPORt 201024
Core BUsiness anD strategYPan American engages in silver mining and related activities, including exploration, mine development, extraction, processing, refining and reclamation. the Company owns and operates silver mines located in Peru, Mexico, Argentina, and Bolivia. In addition, the Company is exploring for new silver deposits throughout South America and Mexico. the Company is listed on the toronto Stock Exchange (Symbol: PAA) and on the NASDAQ Exchange in New York (Symbol: PAAS).
Pan American was founded in 1994 with the specific intention of providing investors with the best investment opportunity to gain real exposure to silver prices. the Company's mission is to be the largest and lowest cost primary silver mining company globally. to realize this mission, Pan American’s strategy is to focus on growing its base of low cost silver production and silver reserves by constantly optimizing its production methods, and developing new silver deposits through acquisition and exploration.
to execute this strategy, Pan American has assembled a sector leading team of mining professionals with a depth of exploration, construction, operating, and financing knowledge that allows the Company to confidently advance early stage projects through construction and into operation.
Pan American is determined to conduct its business in a responsible and sustainable manner.
Being responsible for the environment in which we operate, contributing to the long-term development of our host communities and ensuring that our employees can work in a safe and secure manner are core values at Pan American. We are committed to maintaining positive relations with our employees, the local communities and the government agencies, all of whom we view as partners in our enterprise.
Pan American Silver’s priority at every operation is the safety of our employees. We believe that comprehensive and continuous training is fundamental to the safety of our employees. With our comprehensive safety training and strictly enforced safety procedures, our goal is to continually improve our safety performance and remain industry leaders in the health and safety of our workers.
In addition, the Company is committed to operating our mines and developing new projects in an environmentally responsible manner. We have developed a comprehensive environmental policy, which all operations adhere to and apply to their short and long-term plans. this policy addresses topics that include water use and recycling, waste disposition, the research and use of alternative energies, compliance with required laws, closure requirements and education initiatives. Each operation runs unique environmental programs according to its location, needs, resources and processes. We have a proactive approach to minimizing and mitigating environmental impacts during all phases of the mining cycle from exploration through project development and into full mining operations. this is accomplished by applying prudent design and operating practices, continuous monitoring and by providing training and education for the employees and contractors who work at our facilities.
the Company recognizes that the skills and dedication of our employees and contractors are important drivers of our success. We also recognize the vital contribution they make to the economic prosperity of the communities in which we operate. As such, we offer leading career development opportunities, competitive remuneration, an engaging working environment and a supportive culture where fairness, respect, safety and diversity are valued and practiced.
Pan American’s operational track record and strong financial standing has positioned the Company to take full advantage of strategic opportunities in the silver market, when and if they arise. Pan American’s silver production has grown for 15 consecutive years. At the end of 2010, Pan American had seven operating mines and also owned the world class Navidad silver development project in Argentina, and is the operator of the La Preciosa project in Mexico - a considerable portfolio of quality silver assets providing diversification of political and operational risk. Pan American also produces significant quantities of gold and base metals as by-products to its silver mining activities. the following charts reflect the geographic diversity of our silver production and the breakdown of our revenue, by metal type, for 2010:
Mexico 44%Peru 28%Argentina 16%Bolivia 12%
44%16%
12%
28%
2010 SILVER PRODUCTIONBY COUNTRY
5%4%
11%
2010 REVENUE BY METAL
Silver 65%Gold 15%Zinc 11%Copper 5%Lead 4%
65%
15%

MANAgEMENt'S DISCUSSION AND ANALYSIS 25
HigHLigHts oF 2010operationaL & projeCt DeVeLopment
record silver production Silver production was 24.3 million ounces in 2010, an increase of 5% over 2009. this new record is mainly attributable to exceptional silver production at Alamo Dorado, where 6.7 million ounces was produced compared to 5.3 million ounces in 2009.
navidad project Updatethe Company released the results of Navidad’s preliminary assessment, which defined a highly economic project that would produce an estimated average of 19.8 million ounces of silver over the first 5 years of operation, have a mine life of 17 years and generate an after-tax return of $1.2 billion at a 5% discount rate (assuming a $25 per ounce silver price).
La preciosa Updatethe Company made good progress at the La Preciosa joint-venture project, where we invested in exploration and delineation drilling, metallurgical testing and engineering activities and are well on our way to producing a preliminary assessment by mid-year 2011.
robust proven and probable silver reservesA successful exploration and resource conversion program in 2010 very nearly fully replaced reserves that were mined during the year. As at December 31, 2010, proven and probable reserves totaled 230.7 million ounces. For the complete breakdown of reserves and resources by property and category, refer to section “Mineral Reserves and Resources” contained herein.
FinanCiaL
record sales Annual sales in 2010 were a record $632.0 million, an increase of 39% over 2009 sales, driven primarily by increased quantities of silver sold, combined with higher realized prices for all metals.
record mine operating earnings Mine operating earnings in 2010 increased to $239.8 million, an increase of 90% over the prior year, as growth in sales noted above significantly outweighed increases in cost of sales and depreciation.
record operating Cash Flow Cash flow from operations was at a record $242.3 million, a 109% increase from 2009. Operating cash flow before changes in non-cash working capital was $218.3 million in 2010, a $66.7 million improvement on the comparable cash flow from 2009. the additional operating cash flow was mainly attributable to increased cash flow from Alamo Dorado and Manantial Espejo, which combined to generate $150.9 million.
record Liquidity and Working Capital position the Company had a record cash and short term investment balance of $360.5 million and a working capital position at a record $433.8 million at December 31, 2010, an increase of $167.4 million and $161.5 million, respectively, from a year ago. this was driven mostly by the record operating cash flows as described above.
pan american starts paying Dividends Pan American declared its first dividend in February 2010 and a second dividend in August 2010, both in the amount of $0.025 per common share. In November 2010 the Company announced a dividend in the amount of $0.025 per share and increased the frequency of the Company’s dividend distributions from a semi-annual to a quarterly basis.
BUsiness DeVeLopment
the aquiline transactionDuring January 2010, the Company issued further common shares and share purchase warrants (1.7 million and 0.7 million, respectively) to bring its ownership interest in Aquiline Resources Inc. from 93% to 100% by January 22, 2010. the final step of the acquisition was achieved through a Compulsory Acquisition. Please refer to Note 3 of the Audited Consolidated Financial Statements for further details.
2011 projeCt DeVeLopment oBjeCtiVesOn November 30, 2010, the Company released the results of Navidad’s Preliminary Assessment, which defined a highly economic project that would involve developing and mining the deposit through conventional surface mining methods. the Preliminary Assessment technical report was subsequently filed with the applicable regulatory authorities on January 14, 2011 and is available on SEDAR at www.sedar.com. the Company expects to complete an Environmental Impact Assessment (“EIA”) during the second quarter of 2011 and a full feasibility study in the fourth quarter. In 2011, the Company plans to invest over $40.0 million in Navidad’s continued development, including $16 million for exploration diamond drilling. the remainder will be directed towards preparation of the EIA, tailings site and geotechnical evaluation, metallurgical studies, basic engineering, preparation of the feasibility study, and community, media and government relations activities. Pan American Silver remains confident that an open and informed dialogue with the provincial government and local communities regarding open pit mining in the Central Meseta of Chubut will ultimately be resolved favorably and lead to the responsible development of Navidad. the Company intends to transform Navidad into a world-class silver mine.
During 2010 Pan American was also very active at the La Preciosa joint-venture with Orko Silver Corp. the Company is currently completing additional work to evaluate alternative extraction and development scenarios in order to maximize the project’s economics, in view of the improved metals price environment. During the first half of 2011, Pan American expects to invest $1 million at La Preciosa to complete a preliminary assessment.
Pan American’s Morococha Relocation Project will advance in 2011 with completion of the construction of the new Morococha site infrastructure, including a maintenance facility, warehouse, administration building, and employee residence. A total of $43 million is budgeted for this work in 2011, which will be partially offset by progress payments received from Minera Peru Chinalco (“Chinalco”). the purpose of this project is to move existing facilities to outside the area of Chinalco’s future toromocho open pit mine. the processing plant relocation is currently scheduled for 2013/2014, as the current concentrator is located a safe distance from the first toromocho open pit activity.
PAN AMERICAN SILVER CORP. | ANNUAL REPORt 201026
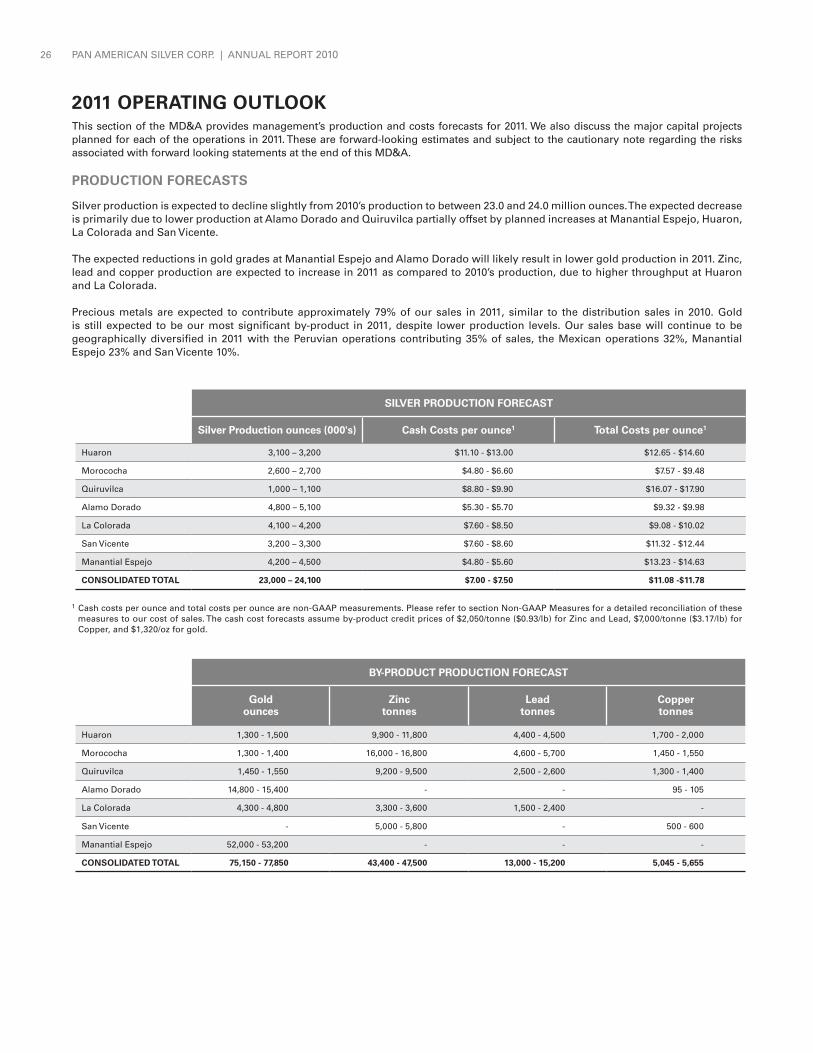
2011 operating oUtLooKthis section of the MD&A provides management’s production and costs forecasts for 2011. We also discuss the major capital projects planned for each of the operations in 2011. these are forward-looking estimates and subject to the cautionary note regarding the risks associated with forward looking statements at the end of this MD&A.
proDUCtion ForeCasts
Silver production is expected to decline slightly from 2010’s production to between 23.0 and 24.0 million ounces. the expected decrease is primarily due to lower production at Alamo Dorado and Quiruvilca partially offset by planned increases at Manantial Espejo, Huaron, La Colorada and San Vicente.
the expected reductions in gold grades at Manantial Espejo and Alamo Dorado will likely result in lower gold production in 2011. Zinc, lead and copper production are expected to increase in 2011 as compared to 2010’s production, due to higher throughput at Huaron and La Colorada.
Precious metals are expected to contribute approximately 79% of our sales in 2011, similar to the distribution sales in 2010. gold is still expected to be our most significant by-product in 2011, despite lower production levels. Our sales base will continue to be geographically diversified in 2011 with the Peruvian operations contributing 35% of sales, the Mexican operations 32%, Manantial Espejo 23% and San Vicente 10%.
siLVer proDUCtion ForeCast
silver production ounces (000's) Cash Costs per ounce1 total Costs per ounce1
Huaron 3,100 – 3,200 $11.10 - $13.00 $12.65 - $14.60
Morococha 2,600 – 2,700 $4.80 - $6.60 $7.57 - $9.48
Quiruvilca 1,000 – 1,100 $8.80 - $9.90 $16.07 - $17.90
Alamo Dorado 4,800 – 5,100 $5.30 - $5.70 $9.32 - $9.98
La Colorada 4,100 – 4,200 $7.60 - $8.50 $9.08 - $10.02
San Vicente 3,200 – 3,300 $7.60 - $8.60 $11.32 - $12.44
Manantial Espejo 4,200 – 4,500 $4.80 - $5.60 $13.23 - $14.63
ConsoLiDateD totaL 23,000 – 24,100 $7.00 - $7.50 $11.08 -$11.78
1 Cash costs per ounce and total costs per ounce are non-gAAP measurements. Please refer to section Non-gAAP Measures for a detailed reconciliation of these measures to our cost of sales. the cash cost forecasts assume by-product credit prices of $2,050/tonne ($0.93/lb) for Zinc and Lead, $7,000/tonne ($3.17/lb) for Copper, and $1,320/oz for gold.
BY-proDUCt proDUCtion ForeCast
gold ounces
Zinc tonnes
Leadtonnes
Coppertonnes
Huaron 1,300 - 1,500 9,900 - 11,800 4,400 - 4,500 1,700 - 2,000
Morococha 1,300 - 1,400 16,000 - 16,800 4,600 - 5,700 1,450 - 1,550
Quiruvilca 1,450 - 1,550 9,200 - 9,500 2,500 - 2,600 1,300 - 1,400
Alamo Dorado 14,800 - 15,400 - - 95 - 105
La Colorada 4,300 - 4,800 3,300 - 3,600 1,500 - 2,400 -
San Vicente - 5,000 - 5,800 - 500 - 600
Manantial Espejo 52,000 - 53,200 - - -
ConsoLiDateD totaL 75,150 - 77,850 43,400 - 47,500 13,000 - 15,200 5,045 - 5,655

MANAgEMENt'S DISCUSSION AND ANALYSIS 27
per ounce for Pan American’s 92.2% interest in Morococha. tonnes milled, silver grades and recoveries at Morococha in 2011 are all expected to remain similar to 2010 levels. Zinc and lead production is expected to increase marginally with higher grades in the areas planned to be mined. Operating costs per tonne are expected to increase by approximately 8% over 2010. We anticipate cash cost per ounce in 2011 to increase compared to 2010’s cash cost of $4.43 due to the higher operating costs partially offset by increased zinc and lead production.
In total, Morococha’s capital budget for 2011 is $12.2 million, primarily for the long term multiple year mine development advances towards the Yacamina zones, exploration to replace reserves mined, and equipment overhauls and replacements.
Quiruvilca mineIn 2011, we expect to produce 1.0 to 1.1 million ounces of silver at a cash cost in the range of $8.80 to $9.90 per ounce.
the production profile is anticipated to decline slightly from that achieved in 2010 due to lower expected grades. A decrease in by-product credits is the main reason for the expected increase in cash costs per ounce, compared to the $5.87 per ounce cash costs recorded in 2010. Our forecast reflects management’s intention to operate the mine throughout the year while concurrently advancing the mine closure.
Management’s forecast for 2011 assumes that mine development continues throughout 2011, anticipating the continuation of operations beyond 2011. Our plan includes concurrent reclamation spending of approximately $1.5 million which will be recorded against the existing mine closure obligation on our balance sheet. In 2011, we plan to capitalize capital expenditures of $2.9 million and amortize these amounts over the production life primarily for equipment overhauls and replacements.
pyrite stockpileOur assumption is that the La Oroya smelter will not restart in 2011 and we are therefore not anticipating any silver production from our pyrite stockpile operation. As such, the remaining silver ounces contained in the pyrite stockpiles have been re-categorized from Reserves to Resources and in 2010 we wrote down the remaining carrying value of the stockpiles.
alamo Dorado mineIn 2011, we expect Alamo Dorado to be our largest producer with anticipated production of 4.8 to 5.1 million ounces of silver at a cash cost in the range of $5.30 to $5.70 per ounce. Silver and gold grades will decrease at Alamo Dorado during 2011, with silver and gold recoveries stable around 88%. the mine is expected to produce 14,800 to 15,400 ounces of gold compared to the 16,476 ounces produced in 2010.
the expected increase in cash costs per ounce compared to the $3.16 per ounce incurred in 2010 is due to lower silver grades, higher direct operating costs and lower by-product credits from gold revenues.
Capital expenditures are expected to be $2.0 million, primarily for exploration and for equipment replacements and upgrades.
La Colorada mineIn 2011, we expect to produce 4.1 to 4.2 million ounces of silver at a cash cost in the range of $7.60 to $8.50 per ounce. La Colorada will continue shifting production from the oxide zone
CasH anD totaL Costs ForeCastsCash costs are expected to increase to approximately $7.00 to $7.50 per ounce of payable silver in 2011 compared to the 2010 cash costs of $5.69 per ounce. this is primarily due to increases in direct operating costs (mostly labour related), royalties, treatment charges, and reduced gold by-product credits. the non-cash component of our total cost per ounce is expected to increase relative to the $3.82 per ounce recorded in 2010 to approximately $4.21 per ounce in 2011.
CapitaL expenDitUre ForeCasts
We are planning to invest $54.0 million in sustaining capital and $67.2 on project development in 2011, as set out in the table below:
CapitaL BUDget (in millions)
Huaron $ 9.9
Morococha $ 12.2
Quiruvilca $ 2.9
Alamo Dorado $ 2.0
La Colorada $ 10.8
San Vicente $ 4.6
Manantial Espejo $ 11.6
mine Capital $ 54.0
Navidad $ 28.7
Morococha Project $ 37.2
Other $ 1.3
project Development Capital $ 67.2
totaL CapitaL $ 121.2
Management’s forecast for each mine’s operating performance and capital requirements in 2011 follows:
Huaron mineIn 2011, we expect to produce approximately 3.1 to 3.2 million ounces of silver at Huaron at a cash cost in the range of $11.10 to $13.00 per ounce. Huaron plans to increase mining and milling rates by around 4% from its 2010 levels by accessing additional higher grade ore zones deeper in the mine. the increased throughput along with an approximate 5% increase in silver grade is expected to result in an increase in silver production of approximately 10%. the expected increase in throughput rates is also expected to yield higher production of zinc, lead and copper. Costs per dry metric tonne (“DMt”) milled are forecasted to remain fairly stable as compared to 2010 primarily as a result of the effect of increases in throughput offsetting cost increases. Cash costs per ounce are expected to reduce from the 2010 cash costs due to the increased by-product credit production and will be partially offset by the increased operating costs.
Capital spending of $9.9 million at Huaron in 2011 will allow for mine development, exploration to replace reserves mined, equipment overhauls and equipment replacements.
morococha mineIn 2011, we expect to produce approximately 2.6 to 2.7 million ounces of silver at a cash cost in the range of $4.80 to $6.60

PAN AMERICAN SILVER CORP. | ANNUAL REPORt 201028
and expand production from the sulphide zone. A 12% increase in throughput is expected to result in an approximately 8% increase in silver production during 2011, as well as increases in the production of gold, zinc and lead.
Operating costs per tonne in 2011 are expected to remain similar to the 2010 level. Cash costs per ounce are expected to decrease by approximately 2% from 2010’s cash costs per ounce of $8.59 due to the effect of increased production, which outweighs the impact of higher direct operating costs.
Capital expenditures at La Colorada in 2011 are expected to be $10.8 million, and are comprised mostly of expenditures related to constructing a new tailings dam, equipment overhauls, equipment replacements and exploration drilling.
san Vicente mineIn 2011, we expect to produce 3.2 to 3.3 million ounces of silver at a cash cost in the range of $7.60 to $8.60 per ounce for Pan American’s 95.0% interest in San Vicente. Our 2011 forecast for San Vicente contemplates operating the plant at 11% above the design capacity of 750 tonnes per day. the mine plan for 2011 is expected to deliver ore with slightly lower silver and zinc grades than in 2010. the higher throughput rates are expected to outweigh the decrease in grades, resulting in increased production of silver and zinc compared to 2010 levels.
For 2011 the increase in throughput rates is expected to result in a decrease in the unit operating costs per tonne, offsetting the impact of lower grades and as a consequence cash costs per ounce are expected to remain similar to 2010 levels.
the main projects making up the $4.6 million capital budget at San Vicente include equipment overhauls and repairs, infrastructure upgrades, and exploration drilling.
manantial espejo mineIn 2011, we expect to produce 4.2 to 4.5 million ounces of silver at a cash cost in the range of $4.80 to $5.60 per ounce. the key objectives in 2011 for Manantial Espejo are to maintain design capacity throughput of 2,000 tonnes per day of ore and to improve silver grades and recoveries, thereby increasing silver production from 2010 levels.
the 2011 mine plan calls for a total of approximately 10.1 million tonnes to be mined from open pits, including 0.6 million tonnes of ore from the open pit and an additional 0.2 million ore tonnes to be mined from underground. the open pit mining rates will be expanded from the average 604,000 tonnes per month achieved in 2010 to 1.0 million tonnes per month beginning in July 2011 with an investment of $5.5 million for additional open pit equipment. the increased open pit mining rates provides enhanced flexibility, reduced unit operating costs, enhanced grades in 2011 to 2014, and an overall increase in life-of-mine cash flows. gold head grades are expected to decrease which will result in an approximately 17% decline in gold production from the 2010 level. the drop in gold production and the resultant decline in by-product credit is the principal reason for the sharp increase from the 2010 cash costs of $1.61 per ounce.
Included in cash flow from operations at Manantial Espejo is an amount of $20.1 million related to recovery of value added tax (“VAt”) receivable balances. Operating cash flow from Manantial (excluding working capital) is expected to make up approximately 35% of the consolidated operating cash flow in 2011.
the capital budget for 2011 totals $11.6 million with the majority of the capital to be spent on equipment acquisitions, increased housing projects in gobernador gregores, work on the tailings dam, as well as exploration drilling.

MANAgEMENt'S DISCUSSION AND ANALYSIS 29
2010 operating perFormanCethe following table reflects silver production and cash costs at each of Pan American’s operations for 2010, as compared to 2009 and 2008.
siLVer proDUCtion (ounces '000s) CasH Costs1 ($ per ounce)
2010 2009 2008 2010 2009 2008
Huaron 2,987 3,563 3,628 $ 12.35 $ 9.95 $ 8.06
Morococha2 2,633 2,762 2,476 $ 4.43 $ 5.86 $ 2.84
Quiruvilca 1,245 1,422 1,383 $ 5.87 $ 8.64 $ 6.61
Pyrites Stockpiles - 98 284 $ - $ 3.78 $ 4.41
Alamo Dorado 6,721 5,321 6,116 $ 3.16 $ 4.51 $ 4.38
La Colorada 3,702 3,468 3,911 $ 8.59 $ 7.55 $ 8.06
San Vicente3 3,033 2,627 875 $ 8.21 $ 7.07 $ 7.57
Manantial Espejo 3,965 3,783 - $ 1.61 $ (0.84) $ -
ConsoLiDateD totaL 24,286 23,044 18,673 $ 5.69 $ 5.53 $ 5.96
1 Cash costs per ounce and total costs per ounce are non-gAAP measurements. Please refer to section Non-gAAP Measures for a detailed reconciliation of these measures to our cost of sales.
2 Morococha data represents Pan American's 92.2% interest in the mine's production.
3 San Vicente data represents Pan American's 95.0% interest in the mine's production.
the graph below pictorially presents silver production by mine in 2010 and highlights the diverse nature of Pan American’s silver production.
12%
15%
12%11%
Alamo Dorado 29%Manantial Espejo 16%La Colorada 15%Huaron 12%San Vicente 12%Morococha 11%Quiruvilca 5%
2010 SILVER PRODUCTION BY MINE
5%
29%
16%
In 2010, Pan American’s silver production increased by 1.2 million ounces to a record 24.3 million ounces. this increase was primarily driven by record production at Alamo Dorado, increased silver production at San Vicente, which was in its first full year of commercial operation and higher silver production relative to 2009 at Manantial Espejo and La Colorada. these increases were partially offset by decreases at our Peruvian operations. Silver production in 2010 was 800,000 ounces higher than management’s forecast of 23.4 million ounces.
Consolidated cash costs per ounce of silver were $5.69 in 2010, a 3% increase from 2009’s cash costs per ounce of $5.53. the small increase in cash costs were primarily due to a 10% increase in unit operating costs per tonne which were driven by increases in mining royalties in Argentina due to higher metal prices, stronger local currencies and higher labour costs, partially offset by the increased by-product credits as a result of the improved gold and base metal prices in 2010.
the following table sets out the Company’s by-product production over the past three years:
BY-proDUCt proDUCtion
2010 2009 2008
gold ounces 89,555 100,704 25,146
Zinc tonnes 43,103 44,246 39,811
Lead tonnes 13,629 14,328 15,974
Copper tonnes 5,221 6,446 6,069
In 2010, production of all by-product metals decreased in comparison to 2009 production. gold, zinc, lead and copper production relative to 2009 declined by 11%, 3%, 5% and 19%, respectively. Actual production in 2010 fell short of management’s expectation for zinc, lead and copper by 6%, 14% and 28%, respectively. While gold production in 2010 did exceed management’s initial forecast of 85,600 ounces, it fell short of our revised guidance of 95,000 in the Q1 2010 MD&A. the shortfall in gold was due to lower than anticipated gold grades and recoveries over the last 3 quarters of 2010, while the shortfall in the base metals was primarily due to lower than expected grades.
A description of each mine and an analysis of their 2010 operating performance, measured against 2009 operating performance and management’s forecasts for 2010 follows.

PAN AMERICAN SILVER CORP. | ANNUAL REPORt 201030
HUaron mine
tWeLVe montHs enDeD DeCemBer 31
2010 2009
tonnes milled 704,094 699,420
Average silver grade – grams per tonne 171 200
Average zinc grade 2.43% 2.48%
Average silver recovery 77.3% 79.2%
Silver – ounces 2,987,280 3,562,893
gold – ounces 1,525 1,235
Zinc – tonnes 10,216 11,198
Lead – tonnes 4,346 4,372
Copper – tonnes 1,654 2,166
Cash costs per ounce1 $ 12.35 $ 9.95
total costs per ounce1 $ 13.98 $ 11.33
Payable ounces of silver 2,753,906 3,225,928
1 Cash costs per ounce and total costs per ounce are non-gAAP measurements. Please refer to section Non-gAAP Measures for a detailed reconciliation of these measures to our cost of sales.
the Huaron silver-zinc underground polymetallic mine is located 320 highway km northeast of Lima in the heart of the Cerro de Pasco district. this is one of Peru's most important mining districts, accounting for more than half of the country's silver production. Since operations began in 1912, Huaron has produced more than 230 million ounces of silver.
Pan American acquired a majority interest in Huaron in March 2000 and re-opened the mine in April 2001 after completing a feasibility study, arranging financing and completing site rehabilitations.
In 2010, although mill tonnage at Huaron remained similar to 2009, silver production declined by 16% mainly due to lower silver grades and recoveries. Zinc and copper production was also hampered by lower grades and recoveries, while lead and gold production remained similar to 2009 levels. these declines were a result of less than expected ore tonnes and grades obtained from the 180 level mine deepening area.
Cash costs at Huaron increased by 24% in 2010 to $12.35 per ounce mainly due to the negative effect of fixed costs on lower production of silver ounces and increased costs associated with additional cost for dewatering and ventilation for the mine deepening to 180 level, additional underground mine development and ground support measures, general operating cost escalations and the strengthening local currency. Offsetting these factors were higher by-product credits resulting from stronger base metal prices in 2010.
Silver production in 2010 was 19% below management’s forecast of 3.7 million ounces and actual cash costs per ounce were 41% higher than our forecast of $8.75 per ounce. the reasons for the shortfall in production relative to management’s forecast were lower than planned throughput combined with lower grade silver ore. the latter was due to the shortfalls of high grade ore realized on the 180 level mine deepening. the actual cash costs in 2010 relative to forecasted cash costs were negatively impacted by (i) the negative effect of fixed costs on lower tonnage and lower production of silver; (ii) a six-day mine closure resulting from an illegal workers’ strike disputing the amount of the 2009 workers’ profit-sharing payment; (iii) additional underground mine development costs and increases in ground support measures; and (iv) the effect of strengthened local currency. Offsetting these factors were better realized by-product prices than expected.
Capital expenditures at Huaron during 2010 totalled $6.6 million and comprised mainly of mine development, exploration expenditures, process plant screening upgrades, mine equipment replacements, tailings dam improvements, and surface facility upgrades.

MANAgEMENt'S DISCUSSION AND ANALYSIS 31
moroCoCHa mine*
tWeLVe montHs enDeD DeCemBer 31
2010 2009
tonnes milled 619,819 638,805
Average silver grade – grams per tonne 152 156
Average zinc grade 2.88% 3.24%
Average silver recovery 87.0% 86.1%
Silver – ounces 2,632,790 2,762,064
gold – ounces 2,329 1,291
Zinc – tonnes 15,228 16,942
Lead – tonnes 4,927 5,520
Copper – tonnes 1,532 2,030
Cash costs per ounce1 $ 4.43 $ 5.86
total costs per ounce1 $ 7.13 $ 8.49
Payable ounces of silver 2,338,121 2,469,949
*Production and cost figures are for Pan American’s 92.2% share only.1 Cash costs per ounce and total costs per ounce are non-gAAP measurements. Please refer to section Non-gAAP Measures for a detailed reconciliation of these
measures to our cost of sales.
Pan American acquired the Morococha mine in Peru in August 2004. Morococha is a silver-zinc rich underground polymetallic vein mine located approximately 180 highway kilometres southwest of the Company's Huaron mine or 140 highway kilometers east of Lima.
the Morococha district has been mined continuously for more than 100 years and lies within one of the world's most prolific mineral belts for polymetallic vein systems. Morococha hosts a very large and productive network of veins, mantos, skarns, and other replacement ore bodies within a mineral rights package covering 110 square kilometres of concessions.
Morococha’s 2010 silver production decreased by 5% as compared to 2009 mainly due to a 3% decrease in throughput rates combined with slightly lower silver grades, partially offset by higher silver recoveries. Lower zinc, lead and copper grades resulted in lower production of those metals.
Cash costs at Morococha decreased by 24% primarily due to higher by-product credits resulting from stronger base metal prices partially offset by an increase in unit operating costs per tonne for 2010 compared to 2009.
Actual performance at Morococha in 2010 with respect to throughput rates, silver grades and recoveries were all roughly in-line with management’s forecasts, resulting in silver production which was within 2% of management’s expectations. gold production was ahead of management’s expectation due to higher gold grades. Zinc, lead and copper fell short of management’s forecast by 5%, 13% and 34%, respectively, due mainly to lower grades of those metals. the actual cash costs were 4% higher than forecasted cash costs of $4.25 per ounce due to higher operating costs from general cost escalations and the strengthened currency partially offset by higher than expected by-product credits.
Capital expenditures at Morococha during 2010 totalled $16.7 million. the capital spending was primarily on long term mine development advances, exploration drilling, mine and plant equipment replacements, and initial preparation work for the central facility relocations to make way for Chinalco’s toromocho Project development.

PAN AMERICAN SILVER CORP. | ANNUAL REPORt 201032
QUirUViLCa mine
tWeLVe montHs enDeD DeCemBer 31
2010 2009
tonnes milled 323,427 330,030
Average silver grade – grams per tonne 141 155
Average zinc grade 3.58% 3.80%
Average silver recovery 84.7% 86.3%
Silver – ounces 1,245,030 1,421,897
gold – ounces 1,801 1,522
Zinc – tonnes 10,058 10,993
Lead – tonnes 2,989 3,230
Copper – tonnes 1,434 1,643
Cash costs per ounce1 $ 5.87 $ 8.64
total costs per ounce1 $ 6.56 $ 9.25
Payable ounces of silver 1,128,557 1,288,720
1 Cash costs per ounce and total costs per ounce are non-gAAP measurements. Please refer to section Non-gAAP Measures for a detailed reconciliation of these measures to our cost of sales.
the Quiruvilca mine is located approximately 130 kilometres inland from the coastal city of trujillo. Mineralization was first reported in the area in 1789, and the mine has been in continuous operation since 1926. the underground workings cover an area four kilometres long by three kilometres wide and extend more than 400 meters in depth. Pan American has operated Quiruvilca since acquiring the property from ASARCO in late 1995.
As reported previously, management has activated plans to place Quiruvilca on care and maintenance. Based on the improvement in the price environment for metals being sustained through 2010 and into 2011, our intention is to operate the Quiruvilca mine throughout 2011 while still continuing to prepare for mine closure should metal prices fall sharply.
In 2010, Quiruvilca’s silver production decreased by 12% in comparison to 2009. this decrease in silver production was due to a combination of lower tonnage and reduced silver grades and recoveries. Similarly, lower zinc, lead, and copper grades resulted in lower production of those metals in 2010.
Cash costs for 2010 were $5.87, a 32% decrease from $8.64 per ounce a year ago, primarily due to the increase in by-product credits resulting from stronger base metal prices in 2010 partially off-set by higher operating costs from general cost escalations and the strengthened currency. Cash costs in 2010 continue to reflect the fact that all expenditures in Quiruvilca were expensed (including items that would normally have been capitalized if the operation were not being prepared for care and maintenance).
Silver production during 2010 fell 11% short of management’s expectations, primarily due to the lower than expected silver grades and recoveries. Overall by-product production was reasonably within management’s forecast. gold and zinc production were above management’s forecast by 15% and 3%, respectively, due to higher realized grades of those metals, while lead production was in-line with expectations, and copper production fell 10% short of forecast due to lower realized copper grades partially offset by higher than anticipated copper recoveries. Cash costs of $5.87 per ounce were 16% below management’s forecast of $7.00 per ounce primarily as a result of higher than expected base metal prices partially off-set by higher operating costs.

MANAgEMENt'S DISCUSSION AND ANALYSIS 33
pYrite stoCKpiLes
tWeLVe montHs enDeD DeCemBer 31
2010 2009
tonnes sold – 13,984
Average silver grade – grams per tonne – 218
Silver – ounces – 98,235
Cash costs per ounce1 $ – $ 3.78
total costs per ounce1 $ – $ 3.78
Payable ounces of silver – 50,218
1 Cash costs per ounce and total costs per ounce are non-gAAP measurements. Please refer to section Non-gAAP Measures for a detailed reconciliation of these measures to our cost of sales.
the silver-rich stockpiles are located in the Cerro de Pasco mining district of Peru. Volcan Compañía Minera, a Peruvian mining company, is the largest ore producer in this district. For many decades, Volcan's Cerro de Pasco mine accumulated silver-rich stockpiles from which the silver could not be extracted by standard metallurgical processes. In November 2002, Pan American acquired the stockpiles and entered into an agreement to mine and sell 600,000 tonnes of the highest grade silver stockpiles to the La Oroya smelter, where the ore is used as a process flux and consequently the silver is recovered.
In 2010, there was no production from the Pyrite Stockpile operation as a direct consequence of the closure of the La Oroya smelter, which is the only buyer of this material.
Management’s expectation that the La Oroya smelter would restart operations in the second quarter of 2010 was not realized. As a consequence, there was no production in 2010 from the pyrite stockpiles compared to the forecasted 0.2 million ounces of silver at a cash cost of $4.00 per ounce.
In Q4 2010, the Company made the decision to write-off the remaining $1.5 million book value associated with the pyrite stockpiles. this decision was based on the uncertainty related to the future of the La Oroya smelter. As a consequence of this decision the remaining silver reserves in the pyrite stockpile have been re-categorized to measured and indicated resources.

PAN AMERICAN SILVER CORP. | ANNUAL REPORt 201034
aLamo DoraDo mine
tWeLVe montHs enDeD DeCemBer 31
2010 2009
tonnes milled 1,675,952 1,671,257
Average silver grade – grams per tonne 147 111
Average gold grade – grams per tonne 0.38 0.39
Average silver recovery 88.4% 87.7%
Silver – ounces 6,721,258 5,320,637
gold – ounces 16,746 18,211
Copper – tonnes 89 206
Cash costs per ounce1 $ 3.16 $ 4.51
total costs per ounce1 $ 7.41 $ 9.12
Payable ounces of silver 6,693,134 5,284,037
1 Cash costs per ounce and total costs per ounce are non-gAAP measurements. Please refer to section Non-gAAP Measures for a detailed reconciliation of these measures to our cost of sales.
Alamo Dorado is an open-pit mine located in the Mexican state of Sonora, approximately 320 km from the state capital of Hermosillo. Corner Bay Silver Inc., a toronto-listed exploration company, began grassroots reconnaissance of the area in 1997. Pan American acquired Corner Bay and the Alamo Dorado project in February 2003. the mine began commercial production on April 1, 2007 after the construction of the mine, plant and related infrastructure was completed substantially on schedule and on budget at the end of 2006.
Alamo Dorado was the Company’s largest silver producer in 2010, with record silver production of 6.7 million ounces. Silver production increased by 26% from the 2009 levels primarily due to significantly higher silver grades. the increased silver grades were a result of more mining than planned in the higher grade portions of the Phase I pit and encountering more tonnes and higher grades than anticipated in the Phase II pit. gold production at approximately 17,000 ounces in 2010 was 8% lower than that in the comparable period of 2009 mainly as a result of lower gold grades.
Alamo Dorado’s cash costs per ounce were $3.16 in 2010, a 30% decrease from the 2009 cash costs of $4.51, due mainly to the positive effect of higher production of silver ounces on fixed costs and the higher gold price.
Alamo Dorado’s record silver production in 2010 was well above management’s forecast of 4.2 million ounces mainly due to higher than expected silver grades. gold production was 23% ahead of the 13,700 ounce forecast as gold grades realized also exceeded expectations. Cash costs were 53% lower than our forecast of $6.75 per ounce as a result of significantly higher silver production and higher realized gold by-product credits resulting from increased gold production and gold metal prices.
Capital expenditures at Alamo Dorado during 2010 totalled $2.1 million primarily for equipment replacements and infrastructure upgrades.

MANAgEMENt'S DISCUSSION AND ANALYSIS 35
La CoLoraDa mine
tWeLVe montHs enDeD DeCemBer 31
2010 2009
tonnes milled 345,697 324,916
Average silver grade – grams per tonne 378 384
Average silver recovery 88.0% 86.2%
Silver – ounces 3,701,568 3,467,856
gold – ounces 4,312 6,554
Zinc – tonnes 2,940 2,311
Lead – tonnes 1,366 1,205
Cash costs per ounce1 $ 8.59 $ 7.55
total costs per ounce1 $ 9.73 $ 11.21
Payable ounces of silver 3,537,905 3,333,170
1 Cash costs per ounce and total costs per ounce are non-gAAP measurements. Please refer to section Non-gAAP Measures for a detailed reconciliation of these measures to our cost of sales.
Pan American acquired the La Colorada mine in 1998 and invested through 2003 to refurbish the mine and construct a 650 tonne per day silver and gold oxide ore processing plant with associated infrastructure. Following the commissioning of the oxide plant in 2003, the Company made additional investments to expand the mine and the pre-existing sulphide processing plant to produce silver, gold, lead, and zinc from an additional 550 tonne per day sulphide plant which was commissioned in 2006. the mine consists of six continuous blocks of exploration permits and exploitation claims totalling 2,230 hectares.
the project lies within one of Mexico’s geologic belts known as the "faja de plata" (silver belt) that extends for 800 km along the Sierra Madre Mountains and is defined by prolific silver deposits. the continued exploration success achieved at La Colorada reported over the last 5 years illustrates the excellent potential for extending reserves through discovery and additional development.
Silver production at the La Colorada mine in 2010 was 3.7 million ounces, a 7% increase compared to the previous year. this increase was due to higher throughput rates and improved silver recoveries as a result of benefits from previous investments in mine development, mine equipment purchases, ventilation and dewatering which are enabling higher productivities and efficiencies. Despite the higher throughput rates in 2010, lower gold grades led to a decrease in gold production while production of lead and zinc benefited from higher throughput.
Cash costs increased by 14% in 2010 compared to 2009 to $8.59 per ounce as a result of higher operating costs, partially offset by higher by-product credits.
Actual performance at La Colorada in 2010 with respect to silver production was 3% ahead of management’s expectation of 3.6 million ounces, resulting from higher realized silver grades than expected. gold grades were approximately 19% below expectations, whereas lead and zinc grades were in-line with expectations. Actual cash costs of $8.59 were in-line with management’s forecast for 2010 as higher operating costs were off-set by better than expected production and higher by-product metal prices.
Capital expenditures at La Colorada during 2010 totalled $9.1 million. the capital was spent mainly on a tailings dam expansion, additional underground mine equipment purchases, sulphide plant equipment upgrades, and exploration works.

PAN AMERICAN SILVER CORP. | ANNUAL REPORt 201036
san ViCente mine*
tWeLVe montHs enDeD DeCemBer 31
2010 2009
tonnes milled 271,483 167,006
Average silver grade – grams per tonne 389 537
Average zinc grade 2.29% 2.26%
Average silver recovery 89.1% 91.0%
Silver – ounces 3,033,046 2,626,774
Zinc – tonnes 4,661 2,803
Copper – tonnes 512 401
Cash costs per ounce1 $ 8.21 $ 7.07
total costs per ounce1 $ 12.07 $ 9.51
Payable ounces of silver 2,823,869 2,458,600
* Production and interest figures are for Pan American’s 95.0% share only1 Cash costs per ounce and total costs per ounce are non-gAAP measurements. Please refer to section Non-gAAP Measures for a detailed reconciliation of these
measures to our cost of sales.
the San Vicente silver-zinc mine is located in the Bolivian Andes. More than 20 bonanza type silver-zinc veins are known to occur over an area of 1.5 kilometres on surface and extend to at least 200 meters in depth. the project consists of 15 mining concessions totalling 8,159 hectares.
San Vicente was operated from 1972 to 1993 by COMIBOL, the Bolivian state mining company. In 1999 Pan American optioned the project from COMIBOL under a joint venture agreement. Following acquisition, Pan American investigated several development alternatives for San Vicente with local partnerships and by May 2007 secured 95.0% interest in the operating company of the Joint Venture Project with COMIBOL. Under the Joint Venture agreement, COMIBOL retains the rights to collect 9.4% of the operating cash flow while the Company recovers its capital investment increasing to 37.5% thereafter. Between 2000 and 2007 the Company invested in exploration drilling, underground development drifting, and performing various feasibility and development studies while conducting limited mining and toll milling production at a nearby neighbouring processing facility. During this period, Pan American discovered the rich Litoral II vein which served to significantly increase the Proven and Probable reserves at the mine. Pan American decided in mid-2007 to invest in expanding the mine by developing a modern trackless long-hole mining operation for the Litoral II vein and constructing its own 750 tonne-per-day processing facility. Commissioning activities proceeded smoothly since the April 2009 start-up leading the Company to declare commercial production in the first month of operation.
In 2010, San Vicente’s silver production increased by 15% compared to its 2009 production, mainly due to a full year of production offset by lower silver grades and recoveries. Zinc and copper production levels were significantly higher by 66% and 28%, respectively, compared to the same period last year primarily due to the increased throughput rates.
Cash costs at San Vicente increased by 16% to $8.21 in 2010 as compared to the previous year. the higher cash costs in 2010 resulted from anticipated lower silver grades as high grade ore that had been stockpiled during the exploration and development years was processed in 2009. this was partially offset by higher zinc and copper by-product credits due to increased production and prices of those metals.
Actual silver production attributable to Pan American in 2010 was in-line with management’s forecast, as the lower than expected silver grades were offset by the higher than anticipated throughput rates. Zinc and copper production fell short of forecast by 7% and 27% respectively due to the lower than expected grades of those metals. Actual cash costs of $8.21 were 17% above management’s forecast due to processing more tonnes and lower silver grades as well as higher than expected operating costs.
Capital expenditures at San Vicente during 2010 totalled $6.0 million. this consisted mainly of spending on exploration, additional underground mine equipment, concentrate handling and reagent storage facility upgrades, tailings pond water recycle system enhancements and a tailings dam rise.

MANAgEMENt'S DISCUSSION AND ANALYSIS 37
manantiaL espejo mine
tWeLVe montHs enDeD DeCemBer 31
2010 2009
tonnes milled 717,463 632,949
Average silver grade – grams per tonne 191 209
Average gold grade – grams per tonne 2.81 3.79
Average silver recovery 90.5% 87.6%
Average gold recovery 94.7% 94.6%
Silver – ounces 3,964,822 3,783,183
gold – ounces 62,843 71,892
Cash costs per ounce1 $ 1.61 $ (0.84)
total costs per ounce1 $ 10.16 $ 8.19
Payable ounces of silver 3,958,874 3,777,508
1 Cash costs per ounce and total costs per ounce are non-gAAP measurements. Please refer to section Non-gAAP Measures for a detailed reconciliation of these measures to our cost of sales.
Reconnaissance exploration on the Manantial Espejo property was first carried out in the 1970s by the Argentinean government. In 2002, the Company acquired a 50% interest in the project and in March 2006, the Company negotiated and entered into a purchase agreement for the remaining 50% interest, thus becoming a 100% owner of the Manantial Espejo project.
In March 2006, Pan American completed a feasibility study and the 43-101 technical Report for the Manantial Espejo Project, based upon a combination open pit and underground mine plan, and a conventional milling and leaching circuit with a design capacity of 2,000 tonnes per day. In the same month, the Company’s board of directors approved a project to construct the Manantial Espejo mine, which was completed in December 2008. In 2009, its first full year of commercial production, the mine achieved an outstanding start-up performance and produced 3.8 million ounces of silver and over 70,000 ounces of gold at cash costs of negative $0.84 per ounce of silver. the 2010 silver production levels surpassed the previous year’s outstanding production.
Silver production at the Manantial Espejo mine in 2010 was 4.0 million ounces, a 5% increase from the production level in 2009. this increase was a result of the higher throughput rates and silver recoveries, partially offset by lower silver grades. gold production decreased by 13% in 2010 due to lower gold grades that were expected as the operation normalized towards the average reserve gold grades of the deposit, which is expected to be approximately 2.2 grams per tonne.
In 2010, cash costs at Manantial Espejo increased to $1.61, significantly higher than 2009’s cash costs of negative $0.84 per ounce. the main drivers of the increase in cash costs were higher operating costs mainly due to an increase in labour costs and the effects from the high sustained inflation rates in Argentina. these were partially offset by higher by-product gold prices.
In 2010, Manantial Espejo’s actual silver grades were below management’s forecast, resulting in 14% lower silver production than expected due to variations to the mine sequencing. gold recoveries and grades were in-line with forecasts, resulting in gold production within 1% of management’s expectations. the actual cash costs in 2010 of $1.61 per ounce were significantly lower than the $3.25 per ounce forecast by management as actual cash costs benefited from higher than anticipated gold prices.
Capital expenditures at Manantial Espejo during 2010 totalled $7.0 million. the capital expenditures consisted mainly of exploration drilling, acquisition of additional open pit mining equipment, and a tailings dam expansion.

PAN AMERICAN SILVER CORP. | ANNUAL REPORt 201038
oVerVieW oF 2010 FinanCiaL resULtsthe table below sets out highlights of Pan American’s quarterly results, expressed in thousands of US dollars (except for per share detail), for the past 12 quarters, together with select balance sheet information for the prior three years.
QUarters enDeD (Unaudited) Years enDeD
2010 marCH 31 jUne 30 sept. 30 DeC. 31 DeC. 31
Net income for the period $ 19,113 $ 18,256 $ 28,815 $ 46,389 $ 112,573
Net income per share – Basic $ 0.18 $ 0.17 $ 0.27 $ 0.43 $ 1.05
– Diluted $ 0.18 $ 0.17 $ 0.27 $ 0.43 $ 1.05
Dividends declared per share $ 0.025 $ - $ 0.025 $ 0.025 $ 0.075
Sales $ 132,375 $ 147,250 $ 161,262 $ 191,099 $ 631,986
Mine operating earnings* $ 36,874 $ 51,144 $ 60,581 $ 91,208 $ 239,807
Income tax provision $ (11,416) $ (18,757) $ (17,588) $ (43,226) $ (90,987)
Cash Flow from operations $ 48,916 $ 45,091 $ 64,620 $ 83,629 $ 242,256
Other financial information:
total Assets $ 2,072,608
total long-term financial liabilities $ 429,305
total Shareholders Equity $ 1,520,288
2009 marCH 31 jUne 30 sept. 30 DeC. 31 DeC. 31
Net income for the period $ 6,610 $ 10,208 $ 17,375 $ 27,805 $ 61,998
Net income per share – Basic $ 0.08 $ 0.12 $ 0.20 $ 0.31 $ 0.71
– Diluted $ 0.08 $ 0.12 $ 0.20 $ 0.31 $ 0.71
Sales $ 70,406 $ 111,392 $ 118,608 $ 154,406 $ 454,812
Mine operating earnings* $ 10,474 $ 23,490 $ 34,708 $ 57,334 $ 126,006
Income tax provision $ (2,350) $ (2,694) $ (7,483) $ (15,229) $ (27,756)
Cash Flow from (used in) operations $ (5,375) $ 32,034 $ 37,099 $ 52,118 $ 115,876
Other financial information:
total Assets $ 1,848,609
total long-term financial liabilities $ 389,383
total Shareholders Equity $ 1,343,790
2008 marCH 31 jUne 30 sept. 30 DeC. 31 DeC. 31
Net income (loss) for the period $ 30,157 $ 21,357 $ 6,404 $ (33,316) $ 24,602
Net income (loss) per share – Basic $ 0.38 $ 0.26 $ 0.08 $ (0.41) $ 0.31
– Diluted $ 0.38 $ 0.26 $ 0.08 $ (0.41) $ 0.30
Sales $ 108,750 $ 104,079 $ 79,493 $ 46,278 $ 338,600
Mine operating earnings (losses)* $ 48,375 $ 39,259 $ 15,469 $ (9,884) $ 93,219
Income tax (provision) recovery $ (14,497) $ (12,451) $ (5,988) $ 8,506 $ (24,430)
Cash Flow from (used in) operations $ 20,964 $ 52,654 $ 24,262 $ (4,352) $ 93,528
Other financial information:
total Assets $ 873,383
total long-term financial liabilities $ 102,715
total Shareholders Equity $ 685,641
* Mine operating earnings/(losses) are equal to sales less cost of sales less depreciation and amortization, which is considered to be substantially the same as gross margin.
Note: the Company announced its first dividend on February 15, 2010.

MANAgEMENt'S DISCUSSION AND ANALYSIS 39
statement oF operations
net income for 2010 was $112.6 million, compared to net income of $62.0 million for 2009. Basic earnings per share for 2010 were $1.05 compared to $0.71 in 2009. the significant increase in net income was primarily attributable to improved metal prices and a 6% increase in the quantity of silver sold.
Earnings before taxes for 2010 were reduced by $24.5 million in exploration expenses and a non-cash doubtful provision of $4.8 million and the associated write-down of inventory related to Doe Run Peru (“DRP”). the exploration expenses were primarily incurred on drilling and prefeasibility work at the Navidad and La Preciosa projects and the non-cash doubtful provision of $4.8 million was due to the uncertainty in collecting a long-term receivable from Doe Run Peru and the associated write-down of pyrite stockpile inventories that were being sold to Doe Run Peru. Net income in 2010 benefited from $11.1 million in foreign exchange gains resulting primarily from the revaluation of the long-term future income tax liability denominated in Argentine pesos and gains on Canadian dollar bank balances.
Earnings before taxes for 2009 were reduced by the following items: (i) a non-cash, doubtful debt provision of $4.4 million due to the uncertainty in collecting a long-term receivable from Doe Run Peru; (ii) a non-cash fair value charge of $2.2 million for a delay in recovery of the long-term VAt receivable in Argentina; and (iii) a donation of $2.3 million to the University of British Columbia for the construction of an earth science building.
sales in 2010 were a record $632.0 million, an increase of 39% over the 2009 sales. this increase was driven primarily by increased metal prices and silver quantities sold, with a partial offset from lower base metal quantities sold.
mine operating earnings, defined as sales less cost of sales and depreciation and amortization, increased to $239.8 million in 2010, an increase of 90% over the prior year. this change was from the combined effect of an increase in sales, as described above, which outweighed increased cost of sales and depreciation charges.
Cost of sales for the year was $305.7 million, a 24% increase from the $245.6 million realized in the same period last year. this increase was primarily a result of greater quantities of silver sold and higher operating costs.
Depreciation and amortization charges of $86.5 million in 2010 were 4% higher than the $83.2 million recorded in 2009.
income tax provision for 2010 amounted to $91.0 million compared to $27.8 million in 2009. this increase was primarily a consequence of (i) higher taxable income generated at our operations; (ii) an additional Bolivian mining tax of 12.5% introduced in October 2009; and (iii) withholding taxes on both technical services and interest paid from our foreign subsidiaries to Pan American Silver Corp.
CasH FLoW
operating activities generated $242.3 million in 2010, a new record for the Company, compared to $115.9 million generated by operations in 2009, which was the previous record for operating cash flow. the increase in cash flow from operations resulted from improved operating earnings due to higher
quantities of silver sold and higher realized prices. Before changes in non-cash working capital items, which generated $23.9 million in 2010 (2009: used $35.8 million), cash flow from operations in 2010 was $218.3 million (2009: $151.7 million). the largest contributors to the operating cash flows, before changes in non-cash working capital items, were Alamo Dorado and Manantial Espejo at $77.4 million and $73.5 million, respectively.
Changes in non-cash working capital contributed $23.9 million in 2010 compared with non-cash working capital requirements of $35.8 million in 2009. the net non-cash working capital contributions in 2010 consisted primarily of an increase in income taxes payable of $37.1 million and an increase in accounts payable and other current liabilities of $5.7 million, which were offset by a $12.1 million increase in inventories. the higher accrued current income taxes resulted from the substantial increase in taxable income generated. the increase in accounts payable and other current liabilities was mainly due to the cash payments received for the Morococha relocation project and due to the timing of royalty and other payables. the increase in inventory levels is mainly attributable to an increase in both silver doré inventory due to timing of shipments and material and supplies inventory at Manantial Espejo. In 2009, the main movements in working capital accounts that required funding were a $26.8 million increase in accounts receivables and other current assets and an increase in inventories of $15.2 million offset by an increase in taxes payable of $4.0 million.
investing activities used $166.1 million in 2010, inclusive of $80.2 million invested in short-term investments. the balance of investing activities consisted primarily of spending $28.0 million on the Navidad project and sustaining investments in property, plant and equipment primarily at Morococha, La Colorada, Manantial Espejo, Huaron, San Vicente and Alamo Dorado of $11.3 million, $9.1 million, $7.0 million, $6.6 million, $6.0 million and $2.1 million, respectively. In addition, $5.4 million was spent on the Morococha relocation project and $5.0 million was paid as refundable VAt tax in Argentina and Bolivia.
Investing activities used $146.3 million in 2009, inclusive of $80.1 million invested in short- term investments. the balance of investing activities was dominated by final construction related expenditures at Manantial Espejo of $13.5 million and $19.0 million spent to complete the expansion at San Vicente. Sustaining investments in property, plant, and equipment were made at Morococha, Huaron, and La Colorada where $8.1 million, $7.0 million and $3.1 million were spent, respectively. In addition, $12.4 million was paid as refundable VAt tax in Argentina and Bolivia.
Financing activities in 2010 generated $2.6 million, whereas financing activities in 2009 generated $104.1 million. Cash generated from financing activities in 2010 was a result of $11.9 million in proceeds from the exercising of warrants and options which was offset by $8.0 million in dividend payments to our shareholders.
In 2009, the $104.1 million in cash generated from financing activities consisted primarily of proceeds from the public offering of 6.37 million common shares in February 2009 at a price of $16.25 per share, for proceeds of $98.3 million, net of underwriting fees and issue expenses, along with contributions from minority shareholders in the San Vicente project of $1.6

PAN AMERICAN SILVER CORP. | ANNUAL REPORt 201040
million. In addition, proceeds from short term concentrate advances provided $4.1 million.
statement oF operations: Q4 2010
net income in the fourth quarter of 2010 (Q4 2010) was $46.4 million or $0.43 per share compared to $27.8 million or $0.31 per share for the comparable period in 2009. the 67% increase in net income was a result of significantly better operating results mainly attributable to higher metal prices and partially offset by lower quantities sold of all metals, with the exception of lead. Silver, gold, zinc and copper quantities sold in 2010 declined by 6%, 26%, 19% and 24% respectively, while lead quantities sold increased by 8% in comparison to 2009.
Earnings before taxes for the period were negatively impacted by higher general and administration costs due to the timing of the Company’s annual incentive plan and severance payments and a non-cash $1.5 million write-down of pyrite stockpile inventories that were being sold to the La Oroya smelter, which remains closed. Net income in Q4 2010 benefited from $1.9 million in foreign exchange gain resulting primarily from the revaluation of the long-term future income tax liability denominated in Argentine pesos and an insurance claim related to theft of doré at La Colorada for $1.7 million.
Earnings for the fourth quarter of 2009 (Q4 2009) were negatively impacted by: (i) a non-cash fair value charge of $2.2 million for a delay in recovery of the long-term VAt receivable in Argentina; (ii) a donation of $2.3 million to the University of British Columbia for the construction of an earth science building; and (iii) $4.6 million in exploration activities, mainly at La Preciosa.
sales during Q4 2010 were a record $191.1 million, a significant increase from the $154.4 million of sales in the same period last year. this 24% increase in sales was driven primarily by higher realized prices for all metals partially offset by lower quantities sold of all metals, except lead as described above.
mine operating earnings rose to $91.2 million in Q4 2010 from $57.3 million in the same quarter last year. this increase was attributable to increased sales in Q4 2010, as described above, and due to a reduction in depreciation charges, which outweighed the increase in cost of sales.
Cost of sales for Q4 2010 of $78.8 million was an increase of 8% from $72.7 million in the comparable period last year.
Depreciation and amortization charges for Q4 2010 decreased to $21.1 million from $24.4 million in Q4 2009. the reduction in depreciation was mainly a result of lower quantities of metals sold compared to the same period in 2009.
income tax provision during Q4 2010 amounted to $43.2 million compared to $15.2 million in Q4 2009. the income tax expense resulted primarily from: (i) increased taxable income generated in all the jurisdictions the Company operates in; (ii) reduction of tax assets in Bolivia; and (iii) withholding taxes on both technical services and interest paid from our foreign subsidiaries to Pan American Silver Corp.
CasH FLoW: Q4 2010
operating activities in Q4 2010 generated a record cash flow of $83.6 million, a 60% increase from the $52.1 million generated in Q4 2009. this operating cash flow record in Q4 2010 was mainly attributable to the significantly higher metal prices.
Cash flow generated from operating activities in Q4 of 2009 was $52.1 million compared to cash used in operating activities of $4.9 million in the comparable quarter of 2008. Operating cash flow in Q4 of 2009 was positively impacted by significantly higher metal prices and by operating cash flow from Manantial Espejo and San Vicente, both of which were in their first year of operation.
Cash flow from investing activities used $69.0 million in Q4 2010. this consisted primarily of $41.6 million in short term investments, $5.7 million spending on the Navidad project and an aggregate $29.6 million in sustaining capital investments at Morococha, La Colorada, San Vicente and Manantial Espejo.
Investing activities in Q4 of 2009 used $17.9 million, including the investment of $6.3 million in short-term investments. Aggregate sustaining capital expenditures of $7.6 million were spent during the quarter at all operations and an additional $1.9 million was paid as refundable VAt in Argentina and Bolivia. the Company also spent approximately $3.3 million on costs associated with closing the Aquiline transaction in the quarter.
Financing activities in Q4 2010 generated $10.2 million and consisted primarily of $8.7 million from the exercising of warrants and options offset by $2.7 million in dividend payment to our shareholders. In Q4 of 2009, cash generated by financing activities totalled $1.0 million and was comprised of advances against concentrate shipments.
LiQUiDitY positionthe Company’s cash balance at December 31, 2010 was $179.9 million, which was an increase of $79.4 million from the balance at December 31, 2009. the balance of the Company’s short-term investments at December 31, 2010 was $180.6 million, an increase of $88.0 million from a year ago. this increase in liquidity in 2010 resulted primarily from cash generated by operating activities of $242.3 million in addition to $11.9 million in proceeds from the exercising of warrants and options, partially offset by capital expenditures on property, plant and equipment of $87.3 million which includes $3.9 million in refundable VAt payments. the Company does not own any asset-backed commercial paper in its investment portfolio.
Working capital at December 31, 2010 was $433.8 million, an increase of $161.5 million from the prior year-end’s working capital of $272.3 million. the increase in working capital was mainly due to a $167.4 million increase in cash and short-term investments, plus an increase in inventory of $13.4 million, in addition to a decrease in accounts payable and other current liabilities of $14.9 million. these were partially offset by an increase in the current income tax liability of $30.0 million and a decrease in income taxes receivable of $12.0 million. the increase in income tax liability is primarily a result of the higher current taxable income generated in 2010. the increase in inventory is mainly attributable to an increase in both silver doré

MANAgEMENt'S DISCUSSION AND ANALYSIS 41
CapitaL resoUrCesShareholders’ equity at December 31, 2010 had a balance of $1,520.3 million (2009: $1,343.8 million). the Company issued 2.7 million shares during the year, 1.7 million of which were related to the Aquiline transaction which increased Shareholders’ equity by $43.5 million. Shareholders’ equity further increased by the net income for the period of $112.6 million and by the issuance of warrants in connection with the Aquiline acquisition, which resulted in a $4.0 million increase in contributed surplus.
the following table sets out the common shares, warrants and options outstanding as at December 31, 2010:
oUtstanDing as at DeCemBer 31, 2010 (in thousands)
Common shares 107,791
Warrants 7,955
Options 1,448
totaL 117,194
As at December 31, 2010, the Company had approximately 107.8 million common shares outstanding for a share capital of $1,272.9 million. the basic weighted average number of common shares outstanding was 107.6 million shares for the year and 108.0 million shares for the quarter ended December 31, 2010.
As of March 22, 2011, the total number of shares outstanding was 107,822,826.
Expiry dates on the warrants range from October 2011 to December 2014, and exercise prices range from CAD $10.02 to CAD $35.00. All outstanding warrants are exercisable at an average weighted exercise price of CAD $34.67 and the weighted average remaining life of the warrants was 47 months.
As at December 31, 2010, the Company had approximately 1.4 million stock options outstanding, with exercise prices in the range of $17.73 and $48.10. All vested stock options were exercisable at an average weighted exercise price of $41.53 per share and a weighted average life of 30 months.
FinanCiaL instrUmentsFrom time to time, Pan American mitigates the price risk associated with its base metal production by committing some of its forecasted production under forward sales or option contracts. At December 31, 2010, the Company had no outstanding base metal positions. During the first quarter of 2011, the Company entered into zinc option contracts for 10,725 tonnes, which have the effect of ensuring a price between $2,083 and $3,067 per tonne on that quantity of zinc, settling monthly during 2011. For the same period, the Company also entered into lead option contracts for 2,750 tonnes, which have the effect of ensuring a price between $2,050 and $3,300 per tonne on that quantity of lead, settling monthly during 2011. At the date of this MD&A, the positions had a negative mark-to-market valuation of approximately $0.1 million.
inventory due to timing of shipments and material and supplies inventory at Manantial Espejo.
On October 10, 2008, Pan American entered into a $70 million revolving credit facility (“the Facility”) with Scotia Capital and Standard Bank Plc (“the Lenders”). the purpose of the Facility is for general corporate purposes, including acquisitions. the Facility, which is principally secured by a pledge of Pan American’s equity interests in its material subsidiaries, had a term of four years. On December 20, 2010 the Company renewed the Facility and extended the term to December 2014 and increased the amount of the Facility to $150 million by expanding the number of Lenders to include West LB, CIBC and BMO. the interest margin on the renewed Facility ranges from 3.00% to 4.00% over LIBOR, based on the Company’s net debt to EBItDA ratio. Pan American has agreed to pay a commitment fee of between 0.90% and 1.20% on undrawn amounts under the Facility, depending on the Company’s net debt to EBItDA ratio. to the date of this MD&A, the Company has not made any drawings under the Facility.
Alternatives for financing the Company’s future capital needs include our significant liquidity position, future operating cash flow, unutilized credit facility and the proceeds of exercised share options. In the opinion of management, based on the Company’s current liquidity position and the operating cash flows that are expected in 2011, the Company’s liquid assets will be sufficient to discharge liabilities as they come due and to fund planned project development and sustaining capital expenditures in 2011. Please refer to the “2011 Operating Outlook” section of this MD&A for a more detailed description of the sustaining capital expenditures planned for each mine in 2011.
the impact of inflation on the Company’s financial position, operational performance, or cash flows over the next twelve months cannot be determined with any degree of certainty.
inVestments anD inVestment inComePan American’s investment objectives for its cash balances are to preserve capital, to provide liquidity and to maximize return. the Company’s strategy to achieve these objectives is to invest excess cash balances in a portfolio of primarily fixed income instruments. Market conditions are reviewed constantly and value is added through interest rate anticipation, sector allocation, and security specific valuation. Custody of securities and cash balances, as well as trading activities may be delegated to various financial institutions.
Investment income for 2010 totalled $1.0 million and was primarily made up of interest generated by the Company’s short-term investment portfolio. In comparison, 2009’s investment income of $6.8 million resulted mainly from a gain from the short-term investment in Aquiline when we acquired that Company.

PAN AMERICAN SILVER CORP. | ANNUAL REPORt 201042
Approximately 65% of the Company’s operating and capital expenditures are denominated in local currencies other than the U.S. dollar. these expenditures are exposed to fluctuations in U.S. dollar exchange rates relative to the local currencies. From time to time, the Company mitigates part of this currency exposure by accumulating local currencies or by entering into contracts designed to fix or limit the Company’s exposure to changes in the value of local currencies relative to US dollars. At December 31, 2010 and at the date of this MD&A, the Company had no outstanding foreign currency contracts.
the Company recorded a loss on commodity and currency contracts of $0.2 million in 2010, compared to a gain of $1.9 million in 2009.
asset retirement oBLigationsthe estimated future reclamation and remediation costs are based principally on legal and regulatory requirements. the asset retirement obligation is measured using management’s assumptions and estimates for cash outflows. the Company accrues these costs initially at their fair value, which are determined by discounting costs using the credit adjusted risk-
free interest rate. Upon recognition of a liability for an asset retirement obligation, the Company capitalizes these costs to the related mine and amortizes it over the life of each mine on a unit-of-production basis. Changes due to the passage of time are recognized as an increase in the liability and an accretion expense.
the total undiscounted amount of estimated cash flows required to settle the Company’s asset retirement obligations is $72.1 million (2009 - $67.1 million) which has been discounted using discount rates between 3% and 19%. Reclamation obligations at the Quiruvilca mine of $17.6 million are expected to be paid starting in two to five years while the remainder of the obligations are expected to be paid through 2028. Revisions made to the reclamation obligations in 2010 were primarily a result of increased site disturbance and from the ordinary course of operations at the mines. Reclamation obligations will be funded from operating cash flows, reclamation deposits and cash on hand.
Accretion charged to 2010 earnings was $2.9 million compared to $3.0 million in 2009. Reclamation expenditures during the current year were similar to the previous year at $1.0 million.
ContraCtUaL Commitments anD ContingenCiesthe Company does not have any off-balance sheet arrangements or commitments that have a current or future effect on its financial condition, changes in financial condition, revenues or expenses, results of operations, liquidity, capital expenditures or capital resources, that are material, other than those disclosed in this MD&A and the Audited Consolidated Financial Statements and the related notes.
An outstanding convertible debenture with a fair value of $20.8 million was issued as part of the Aquiline transaction and could be converted into either (i) 363,854 common shares at a conversion price of CAD $48.10 per common share; or (ii) a contract granting the holder the right to purchase 12.5% of the life of the mine payable silver from the Loma de La Plata deposit of the Navidad property. the holder was required to make this election on February 28, 2010 and elected alternative (ii) above. the final contract for this alternative is being negotiated and pending the final resolution to this alternative, the Company continues to classify the fair value calculated at the acquisition of this alternative as a liability.
the Company had the following contractual obligations at the end of 2010:
paYments DUe BY perioD (in thousands of dollars)
2010 totaLLess tHan
1 Year1 – 3
Years4 – 5
YearsaFter
5 Years
Capital Lease Obligations $ 158 $ 118 $ 40 – –
Current Liabilities 113,180 113,180 – – –
Contribution Plan1 4,902 2,451 2,451 – –
total contractual obligations2 $ 118,240 $ 115,749 $ 2,491 – –
1 In June 2008 the Company initiated a 4 year contractual retention plan for key officers and management, further discussed in Note 13 in the Consolidated Financial Statements. Contract commitments for the plan, payable in CAD, represent minimum payments expected to be paid out, presented above in USD at the year-end rate.
2 Amounts above do not include payments related to the Company’s anticipated asset retirement obligation (Note 11 in the Consolidated Financial Statements).

MANAgEMENt'S DISCUSSION AND ANALYSIS 43
generaL anD aDministratiVe general and administrative costs, including stock based compensation, increased by 34% in 2010 to $17.1 million (2009: $12.8 million). this anticipated increase was primarily as a result of: (i) the timing of the Company’s annual incentive plan; (ii) the addition of several new positions in 2010; (iii) various expenses related to the integration of Aquiline, including increased travel; and (iv) a stronger CAD exchange rate against the USD (CAD to USD exchange of 1.03 average in 2010 versus 1.14 average in 2009).
Our general and administrative costs, including stock based compensation, are expected to remain similar to our 2010 level at approximately $17.0 million.
the following table compares our general and administrative forecast for 2011 against the general and administrative costs incurred over the previous three years, on a per ounce of silver produced basis.
aCtUaL ForeCast
2008 2009 2010 2011
general and administrative costs(in ‘000 of US Dollars) $ 10,435 $ 12,769 $ 17,109 $ 16,987
Silver production (in ‘000s of ounces) 18,673 23,044 24,286 23,500
general and administrative costs per silver ounce produced $ 0.55 $ 0.55 $ 0.70 $ 0.72
expLoration anD projeCt DeVeLopmentExploration and project development expenses in 2010 were $24.5 million compared to $9.9 million incurred in 2009. the expenses recorded in 2010 primarily represented the exploration and project development expenses incurred for the advancement of the Navidad and La Preciosa projects.
During 2010, Pan American invested a total of $37.5 million in the Navidad silver development project of which $9.5 million was expensed. Activities were focused on diamond drilling to further define and raise confidence in the resources of the eight deposits that comprise the project, conducting preliminary engineering design work, and advancing an Environmental Impact Assessment (“EIA”). the Company also launched a comprehensive community and government relations program, to improve the public’s understanding of mining activity and to initiate an open dialogue for the amendment of the current mining law, which bans open pit mining in the province of Chubut where Navidad is located.
On November 30, 2010, the Company released the results of Navidad’s preliminary assessment, which defined a highly economic project that would involve developing and mining eight separate deposits through conventional surface mining methods. It is estimated that Navidad could produce an annual average of 19.8 million ounces of silver over the first 5 years of operation, have a mine life in excess of 17 years and generate an after-tax return of $1.2 billion at a 5% discount rate (assuming a $25 per ounce silver price). the construction of a 15,000 tonnes-per-day operation would require approximately $760 million in pre-production costs, excluding $133 million in recoverable VAt. the project would provide direct employment to approximately 1,500 individuals during the construction phase and up to 500 individuals during the operations phase. the preliminary assessment was subsequently filed with the applicable regulatory authorities on January 14, 2011 and is available on SEDAR at www.sedar.com.
During 2010 Pan American was also very active at the La Preciosa joint-venture, where the Company invested a total of $10 million in exploration and delineation drilling, metallurgical testing and engineering activities. the Company is currently completing additional work to evaluate alternative extraction and development scenarios to maximize the project’s economics, in view of the improved metals price environment.
the Company’s “brownfields” exploration program will continue to be very active in 2011 with approximately 108.0 km of drilling planned. the cost of these programs is included as part of each mine’s capital budget or included in its operating costs. the total amount expected to be spent on brownfield drilling in 2011 is approximately $10.9 million. the main objective of this program is to replace reserves and resources mined at our sites. the main targets for these resource and reserve replacements are the Candelaria oxide and sulphide zones at La Colorada, the Litoral extension at San Vicente, the Maria, Marta and Melissa veins at Manantial Espejo and multiple vein structures at Morococha and Huaron.

PAN AMERICAN SILVER CORP. | ANNUAL REPORt 201044
non-gaap measUresCasH anD totaL Costs per oUnCe oF siLVer
the non-gAAP measures of cash and total cost per ounce of silver are used by the Company to manage and evaluate operating performance at each of the Company’s mines and are widely reported in the silver mining industry as benchmarks for performance, but do not have standardized meaning. to facilitate a better understanding of these measures as calculated by the Company, we have provided a detailed reconciliation of these measures to our cost of sales, as reported in our audited Consolidated Statement of Operations for 2010, 2009 and 2008.
CasH anD totaL Cost per oUnCe reConCiLiation (in thousands of US dollars)
2010 2009 2008
Cost of sales $ 305,696 $ 245,637 $ 199,032
Add / (Subtract)
Smelting, refining, & transportation charges 66,441 64,118 58,378
By-product credits (253,925) (215,657) (160,276)
Mining royalties 21,300 11,867 4,843
Worker’s participation and voluntary payments (6,230) (1,151) (1,700)
Change in inventories 5,977 15,068 1,419
Other (5,092) 3,368 3,980
Non-controlling interest adjustment (2,114) (2,144) (1,043)
Cash operating Costs a 132,055 121,106 104,633
Add / (Subtract)
Depreciation & amortization 86,483 83,169 46,349
Accretion of asset retirement obligation 2,929 2,998 2,687
Change in inventories 1,212 3,388 839
Other (755) (271) (232)
Non-controlling interest adjustment (1,108) (867) (605)
total Costs B $ 220,816 $ 209,523 $ 153,671
payable silver production (000’s ounces) C 23,224 21,888 17,543
Cash Costs per ounce a/C $ 5.69 $ 5.53 $ 5.96
total Costs per ounce B/C $ 9.51 $ 9.57 $ 8.76

MANAgEMENt'S DISCUSSION AND ANALYSIS 45
goVernanCe anD Corporate soCiaL responsiBiLitYis not discharged from the plant to the environment, thereby minimizing fresh water usage. Fresh water is still needed, however, to make up for evaporation and exfiltration and for water retained in the product and tailings. All of our operations have strict and extensive water monitoring programs to ensure that water discharges comply with the local environmental laws and industry standards.
energY
We are aware of the challenges and risks associated with climate change and are committed to reducing our greenhouse gas (“gHg”) emissions through improvements in energy efficiency and the use of renewable energy. the main source of the Company’s gHg is through direct consumption of diesel fuel, gasoline, LPg (Liquefied Petroleum gas) and natural gas. gHg emissions from indirect consumption are related mainly to electricity supplied by national grids.
the majority of Pan American Silver’s mines have been successful in maintaining a relatively low gHg emission rate. this is because the energy that they use to run the mines and processing plants is from their respective national electrical grids. Energy derived from national grids is classified as Indirect Energy Consumption, which produces much less gHg emissions than Direct Energy Consumption, which is generally derived from fossil fuels.
We recognize that improved energy efficiency holds the greatest promise for significantly reducing our gHg emissions. While conservation efforts to date have been limited, we have begun to take a more serious look at opportunities to improve our performance, including creating an energy taskforce to explore possible renewable energy technologies and to reduce the overall energy consumption at our mines. In addition, in areas where the climatic conditions are favourable for the economic use of solar energy, the taskforce is reviewing the use of a photovoltaic system to generate electricity for part of the crushing and the refining process.
We are also doing our best to remind employees that individual efforts to conserve energy can make a big difference. All of our mines run educational campaigns to create awareness and encourage the reduction of energy consumption. these campaigns are focused on our workers and extend to the community through events such as the Earth Day Celebrations. Ongoing reforestation and restoration projects at most of our facilities are also playing a role in mitigating gHg emissions.
oUr CommUnities
Pan American Silver is committed to creating sustainable value in the communities where we operate. We maintain offices with knowledgeable staff in each of these communities to make it easy for residents to ask questions and find out more about our operations. A strong local presence also ensures that we are better able to understand community issues and priorities. the community programs in which we participate are born out of the research conducted by our local offices and typically centre on education, health, environment, infrastructure and alternative economic activities.
Pan American Silver adheres to the highest standards of corporate governance and closely follows the requirements established by both the Canadian Securities Administrators and the SEC (Securities and Exchange Commission) in the United States. We believe that our current corporate governance systems not only meet but exceed these requirements.
Our Board of Directors oversees the direction and strategy of the business and the affairs of the company. the Board is comprised of a non-executive chairman and eight other directors, six of whom are independent and are represented by a lead director. the Board’s wealth of experience allows it to effectively oversee the development of corporate strategies, provide management with long-term direction, consider and approve major decisions, oversee the business generally and evaluate corporate performance. the Health, Safety and Environment Committee, which is a sub committee appointed by the Board of Directors, provides oversight for the corporate social initiatives of the Company and reports directly to the Board.
We believe that good corporate governance is important to the effective performance of the Company and plays a significant role in protecting the interests of all stakeholders while helping to maximize value.
Waste
Pan American has intensified efforts to reduce the amount of waste generated by our operations with the ongoing improvement of waste management and disposal programs. Site wastes include oils, scrap steel, tires and construction wastes as well as those produced by our office, cafeteria and camp operations. In addition to investigating and applying alternative procedures and technologies to reduce waste where warranted, we are also working with local companies to increase the amount of waste that is reclaimed and reused. We produce about five thousand metric tonnes of total waste from our operations annually and we expect to reduce this number significantly by implementing a number of initiatives.
Cyanide is used for leaching silver at Manantial Espejo, in Argentina, and both of our operations in Mexico, Alamo Dorado and La Colorada. the water and tailings from this process are carefully managed so that the cyanide does not cause any negative impact to the environment. In order to ensure that the cyanide is handled correctly and that it is properly disposed of, the mine employees go through rigorous training provided by the International Institute of Cyanide (IIC).
Water
Pan American recognizes that water is a finite resource, essential to the sustaining of life and a healthy environment. the Company is therefore committed to ensuring that sources of water are not negatively impacted by our operations. to achieve this we use water efficiently, including recycling as much as possible; maintain natural water courses as much as possible; and ensure that our discharges comply with or exceed regulated requirements.
At present, four of our seven mineral processing plants operate as closed circuits in which the water that is used in processing

PAN AMERICAN SILVER CORP. | ANNUAL REPORt 201046
risKs anD UnCertaintiesmetaL priCe risK
Pan American derives its revenue from the sale of silver, zinc, lead, copper, and gold. the Company’s sales are directly dependent on metal prices that have shown extreme volatility and are beyond the Company’s control. the table below illustrates the effect of changes in silver and gold prices on anticipated sales for 2011. this analysis assumes that quantities of silver and gold produced and sold remain constant under all price scenarios presented.
expeCteD 2011 saLes (000’s UsD)
gold price
siL
Ve
r p
riC
e
$ 1,200 $ 1,320 $ 1,400 $ 1,450 $ 1,500
$ 14.00 $ 473,388 $ 481,589 $ 487,056 $ 490,473 $ 493,890
$ 18.00 $ 561,256 $ 569,456 $ 574,924 $ 578,341 $ 581,758
$ 22.00 $ 649,115 $ 657,316 $ 662,783 $ 666,200 $ 669,617
$ 26.00 $ 736,967 $ 745,167 $ 750,634 $ 754,051 $ 757,468
$ 30.00 $ 824,855 $ 833,055 $ 838,522 $ 841,939 $ 845,356
$ 34.00 $ 912,743 $ 920,943 $ 926,410 $ 929,827 $ 933,244
Consistent with the Company’s mission to provide equity investors with exposure to changes in silver prices, our policy is not to hedge the price of silver.
From time to time, Pan American mitigates the price risk associated with its base metal production by committing some of its forecasted base metal production under forward sales and option contracts, as described under the “Financial Instruments” section of this MD&A. the Board of Directors continually assesses the Company’s strategy towards its base metal exposure, depending on market conditions.
Since base metal and gold sales are treated as a by-product credit for purposes of calculating cash costs per ounce of silver, this non-gAAP measure is highly sensitive to base metal and gold prices. the table below illustrates this point by plotting the expected cash cost per ounce according to the 2011 forecast against various price assumptions for the Company’s two main by-product credits, zinc and gold.
CasH Cost per oUnCe oF siLVer proDUCeD (UsD/oZ)
gold price
Zin
C p
riC
e
$ 1,200 $ 1,320 $ 1,400 $ 1,450 $ 1,500
$ 1,400 $ 8.35 $ 7.99 $ 7.75 $ 7.59 $ 7.44
$ 1,800 $ 7.85 $ 7.48 $ 7.24 $ 7.09 $ 6.93
$ 2,200 $ 7.40 $ 7.04 $ 6.79 $ 6.64 $ 6.49
$ 2,600 $ 6.96 $ 6.59 $ 6.35 $ 6.20 $ 6.04
the Company has long-term contracts to sell the zinc, lead and copper concentrates produced by the Quiruvilca, Huaron, Morococha, San Vicente and La Colorada mines. these contracts include provisions for pricing the contained metals, including silver, based on average spot prices over defined 30-day periods that may differ from the month in which the concentrate was produced. Under these circumstances, the Company may, from time to time, fix the price for a portion of the payable metal content during the month that the concentrates are produced.

MANAgEMENt'S DISCUSSION AND ANALYSIS 47
CreDit risK
the zinc, lead and copper concentrates produced by Pan American are sold through long-term supply arrangements to metal traders or integrated mining and smelting companies. the terms of the concentrate contracts may require the Company to deliver concentrate that has a value greater than the payment received at the time of delivery, thereby introducing the Company to credit risk of the buyers of our concentrates. Should any of these counterparties not honour supply arrangements, or should any of them become insolvent, Pan American may incur losses for products already shipped and be forced to sell its concentrates in the spot market or it may not have a market for its concentrates and therefore its future operating results may be materially adversely impacted.
For example, the DRP smelter, a significant buyer of Pan American’s production in Peru, experienced financial difficulties in the first quarter of 2009 and closed. Pan American continued to sell copper concentrates to other buyers but on inferior terms. At the end of 2010 and at the date of this MD&A, the DRP smelter remains closed and Pan American is owed approximately $8.8 million under the terms of its contract with DRP for deliveries of concentrates that occurred in early 2009. the Company has established a doubtful accounts receivable provision for the full amount receivable from DRP. In addition, during the fourth quarter of 2010, the Company wrote down $1.5 million of costs of certain pyrite stockpile inventories that were being sold to the La Oroya smelter after assessing that no other economically viable alternatives to realize upon these inventories could be found. the Company continues to pursue all legal and commercial avenues to collect the amount outstanding.
At December 31, 2010 the Company had receivable balances associated with buyers of our concentrates of $51.0 million (2009 - $54.0 million). Approximately 89% of this receivable balance
is owed by six well known concentrate buyers and the vast majority of our concentrate is sold to those same counterparts.
Silver doré production is refined under long term agreements with fixed refining terms at three refineries worldwide. the Company generally retains the risk and title to the precious metals throughout the process of refining and therefore is exposed to the risk that the refineries will not be able to perform in accordance with the refining contract and that the Company may not be able to fully recover our precious metals in such circumstances. At December 31, 2010 the Company had approximately $50.4 million of value contained in precious metal inventory at refineries. the Company maintains insurance coverage against the loss of precious metal doré and base metal concentrates at our mine sites, in-transit to refineries and while at the refineries and smelters.
Refined silver and gold is sold in the spot market to various bullion traders and banks. Credit risk may arise from these activities if we are not paid for metal at the time it is delivered, as required by spot sale contracts.
the Company maintains trading facilities with several banks and bullion dealers for the purposes of transacting the Company’s trading activities. None of these facilities are subject to margin arrangements. the Company’s trading activities can expose us to the credit risk of our counterparties to the extent that our trading positions have a positive mark-to-market value.
Management constantly monitors and assesses the credit risk resulting from its concentrate sales, refining arrangements and commodity contracts. Furthermore, management carefully considers credit risk when allocating prospective sales and refining business to counterparties. In making allocation decisions, management attempts to avoid unacceptable concentration of credit risk to any single counterparty.
exCHange rate risK
Pan American reports its financial statements in USD; however the Company operates in jurisdictions that utilize other currencies. As a consequence, the financial results of the Company’s operations, as reported in USD, are subject to changes in the value of the USD relative to local currencies. Since the Company’s sales are denominated in USD and a portion of the Company’s operating costs and capital spending are in local currencies, the Company is negatively impacted by strengthening local currencies relative to the USD and positively impacted by the inverse. the local currencies that we have the most exposure to are the Peruvian soles (PEN), Mexican pesos (MXN) and Argentine pesos (ARS). the following table illustrates the effect of changes in the exchange rate of PEN and MXN against the USD on anticipated cost of sales for 2011, expressed in percentage terms:
mxn/UsD
10.50 11.50 12.50 13.50 14.50
pe
n/U
sD
2.40 107% 105% 104% 102% 101%
2.60 105% 103% 102% 100% 99%
2.80 103% 102% 100% 99% 98%
3.00 102% 100% 99% 97% 96%
3.20 101% 99% 97% 96% 95%

PAN AMERICAN SILVER CORP. | ANNUAL REPORt 201048
Under this analysis, our cost of sales is reflected at 100% at our forecasted foreign exchange assumptions for the PEN and MXN of 2.80 and 12.50 per one USD, respectively. Devaluation of the USD relative to the PEN and MXN has the effect of increasing our anticipated cost of sales above 100%, and vice versa.
In order to mitigate this exposure, the Company maintains a portion of its cash balances in PEN, MXN and Canadian dollars and, from time to time, enters into forward currency positions to match anticipated spending. At December 31, 2010, the Company did not have any open currency forward positions, but was holding approximately 32% of its cash balances in currencies other than USD.
the Company’s balance sheet contains various monetary assets and liabilities, some of which are denominated in foreign currencies. Accounting convention dictates that these balances are fair valued at the end of each period, with resulting adjustments being reflected as foreign exchange gains or losses on the Company’s statement of operations. More specifically, under Canadian gAAP, the purchase price accounting related to the Aquiline acquisition required the Company to establish a future income tax liability of $276.3 million to reflect the difference between the tax values and the accounting book values of the assets purchased. As this balance is deemed to be a monetary liability, denominated primarily in ARS, the Company is required to mark-to-market this liability for any movements in the exchange rate of that currency against the USD. Under Canadian gAAP, this requirement introduces large foreign exchange gains and losses to the Company’s earnings in the future. gains are recognized to the extent the Argentine peso weakens relative to the USD and vice versa creates losses. In 2010, the Company recognized a $10.8 million gain on this future income tax liability. Under International Financial Reporting Standards, the preliminary purchase accounting related to the Aquiline acquisition will differ from the above described Canadian gAAP treatment. Please refer to the below section ‘Future Accounting Changes’ for further details.
LiQUiDitY risK
Liquidity risk is the risk that the Company will not be able to meet its financial obligations as they come due. the volatility of the metals markets can impact the Company’s ability to forecast cash flow from operations.
the Company must maintain sufficient liquidity to meet its short-term business requirements, taking into account its anticipated cash flows from operations, its holdings of cash and cash equivalents and committed loan facilities.
the Company manages its liquidity risk by continuously monitoring forecasted and actual cash flows. the Company has in place a rigorous reporting, planning and budgeting process to help determine the funds required to support its normal operating requirements on an ongoing basis and its expansion plans. the Company continually evaluates and reviews capital and operating expenditures in order to identify, decrease and limit all non-essential expenditures. Pan American expects to generate positive free cash flow from operations in 2011 and to further strengthen its liquidity position.
poLitiCaL anD CoUntrY risK
Pan American currently conducts operations in Peru, Mexico, Argentina and Bolivia. All of these jurisdictions are potentially subject to a number of political and economic risks. the Company is unable to determine the impact of these risks on its future financial position or results of operations and the Company’s exploration, development and production activities may be substantially affected by factors outside of Pan American’s control. these potential factors include, but are not limited to: royalty and tax increases or claims by governmental bodies, expropriation or nationalization, foreign exchange controls, import and export regulations, cancellation or renegotiation of contracts and environmental and permitting regulations. the Company currently has no political risk insurance coverage against these risks.
enVironmentaL anD HeaLtH anD saFetY risKs
Pan American’s activities are subject to extensive laws and regulations governing environmental protection and employee health and safety. Environmental laws and regulations are complex and have tended to become more stringent over time. Pan American is required to obtain governmental permits and in some instances provide bonding requirements under federal, state, or provincial air, water quality, and mine reclamation rules and permits. Although Pan American makes provisions for reclamation costs, it cannot be assured that these provisions will be adequate to discharge its future obligations for these costs.
Failure to comply with applicable environmental and health and safety laws may result in injunctions, damages, suspension or revocation of permits and imposition of penalties. While the health and safety of our people and responsible environmental stewardship are our top priorities, there can be no assurance that Pan American has been or will be at all times in complete compliance with such laws, regulations and permits, or that the costs of complying with current and future environmental and health and safety laws and permits will not materially and adversely affect Pan American’s business, results of operations or financial condition.
empLoYee reLations
Pan American’s business depends on good relations with its employees. At December 31, 2010 the Company had approximately 7,068 employees and employees of mining contractors, of which approximately 2,117 were represented by unions in Peru, 614 by a union in Argentina and a further 306 by a union in Bolivia. the Mexican mines do not have a union. the Company has experienced short-duration labour strikes and work stoppages in the past and may experience future labour related events.
the number of persons skilled in acquisition, exploration and development of mining properties is limited and competition for such persons is intense. As Pan American’s business activity grows, Pan American will require additional key mining personnel as well as additional financial and administrative staff. there can be no assurance that Pan American will be successful in attracting, training and retaining qualified personnel as competition for persons with these skill sets increases. If Pan American is not successful in this regard, the efficiency of its operations could be impaired, which could have an adverse

MANAgEMENt'S DISCUSSION AND ANALYSIS 49
impact on Pan American’s future cash flows, earnings, results of operations and financial condition.
CLaims anD LegaL proCeeDings
Pan American is subject to various claims and legal proceedings covering a wide range of matters that arise in the ordinary course of business activities, including claims relating to ex-employees. Each of these matters is subject to various uncertainties and it is possible that some of these matters may be resolved unfavourably to Pan American. the Company carries liability insurance coverage and establishes provisions for matters that are probable and can be reasonably estimated. In addition, Pan American may be involved in disputes with other parties in the future which may result in a material adverse impact on our financial condition, cash flow and results of operations. Please refer to Note 17 “Commitments and Contingencies” of the Audited Consolidated Financial Statements for further information.
Corporate DeVeLopment aCtiVities
An element of the Company’s business strategy is to make selected acquisitions. the Company expects to continue to evaluate acquisition opportunities on a regular basis and intends to pursue those opportunities that it believes are in its long-term best interests. the success of the Company’s acquisitions will depend upon the Company’s ability to effectively manage the operations of entities it acquires and to realize other anticipated benefits. the process of managing acquired businesses may involve unforeseen difficulties and may require a disproportionate amount of management resources. there can be no assurance that the Company will be able to successfully manage the operations of businesses it acquires or that the anticipated benefits of its acquisitions will be realized.
CritiCaL aCCoUnting poLiCies anD estimatesthe preparation of financial statements in conformity with Canadian gAAP requires management to make estimates and assumptions that affect the reported amount of assets and liabilities and disclosure of contingent liabilities at the date of the financial statements, and the reported amounts of sales and expenditures during the reporting period. Management has identified: (i) Mineral property, plant, and equipment, Construction in progress and Investments in non-producing property; (ii) Future income tax provision; (iii) Provision for reclamation and closure; (iv) Stock based compensation; and (v) accounting for derivative instruments as the critical estimates for the following discussion. the Company did not make significant changes to its accounting policies in 2010. Please refer to Note 2 of the Company’s consolidated financial statements for a description of all of the significant accounting policies.
mineral property, plant and equipment, Construction in progress, and investment in non-producing properties are the most significant assets of the Company, representing assets in aggregate of $1.5 billion at December 31, 2010. this amount represents the capitalized expenditures related to the acquisition, exploration, construction and development of mineral deposits. Construction costs on development projects are capitalized until the mine is substantially complete and
ready for production. Mineral exploration costs are expensed as incurred. Capitalization of evaluation expenditures commences when there is a high degree of confidence in the project’s viability and hence it is probable that future economic benefits will flow to the Company. Evaluation expenditures, other than that acquired from the purchase of another mining company, are carried forward as an asset provided that such costs are expected to be recouped in full through successful development and exploration of the area of interest or alternatively, by its sale. Evaluation expenditures include delineation drilling, metallurgical evaluations, and geotechnical evaluations amongst others.
the Company estimates its reserves and resources and the economic life of its mines and utilizes this information to calculate depletion and amortization expense. Annually, or more frequently as circumstances require, Pan American assesses the recoverability of the carrying values of its mining properties and investments by performing impairment evaluations. these evaluations consist of comparing each asset’s carrying value with the estimated undiscounted future net cash flows. Future cash flows are estimated based on production, metal prices, capital and operating costs. Where those estimated cash flows are less than the carrying value, the Company records a write-down of the asset to the estimated fair value.
No impairments were recorded in 2010, based on impairment analyses using a long-term silver price of $16.85 per ounce, which is based on analyst consensus prices. Other estimates incorporated in the impairment evaluations include processing and mining costs, mining tonnage, ore grades and recoveries, which are all subject to uncertainty. If the price environment of silver deteriorates materially for a sustained period of time or some of the other assumptions prove inaccurate, material asset impairment charges may be required in the future.
the future income tax provision is based on the liability method. Future taxes arise from the recognition of the tax consequences of temporary differences by applying substantively enacted tax rates applicable to future years to differences between the financial statement carrying amounts and the tax bases of certain assets and liabilities. the Company records a valuation allowance against any portion of those future income tax assets that it estimates will, more likely than not, fail to be realized. the future income tax provision also incorporates management’s estimates regarding the utilization of tax loss carry forwards, which are dependent on future operating performance and transactions. Please refer to Note 19 of the Company’s consolidated financial statements for further details on our future income tax provision.
reclamation and closure costs have been estimated based on the Company’s interpretation of current regulatory requirements, however, changes in regulatory requirements and new information may result in revisions to the estimates. the Company recognizes the present value of liabilities for reclamation and closure costs in the period in which they are incurred. A corresponding increase to the carrying amount of the related assets is generally recorded and depreciated over the life of the asset. Accordingly, at December 31, 2010 the expected present value of future site restoration costs for the Huaron, Morococha, Quiruvilca, La Colorada, Alamo Dorado, Manantial Espejo and San Vicente mines were estimated using discount rates between approximately 3% and 19% at $69.5 million (2008 - $62.8 million). this estimate was increased in 2010 primarily

PAN AMERICAN SILVER CORP. | ANNUAL REPORt 201050
as a result of accretion of the liability of $2.9 million and the recognition of an additional $4.8 million from a combination of increased site disturbance and from the ordinary course of operations at our mines. the reclamation provision was reduced in 2010 by $1.0 million of closure expenditures.
Pan American estimates expenses related to employee stock-based compensation on the fair value method of accounting. Under this method, Pan American is required to recognize a charge to the income statement based on an option-pricing model for all stock options that were granted and vested in each period, with a corresponding credit to Contributed Surplus under the Shareholders’ Equity section of the balance sheet. In 2010, stock options were awarded in February and December. the fair value of these stock options was calculated using an option-pricing model based on the following assumptions – dividend yield of zero to 0.3 percent, a weighted average volatility of the Company’s share price in the range of 46% to 57%, a weighted average annual risk free rate in the range of 1.5% to 2.0% and an expected lives ranging from 1.5 to 3.0 years. the resulting
weighted average option valuation was in the range of CAD $8.04 to CAD $11.12. the total expense related to the employee stock-based compensation in 2010 was $4.0 million (2009: $2.4 million). the charge to the Company’s income statement is incorporated as part of the general and administrative expenses.
the Company has considered CiCa 3865 – Hedges, which specifies the conditions under which hedge accounting is appropriate and includes requirements for the identification, documentation and designation of hedging relationships, sets standards for determining hedge effectiveness, and establishes criteria for the discontinuance of hedge accounting. Based on CICA 3865, the Company’s conclusion is that its forward contracts for the sale of base metals (lead and zinc), its forward contracts for purchasing PEN and MXN with US dollars, and its silver fixing contracts do not qualify for hedge accounting. As a result, Pan American is required to recognize mark-to-market valuations of its open forward contract positions through its income at the end of each period.
FUtUre aCCoUnting CHangesthe Accounting Standards Board (AcSB) adopted International Financial Reporting Standards (IFRS) as Canadian gAAP for publicly accountable enterprises for fiscal years beginning on or after January 1, 2011. the Company will report its first interim consolidated financial statements in accordance with IFRS for the three months ended March 31, 2011, with comparative figures for the corresponding period for 2010. In addition, the adoption date of January 1, 2011 will require the restatement, for comparative purposes, of amounts reported by the Company for its year ending December 31, 2010, and restatement of the opening balance sheet as at January 1, 2010, the transition date. this is discussed in detail in the following section.
internationaL FinanCiaL reporting stanDarDs
the Company continues to advance through its IFRS transition project plan. the advancement made includes determining key accounting policies, progress in the developing of financial statements including note disclosures, implementing business requirements, continuously addressing internal controls and internal control over financial reporting requirements, implementing and monitoring system needs and preparing the Company’s opening balance sheet under IFRS.
the condensed preliminary consolidated opening IFRS balance sheet as at January 1, 2010 with reconciliations to the previously reported December 31, 2009 audited consolidated balance sheet prepared in accordance with Canadian gAAP is presented below. the preliminary amounts presented below are based on accounting policies the Company expects to apply in preparing its first consolidated IFRS financial statements. the amounts determined for the final consolidated opening IFRS balance sheet as at January 1, 2010 may differ from these preliminary amounts.
the Company’s unaudited condensed preliminary consolidated IFRS balance sheet as at January 1, 2010 is as follows:
as january 1, 2010Canadian
gaap income taxes1Closure &
Decommissioning2 Warrants3 other4 iFrs
Current assets $ 372,455 $ (4,993) $ – $ – $ – 367,462
Non-current assets 1,476,154 (272,461) (836) – – 1,202,857
total assets $ 1,848,609 $ (277,454) $ (836) $ – $ – 1,570, 319
Current liabilities $ 100,180 $ – $ – $ – $ – 100,180
Non-current liabilities 389,383 (271,948) (5,502) 43,919 – 155,852
total liabilities 489,563 (271,948) (5,502) 43,919 – 256,032
Shareholder’s equity 1,343,790 (5,506) 4,666 (43,919) (708) 1,298,323
Non-controlling interest 15,256 – – – 708 15,964
1,359,046 (5,506) 4,666 (43,919) – 1,314,287
total Liabilities & shareholder’s equity 1,848,609 (277,454) $ (836) $ – $ – $ 1,570,319

MANAgEMENt'S DISCUSSION AND ANALYSIS 51
notes to CanaDian gaap to iFrs reConCiLiation(1) income taxes the adjustments to deferred income tax assets and liabilities
reflect the tax effects under IAS 12 Income Taxes:
(a) IAS 12 requires recognition of deferred taxes for differences that arise on translation of non-monetary assets denominated in currencies other than US dollars. the tax bases of these non-monetary items are re-measured from the local currency to the functional currency using current rates and the differences as a result of changes in exchange rates and indexing for the period creates a deferred tax adjustment. Under Canadian gAAP, the historical exchange rates were used. Since the Company has mining properties in Argentina, Peru, Mexico and Bolivia with costs denominated in local currencies, the movement between the US dollar and these local currencies gives rise to changes in deferred tax.
(b) Unlike Canadian gAAP, IAS 12 prohibits the recognition of deferred taxes at the time of an acquisition where the transaction is not a business combination. Accordingly, in its opening balance sheet, the Company has reversed the deferred income tax liabilities recognized on acquisition of the assets of Aquiline, Manantial Espejo and Alamo Dorado.
(c) the deferred tax expense booked on the deferred component of the employee profit-sharing arrangement at some of our sites is different under IFRS. Unlike Canadian gAAP, the deferred component of this employee benefit liability is not recognised under IAS 19 Employee benefits.
(d) IAS 12 permits the presentation of foreign exchange gains or losses from translation of deferred income taxes in income taxes, as compared to presenting these in other income and expense under Canadian gAAP.
(2) Closure and decommissioning Under IAS 37 Provisions, Contingent Liabilities and
Contingent Assets, the closure provision is measured based on the best estimate of expenditure required to settle the obligation at the balance sheet date using current discount rate and inflation assumptions; thus simplifying the calculation by removing the ‘layering’ concept used for Canadian gAAP. In addition, IFRS requires that the liability be re-measured at each reporting date versus the passive requirement in Canadian gAAP to re-measure in the event of changes in the amount or timing of cash flows required to settle the obligation.
(3) share purchase warrants Share purchase warrants that were presented as equity
instruments under Canadian gAAP are reclassified to derivative financial liability under IAS 39 Financial Instruments: Recognition and Measurement. Under IFRS, share purchase warrants with an exercise price denominated in a currency other than the Company's functional currency are classified and accounted for as financial liabilities and, as such, are measured at their fair values with changes in fair values included in net earnings.
(4) other(a) Under IAS 39 Financial Instruments: Recognition and
Measurement, the foreign exchange gains or losses on available for sale monetary securities are recognized in the profit for the period (to retained earnings on transition date), whereas in Canadian gAAP these were booked to other comprehensive income.
(b) the Company made an adjustment to record the changes in non-controlling interests resulting from all the IFRS adjustments and non-controlling interests are presented as part of the equity section under IFRS.
oUtLooK on FUtUre earningsFuture net earnings will be impacted by changes in fair values to the Company’s share purchase warrants, with an exercise price denominated in Canadian dollars. Changes in the fair value of the share purchase warrants is primarily influenced by the Company’s share price, the volatility of the Company’s share price and the Canadian to USD exchange rate. generally, if either the share price or the volatility increase or the Canadian dollar strengthens against the USD, with other factors remaining constant, the fair value of the warrant liability will increase and the Company will record an expense in its future earnings.
Secondly, due to the change in the accounting methodology of recognizing deferred taxes that arise on foreign non-monetary assets, the company expects its foreign exchange gains or losses related to deferred income taxes to be less volatile.
First time aDoption exemptions appLieDIFRS 1 First-time Adoption of International Financial Reporting Standards, in general, requires accounting policies to be applied retrospectively to determine the opening balance sheet at the Company’s transition date of January 1, 2010, unless certain exemptions are applied. the exemptions that the Company has chosen to apply and that are considered to be significant to the Company include:
a. Deemed Cost IFRS 1 provides an option that allows a first-time adopter
to elect to use a previous gAAP revaluation of an item of property, plant and equipment at or before the date of transition to IFRSs as deemed cost at the date of the revaluation, if the revaluation was, at the date of the revaluation, broadly comparable to fair value. the Company had previously revalued the property, plant and equipment assets at Quiruvilca and La Colorada as a result of a Canadian gAAP impairment, and has elected these revalued amounts less subsequent depreciation as the deemed cost at the date of transition to IFRS.
b. Decommissioning Liability IFRS 1 indicates that a first-time adopter may elect not to apply
IFRIC 1 Changes in Existing Decommissioning, Restoration and Similar Liabilities retrospectively. the Company applied this election and accordingly measured the decommissioning liability as at the date of transition to IFRSs in accordance with IAS 37 Provisions, Contingent Liabilities and Contingent Assets and estimated the amounts that would have been included in the cost of the related mining property, plant and equipment and recalculated the accumulated depreciation for those assets at January 1, 2010.

PAN AMERICAN SILVER CORP. | ANNUAL REPORt 201052
c. Business Combination IFRS 1 allows a first-time adopter to avoid application of
IFRS 3R Business Combinations retrospectively to business combinations that occurred before either the date of transition to IFRS or an alternative pre-transition date. the Company applied this exemption to business combinations that occurred prior to January 1, 2010.
d. share-Based payment IFRS 1 gives a first-time adopter the option to not apply IFRS
2 Share-Based Payment to (i) equity instruments that were granted for the periods on or before November 7, 2002 or after November 7, 2002 but that vested before the date of transition to IFRS and (ii) liabilities arising from cash-settled share-based payment transactions if those liabilities were settled before January 1, 2005 or before the date of transition to IFRS. the Company elected to apply this exemption on its January 1, 2010 date of transition to IFRS.
e. Leases IFRS 1 provides a first-time adopter with an option to
not apply certain requirements under IAS 17 Leases retrospectively. the Company applied two exemptions and accordingly assessed whether an arrangement contains a lease on the basis of facts and circumstances existing at the date of transition to IFRS. Secondly, the Company did not reassess the determination of whether an arrangement contains a lease under IFRS if the determination made under Canadian gAAP gave the same outcome as that from the application of IAS 17 Leases and IFRIC 4 Determining Whether an Arrangement Contains a Lease.
f. Borrowing Costs this exemption in IFRS 1 allows a first-time adopter to apply
the transitional provisions set out in IAS 23 Borrowing Costs at July 1, 2009 or the date of transition to IFRS, whichever is later. IAS 23 requires the capitalization of borrowing costs related to all qualifying assets. the Company elected to apply IAS 23 Borrowing Costs to qualifying assets for which the commencement date for capitalization is on or after January 1, 2010.
it sYstemsthe adoption of IFRS is not expected to have a significant impact on the Company’s information systems. the Company has implemented some minor modifications to ensure an efficient conversion to IFRS and continues to monitor and assess its system requirements. the Company is now running its financial statements in parallel for Canadian gAAP and IFRS.
internaL ControL oVer FinanCiaL reporting anD DisCLosUre ControLs anD proCeDUresthe Company continues to assess the changes necessitated to maintain the integrity of internal control over financial reporting and disclosure controls and procedures. the extent of the impact on these controls has been determined to be immaterial. the Company will continue to monitor and assess these controls on an on-going basis.
FinanCiaL reporting expertisethe Company has identified resource requirements to establish appropriate IFRS financial reporting expertise at all levels of the business and continues to provide on-going training to targeted key finance and operational staff.
All analysis and conclusions are based on the IFRSs effective at December 31, 2010. As the IASB currently has various projects on its work plan that might affect the Company’s decisions at transition date, the Company continues to monitor these ongoing changes and adjust its transition plans accordingly. the Company’s transition status is currently on track with its implementation schedule.
sUBseQUent eVentsOn February 15, 2011, the Company announced that its Board of Directors has approved a quarterly cash dividend to holders of its common shares. In conjunction with this approval, the Board declared the first quarterly cash dividend of 2011 of $0.025 per common share to holders of record of its common shares as of the close of business on Monday, February 28, 2011. this dividend was paid to shareholders on or about March 14, 2011 and is designated to be an eligible dividend for the purposes of the Income tax Act (Canada). Specific dates and amounts of future dividends will be determined by the Board on an ongoing basis.
DisCLosUre ControLs anD proCeDUresPan American’s management considers the meaning of internal control to be the processes established by management to provide reasonable assurance about the achievement of the Company’s objectives regarding operations, reporting and compliance. Internal control is designed to address identified risks that threaten any of these objectives.
As of December 31, 2010, the Company carried out an evaluation, under the supervision and with the participation of the Company’s management, including the Company’s Chief Executive Officer and Chief Financial Officer, of the effectiveness of the design and operation of the Company’s disclosure controls and procedures. Based on that evaluation, the Chief Executive Officer and Chief Financial Officer have concluded that, as of December 31, 2010, the Company’s disclosure controls and procedures were effective.
CHanges in internaL ControLs oVer FinanCiaL reporting
there was no change in the Company’s internal control over financial reporting that occurred during the period that has materially affected or is reasonably likely to materially affect, its internal control over financial reporting.
management’s report on internaL ControL oVer FinanCiaL reporting
Management of Pan American is responsible for establishing and maintaining an adequate system of internal control, including internal controls over financial reporting. Internal control over financial reporting is a process designed by, or under the supervision of, the President and Chief Executive Officer and the Chief Financial Officer and effected by the Board of Directors, management and other personnel to provide reasonable

MANAgEMENt'S DISCUSSION AND ANALYSIS 53
assurance regarding the reliability of financial reporting and the preparation of financial statements for external purposes in accordance with Canadian generally accepted accounting principles. It includes those policies and procedures that:
a) pertain to the maintenance of records that in reasonable detail accurately and fairly reflect the transactions and dispositions of the assets of Pan American,
b) are designed to provide reasonable assurance that transactions are recorded as necessary to permit preparation of financial statements in accordance with Canadian generally accepted accounting principles, and that receipts and expenditures of Pan American are being made only in accordance with authorizations of management and Pan American’s directors, and
c) are designed to provide reasonable assurance regarding prevention or timely detection of unauthorized acquisition, use or disposition of Pan American’s assets that could have a material effect on the annual financial statements or interim financial reports.
the Company’s management, including its President and Chief Executive Officer and Chief Financial Officer, believe that due to its inherent limitations, internal control over financial reporting may not prevent or detect misstatements on a timely basis. Also, projections of any evaluation of the effectiveness of internal control over financial reporting to future periods are subject to the risk that the controls may become inadequate because of changes in conditions, or that the degree of compliance with the policies or procedures may deteriorate.
Management assessed the effectiveness of Pan American’s internal control over financial reporting as at December 31, 2010, based on the criteria set forth in Internal Control – Integrated Framework issued by the Committee of Sponsoring Organizations of the treadway Commission (COSO). Based on this assessment, management believes that, as of December 31, 2010, Pan American’s internal control over financial reporting is effective. Also, management did not identify any material weaknesses in conducting their evaluation of Pan American’s internal control over financial reporting as at December 31, 2010.
Management reviewed the results of management’s assessment with the Audit Committee of the Company’s Board of Directors. Deloitte & touche LLP, Independent Registered Chartered Accountants, were engaged, as approved by a vote of the Company’s shareholders, to audit and provide independent opinions on the Company’s consolidated financial statements and the effectiveness of the Company’s internal control over financial reporting as of December 31, 2010. Deloitte & touche LLP has provided such opinions.

PAN AMERICAN SILVER CORP. | ANNUAL REPORt 201054
mineraL reserVes anD resoUrCesAs of December 31, 2010
mineraL reserVes—proVen anD proBaBLe
LoCation tYpe CLassiFiCation tonne (000’s) ag (g/mt) ag Cont (000’s ozs) au (g/mt) au Cont (oz)
Huaron Peru Vein Proven 6,284 174 35,108 N/A N/A
Vein Probable 4,336 173 24,179 N/A N/A
Morococha (92.2%) Peru Vein/Mantos Proven 4,254 149 20,393 N/A N/A
Vein/Mantos Probable 3,010 178 17,228 N/A N/A
La Colorada Mexico Vein Proven 1,242 406 16,214 0.48 19,220
Vein Probable 1,671 412 22,123 0.47 25,262
Quiruvilca Peru Vein Proven 434 159 2,220 0.92 12,860
Vein Probable 390 137 1,720 0.51 6,369
Alamo Dorado Mexico Disseminated Proven 6,766 87 18,934 0.31 68,451
Disseminated Probable 3,270 78 8,232 0.31 32,067
Manantial Espejo Argentina Vein Proven 4,571 149 22,688 2.20 335,416
Vein Probable 3,229 131 13,628 1.91 198,692
San Vicente (95%) Bolivia Vein Proven 1,696 383 20,892 N/A N/A
Vein Probable 684 325 7,149 N/A N/A
totals(vi) proven & probable 42,016 171 230,708 – 698,337
mineraL resoUrCes—measUreD anD inDiCateD
LoCation tYpe CLassiFiCation tonne (000’s) ag (g/mt) ag Cont (000’s ozs) au (g/mt) au Cont (oz)
Huaron Peru Vein Measured 696 153 3,432 N/A N/A
Vein Indicated 507 152 2,471 N/A N/A
Morococha (92.2%) Peru Vein/Mantos Measured 1,232 142 5,625 N/A N/A
Vein /Mantos Indicated 1,432 206 9,471 N/A N/A
La Colorada Mexico Vein Measured 111 218 778 0.19 685
Vein Indicated 1,098 270 9,519 0.31 10,792
Quiruvilca Peru Vein Measured 1,430 124 5,696 0.77 35,585
Vein Indicated 1,815 125 7,293 0.73 42,850
Silver Stockpiles (i) Peru Flux Material Measured 189 318 1,935 N/A N/A
Alamo Dorado Mexico Disseminated Measured 2,962 56 5,348 0.28 26,698
Disseminated Indicated 3,296 52 5,499 0.42 44,758
Manantial Espejo Argentina Vein Measured 1,794 75 4,354 1.00 57,673
Vein Indicated 3,927 75 9,459 0.87 109,344
San Vicente (95%) Bolivia Vein Measured 818 133 3,487 N/A N/A
Vein Indicated 340 138 1,505 N/A N/A
Navidad Argentina Mantos, Diss. Measured 15,400 137 67,832 N/A N/A
Mantos, Diss. Indicated 139,800 126 564,531 N/A N/A
Pico Machay Peru Disseminated Measured 4,700 N/A N/A 0.91 137,509
Disseminated Indicated 5,900 N/A N/A 0.67 127,092
Calcatreu Argentina Vein Indicated 7,995 26 6,606 2.63 676,028
totals(vi) measured & indicated 195,443 114 714,840 – 1,269,013
mineraL resoUrCes—inFerreD
LoCation tYpe CLassiFiCation tonne (000’s) ag (g/mt) ag Cont (000’s ozs) au (g/mt) au Cont (oz)
Huaron Peru Vein Inferred 7,046 161 36,516 N/A N/A
Morococha (92.2%) Peru Vein/Mantos Inferred 7,126 174 39,865 N/A N/A
La Colorada Mexico Vein Inferred 3,630 251 29,266 0.29 33,456
Quiruvilca Peru Vein Inferred 1,031 104 3,455 0.50 16,690
Alamo Dorado Mexico Disseminated Inferred 1,739 41 2,265 0.45 25,337
Manantial Espejo Argentina Vein Inferred 2,049 87 5,724 0.83 54,431
San Vicente (95%) Bolivia Vein Inferred 928 233 6,947 N/A N/A
Navidad Argentina Mantos, Diss. Inferred 45,900 81 119,386 N/A N/A
Pico Machay Peru Disseminated Inferred 23,900 N/A NA 0.58 445,673
Calcatreu Argentina Vein Inferred 3,413 17 1,822 2.06 226,045
totals(vi) inferred 96,762 79 245,245 – 801,631
HistoriCaL estimates
LoCation UnCLassiFieD tonnes (000’s) ag (g/mt) ag Cont (000’s ozs) au (g/mt) pb (%) au Cont (oz)
Hog Heaven(iii) USA Historical(iii),(iv) 2,705 167 14,550 0.62 N/A N/A
Hog Heaven(iii) USA Historical(ii),(v) 7,639 133 32,730 0.70 N/A N/A
Waterloo(iv) USA Historical 33,758 93 100,937 N/A N/A N/A
totals(vi) Historical 44,102 104 148,217 – – –

MANAgEMENt'S DISCUSSION AND ANALYSIS 55
notes: mineral resources are in addition to reserves. mineral reserves and resources are as defined by the Cim Definition standards on mineral resources and mineral reserves.
mineral resources do not have demonstrated economic viability.
this table illustrates pan american silver Corp.’s share of mineral reserves and resources. properties in which pan american has less than 100% interest are noted next to the property name.
environmental, permitting, legal, title, taxation, socio-economic, political, marketing or other issues are not expected to materially affect the above estimates of mineral reserves.
Unless otherwise noted, the December 31, 2010 proven and probable mineral reserves were estimated using appropriate cut-off grades based on assumed metal prices of ag: $18.00/oz, au: $1,100/oz, pb: $1,950/tonne, Cu: $6,500/tonne, Zn: $1,950/tonne.
prices used for navidad were ag: $12.52/oz and pb: $1,100/tonne.
prices used for Calcatreu were ag: $12.50/oz and au: $650/oz.
(i) 2008 mineral Reserve and Resource estimates less 2009 production.
(ii) the historical estimate for Hog Heaven was calculated by gregory Hahn, Chief geological Engineer for CoCa Mines Inc., a previous owner of the property, in a report titled “Hog Heaven Project Optimization Study” dated May 1989, prior to implementation of NI 43-101. the historical estimate was based on extensive diamond drilling, and was calculated using a Silver price of $6.50 per ounce and a gold price of $400 per ounce (these were relevant prices at the time of the calculation). Michael Steinmann, P.geo., Qualified Person (“QP”) for the Company, has reviewed the available data, including drill sections, surface maps, and additional supporting information sources, and believes that the historic calculation was conducted in a professional and competent manner and is relevant for the purposes of the Company's decision to maintain its interest in this property. In the study, the historic estimate was sub-categorized as follows:
CategorY tons oz/ton ag
oz/ton au
Proven reserves 2,981,690 4.88 0.018
Probable & possible reserves 904,200 10.40 0.020
Heap leach ore 316,100 1.56 0.014
Possible resources 4,500,000 2.41 0.020
Inferred resources 2,700,000 4.44 0.022
However, the Company has not completed the work necessary to verify the historical estimate. Accordingly, the Company is not treating the historical estimate as NI 43-101-compliant categories of Mineral Resources based on information prepared by or under the supervision of a QP. these historical estimates should not be relied upon.
(iii) the Company believes that the historical estimate category of "Proven Reserves" for Hog Heaven most closely corresponds to 2,705,000 tonnes in the NI 43-101 category of "Indicated Resources".
(iv) the Company believes that the historical estimate categories of "Proven & Possible Reserves", "heap leach ore stockpile", "Possible Resources" and "Inferred Resources" most closely correspond to 7,639,000 tonnes in the NI 43-101 category of "Inferred Resources".
(v) the historical estimate for Waterloo was initially calculated by Asarco Inc. in 1968. In September 1994 Robert J. Rodger, P.Eng., reviewed the Asarco reports and prepared a technical Evaluation Report on the Waterloo property, prior to the implementation of NI 43-101. the technical Evaluation Report confirmed that the historical estimate was based on reverse circulation drilling and underground sampling, and concluded the estimate was based on sound methodology. the historical estimate at Waterloo was calculated using a Silver price of $5.00 per ounce (the relevant price at the time of the calculation). Michael Steinmann, P.geo., QP for the Company, has reviewed the technical Evaluation Report and believes the historic calculation was conducted in a professional and competent manner and is relevant for purposes of the Company's decision to maintain its interest in the property. the Company believes that the historical estimate category of 37,235,000 tonnes (at 2.71 ounces per tonne silver) of "Measured and Indicated Reserves" most closely correspond to 33,758,000 tonnes in the NI 43-101 category of "Indicated Resource." However, the Company has not completed the work necessary to verify the historical estimate. Accordingly, the Company is not treating the historical estimate as NI 43-101 compliant categories of Mineral Resources based on information prepared by or under the supervision of a QP. these historical estimates should not be relied upon.
(vi) totals may not add-up due to rounding.
Mineral Resource and Reserve estimates for Huaron, Quiruvilca, San Vicente, La Colorada, Manantial Espejo, Alamo Dorado and Morococha were prepared under the supervision of Michael Steinmann, P. geo., Executive Vice-President geology & Exploration and Martin g. Wafforn, P. Eng., Vice-President technical Services as Qualified Persons as that term is defined in NI 43-101. Navidad Resource estimates were prepared by Pamela De Mark, P. geo. Mineral Resource estimates for Hog Heaven and Waterloo are based on historical third party estimates.

PAN AMERICAN SILVER CORP. | ANNUAL REPORt 201056
CaUtionarY note regarDing ForWarD-LooKing statements CERtAIN OF tHE StAtEMENtS AND INFORMAtION IN tHIS MD&A
CONStItUtE “FORWARD-LOOKINg StAtEMENtS” WItHIN tHE MEANINg
OF tHE UNItED StAtES PRIVAtE SECURItIES LItIgAtION REFORM ACt
OF 1995 AND “FORWARD-LOOKINg INFORMAtION” WItHIN tHE MEANINg
OF APPLICABLE CANADIAN PROVINCIAL SECURItIES LAWS RELAtINg tO
tHE COMPANY AND ItS OPERAtIONS. ALL StAtEMENtS, OtHER tHAN
StAtEMENtS OF HIStORICAL FACt, ARE FORWARD-LOOKINg StAtEMENtS.
WHEN USED IN tHIS MD&A tHE WORDS, “BELIEVES”, “EXPECtS”, “INtENDS”,
“PLANS”, “FORECASt”, “OBJECtIVE”, “OUtLOOK”, “POSItIONINg”, “POtENtIAL”,
“ANtICIPAtED”, “BUDgEt”, AND OtHER SIMILAR WORDS AND EXPRESSIONS,
IDENtIFY FORWARD-LOOKINg StAtEMENtS OR INFORMAtION. tHESE
FORWARD-LOOKINg StAtEMENtS OR INFORMAtION RELAtE tO, AMONg
OtHER tHINgS: FUtURE PRODUCtION OF SILVER, gOLD AND OtHER MEtALS;
FUtURE CASH COStS PER OUNCE OF SILVER; tHE PRICE OF SILVER AND
OtHER MEtALS; tHE EFFECtS OF LAWS, REgULAtIONS AND gOVERNMENt
POLICIES AFFECtINg PAN AMERICAN’S OPERAtIONS OR POtENtIAL FUtURE
OPERAtIONS, INCLUDINg BUt NOt LIMItED tO, LAWS IN tHE PROVINCE OF
CHUBUt, ARgENtINA, WHICH, CURRENtLY HAVE SIgNIFICANt REStRICtIONS
ON MININg; FUtURE SUCCESSFUL DEVELOPMENt OF tHE NAVIDAD PROJECt,
tHE LA PRECIOSA PROJECt, AND OtHER DEVELOPMENt PROJECtS OF
tHE COMPANY; tHE SUFFICIENCY OF tHE COMPANY’S CURRENt WORKINg
CAPItAL, ANtICIPAtED OPERAtINg CASH FLOW OR ItS ABILItY tO RAISE
NECESSARY FUNDS; tHE ACCURACY OF MINERAL RESERVE AND RESOURCE
EStIMAtES; EStIMAtED PRODUCtION RAtES FOR SILVER AND OtHER
PAYABLE MEtALS PRODUCED BY tHE COMPANY; tIMINg OF PRODUCtION AND
tHE CASH AND tOtAL COStS OF PRODUCtION At EACH OF tHE COMPANY’S
PROPERtIES; tHE EStIMAtED COSt OF AND AVAILABILItY OF FUNDINg
NECESSARY FOR SUStAININg CAPItAL; ONgOINg OR FUtURE DEVELOPMENt
PLANS AND CAPItAL REPLACEMENt, IMPROVEMENt OR REMEDIAtION
PROgRAMS; tHE ABILItY OF tHE COMPANY tO REDUCE ENVIRONMENtAL
IMPACtS, INCLUDINg A REDUCtION IN gREENHOUSE gAS EMISSIONS,
AND tO IMPROVE SUStAINABILItY IN ItS OPERAtIONS AND PROJECtS; tHE
EStIMAtES OF EXPECtED OR ANtICIPAtED ECONOMIC REtURNS FROM tHE
COMPANY’S MININg PROJECtS, AS REFLECtED IN tECHNICAL REPORtS OR
OtHER ANALYSES PREPARED IN RELAtION tO DEVELOPMENt OF PROJECtS;
EStIMAtED EXPLORAtION EXPENDItURES tO BE INCURRED ON tHE
COMPANY’S VARIOUS PROPERtIES; FORECASt CAPItAL AND NON-OPERAtINg
SPENDINg; FUtURE SALES OF tHE MEtALS, CONCENtRAtES OR OtHER
PRODUCtS PRODUCED BY tHE COMPANY; AND tHE COMPANY’S PLANS AND
EXPECtAtIONS FOR ItS PROPERtIES AND OPERAtIONS.
tHESE StAtEMENtS REFLECt tHE COMPANY’S CURRENt VIEWS WItH
RESPECt tO FUtURE EVENtS AND ARE NECESSARILY BASED UPON A
NUMBER OF ASSUMPtIONS AND EStIMAtES tHAt, WHILE CONSIDERED
REASONABLE BY tHE COMPANY, ARE INHERENtLY SUBJECt tO SIgNIFICANt
BUSINESS, ECONOMIC, COMPEtItIVE, POLItICAL AND SOCIAL UNCERtAINtIES
AND CONtINgENCIES. MANY FACtORS, BOtH KNOWN AND UNKNOWN,
COULD CAUSE ACtUAL RESULtS, PERFORMANCE OR ACHIEVEMENtS
tO BE MAtERIALLY DIFFERENt FROM tHE RESULtS, PERFORMANCE OR
ACHIEVEMENtS tHAt ARE OR MAY BE EXPRESSED OR IMPLIED BY SUCH
FORWARD-LOOKINg StAtEMENtS CONtAINED IN tHIS MD&A AND tHE
COMPANY HAS MADE ASSUMPtIONS AND EStIMAtES BASED ON OR RELAtED
tO MANY OF tHESE FACtORS. SUCH FACtORS INCLUDE, WItHOUt LIMItAtION:
FLUCtUAtIONS IN SPOt AND FORWARD MARKEtS FOR SILVER, gOLD, BASE
MEtALS AND CERtAIN OtHER COMMODItIES (SUCH AS NAtURAL gAS, FUEL
OIL AND ELECtRICItY); FLUCtUAtIONS IN CURRENCY MARKEtS (SUCH AS
tHE PERUVIAN SOL, MEXICAN PESO, ARgENtINE PESO, BOLIVIAN BOLIVIANO
AND CANADIAN DOLLAR VERSUS tHE U.S. DOLLAR); RISKS RELAtED tO tHE
tECHNOLOgICAL AND OPERAtIONAL NAtURE OF tHE COMPANY’S BUSINESS;
CHANgES IN NAtIONAL AND LOCAL gOVERNMENt, LEgISLAtION, tAXAtION,
CONtROLS OR REgULAtIONS AND POLItICAL OR ECONOMIC DEVELOPMENtS
IN CANADA, tHE UNItED StAtES, MEXICO, PERU, ARgENtINA, BOLIVIA OR
OtHER COUNtRIES WHERE tHE COMPANY MAY CARRY ON BUSINESS IN tHE
FUtURE; RISKS AND HAZARDS ASSOCIAtED WItH tHE BUSINESS OF MINERAL
EXPLORAtION, DEVELOPMENt AND MININg (INCLUDINg ENVIRONMENtAL
HAZARDS, INDUStRIAL ACCIDENtS, UNUSUAL OR UNEXPECtED gEOLOgICAL
OR StRUCtURAL FORMAtIONS, PRESSURES, CAVE-INS AND FLOODINg);
RISKS RELAtINg tO tHE CREDIt WORtHINESS OR FINANCIAL CONDItION OF
SUPPLIERS, REFINERS AND OtHER PARtIES WItH WHOM tHE COMPANY DOES
BUSINESS; INADEQUAtE INSURANCE, OR INABILItY tO OBtAIN INSURANCE, tO
COVER tHESE RISKS AND HAZARDS; EMPLOYEE RELAtIONS; RELAtIONSHIPS
WItH AND CLAIMS BY LOCAL COMMUNItIES AND INDIgENOUS POPULAtIONS;
AVAILABILItY AND INCREASINg COStS ASSOCIAtED WItH MININg INPUtS
AND LABOUR; tHE SPECULAtIVE NAtURE OF MINERAL EXPLORAtION AND
DEVELOPMENt, INCLUDINg tHE RISKS OF OBtAININg NECESSARY LICENSES
AND PERMItS AND tHE PRESENCE OF LAWS AND REgULAtIONS tHAt MAY
IMPOSE REStRICtIONS ON MININg, INCLUDINg tHOSE CURRENtLY IN tHE
PROVINCE OF CHUBUt, ARgENtINA; DIMINISHINg QUANtItIES OR gRADES
OF MINERAL RESERVES AS PROPERtIES ARE MINED; gLOBAL FINANCIAL
CONDItIONS; tHE COMPANY’S ABILItY tO COMPLEtE AND SUCCESSFULLY
INtEgRAtE ACQUISItIONS AND tO MItIgAtE OtHER BUSINESS COMBINAtION
RISKS; CHALLENgES tO, OR DIFFICULtY IN MAINtAININg, tHE COMPANY’S
tItLE tO PROPERtIES AND CONtINUED OWNERSHIP tHEREOF; tHE ACtUAL
RESULtS OF CURRENt EXPLORAtION ACtIVItIES, CONCLUSIONS OF
ECONOMIC EVALUAtIONS, AND CHANgES IN PROJECt PARAMEtERS tO
DEAL WItH UNANtICIPAtED ECONOMIC OR OtHER FACtORS; INCREASED
COMPEtItION IN tHE MININg INDUStRY FOR PROPERtIES, EQUIPMENt,
QUALIFIED PERSONNEL, AND tHEIR COStS; AND tHOSE FACtORS IDENtIFIED
UNDER tHE CAPtION “RISKS RELAtED tO PAN AMERICAN’S BUSINESS” IN tHE
COMPANY’S MOSt RECENt FORM 40-F AND ANNUAL INFORMAtION FORM
FILED WItH tHE UNItED StAtES SECURItIES AND EXCHANgE COMMISSION
AND CANADIAN PROVINCIAL SECURItIES REgULAtORY AUtHORItIES.
INVEStORS ARE CAUtIONED AgAINSt AttRIBUtINg UNDUE CERtAINtY OR
RELIANCE ON FORWARD-LOOKINg StAtEMENtS. ALtHOUgH tHE COMPANY
HAS AttEMPtED tO IDENtIFY IMPORtANt FACtORS tHAt COULD CAUSE
ACtUAL RESULtS tO DIFFER MAtERIALLY, tHERE MAY BE OtHER FACtORS
tHAt CAUSE RESULtS NOt tO BE AS ANtICIPAtED, EStIMAtED, DESCRIBED
OR INtENDED. tHE COMPANY DOES NOt INtEND, AND DOES NOt ASSUME
ANY OBLIgAtION, tO UPDAtE tHESE FORWARD-LOOKINg StAtEMENtS OR
INFORMAtION tO REFLECt CHANgES IN ASSUMPtIONS OR CHANgES IN
CIRCUMStANCES OR ANY OtHER EVENtS AFFECtINg SUCH StAtEMENtS OR
INFORMAtION, OtHER tHAN AS REQUIRED BY APPLICABLE LAW.

MANAgEMENt'S DISCUSSION AND ANALYSIS 57
CaUtionarY note to Us inVestors ConCerning estimates oF reserVes anD resoUrCestHIS MD&A HAS BEEN PREPARED IN ACCORDANCE WItH tHE
REQUIREMENtS OF CANADIAN PROVINCIAL SECURItIES LAWS, WHICH
DIFFER FROM tHE REQUIREMENtS OF U.S. SECURItIES LAWS. UNLESS
OtHERWISE INDICAtED, ALL MINERAL RESERVE AND RESOURCE EStIMAtES
INCLUDED IN tHIS MD&A HAVE BEEN PREPARED IN ACCORDANCE WItH
CANADIAN NAtIONAL INStRUMENt 43-101 – StANDARDS OF DISCLOSURE
FOR MINERAL PROJECtS (‘‘NI 43-101’’) AND tHE CANADIAN INStItUtE OF
MININg, MEtALLURgY AND PEtROLEUM CLASSIFICAtION SYStEM. NI 43-
101 IS A RULE DEVELOPED BY tHE CANADIAN SECURItIES ADMINIStRAtORS
tHAt EStABLISHES StANDARDS FOR ALL PUBLIC DISCLOSURE AN ISSUER
MAKES OF SCIENtIFIC AND tECHNICAL INFORMAtION CONCERNINg
MINERAL PROJECtS.
CANADIAN StANDARDS, INCLUDINg NI 43-101, DIFFER SIgNIFICANtLY
FROM tHE REQUIREMENtS OF tHE UNItED StAtES SECURItIES AND
EXCHANgE COMMISSION (tHE “SEC”), AND INFORMAtION CONCERNINg
MINERALIZAtION, DEPOSItS, MINERAL RESERVE AND RESOURCE
INFORMAtION CONtAINED OR REFERRED tO HEREIN MAY NOt BE
COMPARABLE tO SIMILAR INFORMAtION DISCLOSED BY U.S. COMPANIES.
IN PARtICULAR, AND WItHOUt LIMItINg tHE gENERALItY OF tHE
FOREgOINg, tHIS MD&A USES tHE tERMS ‘‘MEASURED RESOURCES’’,
‘‘INDICAtED RESOURCES’’ AND ‘‘INFERRED RESOURCES’’. U.S. INVEStORS
ARE ADVISED tHAt, WHILE SUCH tERMS ARE RECOgNIZED AND REQUIRED
BY CANADIAN SECURItIES LAWS, tHE SEC DOES NOt RECOgNIZE tHEM.
UNDER U.S. StANDARDS, MINERALIZAtION MAY NOt BE CLASSIFIED AS
A ‘‘RESERVE’’ UNLESS tHE DEtERMINAtION HAS BEEN MADE tHAt tHE
MINERALIZAtION COULD BE ECONOMICALLY AND LEgALLY PRODUCED
OR EXtRACtED At tHE tIME tHE RESERVE DEtERMINAtION IS MADE.
U.S. INVEStORS ARE CAUtIONED NOt tO ASSUME tHAt ANY PARt OF
A “MEASURED RESOURCE” OR “INDICAtED RESOURCE” WILL EVER
BE CONVERtED INtO A “RESERVE”. U.S. INVEStORS SHOULD ALSO
UNDERStAND tHAt “INFERRED RESOURCES” HAVE A gREAt AMOUNt
OF UNCERtAINtY AS tO tHEIR EXIStENCE AND gREAt UNCERtAINtY AS
tO tHEIR ECONOMIC AND LEgAL FEASIBILItY. It CANNOt BE ASSUMED
tHAt ALL OR ANY PARt OF “INFERRED RESOURCES” EXISt, ARE
ECONOMICALLY OR LEgALLY MINEABLE OR WILL EVER BE UPgRADED tO
A HIgHER CAtEgORY. UNDER CANADIAN SECURItIES LAWS, EStIMAtED
“INFERRED RESOURCES” MAY NOt FORM tHE BASIS OF FEASIBILItY
OR PRE-FEASIBILItY StUDIES EXCEPt IN RARE CASES. DISCLOSURE
OF “CONtAINED OUNCES” IN A MINERAL RESOURCE IS PERMIttED
DISCLOSURE UNDER CANADIAN SECURItIES LAWS. HOWEVER, tHE SEC
NORMALLY ONLY PERMItS ISSUERS tO REPORt MINERALIZAtION tHAt
DOES NOt CONStItUtE “RESERVES” BY SEC StANDARDS AS IN PLACE
tONNAgE AND gRADE, WItHOUt REFERENCE tO UNIt MEASURES. tHE
REQUIREMENtS OF NI 43-101 FOR IDENtIFICAtION OF “RESERVES” ARE
ALSO NOt tHE SAME AS tHOSE OF tHE SEC, AND RESERVES REPORtED
BY tHE COMPANY IN COMPLIANCE WItH NI 43-101 MAY NOt QUALIFY AS
“RESERVES” UNDER SEC StANDARDS. ACCORDINgLY, INFORMAtION
CONCERNINg MINERAL DEPOSItS SEt FORtH HEREIN MAY NOt BE
COMPARABLE WItH INFORMAtION MADE PUBLIC BY COMPANIES tHAt
REPORt IN ACCORDANCE WItH U.S. StANDARDS.

PAN AMERICAN SILVER CORP. | ANNUAL REPORt 201058
management’s responsiBiLitY For FinanCiaL reportingthe accompanying Consolidated Financial Statements of Pan American Silver Corp. were prepared by management, which is responsible for the integrity and fairness of the information presented, including the many amounts that must of necessity be based on estimates and judgments. these Consolidated Financial Statements were prepared in accordance with Canadian generally accepted accounting principles (Canadian gAAP). Financial information appearing throughout our management’s discussion and analysis is consistent with these Consolidated Financial Statements.
In discharging our responsibility for the integrity and fairness of the consolidated financial statements and for the accounting systems from which they are derived, we maintain the necessary system of internal controls designed to ensure that transactions are authorized, assets are safeguarded and proper records are maintained. these controls include quality standards in hiring employees, policies and procedure manuals, a corporate code of conduct and accountability for performance within appropriate and well-defined areas of responsibility.
the Board of Directors oversees management’s responsibilities for financial reporting through an Audit Committee, which is composed entirely of directors who are neither officers nor employees of Pan American Silver Corp. this Committee reviews our consolidated financial statements and recommends them to the Board for approval. Other key responsibilities of the Audit Committee include reviewing our existing internal control procedures and planned revisions to those procedures, and advising the directors on auditing matters and financial reporting issues.
Deloitte & touche LLP, Independent Registered Chartered Accountants appointed by the shareholders of Pan American Silver Corp. upon the recommendation of the Audit Committee and Board, have performed an independent audit of the Consolidated Financial Statements and their report follows. the auditors have full and unrestricted access to the Audit Committee to discuss their audit and related findings.
Signed Signed
geoff A. Burns A. Robert Doyle President and Chief Executive Officer Chief Financial Officer
March 22, 2011

59REPORt OF INDEPENDENt REgIStERED CHARtERED ACCOUNtANtS
report oF inDepenDent registereD CHartereD aCCoUntants
to the Board of Directors and Shareholders of Pan American Silver Corp.
We have audited the accompanying consolidated financial statements of Pan American Silver Corp. and subsidiaries (the “Company”), which comprise the consolidated balance sheets as at December 31, 2010 and December 31, 2009, and the consolidated statements of operations, comprehensive income, shareholders’ equity and cash flows for each of the years in the three-year period ended December 31, 2010, and a summary of significant accounting policies and other explanatory information.
management's responsibility for the consolidated financial statementsManagement is responsible for the preparation and fair presentation of these consolidated financial statements in accordance with Canadian generally accepted accounting principles, and for such internal control as management determines is necessary to enable the preparation of consolidated financial statements that are free from material misstatement, whether due to fraud or error.
auditor's responsibilityOur responsibility is to express an opinion on these consolidated financial statements based on our audits. We conducted our audits in accordance with Canadian generally accepted auditing standards and the standards of the Public Company Accounting Oversight Board (United States). those standards require that we comply with ethical requirements and plan and perform the audit to obtain reasonable assurance about whether the consolidated financial statements are free from material misstatement.
An audit involves performing procedures to obtain audit evidence about the amounts and disclosures in the consolidated financial statements. the procedures selected depend on the auditor’s judgment, including the assessment of the risks of material misstatement of the consolidated financial statements, whether due to fraud or error. In making those risk assessments, the auditor considers internal control relevant to the entity’s preparation and fair presentation of the consolidated financial statements in order to design audit procedures that are appropriate in the circumstances. An audit also includes evaluating the appropriateness of accounting policies used and the reasonableness of accounting estimates made by management, as well as evaluating the overall presentation of the consolidated financial statements.
We believe that the audit evidence we have obtained in our audits is sufficient and appropriate to provide a basis for our audit opinion.
opinionIn our opinion, the consolidated financial statements present fairly, in all material respects, the financial position of Pan American Silver Corp. and subsidiaries as at December 31, 2010 and December 31, 2009 and the results of their operations and cash flows for each of the years in the three-year period ended December 31, 2010 in accordance with Canadian generally accepted accounting principles.
other matterWe have also audited, in accordance with the standards of the Public Company Accounting Oversight Board (United States), the Company’s internal control over financial reporting as of December 31, 2010, based on the criteria established in Internal Control—Integrated Framework issued by the Committee of Sponsoring Organizations of the treadway Commission and our report dated March 22, 2011 expressed an unqualified opinion on the Company’s internal control over financial reporting.
Independent Registered Chartered AccountantsMarch 22, 2011Vancouver, Canada
Deloitte & touche LLp2800—1055 Dunsmuir St. 4 Bentall Centre P.O. Box 49279 Vancouver, British Columbia Canada V7X 1P4
t. 604 699 4466 F. 604 685 0395 www.deloitte.ca

PAN AMERICAN SILVER CORP. | ANNUAL REPORt 201060
report oF inDepenDent registereD CHartereD aCCoUntants
to the Board of Directors and Shareholders of Pan American Silver Corp.
We have audited the internal control over financial reporting of Pan American Silver Corp. and subsidiaries (the “Company”) as of December 31, 2010, based on the criteria established in Internal Control—Integrated Framework issued by the Committee of Sponsoring Organizations of the treadway Commission. the Company’s management is responsible for maintaining effective internal control over financial reporting and for its assessment of the effectiveness of internal control over financial reporting, included in the accompanying Management’s Report on Internal Control over Financial Reporting. Our responsibility is to express an opinion on the Company’s internal control over financial reporting based on our audit.
We conducted our audit in accordance with the standards of the Public Company Accounting Oversight Board (United States). those standards require that we plan and perform the audit to obtain reasonable assurance about whether effective internal control over financial reporting was maintained in all material respects. Our audit included obtaining an understanding of internal control over financial reporting, assessing the risk that a material weakness exists, testing and evaluating the design and operating effectiveness of internal control based on the assessed risk, and performing such other procedures as we considered necessary in the circumstances. We believe that our audit provides a reasonable basis for our opinion.
A company’s internal control over financial reporting is a process designed by, or under the supervision of, the company’s principal executive and principal financial officers, or persons performing similar functions, and effected by the company’s board of directors, management, and other personnel to provide reasonable assurance regarding the reliability of financial reporting and the preparation of financial statements for external purposes in accordance with generally accepted accounting principles. A company’s internal control over financial reporting includes those policies and procedures that (1) pertain to the maintenance of records that, in reasonable detail, accurately and fairly reflect the transactions and dispositions of the assets of the company; (2) provide reasonable assurance that transactions are recorded as necessary to permit preparation of financial statements in accordance with generally accepted accounting principles, and that receipts and expenditures of the company are being made only in accordance with authorizations of management and directors of the company; and (3) provide reasonable assurance regarding prevention or timely detection of unauthorized acquisition, use, or disposition of the company’s assets that could have a material effect on the financial statements.
Because of the inherent limitations of internal control over financial reporting, including the possibility of collusion or improper management override of controls, material misstatements due to error or fraud may not be prevented or detected on a timely basis. Also, projections of any evaluation of the effectiveness of the internal control over financial reporting to future periods are subject to the risk that the controls may become inadequate because of changes in conditions, or that the degree of compliance with the policies or procedures may deteriorate.
In our opinion, the Company maintained, in all material respects, effective internal control over financial reporting as of December 31, 2010, based on the criteria established in Internal Control—Integrated Framework issued by the Committee of Sponsoring Organizations of the treadway Commission.
We have also audited, in accordance with the standards of the Public Company Accounting Oversight Board (United States), the consolidated financial statements as of and for the year ended December 31, 2010 of the Company and our report dated March 22, 2011 expressed an unqualified opinion on those financial statements.
Independent Registered Chartered AccountantsMarch 22, 2011Vancouver, Canada
Deloitte & touche LLp2800—1055 Dunsmuir St. 4 Bentall Centre P.O. Box 49279 Vancouver, British Columbia Canada V7X 1P4
t. 604 699 4466 F. 604 685 0395 www.deloitte.ca

61CONSOLIDAtED BALANCE SHEEt
ConsoLiDateD BaLanCe sHeetsAs at December 31, 2010 (in thousands of U.S. dollars)
assets 2010 2009
Current
Cash $ 179,921 $ 100,474
Short-term investments (Note 6) 180,583 92,623
Accounts receivable (Note 5) 66,893 66,059
Income taxes receivable 87 12,132
Inventories (Note 5 & 7) 106,854 93,446
Unrealized gain on commodity contracts - 160
Future income taxes (Note 19) 8,172 4,993
Prepaid and other deferred expenses 6,520 2,568
total Current Assets 549,030 372,455
Mineral property, plant and equipment, net (Note 8) 1,492,538 1,457,724
Long-term refundable tax receivable 28,171 11,909
Future income taxes (Note 19) 1,251 -
Other assets (Note 9) 1,618 6,521
total assets $ 2,072,608 $ 1,848,609
LiaBiLities
Current
Accounts payable and accrued liabilities (Note 10) $ 81,230 $ 96,159
Future income taxes (Note 19) 4,312 -
Income taxes payable 29,699 4,021
total Current Liabilities 115,241 100,180
Provision for asset retirement obligation and reclamation (Note 11) 69,463 62,775
Future income taxes (Note 19) 331,228 305,820
Other liabilities (Note 12) 28,614 20,788
total Liabilities 544,546 489,563
non-ControLLing interests 7,774 15,256
sHareHoLDer’s eQUitY (Note 14)
Share capital (authorized: 200,000,000 common shares of no par value) 1,272,860 1,206,647
Contributed surplus 45,303 47,293
Accumulated other comprehensive income (Note 13) 9,346 1,618
Retained earnings 192,779 88,232
Retained earnings and accumulated other comprehensive income 202,125 89,850
total shareholders’ equity 1,520,288 1,343,790
total Liabilities, non-Controlling interests and shareholders’ equity $ 2,072,608 $ 1,848,609
See accompanying notes to the consolidated financial statements. Commitments and Contingencies (Note 18)
APPROVED BY tHE BOARD
Signed Signed
Ross J. Beaty geoff A. Burns Director Director

PAN AMERICAN SILVER CORP. | ANNUAL REPORt 201062
ConsoLiDateD statements oF operationsFor the years ended December 31, 2010, 2009 and 2008 (in thousands of U.S. Dollars, except for per share amounts)
2010 2009 2008
Sales $ 631,986 $ 454,812 $ 338,600
Cost of sales 305,696 245,637 199,032
Depreciation and amortization 86,483 83,169 46,349
Mine operating earnings 239,807 126,006 93,219
general and administrative 17,109 12,769 10,435
Exploration and project development 24,527 9,934 5,494
Accretion of asset retirement obligation 2,929 2,998 2,687
Doubtful accounts and inventory provisions (Note 5) 4,754 4,375 -
Write-down of mining assets (Note 8) - - 15,117
Operating earnings 190,488 95,930 59,486
Interest and financing expenses (2,061) (4,292) (951)
Investment and other income (expenses), net 5,488 (1,467) (1,970)
Foreign exchange gains (losses) 11,058 (1,018) (6,147)
Net (losses) gains on commodity and foreign currency contracts (237) 1,918 (1,619)
Net gains (losses) on sale of assets 651 (220) 998
Income before taxes and non-controlling interest 205,387 90,851 49,797
Non-controlling interests (1,827) (1,097) (765)
Income tax provision (Note 19) (90,987 ) (27,756) (24,430)
net income $ 112,573 $ 61,998 $ 24,602
Earnings per share (Note 15)
Basic income per share $ 1.05 $ 0.71 $ 0.31
Diluted income per share $ 1.05 $ 0.71 $ 0.30
Weighted average shares outstanding (in thousands):
Basic 106,969 87,578 80,236
Diluted 107,575 87,751 80,773
Cash dividends declared per common share $ 0.075 $ – $ –
ConsoLiDateD statements oF CompreHensiVe inCome
For Years Ended December 31 2010, 2009 and 2008 (in thousands of US dollars) 2010 2009 2008
Net income $ 112,573 $ 61,998 $ 24,602
Other comprehensive income
Unrealized gains on available for sale securities 8,025 17,079 9,913
Unrealized gain reversed upon disposal of shares in acquisition of mineral interests – (8,710) –
Reclassification adjustment for gains included in income (297) (6,519) (1,495)
total other comprehensive income 7,728 1,850 8,418
Comprehensive income $ 120,301 $ 63,848 $ 33,020
See accompanying notes to the consolidated financial statements.

63CONSOLIDAtED StAtEMENtS OF SHAREHOLDERS’ EQUItY
ConsoLiDateD statements oF sHareHoLDers’ eQUitYFor the years ended December 31, 2010, 2009, 2008 (in thousands of U.S. dollars, except for numbers of shares)
Common sHaresContriBUteD
sUrpLUs
aCCUmULateD otHer CompreHensiVe
inCome (Loss)retaineD
earnings totaLsHares amoUnt
Balance, December 31, 2007 76,662,651 $ 592,402 $ 14,233 $ (8,650) $ 1,632 $ 599,617
Issued on the exercise of stock options 129,371 3,310 (651) – – 2,659
Issued on the exercise of share purchase warrants 3,969,016 58,928 (10,744) – – 48,184
Issued as compensation 25,069 877 – – – 877
Stock-based compensation on options granted – – 1,284 – – 1,284
Other comprehensive income – – – 8,418 – 8,418
Net income – – – – 24,602 24,602
Balance, December 31, 2008 80,786,107 $ 655,517 $ 4,122 (232) $ 26,234 $ 685,641
Issued on the exercise of stock options 32,000 515 (139) – – 376
Issued on public offering 6,371,000 97,941 – – – 97,941
Issued as compensation 44,626 624 – – – 624
Issued to acquire mineral interests 17,891,447 452,111 41,971 – – 494,082
Stock-based compensation on options granted – – 1,339 – – 1,339
Shares cancelled (8,060) (61) – – – (61)
Other comprehensive income – – – 1,850 – 1,850
Net income – – – – 61,998 61,998
Balance, December 31, 2009 105,117,120 $ 1,206,647 $ 47,293 $ 1,618 $ 88,232 $ 1,343,790
Issued on the exercise of stock options 450,587 9,003 (1,655) – – 7,348
Issued on the exercise of share purchase warrants 399,005 11,188 (6,649) – – 4,539
Issued as compensation 76,918 2,490 – – – 2,490
Issued to acquire mineral interests 1,747,738 43,532 3,985 – – 47,517
Stock-based compensation on options granted – – 2,329 – – 2,329
Other comprehensive income – – – 7,728 – 7,728
Dividends distributed – – – – (8,026) (8,026)
Net income – – – – 112,573 112,573
Balance, December 31, 2010 107,791,368 $ 1,272,860 $ 45,303 $ 9,346 $ 192,779 $ 1,520,288
See accompanying notes to consolidated financial statements.

PAN AMERICAN SILVER CORP. | ANNUAL REPORt 201064
ConsoLiDateD statements oF CasH FLoWs(in thousands of U.S. dollars)
operating aCtiVities 2010 2009 2008
Net income for the year $ 112,573 $ 61,998 $ 24,602
Reclamation expenditures (1,045) (992) (167)
Items not affecting cash:
Depreciation and amortization 86,483 83,169 46,349
Write-down of mining assets – – 15,117
Accretion of asset retirement obligation 2,929 2,998 2,687
Net (gains) losses on sale of assets (651) 220 (998)
Future income taxes 17,227 2,113 3,210
Unrealized (losses) gains on foreign exchange (9,976) 1,478 (2,769)
Non-controlling interests 1,827 1,097 765
Other operating adjustments and charges (Note 5) 4,754 7,145 –
gain on disposal of securities in acquisition of subsidiary (Note 3) – (6,353) –
Net change in unrealized (gains) losses on commodity and foreign currency contracts 160 (3,597) 8,913
Stock-based compensation 4,028 2,382 2,223
Changes in non-cash operating working capital (Note 16) 23,947 (35,782) (6,404)
Cash generated by operating activities 242,256 115,876 93,528
inVesting aCtiVities
Mining property, plant and equipment expenditures (net of related accruals) (83,370) (52,751) (243,800)
Acquisition of net assets of subsidiary (net of $4.3 million cash acquired) (Note 3) - 942 –
Net (purchase of) proceeds from sale of short-term investments (80,162) (80,136) 62,779
Proceeds from sale of assets 1,337 208 12,199
Net refundable tax paid and other asset expenditures (3,922) (14,605) –
Cash used in investing activities (166,117) (146,342) (168,822)
FinanCing aCtiVities
Proceeds from issuance of common shares 11,887 103,909 50,843
Share issue costs – (5,592) –
Dividends paid by subsidiaries to non-controlling interests (992) – (2,626)
Dividends paid (8,026) – –
Advances received for construction and equipment leases 5,360 – –
Net (repayments) proceeds from advances on metal shipments and loans (5,630) 5,742 2,494
Cash generated by financing activities 2,599 104,059 50,711
Cash, beginning of period 100,474 26,789 51,915
Increase (decrease) in cash during the period 78,738 73,593 (24,583)
Effect of exchange rate changes on cash 709 92 (543)
Cash, end of period $ 179,921 $ 100,474 $ 26,789
sUppLementaL CasH FLoW inFormation
Interest paid $ – $ – $ –
taxes paid $ 36,651 $ 21,655 $ 27,577
signiFiCant non-CasH items
Common shares issued to acquire mineral interest (Note 3) $ 47,517 $ 514,870 $ –
Stock compensation issued to employees and directors $ 4,768 $ 1,963 $ 2,161
See accompanying notes to the consolidated financial statements.

NOtES tO CONSOLIDAtED FINANCIAL StAtEMENtS 65
notes to ConsoLiDateD FinanCiaL statementsDecember 31, 2010, 2009, 2008 (Tabular amounts are in thousands of U.S. dollars except number of options and warrants and per share amounts)
1. natUre oF operations
Pan American Silver Corp. and its subsidiary companies (collectively, the “Company”, or “Pan American”) are engaged in silver mining and related activities, including exploration, extraction, processing, refining and reclamation. the Company’s primary product (silver) is produced in Peru, Mexico, Argentina and Bolivia. the Company has current project development activities in Peru, Mexico and Argentina, and exploration activities throughout South America and Mexico.
2. sUmmarY oF signiFiCant aCCoUnting poLiCies
a. Basis of presentationthe Company’s consolidated financial statements include the accounts of the Company and its majority-owned subsidiaries. the United States dollar is the principal currency of measure in all the Company’s operations. the Company prepares and files its consolidated financial statements in accordance with Canadian generally accepted accounting principles (“gAAP”). Significant differences from United States generally accepted accounting principles are discussed in Note 21.
b. principles of Consolidationthe consolidated financial statements include the wholly-owned and partially-owned subsidiaries of the Company, the most significant of which are presented in the following table:
sUBsiDiarY LoCationoWnersHipinterest statUs
operations anD DeVeLopment projeCts oWneD
Pan American Silver S.A. Mina Quiruvilca Peru 100% Consolidated Huaron Mine/Quiruvilca Mine
Compañía Minera Argentum S.A. Peru 92% Consolidated Morococha Mine
Minera Corner Bay S.A. de C.V. Mexico 100% Consolidated Alamo Dorado Mine
Plata Panamericana S.A. de C.V. Mexico 100% Consolidated La Colorada Mine
Minera triton Argentina S.A. Argentina 100% Consolidated Manantial Espejo Mine
Pan American Silver (Bolivia) S.A. Bolivia 95% Consolidated San Vicente Mine
Minera Argenta S.A. Argentina 100% Consolidated Navidad Project
Inter-company balances and transactions have been eliminated on consolidation.
c. significant Changes in accounting policythe Company did not make significant changes to its accounting policies in 2010.
d. Use of estimatesthe preparation of financial statements in accordance with Canadian gAAP requires the Company’s management to make estimates and assumptions that affect the reported amounts of assets and liabilities, the disclosure of contingent assets and liabilities at the date of the financial statements and the reported amounts of revenues and expenses during the reporting period. Actual results could differ from those estimates. the most significant estimates are: quantities of proven and probable silver reserves; the value of mineralized material beyond proven and probable reserves; future costs and expenses to produce proven and probable reserves; future commodity prices and foreign currency exchange rates; the future cost of asset retirement obligations; amounts of contingencies; and the fair value of acquired assets and liabilities including pre-acquisition contingencies. Significant items that require estimates as the basis for determining the stated amounts include inventories, trade accounts receivable, mineral property, plant and equipment, investments in non-producing properties, revenue recognition, stock based compensation, unrealized gains and losses on commodity and foreign currency contracts,
fair value of assets and liabilities acquired in a business combination, and income taxes.
e. revenue recognitionRevenue is recognized upon delivery when title and risk of ownership of metals or metal bearing concentrate passes to the buyer and when collection is reasonably assured. the passing of title to the customer is based on the terms of the sales contract, which is persuasive evidence that an arrangement exists. Product pricing is determined at the point revenue is recognized by reference to active and freely traded commodity markets.
Under the Company’s concentrate sales contracts with third-party smelters, final commodity prices are set on a specified quotational period, typically ranging from one month prior to shipment, and can extend to three months after the shipment arrives at the smelter and is based on average market metal prices. Revenues are recorded under these contracts at the time title passes to the buyer based on the expected settlement period using forward market prices. the contracts, in general, provide for a provisional payment based upon provisional assays and quoted metal prices. Final settlement is based on the average applicable price for a specified future period, and generally occurs from three to six months after shipment. Variations between the price recorded at the shipment date and the actual final price set

PAN AMERICAN SILVER CORP. | ANNUAL REPORt 201066
under the smelting contracts are caused by changes in metal prices and result in an embedded derivative in the accounts receivable. the embedded derivative is recorded at fair value each period until final settlement occurs, with the fair value adjustments classified in revenue. Royalties and refining and treatment charges are netted against revenue for sales of metal concentrate.
f. Financial instrumentsthe Company applies as prescribed Section 3855, “Financial Instruments – Recognition and Measurement” of the Canadian Institute of Chartered Accountants’ (“CICA”) Handbook. CICA Standard 3855 establishes standards for recognizing and measuring financial assets, financial liabilities, and non-financial derivatives. Under CICA 3855, all financial assets must be classified as either held-for-trading, available-for-sale, held-to-maturity investments or loans and receivables. All financial liabilities must be classified as held-for-trading or other financial liabilities. All financial instruments, including derivatives, are included on the Consolidated Balance Sheets and are initially measured at fair value. Subsequent measurements and recognition of changes in fair value depend on the instrument’s initial classification. Held-for-trading financial instruments are measured at fair value, and all gains and losses are included in net income (loss) in the period in which they arise. Available- for-sale financial instruments are measured at fair value, determined by published market prices in an active market, except for investments in equity instruments that do not have quoted market prices in an active market which are measured at cost. Changes in fair value are recorded in other comprehensive income (loss) until the assets are removed from the balance sheet. Investments classified as available-for-sale are written down to fair value through income whenever it is necessary to reflect other-than-temporary impairment. Realized gains and losses on the disposal of available-for-sale securities are recognized in investment and other income. Held-to-maturity investments, loans and certain receivables, and other financial liabilities are measured at amortized cost while trade receivables that arose from provisional concentrate sales as described in Note 2(e) are valued using quoted market prices based on the forward London Metal Exchange and the London Bullion Market Association P.M. fix. Also, transaction costs related to all financial assets and liabilities are recorded in the acquisition or issue cost and are amortized to income using the effective interest method, unless the financial instrument is classified as held-for-trading, in which case the transaction costs are recognized immediately in net income (loss).
CICA Section 3855 also requires financial and non-financial derivative instruments to be measured at fair value and recorded as either assets or liabilities. Certain derivatives embedded in non-derivative contracts must also be measured at fair value. Any changes in the fair value of recognized derivatives are included in net income (loss) for the period in which they arise, unless specific hedge accounting criteria are met, as defined in CICA Section 3865. Fair values for the Company’s recognized commodity-based derivatives are based on the forward prices of the associated market index.
the Company has made the following classifications:
–Short-term and other investments including debt and equity securities are classified as “Available for sale securities”. Changes in the market value of the securities are recorded as other comprehensive income.
–Accounts receivable and long term receivables are classified as “Loans and Receivables”. they are recorded upon their initial measurement at fair value, which is equal to their cost. Subsequently, provisionally priced trade accounts receivable are valued using quoted market prices while other accounts receivable and long term receivables are valued at amortized cost. At December 31, 2010, the recorded amount approximates fair value.
–Accounts payable and accrued liabilities and other long term liabilities are classified as “Other financial liabilities”. they are initially measured at their fair value. At December 31, 2010, the recorded amount approximates fair value.
g. Derivatives and trading activitiesthe Company employs metals and currency contracts, including forward contracts to manage exposure to fluctuations in metal prices and foreign currency exchange rates. For metals production, these contracts are intended to reduce the risk of falling prices on the Company’s future sales. Foreign currency derivative financial instruments, such as forward contracts, are used to manage the effects of exchange rate changes on foreign currency cost exposures. Changes in the fair value of derivative instruments are reported in income or in other comprehensive income (“OCI”), depending on the use of the derivative and whether it qualifies for hedge accounting treatment under the provisions of CICA 3865, “Hedges”. Unrealized gains and losses on derivative instruments qualifying as cash flow hedges are recorded in OCI to the extent the hedges are effective, until the underlying transactions are recognized in the Consolidated Statement of Operations. to the extent effective, unrealized gains and losses on the derivative and non-derivative instruments used as hedges of the Company’s net investment in foreign operations are recorded in OCI. the ineffective portions of cash flow hedges and hedges of net investment in foreign operations, if any, are recognized in income immediately. At December 31, 2010 the Company had no derivative positions or net investments in foreign operations to which it was applying hedge accounting. All derivative instruments are recorded on the balance sheet at fair value.
Unrealized gains and losses on derivative instruments designated as fair value hedging instruments, as well as offsetting unrealized gains and losses on the hedged items, are recognized in the Consolidated Statement of Operations in the same accounting period. Unrealized gains and losses on derivative instruments that do not qualify or are not designated as hedges are marked to market at the end of each accounting period with the results included in gain or loss on commodity and foreign currency contracts in the Consolidated Statement of Operations.
Derivatives may be embedded in other financial instruments (host instruments). Embedded derivatives are treated as separate derivatives when their economic characteristics and risks are not closely related to those of the host instrument,

NOtES tO CONSOLIDAtED FINANCIAL StAtEMENtS 67
the terms of the embedded derivative are the same as those of a stand-alone derivative, and the combined contract is not classified as held for trading. these embedded derivatives are measured at fair value on the balance sheet with subsequent changes in fair value recognized in income. the Company selected January 1, 2003 as its transition date for embedded derivatives. the Company has not identified any embedded derivatives that are required to be accounted for separately from the host contract other than those arising from provisionally priced sales mentioned previously.
h. CashCash includes cash in banks, held primarily in U.S. dollars and considered “held-for-trading” and therefore is stated at fair value.
i. short-term investmentsShort-term investments are classified as “available for sale”, and consist of highly-liquid debt securities with original maturities in excess of three months and equity securities. the debt securities include corporate bonds with Standard & Poor’s rating of A - to AAA with an overall average of single A high. these debt and equity securities are initially recorded at fair value, which upon their initial measurement is equal to their cost. Subsequent measurements and changes in the market value of these debt and equity securities are recorded as changes in other comprehensive income. Investments are assessed quarterly for potential impairment.
j. inventoriesInventories include concentrate ore, doré, ore in stockpiles, processed silver, and operating materials and supplies. the classification of inventory is determined by the stage at which the ore is in the production process. Inventories of ore are sampled for metal content and are valued based on the lower of actual production costs incurred or estimated net realizable value based upon the period ending prices of contained metal. Material that does not contain a minimum quantity of metal to cover estimated processing expense to recover the contained metal is not classified as inventory and is assigned no value. All metal inventories are stated at the lower of cost or net realizable value, with cost being determined using the weighted average cost method. Supplies inventories are valued at the lower of average cost and net realizable value, net of obsolescence. Concentrate and doré inventory includes product at the mine site, the port warehouse and product held by refineries, and is also valued at lower of cost or net realizable value. At times, the Company has a limited amount of finished silver at a minting operation where coins depicting Pan American’s emblem are stamped.
k. mineral property, plant and equipmentExpenditures for new facilities, new assets or expenditures that extend the useful lives of existing facilities are capitalized. Maintenance, repairs and renewals are charged to operations. Any gains or losses on disposition of property, plant and equipment are reflected in the statement of operations. Mineral property costs are depreciated using the units-of-production method based upon estimated total proven and probable reserves. Depreciation of plant and equipment is calculated on a straight-line method at rates sufficient to depreciate such costs over the shorter of estimated productive lives of such assets ranging from three to twenty years and the life of the mineral property to which it relates.
l. operational mining properties and mine DevelopmentMineral exploration costs are expensed as incurred. Capitalization of evaluation expenditures commences when there is a high degree of confidence in the project’s viability and hence it is probable that future economic benefits will flow to the Company. Evaluation expenditures, other than that acquired from the purchase of another mining company, are carried forward as an asset provided that such costs are expected to be recouped in full through successful development and exploration of the area of interest or alternatively, by its sale. Evaluation expenditures include delineation drilling, metallurgical evaluations, and geotechnical evaluations amongst others.
When it has been determined that a mineral property can be economically developed as a result of establishing proven and probable reserves (which occurs upon completion of a positive economic analysis of the mineral deposit), the costs incurred to develop such property including costs to further delineate the ore body and remove overburden to initially expose the ore body prior to the start of mining operations, are also capitalized. Such costs are amortized using the units-of-production method over the estimated life of the ore body based on proven and probable reserves.
Costs associated with commissioning activities on constructed plants are deferred from the date of mechanical completion of the facilities until the date the Company is ready to commence commercial service. Any revenues earned during this period are recorded as a reduction in deferred commissioning costs. these costs are amortized using the units-of-production method over the life of the mine, commencing on the date of commercial service.
Acquisition costs related to the acquisition of land and mineral rights are capitalized as incurred. Prior to acquiring such land or mineral rights the Company makes a preliminary evaluation to determine that the property has significant potential to develop an economic ore body. the time between initial acquisition and full evaluation of a property’s potential is dependent on many factors including: location relative to existing infrastructure, the property’s stage of development, geological controls and metal prices. If a mineable ore body is discovered, such costs are amortized when production begins. If no mineable ore body is discovered, such costs are expensed in the period in which it is determined the property has no future economic value. In countries where the Company has paid Value Added tax (“VAt”) and where there is uncertainty of its recoverability, the VAt payments have either been deferred with mineral property costs relating to the property or expensed if it relates to mineral exploration. If the Company ultimately makes recoveries of the VAt, the amount received will be applied to reduce mineral property costs or taken as a credit against current expenses depending on the prior treatment.
Major development expenditures on producing properties incurred to increase production or extend the life of the mine are capitalized while ongoing mining expenditures on producing properties are charged against earnings as incurred. gains or losses from sales or retirements of assets are included in gain or loss on sale of assets.

PAN AMERICAN SILVER CORP. | ANNUAL REPORt 201068
m. asset impairmentManagement reviews and evaluates its long-lived assets for impairment when events or changes in circumstances indicate that the related carrying amounts may not be recoverable. Impairment is considered to exist if total estimated future cash flows or probability-weighted cash flows on an undiscounted basis are less than the carrying amount of the assets, including mineral property, plant and equipment and non-producing property. An impairment loss is measured and recorded based on discounted estimated future cash flows or the application of an expected present value technique to estimate fair value in the absence of a market price. Future cash flows include assumptions related to recoverable proven and probable reserves and a portion of recoverable resources, silver, zinc, copper, lead and gold prices (considering current and historical prices, price trends and related factors), production levels, capital and reclamation costs, all based on detailed engineering life-of-mine plans. Assumptions underlying future cash flow estimates are subject to risks and uncertainties. Any differences between significant assumptions and market conditions and/or the Company’s performance could have a material effect on any impairment provision, and on the Company’s financial position and results of operations. In estimating future cash flows, assets are grouped at the lowest levels for which there are identifiable cash flows that are largely independent of cash flows from other groups. generally, in estimating future cash flows, all assets are grouped at a particular mine for which there is identifiable cash flow.
n. reclamation and remediation CostsEstimated future reclamation and remediation costs are based principally on legal and regulatory requirements.
the asset retirement obligation is measured using assumptions for cash outflows such as expected labor costs, allocated overhead and equipment charges, contractor markup, and inflation adjustments to determine the total obligation. the sum of all these costs is discounted, using the credit adjusted risk-free interest rate from the time the Company expects to pay the retirement obligation to the time the Company incurs the obligation.
Upon initial recognition of a liability for an asset retirement obligation, the Company capitalizes the asset retirement cost to the related long-lived asset. the Company amortizes this amount to operating expense using the units-of-production method. the Company evaluates the cash flow estimates at the end of each reporting period to determine whether the estimates continue to be appropriate. Upward revisions in the amount of undiscounted cash flows will be discounted using the current credit-adjusted risk-free rate. Downward revisions will be discounted using the credit-adjusted risk-free rate that existed when the original liability was recorded.
o. Foreign Currency translationthe Company’s functional currency and that of its subsidiaries is the U.S. dollar. transaction amounts denominated in foreign currencies (currencies other than U.S. dollars) are translated into U.S. dollars at exchange rates prevailing at the transaction dates. Carrying values of foreign currency monetary assets and liabilities are adjusted at each balance sheet date to reflect the U.S. dollar exchange rate prevailing at that date. gains and losses arising from
translation of foreign currency monetary assets and liabilities at each period end are included in earnings.
the accounts of subsidiaries, which are considered to be integrated operations, are translated into U.S. dollars using the temporal method. Under this method, monetary assets and liabilities of foreign subsidiaries are translated at exchange rates in effect at the end of each period and non-monetary assets and liabilities are translated using historical exchange rates. Revenues and expenses are translated at the average exchange rate for the period. Foreign currency transaction gains and losses are included in the determination of net income or loss.
p. stock-based Compensation plansthe Company provides stock grants or options to buy common shares of the Company to directors, officers, employees and service providers. the board of directors grants such options for periods of up to ten years, with vesting periods determined at their sole discretion and at prices equal to or greater than the weighted average market price of the five trading days prior to the date the options were granted.
the Company applies the fair-value method of accounting in accordance with the recommendations of CICA Handbook Section (3870), “Stock-based Compensation and Other Stock-based Payments”. Stock-based compensation expense is calculated using the Black-Scholes option pricing model or by using the market price of the Company’s stock.
q. income taxesthe Company computes income taxes in accordance with CICA Handbook Section (3465), “Income taxes”, which requires an asset and liability approach. this results in the recognition of future tax assets and liabilities for the expected future tax consequences of temporary differences between the carrying amounts and the tax basis of assets and liabilities, as well as operating loss and tax credit carry-forwards, using substantively enacted tax rates in effect in the years in which the differences are expected to reverse. the Company records a valuation allowance against a portion of those future income tax assets except to the extent that management believes they will more likely than not be realized. On business acquisitions, where differences between assigned values and tax bases of assets acquired (other than non-tax deductible goodwill) and liabilities assumed exist, the Company recognizes the future tax assets and liabilities for the tax effects of such differences.
r. earnings (loss) per shareBasic earnings (loss) per share calculations are based on the net income (loss) for the period divided by the weighted average number of common shares issued and outstanding during the period.
the diluted earnings/(loss) per share calculations are based on the weighted average number of common shares outstanding during the period, plus the effects of dilutive common share equivalents. this method requires that the dilutive effect of outstanding options and warrants should be calculated using the treasury stock method. this method assumes that all common share equivalents have been exercised at the beginning of the period (or at the time of issuance, if later), and that the funds obtained thereby were

NOtES tO CONSOLIDAtED FINANCIAL StAtEMENtS 69
used to purchase common shares of the Company at the average trading price of common shares during the period, but only if dilutive.
For convertible securities that may be settled in cash or shares at the holder’s option the more dilutive of cash settlement and share settlement is used in computing diluted earnings/(loss) per share. For settlements in common shares, the if-converted method is used, which requires that returns on senior convertible equity instruments and income charges applicable to convertible financial liabilities be added back to net earnings/(loss), from the beginning of the period (or at the time of issuance, if later).
s. Dividend policyPan American declared its first dividend in February 2010 and a second dividend in August 2010, both in the amount of $0.025 per common share. In November 2010 the Company announced a dividend in the amount of $0.025 per share and increased the frequency of the Company’s dividend distributions from a semi-annual to a quarterly basis. the Company’s policy to distribute dividends reflects its ability to generate substantial cash flows from our operations in a high price environment. With strong cash flow and strong balance sheet, the Company determined that it has the financial resources to return additional value to shareholders while still investing in advanced projects. the amount and timing of any dividends is within the discretion of the Board of Directors. the Board of Directors reviews the dividend policy quarterly based on the Company’s current and projected liquidity profile, and capital requirements for capital projects and potential acquisitions.
t. transition to international Financial reporting standardsthe Accounting Standards Board (AcSB) adopted International Financial Reporting Standards (IFRS) as Canadian gAAP for publicly accountable enterprises for fiscal years beginning on or after January 1, 2011. the Company will report its first consolidated financial statements in accordance with IFRS for the three months ended March 31, 2011, with comparative figures for the corresponding period for 2010. In addition, the adoption date of January 1, 2011 will require the restatement, for comparative purposes, of amounts reported by the Company for its year ending December 31, 2010, and restatement of the opening balance sheet as at January 1, 2010.
3. aCQUisitions oF mineraL interests
aquiline resources inc. (Navidad Project, Chubut, Argentina)During January 2010, Pan American acquired the remaining 7% interest in Aquiline Resources Inc. (“Aquiline”), a Canadian publicly traded company that controls the Navidad Project in Chubut, Argentina, a silver development project, as well as several other early stage development projects in Argentina and Peru. the acquisition was completed in three significant steps. On December 7, 2009 the Company completed the acquisition of 84.5% of the outstanding shares of Aquiline and extended the offer to December 22, 2009 at which time the Company had taken up 93% of the outstanding shares of Aquiline. through a Compulsory Acquisition, on January 22, 2010, the Company acquired the remaining shares of Aquiline achieving 100% ownership. the acquisition was made on the basis of issuing 0.2495 of a Pan American common share, plus 0.1 of a Five
Year Pan American Warrant (“Consideration Warrant”) for each Aquiline Share tendered. Each whole Consideration Warrant will entitle the holder to acquire one Pan American common share at a price of CAD $35.00 per Pan American common share for a period of five years after the date on which Pan American first paid for Aquiline Shares tendered, December 7, 2009. the acquisition of Aquiline was accounted for as an asset acquisition.
the purchase price of the transaction totalled $586.4 million, comprised of approximately 19.6 million Pan American common shares, 7.9 million Consideration Warrants, 0.5 million Replacement Warrants, 0.5 million Replacement Options, 1.7 million common shares and 1.5 million warrants of Aquiline, respectively, held by Pan American prior to the offer and considered disposed of into the transaction, a replacement convertible debenture as discussed below and transaction costs of $6.2 million.
Pan American exchanged and replaced the outstanding options, warrants and the convertible debenture at an exchange ratio of 0.2495 and at strike prices equivalent to the original strike prices divided by 0.2495. Pan American share values utilized for valuing the consideration of shares issued were closing prices on the actual dates of the Pan American shares being issued, with a range of prices used from $23.54 to $25.40.
Consideration warrants were valued using observable market pricing with a range of prices from $4.50 to $5.73 assigned to the consideration warrants issued on the issue dates.
Replacement warrants and options were valued using the Black-Scholes option pricing model. Assumptions used were as follows:
Dividend yield 0%
Expected volatility 52% - 63%
Risk free interest rate 1.5%
Expected life 0 – 2 years
Warrants owned by Pan American prior to the offer and considered disposed into the transaction were valued using the Black-Scholes option pricing model. Assumptions used were as follows:
Dividend yield 0%
Expected volatility 50%
Risk free interest rate 1.3%
Expected life 1.9 years
the Company issued a replacement convertible debenture that allowed the holder to convert the debenture into either 363,854 Pan American shares or a silver stream contract related to certain production from the Navidad project. the Company concluded that the most appropriate guidance regarding treatment of the replacement convertible debenture at the time of acquisition was provided under Canadian gAAP by making reference to the principles in EIC 70 – “Presentation of a Financial Instrument Labeled as a Share when a Future Event or Circumstance may affect the Issuer’s Obligations”. In consideration of EIC-70 and the economic substance of the contract, it was concluded that a liability presentation (Note 12) was the most appropriate and best representation of the economics underlying the contract as of the date the Company assumed the obligation as part of the Aquiline acquisition. On February 25, 2010, subsequent to

PAN AMERICAN SILVER CORP. | ANNUAL REPORt 201070
the acquisition transaction, the counterparty to the replacement debenture indicated its intention to elect the silver stream alternative. the final contract for this alternative is being discussed and pending the final resolution to this alternative, the Company continues to classify the fair value calculated at the acquisition of this alternative as a liability.
the current version of the silver stream alternative allows the counterparty the right to purchase 12.5% of the payable silver produced from the Loma de La Plata zone of the Navidad project for the life of the zone, such right including the right to purchase a minimum of one million ounces of payable silver per year from the zone, or if unavailable, from other production on the Navidad Project, for a minimum of a 12.5 year period. the silver under the silver stream contract will be purchased by the counterparty for the sum of: (a) an upfront payment of CAD $50 million (the ‘‘Upfront Payment’’); and (b) the lesser of $4.00 per ounce of payable silver and the prevailing market price per ounce of payable silver on the London Metals Exchange. the Upfront Payment shall be made by the counterparty as follows: (a) CAD $17.5 million represented by the purchase price of the convertible debenture, which has already been paid; (b) CAD $15.0 million on the Maturity Date; and (c) CAD $17.5 million to be paid in four equal installments over one year, payable starting three months after commencement of construction. the Maturity Date is defined as the date that is the later of: (a) the completion of a feasibility study on the Loma de La Plata zone; (b) the decision and public announcement by the Company to proceed with the construction of a mine; and (c) the receipt of all necessary permits to proceed with the construction of a mine.
the purchase price allocation for the Aquiline transaction was calculated and presented as follows (2010 – 100% ownership completed, 2009 – 93% ownership achieved):
2010 2009
Fair value of Pan American shares issued $ 495,643 452,111
Fair value of Pan American consideration warrants issued
36,824 32,839
Fair value of Pan American replacement warrants issued
8,106 8,106
Fair value of Pan American replacement options issued
1,027 1,027
Fair value of Aquiline units tendered into the transaction
17,771 17,771
Fair value of replacement debenture issued (Note 12) 20,788 20,788
transaction costs 6,207 10,923
purchase Consideration $ 586,366 543,565
the purchase price allocation is as follows:
Net working capital acquired (including cash of $4.3 million)
(4,299) (4,299)
Mineral property, plant and equipment 867,027 813,023
Asset retirement obligation (1,235) (1,235)
Future income tax liability (275,127) (256,211)
Non-controlling interest – (7,713)
$ 586,366 543,565
4. management oF CapitaL
the Company’s objective when managing its capital is to maintain its ability to continue as a going concern while at the same time minimizing the cost of capital and maximizing growth of its business and provide returns to its shareholders. the Company’s capital structure consists of shareholders’ equity, comprising issued share capital plus contributed surplus plus retained earnings, plus accumulated other comprehensive income with a balance of $1.5 billion as at December 31, 2010 (2009 - $1.3 billion). As discussed further in Note 18(c), the Company has available a $150 million credit facility which has not been drawn.
the Company is not subject to externally imposed capital requirements and the Company’s overall strategy with respect to capital risk management remains unchanged from the year ended December 31, 2009.
5. FinanCiaL instrUments
a. overviewthe Company has exposure to risks of varying degrees of significance which could affect its ability to achieve its strategic objectives for growth and shareholder returns. the principal financial risks to which the Company is exposed are metal price risk, credit risk, foreign exchange rate risk, and liquidity risk. the Company’s Board of Directors has overall responsibility for the establishment and oversight of the Company’s risk management framework and reviews the Company’s policies on an ongoing basis.
b. metal price riskMetal price risk is the risk that changes in metal prices will affect the Company’s income or the value of its related financial instruments.
the Company derives its revenue from the sale of silver, zinc, lead, copper, and gold. the Company’s sales are directly dependent on metal prices that have shown extreme volatility and are beyond the Company’s control.
Consistent with the Company’s mission to provide equity investors with exposure to changes in silver prices, Company policy is not to hedge the price of silver.
the Company mitigates the price risk associated with its base metal production by committing some of its forecasted base metal production from time to time under forward sales and option contracts. the Board of Directors continually assesses the Company’s strategy towards its base metal exposure, depending on market conditions. At December 31, 2010, the Company had no contracts in place for sales of future production, except for the Silver Stream contract referred to in Note 3.
c. Credit riskCredit risk is the risk of financial loss to the Company if a customer or counterparty to a financial instrument fails to meets its contractual obligations, and arises principally from the Company’s trade receivables. the carrying value of financial assets represents the maximum credit exposure.
the Company has long-term concentrate contracts to sell the zinc, lead and copper concentrates produced by the Quiruvilca, Huaron, Morococha, San Vicente and La Colorada

NOtES tO CONSOLIDAtED FINANCIAL StAtEMENtS 71
mines. Concentrate contracts are common business practice in the mining industry. At December 31, 2010 the Company had receivable balances associated with buyers of the Company’s concentrates of $51.0 million (2009 - $54.0 million). the vast majority of the Company’s concentrate is sold to four well known concentrate buyers.
Silver doré production from La Colorada, Alamo Dorado and Manantial Espejo is refined under long term agreements with fixed refining terms at three separate refineries worldwide. the Company generally retains the risk and title to the precious metals throughout the process of refining and therefore is exposed to the risk that the refineries will not be able to perform in accordance with the refining contract and that the Company may not be able to fully recover precious metals in such circumstances. At December 31, 2010 the Company had approximately $20.8 million (2009 - $15.1 million) of value, at cost, contained in precious metal inventory at refineries. the Company maintains insurance coverage against the loss of precious metals at the Company’s mine sites, in-transit to refineries and whilst at the refineries.
the Company maintains trading facilities with several banks and bullion dealers for the purposes of transacting the Company’s trading activities. None of these facilities are subject to margin arrangements. the Company’s trading activities can expose the Company to the credit risk of the Company’s counterparties to the extent that the Company’s trading positions have a positive mark-to-market value. However, the Company minimizes this risk by ensuring there is no excessive concentration of credit risk with any single counterparty, by active credit management, and monitoring.
Refined silver and gold is sold in the spot market to various bullion traders and banks. Credit risk may arise from these activities if we are not paid for metal at the time it is delivered, as required by spot sale contracts.
Management constantly monitors and assesses the credit risk resulting from its refining arrangements, concentrate sales and commodity contracts with its refiners, trading counterparties and customers. Furthermore, management carefully considers credit risk when allocating prospective sales and refining business to counterparties. In making allocation decisions, Management attempts to avoid unacceptable concentration of credit risk to any single counterparty.
As at December 31, 2010, Doe Run Peru (“DRP”), one of the buyers of concentrates from the Company’s Peruvian operations, owed to the Company approximately $8.2 million for deliveries of concentrates that occurred in early 2009. the Company established a doubtful accounts receivable provision of $4.4 million of the amount receivable in the second quarter of 2009 and, in addition, reclassified the remaining receivable balance from current assets into long term assets on its consolidated balance sheet at that time which also resulted in a further $0.6 million charge related to the negative present value impact of the expected delay in the recovery of the DRP receivable which was presented as part of other expense on the Consolidated Statement of Operations. On July 27, 2010, DRP failed to restart operations at its La Oroya smelter, as mandated by the Peruvian government. Although the Company will continue to pursue every possible avenue to recover the amounts owed by DRP, the Company increased the doubtful accounts receivable
provision for the remaining $3.2 million of the receivable during the second quarter of 2010. In addition, during the fourth quarter of 2010, the Company wrote down $1.5 million of costs of certain pyrite stockpile inventories that were being sold to the La Oroya smelter after assessing that no other economically viable alternatives to realize upon these inventories could be found.
Other than this receivable with DRP, at December 31, 2010 and December 31, 2009, the Company had no material past due trade receivables or other current receivables and the accounts receivable on the Consolidated Balance Sheets is presented with $ NIL provision for doubtful accounts (December 31, 2009 - $ NIL).
trade accounts receivable and other receivables that represent the maximum credit risk to the Company consist of the following:
2010 2009
trade accounts receivable $ 51,026 $ 53,963
VAt receivable 4,342 3,500
Advances to suppliers and contractors 4,704 3,536
Other 6,821 5,060
Presented as accounts receivable on the Consolidated Balance Sheet
$ 66,893 $ 66,059
Long-term refundable tax receivable and other receivables
28,171 15,734
total $ 95,064 $ 81,793
the Company invests its cash with the objective of maintaining safety of principal and providing adequate liquidity to meet all current payment obligations.
d. Foreign exchange rate riskthe Company reports its financial statements in U.S. dollars (“USD”); however, the Company operates in jurisdictions that utilize other currencies. As a consequence, the financial results of the Company’s operations as reported in USD are subject to changes in the value of the USD relative to local currencies. Since the Company’s sales are denominated in USD and a portion of the Company’s operating costs and capital spending are in local currencies, the Company is negatively impacted by strengthening local currencies relative to the USD and positively impacted by the inverse.
In order to mitigate this exposure, from time to time the Company has purchased Peruvian New soles (“PEN”), Mexican pesos (“MXN”) and Canadian dollars (“CAD”) to match anticipated spending. However, at December 31, 2010, the Company had no forward contracts to purchase foreign currencies. A 10% increase or decrease in the exchange rate of the currencies in the countries that the Company operates relative to the USD would have the effect of a $23.9 million increase or decrease to operating costs on the Company’s 2010 statement of operations. the Company’s net income is also affected by the revaluation of its monetary assets and monetary liabilities at each balance sheet date. the Company has reviewed its monetary assets and monetary liabilities and estimates that a 10% change in the exchange rate of the foreign currencies in which its December 31, 2010 non-USD net monetary liabilities were denominated would result in a

PAN AMERICAN SILVER CORP. | ANNUAL REPORt 201072
f. Fair Value of Financial instrumentsthe carrying value of cash is at fair value, while accounts receivable, accounts payable and accrued liabilities approximate their fair value due to the relatively short periods to maturity and terms of these financial instruments.
Fair value estimates are made at a specific point in time, based on relevant market information and information about the financial instrument. these estimates are subjective in nature and involve uncertainties and matters of significant judgment and, therefore, cannot be determined with precision. Changes in assumptions could significantly affect the estimates.
In 2009 the Accounting Standards Board (“AcSB”) amended the Handbook Section 3862, “Financial Instruments – Disclosures”, to require enhanced disclosures about the relative reliability of the data, or “inputs”, that an entity uses in measuring the fair values of its financial instruments. this amendment substantially aligns Canadian gAAP with U.S. gAAP and as such, the Company’s reporting for this amendment is in line with information previously presented in the reconciliation from Canadian gAAP to U.S. gAAP.
net income change of $38.6 million. the most significant monetary item affected by such movements in foreign currencies is the future income tax liability arising from the Aquiline acquisition with a December 31, 2010 balance of $263.6 million. this liability reflects the difference between the tax values and the accounting book values of the assets purchased. As this balance is deemed to be denominated primarily in Argentine pesos, the Company is required to adjust this liability for any movements in the exchange rate of that currency against the USD. At December 31, 2010 the Company was also holding $100.5 million in CAD in cash and short term investments.
e. Liquidity riskLiquidity risk is the risk that the Company will not be able to meet its financial obligations as they come due. the Company manages its liquidity risk by continuously monitoring forecasted and actual cash flows. the Company has in place a rigorous planning and budgeting process to help determine the funds required to support the Company’s normal operating requirements on an ongoing basis and its expansion plans. the Company strives to maintain sufficient liquidity to meet its short-term business requirements, taking into account its anticipated cash flows from operations, its holdings of cash, and its committed loan facilities.
the Company’s commitments have contractual maturities which are summarized below:
paYments DUe BY perioD – 2010
totaL Less tHan 1 Year 1–3 Years 4–5 Years aFter 5 Years
Capital Lease Obligations $ 158 $ 118 $ 40 $ – $ –
Other current liabilities 113,180 113,180 – – –
Contribution Plan1 4,902 2,451 2,451 – –
total contractual obligations2 $ 118,240 $ 115,749 $ 2,491 $ – $ –
paYments DUe BY perioD – 2009
totaL Less tHan 1 Year 1–3 Years 4–5 Years aFter 5 Years
Capital Lease Obligations $ 669 $ 620 $ 49 $ – $ –
Current liabilities 97,446 97,446 – – –
Contribution Plan1 8,205 2,735 5,470 – –
total contractual obligations2 $ 106,320 $ 100,801 $ 5,519 $ – $ –
1 In June 2008 the Company initiated a 4 year contractual retention plan for key officers and management, further discussed in Note 14. Contract commitments for the plan, payable in CAD, represent minimum payments expected to be paid out, presented above in USD at the year-end rate.
2 Amounts above do not include payments related to the Company’s anticipated asset retirement obligation (Note 11).
the guidance requires that additional disclosure on determining fair value is provided when the volume and level of activity for the asset or liability have significantly decreased and identifying circumstances that indicate when a transaction is not orderly. Also, for investments in debt and equity securities the Company is required to: (i) clarify the interaction of the factors that should be considered when determining whether a debt security is other than temporarily impaired, (ii) provide guidance on the amount of an other-than-temporary impairment recognized for a debt security in earnings and other comprehensive income and (iii) expand the disclosures required for other-than-temporary impairments for debt and equity securities. See tables below for the required disclosure.
this update provided clarification for circumstances in which: (i) a quoted price in an active market for the identical liability is not available, (ii) the liability has a restriction that prevents its transfer, and (iii) the identical liability is traded as an asset in an active market in which no adjustments to the quoted price of an asset are required. the updated guidance is effective for periods ending after September 30, 2009.
the updated guidance established a fair value hierarchy that prioritizes the inputs to valuation techniques used to

NOtES tO CONSOLIDAtED FINANCIAL StAtEMENtS 73
Fair VaLUe at DeCemBer 31, 2009
assets (in thousands of US dollars) totaL LeVeL 1 LeVeL 2 LeVeL 3
Cash $ 100,474 $ 100,474 $ – $ –
Short-term investments $ 92,623 $ 92,623 $ – $ –
Investments $ 1,553 $ 1,553 $ – $ –
Unrealized gain on commodity and foreign currency contracts $ 160 $ – $ 160 $ –
trade receivable from provisional concentrate sales, net $ 53,963 $ – $ 53,963 $ –
$ 248,773 $ 194,650 $ 54,123 $ –
the Company’s cash is classified within Level 1 of the fair value hierarchy because it is valued using quoted market prices.
the Company’s short-term investments and other investments are valued using quoted market prices in active markets and as such are classified within Level 1 of the fair value hierarchy and are primarily money market securities and U.S. treasury securities. the fair value of the investment securities is calculated as the quoted market price of the investment and in the case of equity securities, the quoted market price multiplied by the quantity of shares held by the Company.
the Company’s unrealized gains and losses on commodity and foreign currency contracts are valued using observable market prices and as such are classified as Level 2 of the fair market value hierarchy. As of December 31, 2010, the unrealized gains and losses on commodity and foreign currency contracts was $NIL (2009 - $0.2 million).
the Company’s trade receivable arose from provisional concentrate sales as described in Note 2(e) and are valued using quoted market prices based on the forward London Metal Exchange (“LME”) (copper) (zinc) and (lead) and the London Bullion Market Association P.M. fix (“London P.M. fix”) (gold) (silver).
the total amount of unrealized gains on Available for Sale Securities for the period was included in Accumulated Other Comprehensive Income. this is the result of changes in market values and foreign exchange rates.
measure fair value. the hierarchy gives the highest priority to unadjusted quoted prices in active markets for identical assets or liabilities (Level 1 measurements) and the lowest priority to unobservable inputs (Level 3 measurements). the three levels of the fair value hierarchy under this guidance are described below:
Level 1 Unadjusted quoted prices in active markets that are accessible at the measurement date for identical, unrestricted assets or liabilities;
Level 2 Quoted prices in markets that are not active, or inputs that are observable, either directly or indirectly, for substantially the full term of the asset or liability;
Level 3 Prices or valuation techniques that require inputs that are both significant to the fair value measurement and unobservable (supported by little or no observable market data).
the following table sets forth the Company’s financial assets and liabilities measured at fair value by level within the fair value hierarchy. As required by the guidance, assets and liabilities are classified in their entirety based on the lowest level of input that is significant to the fair value measurement.
Fair VaLUe at DeCemBer 31, 2010
assets (in thousands of US dollars) totaL LeVeL 1 LeVeL 2 LeVeL 3
Cash $ 179,921 $ 179,921 $ – $ –
Short-term investments $ 180,583 $ 180,583 $ – $ –
Investments $ 1,483 $ 1,483 $ – $ –
trade receivable from provisional concentrate sales, net $ 51,026 $ – $ 51,026 $ –
$ 413,013 $ 361,987 $ 51,026 $ –

PAN AMERICAN SILVER CORP. | ANNUAL REPORt 201074
6. sHort term inVestments anD otHer inVestments
DeCemBer 31, 2010 DeCemBer 31, 2009
aVaiLaBLe For saLe Fair VaLUe Cost
aCCUmULateD UnreaLiZeD
HoLDing gains Fair VaLUe Cost
aCCUmULateD UnreaLiZeD
HoLDing gains
Short term investments $ 180,583 $ 172,315 $ 8,268 $ 92,623 $ 92,153 $ 470
Investments1 1,483 405 1,078 1,553 405 1,148
$ 182,066 $ 172,720 $ 9,346 $ 94,176 $ 92,558 $ 1,618
1 Investments in certain equity securities are presented in other assets on the balance sheet (Note 9).
7. inVentories
Inventories consist of:
DeCemBer 31, 2010 DeCemBer 31, 2009
Concentrate inventory $ 14,026 $ 15,379
Stockpile ore 24,182 21,892
Direct smelting ore1 - 1,462
Doré and finished inventory 33,755 27,577
Materials and supplies 34,891 28,147
106,854 94,457
Less: non-current direct smelting ore1 - (1,011)
$ 106,854 $ 93,446
1During 2010, the Company wrote down the direct smelting ore inventories as described in Note 5.
the amounts of inventory recognized as expenses during 2010 and 2009 are equivalent to the cost of sales for the respective periods.
8. mineraL propertY, pLant anD eQUipment
Acquisition costs of investment and non-producing properties together with costs directly related to mine development expenditures are capitalized. Exploration expenditures on investment and non-producing properties are charged to operations in the period they are incurred.
Mineral property, plant and equipment consist of:
DeCemBer 31, 2010 DeCemBer 31, 2009
CostaCCUmULateD
amoriZationnet BooK
VaLUe CostaCCUmULateD
amoriZationnet BooK
VaLUe
Huaron mine, Peru $ 99,427 $ (37,713) $ 61,714 $ 92,768 $ (33,966) $ 58,802
Morococha mine, Peru 116,991 (31,526) 85,465 97,568 (25,140) 72,428
Alamo Dorado mine, Mexico 184,567 (96,484) 88,083 181,903 (68,320) 113,583
La Colorada mine, Mexico 62,393 (36,598) 25,795 53,951 (33,239) 20,712
Manantial Espejo mine, Argentina 307,644 (71,489) 236,155 311,357 (37,993) 273,364
San Vicente mine, Bolivia 111,167 (24,097) 87,070 105,445 (12,543) 92,902
Other 4,851 (2,441) 2,410 2,229 (1,222) 1,007
total $ 887,040 $ (300,348) $ 586,692 $ 845,221 $ (212,423) $ 632,798
non-proDUCing properties:
Morococha, Peru 17,766 19,012
Aquiline group (Navidad project) 886,401 804,308
Other 1,679 1,606
total Non-producing properties $ 905,846 $ 824,926
total mineral property, plant and equipment $ 1,492,538 $ 1,457,724

NOtES tO CONSOLIDAtED FINANCIAL StAtEMENtS 75
Major categories of depreciable and depletable assets consist of:
2010 2009
Plant and equipment $ 431,590 $ 362,991
Mineral properties and mine development 445,519 472,310
Capital lease (equipment) 9,935 9,920
887,043 845,221
Less: Accumulated depletion and depreciation (294,578) (208,643)
Depreciation of capitalized lease equipment (5,770) (3,780)
(300,348) $ (212,423)
$ 586,692 $ 632,798
a. Write-Down of mining assetsAnnually, or more frequently as circumstances require, the Company performs property evaluations to assess the recoverability of its mining properties. Mine asset impairment analyses are performed on all of the Company’s properties and investments using a combination of historic and forecast prices as well as considering qualitative factors. the Company determined that there are no write-downs required in the carrying values of mining properties and investments in 2010 (2009 – NIL). In 2008, the Company recorded a write-down of carrying value of its Quiruvilca silver and zinc mine in Peru totaling $15.1 million, as a result of a sharp decline in zinc prices.
b. navidad project, argentinaDuring the year ended December 31, 2010, the Company capitalized $29.1 million of evaluation costs at the Navidad Project in Argentina including $3.6 million in VAt ($NIL million 2009 due to the acquisition occurring in December 2009 as described in Note 3).
c. morococha mine, peruDuring the second quarter of 2010, the Company’s wholly owned subsidiary Compañia Minera Argentum S.A. (“Argentum”), reached an agreement with Minera Chinalco Perú (“MCP” or “Chinalco”), a subsidiary of the Aluminum Corporation of China which clearly defines each party’s long term surface rights in the area of the Morococha mine. the primary focus of the agreement is on the lands and concessions around the Morococha mine and MCP’s toromocho copper project. MCP requires certain lands and concessions in order to proceed with the development of toromocho, including the surface lands within the planned open pit mining area of the toromocho project. While Argentum does not own this land, much of the Morococha mine infrastructure and facilities are located on this ground.
Under the terms of the agreement, Argentum will relocate the core Morococha facilities over a 5 year period and transfer certain mineral concessions and access rights to MCP. In exchange, Argentum will receive a package of surface rights, easements and other rights that are sufficient to relocate the facilities and to continue uninterrupted operations. Lastly, Argentum will receive periodic cash payments from MCP totaling $40 million, of which, to December 31, 2010, the Company has received $7.8 million which have been utilized and offset against capital expenditures incurred for the project as well as direct project related expenses. the Company has also entered into a funding arrangement
whereby it receives additional advances towards some of the project capital expenditures (Note 12).
d. La preciosa project, Durango, mexicoIn April, 2009, Pan American and Orko Silver Corp. (‘‘Orko’’) entered into an agreement, pursuant to which Pan American and Orko agreed to form a joint venture to develop the La Preciosa silver project located in the State of Durango, Mexico. Under the terms of the agreement, in order for the Company to retain its 55% interest in the venture: (a) the Company must, in addition to contributing its mine development expertise, spend a minimum of $5 million in the first 12 months from the date of the Joint Venture Letter Agreement (the condition was achieved as of the first quarter of 2010) and conduct resource definition drilling, acquire necessary surface rights, obtain permits, and prepare a feasibility study over the following 24 month period; and (b) following a positive construction decision, the Company must contribute 100% of the funds necessary for practical completion of an operating mine. In exchange for its 45% interest in the venture, Orko agreed to contribute its exploration expertise and the La Preciosa Project and related concessions.
Until such time as an economic analysis is completed and proven and probable reserves are established, costs incurred through the joint venture company will be expensed and no value has been attributed to the property contributed by Orko. the Company has assessed the operating company of the La Preciosa project to be a variable interest entity as contemplated under Acg-15 with the Company being the primary beneficiary of the joint venture and as such, it is consolidated in the financial statements of the Company. For the year ended December 31, 2010, the exploration expense recognized arising from the La Preciosa project is $10.0 million, and exploration spending since the start of the project through to December 31, 2010 is $14.0 million.
9. otHer assets
Other assets consist of:
2010 2009
Long-term receivable net1 $ – $ 3,825
Reclamation bonds 135 132
Investments (Note 6) 1,483 1,553
Non-current direct smelting ore (Note 7)2 – 1,011
$ 1,618 $ 6,521
1 the Company provided for 100% of certain long term receivables in 2010 as described in Note 5.
2 During 2010, the Company wrote down the direct smelting ore inventory as described in Note 5 & 7.

PAN AMERICAN SILVER CORP. | ANNUAL REPORt 201076
10. aCCoUnts paYaBLe anD aCCrUeD LiaBiLities
Account payable and accrued liabilities consist of:
2010 2009
trade accounts payable $ 23,746 $ 29,836
Other accounts payable and trade related accruals
17,230 18,108
Acquisition costs payable – 7,582
Payroll and related benefits 18,386 12,848
Severance accruals 6,464 4,781
Payment due for mineral property acquired in the Aquiline transaction
– 5,799
Advances on concentrate 38 5,668
Other taxes payable 3,842 1,862
Other 11,524 9,675
$ 81,230 $ 96,159
11. proVision For asset retirement oBLigation anD reCLamation
the total undiscounted amount of estimated cash flows required to settle the Company’s asset retirement obligations is $72.1 million (2009 - $67.1 million) which has been discounted using discount rates of between 3% and 19%. Reclamation obligations at the Quiruvilca mine of $17.6 million are expected to be paid starting in two to five years while the remainder of the obligations is expected to be paid through 2028. Revisions made to the reclamation obligations in 2010 were primarily a result of increased site disturbance and from the ordinary course of operations at the mines. Reclamation obligations will be funded from operating cash flows, reclamation deposits and cash on hand.
A summary of the Company’s provision for asset retirement obligation and reclamation is presented below:
2010 2009 2008
Balance at January 1 $ 62,775 $ 57,323 $ 50,370
Reclamation expenditures (1,045) (992) (167)
Accretion expense 2,929 2,998 2,687
Revisions in estimated cash flows 4,804 2,211 4,433
Reclamation obligations assumed on acquisitions
– 1,235 –
Balance at December 31, 2009 $ 69,463 $ 62,775 $ 57,323
12. otHer LiaBiLities
2010 2009
Liability arising from Aquiline acquisition
(Note 3)
$ 20,788 $ 20,788
Equipment and construction advance (Note 8) 5,360 –
Long term labour related legal liabilities 2,466 –
$ 28,614 $ 20,788

NOtES tO CONSOLIDAtED FINANCIAL StAtEMENtS 77
13. aCCUmULateD otHer CompreHensiVe inCome (Loss)
2010 2009 2008
Accumulated other comprehensive income, beginning of period $ 1,618 $ (232) $ (8,650)
Unrealized gains on available for sale securities 8,025 17,079 9,913
Unrealized gain reversed upon disposal of shares in acquisition of mineral interests – (8,710) –
Reclassification adjustment for gains included in income (297) (6,519) (1,495)
Balance at end of year $ 9,346 $ 1,618 $ (232)
Accumulated other comprehensive income / (loss) comprises unrealized gains and losses on short-term investments and other investments designated as “available for sale”.
14. sHare CapitaL anD stoCK Compensation pLan
the Company has a comprehensive stock compensation plan for its employees, directors and officers. the plan provides for the issuance of common shares and stock options, as incentives. the maximum number of Shares which may be issued pursuant to options granted or bonus Shares issued under the 2008 Plan may be equal to, but will not exceed 6,461,470 Shares. the exercise price of each option shall be the weighted average trading price of the Company’s stock for the five days prior to the award date. the options can be granted for a maximum term of 10 years with vesting provisions determined by the Company’s Board of Directors. Any modifications to the stock Compensation Plan require shareholders’ approval.
the Board has developed long term incentive plan (“LtIP”) guidelines, which provides annual compensation to the senior managers of the Company based on the long term performance of both the Company and the individuals that participate in the plan. the LtIP consists of an annual grant of options to senior management to buy shares of the Company and a grant of the Company’s common shares with a two year no trading legend. the options are five year options which vest in three installments, one third on the first anniversary of the grant date and one third on each of the second and third anniversary dates of the award. Options and common shares granted under the LtIP plan are based on employee salary levels, individual performance and their future potential. the Compensation Committee oversees the LtIP on behalf of the Board of Directors. the LtIP plan guidelines can be modified or suspended, at the discretion of the Compensation Committee and the Board of Directors.
transactions concerning stock options and share purchase warrants are summarized as follows in Canadian dollars (“CAD”):
inCentiVe stoCK option pLan sHare pUrCHase WarrantstotaL
sHaressHares priCe CaD$ sHares priCe CaD$
As at December 31, 2007 620,559 $ 18.52 4,010,108 $ 12.33 4,630,667
granted 147,057 $ 36.66 – $ – 147,057
Exercised (129,371) $ 20.73 (3,969,016) $ 12.31 (4,098,387)
Expired – $ – (41,092) $ 12.00 (41,092)
Forfeited (23,605) $ 31.82 – $ – (23,605)
As at December 31, 2008 614,640 $ 21.88 – $ – 614,640
granted 442,008 $ 17.73 – $ – 442,008
Issued on acquisition 517,709 $ 46.11 7,702,698 $ 33.56 8,220,407
Exercised (32,000) $ 14.85 – $ – (32,000)
Expired (37,000) $ 24.87 – $ – (37,000)
Forfeited (36,231) $ 20.67 – $ – (36,231)
As at December 31, 2009 1,469,126 $ 29.66 7,702,698 $ 33.56 9,171,824
granted 558,249 $ 27.43 – $ – 558,249
Issued on acquisition – $ – 702,540 $ 35.00 702,540
Exercised (450,587) $ 16.72 (399,005) $ 11.57 (849,592)
Expired – $ – (51,488) $ 52.10 (51,488)
Forfeited (128,392) $ 23.93 – $ – (128,392)
as at December 31, 2010 1,448,396 $ 32.95 7,954,745 $ 34.67 9,403,141

PAN AMERICAN SILVER CORP. | ANNUAL REPORt 201078
a. Long term incentive and option planIn January, 2010 the Company awarded 31,824 shares of common stock with a two year holding period and granted 281,921 options under this plan. the Company used as its assumptions for calculating fair value a risk free interest rate of 2.0 percent, weighted average volatility of 57 percent, expected lives ranging from 1.5 to 3 years based on historical experience dividend yield of zero, and an exercise price of CAD $25.19 per share. the weighted average fair value of each option was determined to be CAD $8.53.
In February, 2010 the Company granted a further 156,712 options under the guidelines of this plan as a transactional award to certain employees arising from the Aquiline acquisition described in Note 3. the Company used as its assumptions for calculating fair value a risk free interest rate of 1.5 percent, weighted average volatility of 55 per cent, expected lives ranging from 1.5 to 3 years based on historical experience, dividend yield of zero, and an exercise price of CAD $22.23 per share. the weighted average fair value of each option was determined to be CAD $8.04. the options are unvested at the grant date and will vest only when a positive construction decision is made by the Board with regards to the Navidad project and only if that decision is made no later than 3 years from the grant date of the options.
Finally, in December, 2010 the Company also awarded 42,944 shares of common stock with a two year holding period and granted 114,405 options under this plan (the LtIP is typically an annual grant with only a timing difference that resulted in the second grant in 2010 in lieu of an early January grant). the Company used as its assumptions for calculating fair value a risk free interest rate of 1.6 per cent, weighted average volatility of 46 percent, expected lives ranging from 1.8 to 3 years based on historical experience, dividend yield of 0.3 percent, and an exercise price of CAD $40.22 per share. the weighted average fair value of each option was determined to be CAD $11.12.
During the year ended December 31, 2010, 450,587 common shares were issued for proceeds of $7.3 million in connection with the exercise of options under the plan (2009 – 32,000 and $0.4 million).
the following table summarizes information concerning stock options outstanding and options exercisable as at December 31, 2010. the underlying options agreements are specified in Canadian dollar amounts and includes options issued as part of the acquisition of Aquiline Resources Inc. (Replacement Options as discussed in Note 3):
options oUtstanDing options exerCisaBLe
range oF exerCise priCes
CaD$
nUmBer oUtstanDing as at
DeCemBer 31, 2010
WeigHteD aVerage remaining ContraCtUaL
LiFe (montHs)WeigHteD aVerage
exerCise priCe CaD$
nUmBer exerCisaBLe as at
DeCemBer 31, 2010WeigHteD aVerage
exerCise priCe CaD$
$ 17.73 - 22.23 411,283 42.05 $ 19.19 42,764 $ 17.73
$ 22.24 - 28.41 347,761 39.79 $ 26.09 107,589 $ 28.10
$ 33.00 - 36.66 125,850 21.91 $ 36.20 88,121 $ 36.00
$ 40.22 - 48.10 563,502 18.19 $ 46.50 449,097 $ 48.10
1,448,396 30.47 $ 32.95 687,571 $ 41.53
For the year ended December 31, 2010, the total employee stock-based compensation expense recognized in the statement of operations was $4.0 million (2009 – $2.4 million, 2008 – $2.2 million).
b. share purchase Warrants
In the fourth quarter of 2009 and the first quarter of 2010 as described in Note 3, the Company issued share purchase warrants (Consideration and Replacement Warrants) in connection with the acquisition of Aquiline Resources Inc. the following table summarizes information concerning warrants outstanding and warrants exercisable as at December 31, 2010.
Warrants oUtstanDing Warrants exerCisaBLe
range oF exerCise priCes
CaD$
nUmBer oUtstanDing as at
DeCemBer 31, 2010
WeigHteD aVerage remaining ContraCtUaL
LiFe (montHs)WeigHteD aVerage
exerCise priCe CaD$
nUmBer exerCisaBLe as at
DeCemBer 31, 2010WeigHteD aVerage
exerCise priCe CaD$
$ 10.02 106,037 9.69 $ 10.02 106,037 $ 10.02
$ 35.00 7,848,708 47.35 $ 35.00 7,848,708 $ 35.00
7,954,745 46.73 $ 34.67 7,954,745 $ 34.67
c. Key employee Long term Contribution planAn additional element of the Company’s compensation structure is a retention program known as the Key Employee Long term Contribution Plan (the “Contribution Plan”). the Contribution Plan was approved by the directors of the Company on June 2, 2008 in response to a heated labour market situation in the mining sector, and is intended to reward certain key employees of the Company over a fixed time period for remaining with the Company.

NOtES tO CONSOLIDAtED FINANCIAL StAtEMENtS 79
the Contribution Plan is a four year plan with a percentage of the retention bonus payable at the end of each year of the program. the Contribution Plan design consists of three bonus levels that are commensurate with various levels of responsibility, and provides for a specified annual payment for four years starting in June 2009. Each year, the annual contribution award will be paid in the form of either cash or shares of the Company. the minimum aggregate value that will be paid in cash or issued in shares over the 4 year period of the Plan is CAD $10.4 million with CAD $4.9 million remaining to be paid as of December 31, 2010 as described in Note 5. Currently, it is planned that any such payments will be made by way of cash. No shares will be issued from the treasury pursuant to the Contribution Plan without the prior approval of the plan by the shareholders of the Company and any applicable securities regulatory authorities.
15. earnings per sHare (BasiC anD DiLUteD)
For the years ended December 31 (income and shares in thousands)
2010 2009 2008
inCome (nUmerator)
sHares (Denominator)
per-sHare
amoUntinCome
(nUmerator)
sHares (Denominator)
per-sHare
amoUntinCome
(nUmerator)
sHares (Denominator)
per-sHare
amoUnt
Net Income $ 112,573 $ 61,998 $ 24,602
Basic EPS $ 112,573 106,969 $ 1.05 $ 61,998 87,578 $ 0.71 $ 24,602 80,236 $ 0.31
Effect of Dilutive Securities:
Stock Options – 308 – 151 – 223
Warrants – 298 – 22 – 314
Diluted EPS $ 112,573 107,575 $ 1.05 $ 61,998 87,751 $ 0.71 $ 24,602 80,773 $ 0.30
Potentially dilutive securities excluded in the Diluted EPS calculation for the years ended December 31, 2010, 2009 or 2008 were out-of-money options and warrants (2010 – 8,631,999, 2009 – 7,998,811, 2008 – 391,453).
16. CHanges in non-CasH operating WorKing CapitaL items
the following table summarizes the changes in operating working capital items:
Year enDeD DeCemBer 31
CHanges in non-CasH WorKing CapitaL items 2010 2009 2008
Accounts receivable and other current assets $ (2,905) $ (26,772) $ 9,047
Inventories (12,097) (15,162) (21,175)
Prepaid expenses (3,908) 1,536 (700)
Accounts payable and other current liabilities 5,749 629 (1,697)
Income taxes payable 37,108 3,987 8,121
$ 23,947 $ (35,782) $ (6,404)
17. segmenteD inFormation
All of the Company’s operations are within the mining sector, conducted through operations in six countries. Due to geographic and political diversity, the Company’s mining operations are decentralized whereby Mine general Managers are responsible for achieving specified business results within a framework of global policies and standards. Country corporate offices provide support infrastructure to the mines in addressing local and country issues including financial, human resources, and exploration support. the Company has a separate budgeting process and measures the results of operations and exploration activities independently. the Corporate office provides support to the mining and exploration activities with respect to financial, human resources and technical support. Major products are Silver, Zinc, Lead and Copper produced from mines located in Mexico, Peru, Argentina and Bolivia. Segments have been aggregated where operations in specific regions have similar products, production processes, type of customers and economic environment.

PAN AMERICAN SILVER CORP. | ANNUAL REPORt 201080
For tWeLVe montHs enDeD DeCemBer 31, 2010
perU mexiCo argentina BoLiVia
otHer totaLHUaron moroCoCHa QUirUViLCaaLamo
DoraDoLa
CoLoraDamanantiaL
espejo aQUiLine san
ViCente
Sales to external customers $ 75,759 $ 88,708 $ 50,792 $ 147,465 $ 73,428 $ 137,330 $ – $ 58,504 $ – $ 631,986
Depreciation and amortization $ (3,996) $ (6,829) $ – $ (27,406) $ (4,597) $ (30,848) $ (279) $ (12,256) $ (270) $ (86,483)
Exploration and project development $ – $ – $ – $ (25) $ (598) $ (1,262) $ (8,551) $ – $ (14,091) $ (24,527)
Accretion of asset retirement obligation $ (575) $ (223) $ (395) $ (444) $ (322) $ (709) $ – $ (261) $ – $ (2,929)
Interest and financing expenses $ (134) $ (204) $ (165) $ – $ – $ (211) $ (11) $ (267) $ (1,069) $ (2,061)
Investment and other (expenses) income $ 1,575 $ 1,506 $ (132) $ 243 $ 1,747 $ 170 $ (212) $ – $ 591 $ 5,488
Foreign exchange (losses) gains $ 1,150 $ (645) $ (2,632) $ (1,640) $ 125 $ 220 $ 10,887 $ 211 $ 3,382 $ 11,058
gain (loss) on commodity and foreign currency contracts $ (7) $ (41) $ (34) $ – $ – $ – $ – $ – $ (155) $ (237)
gain (loss) on sale of assets $ 13 $ 640 $ – $ (17) $ (6) $ – $ – $ 21 $ – $ 651
Income (loss) before income taxes $ 15,592 $ 26,163 $ 11,896 $ 76,343 $ 33,773 $ 33,592 $ 1,714 $ 20,155 $ (15,668) $ 203,560
Net income for the year $ 10,192 $ 18,944 $ 7,580 $ 51,489 $ 21,945 $ 18,218 $ 1,531 $ 4,029 $ (21,355) $ 112,573
Capital expenditures $ 6,606 $ 16,685 $ – $ 2,132 $ 9,118 $ 7,021 $ 35,605 $ 6,007 $ 196 $ 83,370
Segment assets $ 63,576 $ 145,505 $ 70,455 $ 143,593 $ 50,518 $ 329,928 $ 887,865 $ 120,962 $ 260,206 $ 2,072,608
Long-lived assets $ 61,714 $ 103,231 $ – $ 88,083 $ 25,795 $ 236,155 $ 886,401 $ 87,070 $ 4,079 $ 1,492,538
For tWeLVe montHs enDeD DeCemBer 31, 2009
perU mexiCo argentina BoLiVia
otHer totaLHUaron moroCoCHa QUirUViLCaaLamo
DoraDoLa
CoLoraDamanantiaL
espejo aQUiLine san
ViCente
Sales to external customers $ 62,101 $ 63,445 $ 36,911 $ 98,178 $ 54,277 $ 103,244 $ – $ 36,656 $ – $ 454,812
Depreciation and amortization $ (3,902) $ (6,783) $ (661) $ (24,853) $ (11,509) $ (28,733) $ – $ (6,456) $ (272) $ (83,169)
Exploration and project development $ – $ – $ – $ (762) $ (1,223) $ (1,132) $ (631) $ 1 $ (6,186) $ (9,934)
Accretion of asset retirement obligation $ (605) $ (240) $ (785) $ (401) $ (370) $ (417) $ – $ (180) $ – $ (2,998)
Interest and financing expenses $ (82) $ (76) $ (95) $ – $ – $ – $ – $ (5) $ (4,034) $ (4,292)
Investment and other (expenses) income $ (406) $ (522) $ (2,895) $ (126) $ (35) $ (2,169) $ – $ 3 $ 4,683 $ (1,467)
Foreign exchange (losses) gains $ (2,810) $ (4,050) $ 4,505 $ (1,979) $ 138 $ 693 $ 656 $ (56) $ 1,885 $ (1,018)
gain (loss) on commodity and foreign currency contracts $ 739 $ 1,129 $ 397 $ – $ – $ – $ – $ – $ (347) $ 1,918
gain (loss) on sale of assets $ (15) $ (16) $ – $ (267) $ (18) $ – $ – $ 77 $ 19 $ (220)
Income (loss) before income taxes $ 10,684 $ 6,027 $ 6,340 $ 26,685 $ 11,346 $ 14,747 $ 66 $ 15,241 $ (1,382) $ 89,754
Net income for the year $ 7,819 $ 2,510 $ 3,818 $ 16,514 $ 7,288 $ 11,131 $ 66 $ 14,278 $ (1,426) $ 61,998
Capital expenditures $ 6,970 $ 8,251 $ – $ 1,266 $ 3,078 $ 13,461 $ – $ 18,992 $ 733 $ 52,751
Segment assets $ 66,436 $ 116,829 $ 45,588 $ 157,081 $ 48,026 $ 337,170 $ 819,330 $ 128,755 $ 129,394 $ 1,848,609
Long-lived assets $ 58,802 $ 91,440 $ – $ 113,583 $ 20,712 $ 273,364 $ 804,308 $ 92,902 $ 2,613 $ 1,457,724
For tWeLVe montHs enDeD DeCemBer 31, 2008
perU mexiCo argentina BoLiVia
otHer totaLHUaron moroCoCHa QUirUViLCaaLamo
DoraDoLa
CoLoraDamanantiaL
espejo san
ViCente
Sales to external customers $ 67,795 $ 65,882 $ 34,126 $ 105,137 $ 57,729 $ (11) $ 7,942 $ – $ 338,600
Depreciation and amortization $ (3,361) $ (4,749) $ (1,398) $ (27,894) $ (7,205) $ – $ (1,510) $ (232) $ (46,349)
Exploration and project development $ – $ – $ – $ (1,973) $ (1,847) $ (305) $ 86 $ (1,455) $ (5,494)
Accretion of asset retirement obligation $ (574) $ (361) $ (1,044) $ (382) $ (326) $ – $ – $ – $ (2,687)
Interest and financing expenses $ (216) $ (209) $ (169) $ (55) $ – $ – $ (15) $ (287) $ (951)
Investment and other (expenses) income $ (1,163) $ 1,132 $ (3,536) $ (7,804) $ (1,107) $ 88 $ (197) $ 10,617 $ (1,970)
Foreign exchange (losses) gains $ (495) $ (860) $ (626) $ 12,604 $ (1,426) $ 840 $ 258 $ (16,442) $ (6,147)
gain (loss) on commodity and foreign currency contracts $ (1,127) $ (2,657) $ (338) $ – $ – $ – $ – $ 2,503 $ (1,619)
Writedown on a mining asset $ – $ – $ (15,117) $ – $ – $ – $ – $ – $ (15,117)
gain (loss) on sale of assets $ – $ (25) $ (2) $ (121) $ – $ – $ 53 $ 1,093 $ 998
Income (loss) before income taxes $ 12,223 $ 11,132 $ (15,607) $ 41,324 $ 12,279 $ 612 $ 817 $ (13,748) $ 49,032
Net income for the year $ 8,225 $ 6,335 $ (12,227) $ 30,189 $ 5,863 $ (471) $ 436 $ (13,748) $ 24,602
Capital expenditures $ 13,472 $ 18,809 $ 5,295 $ 1,835 $ 11,929 $ 134,826 $ 56,196 $ 1,438 $ 243,800
Segment assets $ 66,161 $ 107,085 $ 27,386 $ 179,621 $ 49,629 $ 316,929 $ 98,443 $ 28,129 $ 873,383
Long-lived assets $ 55,552 $ 89,665 $ – $ 136,034 $ 30,123 $ 296,319 $ 86,885 $ 2,483 $ 697,061

NOtES tO CONSOLIDAtED FINANCIAL StAtEMENtS 81
DeCemBer 31
proDUCt reVenUe 2010 2009 2008
Silver / doré $ 313,286 $ 215,562 $ 131,160
Zinc concentrate 75,345 46,378 40,335
Lead concentrate 97,538 73,295 81,234
Copper concentrate 160,384 128,104 88,341
Silver pyrites – 754 2,435
Royalties (14,567) (9,281) (4,905)
total $ 631,986 $ 454,812 $ 338,600
the Company has 13 customers that account for 100% of the concentrate and doré sales revenue. the Company has 4 customers that accounted for 24%, 22%, 18% and 11% of total sales in 2010, and 4 customers that accounted for 25%, 22%, 16% and 15% of total sales in 2009 (2008 – 4 customers with 22%, 16%, 14%, and 13% of sales, respectively). the loss of certain of these customers or curtailment of purchases by such customers could have a material adverse affect on the Company’s results of operations, financial condition, and cash flows.
18. Commitments anD ContingenCies
a. generalthe Company is subject to various investigations, claims and legal and tax proceedings covering matters that arise in the ordinary course of business activities. Each of these matters is subject to various uncertainties and it is possible that some of these matters may be resolved unfavorably to the Company. Certain conditions may exist as of the date the financial statements are issued, which may result in a loss to the Company but which will only be resolved when one or more future events occur or fail to occur.
b. purchase Commitmentsthe Company had no purchase commitments other than those commitments described in Note 5.
c. Credit FacilityOn October 10, 2008, Pan American entered into a $70 million revolving credit facility (“the Facility”) with Scotia Capital and Standard Bank Plc (“the Lenders”). the purpose of the Facility is for general corporate purposes, including acquisitions. the Facility, which is principally secured by a pledge of Pan American’s equity interests in its material subsidiaries, had a term of four years. On December 20, 2010 the Company amended the Facility by, among other things, extending the term to December 20, 2014 and increased the amount of the Facility to $150 million by expanding the number of Lenders to include West LB, CIBC and BMO. the interest margin on the renewed Facility ranges from 3.00% to 4.00% over LIBOR, based on the Company’s net debt to EBItDA ratio. Pan American has agreed to pay a commitment fee of between 0.90% and 1.20% on undrawn amounts under the Facility, depending on the Company’s net debt to EBItDA ratio. As at December 31, 2010, the Company has made no drawings under this Facility.
d. environmental mattersthe Company’s mining and exploration activities are subject to various laws and regulations governing the protection of the environment. these laws and regulations are continually
changing and are generally becoming more restrictive. the Company conducts its operations so as to protect the public health and environment and believes its operations are in compliance with applicable laws and regulations in all material respects. the Company has made, and expects to make in the future, expenditures to comply with such laws and regulations, but cannot predict the full amount of such future expenditures.
Estimated future reclamation costs are based principally on legal and regulatory requirements. As of December 31, 2010 and December 31, 2009, $69.5 million and $62.8 million, respectively, were accrued for reclamation costs relating to mineral properties in accordance with CICA Section 3110, “Asset Retirement Obligations”. See also Note 11.
e. income taxesthe Company operates in numerous countries around the world and accordingly it is subject to, and pays annual income taxes under the various income tax regimes in the countries in which it operates. Some of these tax regimes are defined by contractual agreements with the local government, and others are defined by the general corporate income tax laws of the country. the Company has historically filed, and continues to file, all required income tax returns and to pay the taxes reasonably determined to be due. the tax rules and regulations in many countries are highly complex and subject to interpretation. From time to time the Company is subject to a review of its historic income tax filings and in connection with such reviews, disputes can arise with the taxing authorities over the interpretation or application of certain rules to the Company’s business conducted within the country involved.
f. Capital Leasesthe following is a schedule of future minimum lease payments classified as capital leases at December 31, 2010 together with the balance of the obligation under the capital lease as identified in Note 5:
Year enDing DeCemBer 31 CapitaL Leases
2011 $ 124
2012 $ 35
2013 $ 5
total future minimum payments $ 164
Less amount representing interest $ (6)
Present value of leases $ 158
g. other Legal mattersthe Company is subject to various claims and legal proceedings covering a wide range of matters that arise in the ordinary course of business activities, many of them relating to ex-employees. Each of these matters is subject to various uncertainties and it is possible that some of these matters may be resolved unfavorably to the Company. the Company establishes provisions for matters that are probable and can be reasonably estimated, included within current liabilities, and amounts are not considered material.
In assessing loss contingencies related to legal proceedings that are pending against the Company or unasserted claims that may result in such proceedings, the Company and its

PAN AMERICAN SILVER CORP. | ANNUAL REPORt 201082
legal counsel evaluate the perceived merits of any legal proceedings or unasserted claims as well as the perceived merits of the amount of relief sought or expected to be sought.
h. title riskAlthough the Company has taken steps to verify title to properties in which it has an interest, these procedures do not guarantee the Company’s title. Property title may be subject to, among other things, unregistered prior agreements or transfers and may be affected by undetected defects.
i. royalty agreements and participation agreements the Company has various royalty agreements on certain mineral properties entitling the counterparties to the agreements to receive payments per terms as summarized below. Royalty liabilities incurred on acquisitions of properties are netted against mineral property while royalties that become payable upon production are expensed at the time of sale of the production as an offset to gross sales.
Huaron, Quiruvilca and morococha minesIn June 2004, Peru’s Congress approved a new bill that allows royalties to be charged on mining projects. these royalties are payable on Peruvian mine production at the following progressive rates: (i) 1.0% for companies with sales up to $60 million; (ii) 2.0% for companies with sales between $60 million and $120 million; and (iii) 3.0% for companies with sales greater than $120 million. this royalty is a net smelter returns royalty, the cost of which is deductible for income tax purposes. Because the Huaron and Quiruvilca mines are one legal entity, this royalty is calculated on the cumulative production of both mines while the calculation of the royalty on Morococha’s production is done on this mine alone.
manantial espejo mineProduction from the Manantial Espejo property is subject to royalties to be paid to Barrick according to the following: (i) $0.60 per metric tonne of ore mined from the property and fed to process at a mill or leaching facility to a maximum of 1 million tonnes; and (ii) one-half of one percent (0.5%) of net smelter returns derived from the production of minerals from the property. In addition, the Company has negotiated a royalty equal to 3.0% of operating cash flow payable to the Province of Santa Cruz.
san Vicente minePursuant to an option agreement entered into with COMIBOL, the Bolivian state mining company, with respect to the development and operation of the San Vicente property, the Company is obligated to pay COMIBOL a participation fee of 37.5% of the operations cash flow from operations, with the participation fee reduced by 75% until the Company recovers its investment in the property.
A royalty is also payable to EMUSA, a former partner of the Company on the project. the royalty is a 2% net smelter royalty payable only after the Company has recovered its capital investment in the project and only when the average price of silver in a given financial quarter is $9.00 per ounce or greater.
In December 2007, the Bolivian government introduced a new mining royalty that affects the San Vicente project. the royalty is applied to gross metal value of sales (before smelting and refining deductions) and the royalty percentage is a sliding scale depending on metal prices. At current metal prices, the royalty is 6% for silver metal value and 5% for zinc and copper metal value of sales. the royalty is income tax deductible; however, it is not creditable.
19. inCome taxes
DeCemBer 31 2010 2009 2008
Current income taxes $ 73,760 $ 25,643 $ 21,220
Future income taxes $ 17,227 $ 2,113 $ 3,210
Provision for income taxes $ 90,987 $ 27,756 $ 24,430
Income tax expense differs from the amount that would result from applying the Canadian federal and provincial income tax rates to earnings before income taxes and non-controlling interest. these differences result from the following items:
DeCemBer 31 2010 2009 2008
Income before taxes and non-controlling interest
$ 205,387 $ 90,851 $ 49,797
Statutory tax rate 28.50% 30.0% 31.0%
Income tax expense (recovery) based on above rates
58,535 27,255 15,437
Increase (decrease) due to:
Non-deductible expenses 1,731 1,524 687
Adjustments to estimated deductible expenses
4,379 (2,638) -
tax benefit / (expense) not recognized when arose
1,543 (791) 4,261
Foreign tax rate differences 3,917 (726) (1,696)
Effect of other taxes paid 4,106 519 1,963
Valuation allowance on exploration expenses
6,214 982 -
Withholding taxes paid 5,902 - -
Other 4,660 1,631 3,778
$ 90,987 $ 27,756 $ 24,430
the tax effect of each type of item that gives rise to the Company’s future income tax assets and liabilities have been determined and are set out in the table below. the Company has recorded a valuation allowance against the value of certain potential tax assets for which the likelihood of realization is not more likely than not.
2010 2009
Excess of tax value of capital assets over book value $ 5,661 $ 5,561
Deductible temporary differences and other 27,540 25,604
Canadian resource pools 2,076 3,252
Non-capital loss carry forward 33,165 24,529
Capital losses and other 2,966 2,460
total future income tax asset 71,408 61,406
Less: valuation allowance (47,177) (32,243)
Net future income tax asset 24,231 29,163
Excess of book value of capital assets over tax value (350,348) (329,990)
Net future income tax liability $ (326,117) $ (300,827)

NOtES tO CONSOLIDAtED FINANCIAL StAtEMENtS 83
Presentation of the future income taxes on the Consolidated Balance Sheets is as follows:
2010 2009
Current future income tax assets $ 8,172 $ 4,993
Long-term future income tax assets 1,251 –
Current future income tax liability (4,312) –
Long-term future income tax liabilities (331,228) (305,820)
$ (326,117) $ (300,827)
At December 31, 2010 the Company has non-capital losses available for tax purposes:
amoUnt expirY
Canada $ 101,061 2011-2030
Argentina $ 715 2011-2014
Bolivia $ – 2011-2014
Mexico $ 25,058 2017-2019
If not utilized, the Canadian losses will expire as follows: 2011 - $8 million, 2013 - $3.1 million, 2014 - $19.8 million, 2015 - $20.6 million, and from 2025 to 2030 - $49.5 million.
20. reLateD partY transaCtions
During the year ended December 31, 2010, a private company controlled by a director of the Company was paid approximately $0.4 (2009-$0.2 million, 2008-$0.2 million) for consulting services. these transactions are in the normal course of operations and are measured at the exchange amount, which is the amount of consideration established and agreed to by the parties.
21. DiFFerenCes BetWeen CanaDian anD UniteD states generaLLY aCCepteD aCCoUnting prinCipLes
these financial statements are prepared in accordance with Canadian generally accepted accounting principles (“Canadian gAAP”) which differ in certain material respects from generally accepted accounting principles in the United States (“U.S. gAAP”). Material differences between Canadian gAAP and U.S. gAAP and their effect on the Company’s consolidated financial statements are summarized in the following tables.
DeCemBer 31, 2010
ConsoLiDateD BaLanCe sHeets totaL assets totaL LiaBiLitiesnon-ControLLing
interest eQUitY
Reported under Canadian gAAP $ 2,072,608 $ 544,546 $ 7,774 $ 1,520,288
Amortization of mineral property (a) (789) (237) – (552)
Depletion expense (b) (14,927) (5,229) – (9,698)
Startup revenues and expenses (c) 681 197 – 484
Reclassification of share purchase warrants (d) – 127,890 – (127,890)
Reclassification of stock based compensation (e) – 4,650 – (4,650)
Purchase accounting under business combinations (f) (24,462) (8,562) – (15,900)
Capitalized evaluation costs (g) (29,075) (10,176) – (18,899)
Reclassification of non-controlling interest (h) – – (7,774) 7,774
Reported under US gAAP $ 2,004,036 $ 653,079 $ – $ 1,350,957
DeCemBer 31, 2009
ConsoLiDateD BaLanCe sHeets totaL assets totaL LiaBiLitiesnon-ControLLing
interest eQUitY
Reported under Canadian gAAP $ 1,848,609 $ 489,563 $ 15,256 $ 1,343,790
Amortization of mineral property (a) (1,046) (293) – (753)
Depletion expense (b) (16,540) (5,818) – (10,722)
Startup revenues and expenses (c) 681 197 – 484
Reclassification of share purchase warrants (d) – 43,919 – (43,919)
Reclassification of stock based compensation (e) – 2,943 – (2,943)
Purchase accounting under business combinations (f) 13,357 (5,882) 30,162 (10,923)
Reclassification of non-controlling interest (h) – – (45,418) 45,418
Reported under US gAAP $ 1,845,061 $ 524,629 $ – $ 1,320,432
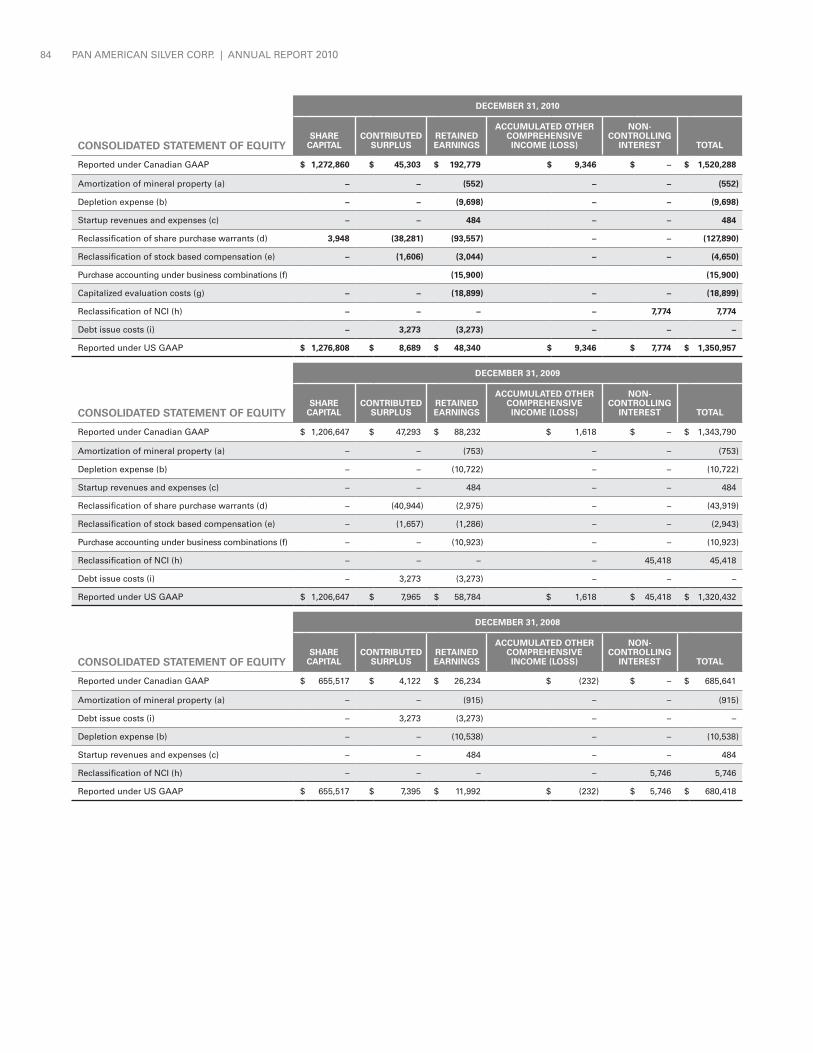
PAN AMERICAN SILVER CORP. | ANNUAL REPORt 201084
DeCemBer 31, 2010
ConsoLiDateD statement oF eQUitYsHare
CapitaLContriBUteD
sUrpLUsretaineD earnings
aCCUmULateD otHer CompreHensiVeinCome (Loss)
non- ControLLing
interest totaL
Reported under Canadian gAAP $ 1,272,860 $ 45,303 $ 192,779 $ 9,346 $ – $ 1,520,288
Amortization of mineral property (a) – – (552) – – (552)
Depletion expense (b) – – (9,698) – – (9,698)
Startup revenues and expenses (c) – – 484 – – 484
Reclassification of share purchase warrants (d) 3,948 (38,281) (93,557) – – (127,890)
Reclassification of stock based compensation (e) – (1,606) (3,044) – – (4,650)
Purchase accounting under business combinations (f) (15,900) (15,900)
Capitalized evaluation costs (g) – – (18,899) – – (18,899)
Reclassification of NCI (h) – – – – 7,774 7,774
Debt issue costs (i) – 3,273 (3,273) – – –
Reported under US gAAP $ 1,276,808 $ 8,689 $ 48,340 $ 9,346 $ 7,774 $ 1,350,957
DeCemBer 31, 2009
ConsoLiDateD statement oF eQUitYsHare
CapitaLContriBUteD
sUrpLUsretaineD earnings
aCCUmULateD otHer CompreHensiVeinCome (Loss)
non- ControLLing
interest totaL
Reported under Canadian gAAP $ 1,206,647 $ 47,293 $ 88,232 $ 1,618 $ – $ 1,343,790
Amortization of mineral property (a) – – (753) – – (753)
Depletion expense (b) – – (10,722) – – (10,722)
Startup revenues and expenses (c) – – 484 – – 484
Reclassification of share purchase warrants (d) – (40,944) (2,975) – – (43,919)
Reclassification of stock based compensation (e) – (1,657) (1,286) – – (2,943)
Purchase accounting under business combinations (f) – – (10,923) – – (10,923)
Reclassification of NCI (h) – – – – 45,418 45,418
Debt issue costs (i) – 3,273 (3,273) – – –
Reported under US gAAP $ 1,206,647 $ 7,965 $ 58,784 $ 1,618 $ 45,418 $ 1,320,432
DeCemBer 31, 2008
ConsoLiDateD statement oF eQUitYsHare
CapitaLContriBUteD
sUrpLUsretaineD earnings
aCCUmULateD otHer CompreHensiVeinCome (Loss)
non- ControLLing
interest totaL
Reported under Canadian gAAP $ 655,517 $ 4,122 $ 26,234 $ (232) $ – $ 685,641
Amortization of mineral property (a) – – (915) – – (915)
Debt issue costs (i) – 3,273 (3,273) – – –
Depletion expense (b) – – (10,538) – – (10,538)
Startup revenues and expenses (c) – – 484 – – 484
Reclassification of NCI (h) – – – – 5,746 5,746
Reported under US gAAP $ 655,517 $ 7,395 $ 11,992 $ (232) $ 5,746 $ 680,418

NOtES tO CONSOLIDAtED FINANCIAL StAtEMENtS 85
DeCemBer 31
ConsoLiDateD statement oF operations 2010 2009 2008
Net income reported under Canadian gAAP $ 112,573 $ 61,998 $ 24,602
Amortization of non-producing property (a) 201 162 189
Depletion expense (b) 1,024 (183) (2,133)
Reclassification of share purchase warrants (d) (90,582) (2,975) –
Reclassification of stock based compensation (e) (1,757) (1,287) –
Purchase accounting under business combinations (f) 4,716 (10,923) –
Capitalized evaluation costs (g) (18,899) – –
Net income for the year attributable to non-controlling interest (h) 1,827 1,097 765
Net (loss) income reported under US gAAP $ 9,103 $ 47,889 $ 23,423
DeCemBer 31
ConsoLiDateD statement oF operations (UnDer Us gaap) 2010 2009 2008
Revenue $ 631,986 $ 454,812 $ 338,600
Expenses
Cost of sales 305,696 245,637 199,032
general and Administrative (e) 17,389 13,538 10,435
Depreciation, depletion, and amortization (a), (b) 84,614 83,233 49,445
Asset retirement and reclamation 2,929 2,998 2,687
Exploration and project development (f), (g) 48,886 20,857 5,494
Other expense – – 4,674
(gain) on sale of assets (651) 220 (998)
Doubtful accounts and inventory provisions 4,754 4,375 –
Write-down of assets – – 15,117
463,617 370,858 285,886
Income before the under noted 168,369 83,954 52,714
Investment and other income 5,488 (1,467) 2,704
Interest and financing expense (2,061) (4,292) (951)
gain (loss) on commodity and foreign currency contracts (237) 1,918 (1,619)
Loss on derivatives (d) (92,059) (3,492) –
Foreign exchange loss 11,058 (1,018) (6,147)
Income before income taxes 90,558 75,603 46,701
Income tax provision (j) (81,455) (27,714) (23,278)
Net income for the year 9,103 47,889 23,423
Net (income) for the year attributable to non-controlling interest 1,827 1,097 765
Net income for the year attributable to common shareholders $ 7,276 $ 46,792 $ 22,658
earnings per sHare
Basic $ 0.07 $ 0.53 $ 0.28
Diluted $ 0.07 $ 0.53 $ 0.28
WeigHteD aVerage nUmBer oF Common sHares oUtstanDing
Basic 106,969 87,578 80,236
Diluted 107,575 87,751 80,773

PAN AMERICAN SILVER CORP. | ANNUAL REPORt 201086
DeCemBer 31
ConsoLiDateD sUmmariZeD statement oF CasH FLoWs 2010 2009 2008
Cash flow provided by operating activities, Canadian gAAP $ 242,256 $ 115,876 $ 93,528
Capitalized evaluation costs (g) $ (29,075) $ – $ –
Business combination transaction expenses (f) (2,866) (3,341) –
Cash flow provided by operating activities, US gAAP 210,315 112,627 92,985
Cash flow used in investing activities, Canadian gAAP (166,117) (146,342) (168,822)
Capitalized evaluation costs (g) 29,075 – –
Business combination transaction expenses (f) 2,866 3,341 –
Cash flow used in investing activities US gAAP (134,176) (143,001) (168,822)
Cash flow provided by financing activities, Canadian and US gAAP $ 2,599 $ 104,059 $ 50,711
Effect of exchange rate changes on cash 709 92 (543)
Increase (decrease) in cash flow under US gAAP 79,447 73,685 (25,126)
a. mineral property expendituresUnder Canadian gAAP capitalized costs related to non-producing mineral properties are only amortized after the commencement of operations. Prior to 2004, under U.S. gAAP, the Company accounted for mineral rights as intangible assets, and accordingly mineral rights were amortized on a straight-line basis over the life of the mineral rights. this resulted in the Company recording amortization of $1.7 million during 2003 with respect to mining rights acquired in 2003. the Emerging Issues task Force (EItF) reached a consensus “Whether Mineral Rights are Tangible or Non-Tangible Assets”. the conclusion is that mineral rights are tangible assets and should be amortized over the productive life of the asset. the Company has adopted this guidance with effect from 2004 on a prospective basis. the change has the effect of reducing amortization expense in the year ended December 31, 2004 by $1.7 million ($1.1 million net of income taxes). this change had the effect of conforming Canadian gAAP to U.S. gAAP.
b. Depreciation and DepletionUnder Canadian gAAP, prior to 2005, the Company calculated depletion expense in reference to proven and probable reserves and a portion of resources, whereas under U.S. gAAP, depletion is calculated based on proven and probable reserves only. During the year ended December 31, 2010, the Company calculated a decrease of depletion of $1.6 million (for 2009 –$0.2 million increase), with a corresponding decrease to accumulated depletion. In addition, the future income tax liability would increase by $0.6 million (2009 –$0.1 million decrease), with a corresponding increase to income tax expense.
c. startup revenue and expensesUnder Canadian gAAP, revenues and expenditures during the pre-operating period are treated as part of the cost of capital asset. Under U.S. gAAP, all revenues and expense after completion of construction and during pre-operating will be recorded in the statement of operations. In 2007, during the start up of the Alamo Dorado mine, the Company would have recorded sales, less cost of sales, depletion and amortization, and taxes on the statement of operations with a net income effect of $0.5 million.
d. share purchase WarrantsFor Canadian gAAP purposes, all of the Company’s outstanding share purchase warrants are classified and accounted for as equity in the Company’s consolidated financial statements. In 2006, an interpretation of U.S. gAAP, Accounting for Derivative Instruments and Hedging Activities, required that share purchase warrants with an exercise price denominated in a currency other than the Company’s functional currency be classified and accounted for as financial liabilities at their fair values with changes in fair values being included in net earnings. For the year ended December 31, 2010, the net effect of reflecting the mark-to-market loss on these share purchase warrants was to reduce net earnings by $90.6 million (2009 – $3.0 million) the derivative liability relating to share purchase warrants at December 31, 2010 was $ 127.9 million (2009 – $43.9 million). the Company used the Black Scholes formula for calculating fair value with the following assumptions: a risk free interest rate of 2.2 percent, weighted average volatility of 40 percent, expected lives ranging from 0.8 to 4 years, dividend yield of 0.25%, and an exercise price of CAD $34.67 per share. the weighted average fair value of each warrant was determined to be CAD $16.08.
e. stock Based CompensationShare-based benefits have been valued at fair value using the Black-Scholes option pricing model for option grants and the grant date fair market value for stock awards. Compensation amounts have been expensed over the applicable vesting period. Under Statement of Financial Accounting Standard (SFAS) No. 123R “Share Based Payment” certain of these stock-based awards granted are considered liability instruments under U.S. gAAP and would be measured at fair value at each reporting date because options granted to certain employees are denominated in CAD, a currency different from that in which the employees are remunerated.
f. Business CombinationsAcquisition-related costs are excluded from the purchase price in a business combination and are expensed as incurred under U.S. gAAP, effective January 1, 2009. Under Canadian gAAP, such amounts are included in the purchase price. In addition, the non-controlling interest in a business combination is recorded at fair value with the related

NOtES tO CONSOLIDAtED FINANCIAL StAtEMENtS 87
adjustment classified as an adjustment to mineral property. the Company completed in the first quarter of 2010 a stepped completion of the Aquiline acquisition (as described in Note 3). For U.S. gAAP, the fair value of additional consideration issued was first recorded against non-controlling interest and any remaining differential adjusted through retained earnings with no subsequent adjustment to the fair value assigned to mineral property in the initial acquisition step.
g. Capitalized evaluation costsUnder Canadian gAAP, evaluation costs may be deferred and amortized to the extent they meet certain criteria as described in Note 2. Under U.S. gAAP, evaluation costs are expensed as incurred unless the resource properties have proven and probable reserves at which time costs incurred to bring the mine into production are capitalized as development costs. Drilling and related costs in delineating an orebody and converting mineral resources to mineral reserves are expensed as exploration costs under U.S. gAAP. For the purposes of the consolidated statements of cash flows, the capitalized evaluation costs are classified as cash used in investing activities under Canadian gAAP and cash used in operations under U.S. gAAP.
h. non-Controlling interestUnder Canadian gAAP, non-controlling interest is reported on a separate line of the Balance sheet. For U.S. gAAP non-controlling interest is part of Shareholders Equity.
In December 2007, the ASC guidance for non-controlling interests was updated to establish accounting and reporting standards pertaining to (i) ownership interests in subsidiaries held by parties other than the parent (“non-controlling interest”), (ii) the amount of net income attributable to the parent and to the non-controlling interest, (iii) changes in a parent’s ownership interest, and (iv) the valuation of any retained non-controlling equity investment when a subsidiary is deconsolidated. If a subsidiary is deconsolidated, any retained non-controlling equity investment in the former subsidiary is measured at fair value and a gain or loss is recognized in net income based on such fair value. For presentation and disclosure purposes, the guidance requires non-controlling interests to be classified as a separate component of stockholders’ equity. the Company adopted the updated guidance on January 1, 2009.
i. Debt issue coststhe ASC guidance for “Accounting for Certain Financial Instruments with Characteristics of Both Liabilities and Equity” requires that three types of financial instruments be reported as liabilities by their issuers. those types of instruments include: mandatory redeemable instruments, forward purchase contracts, written put options and other financial instruments not in the form of shares that either obligate the issuer to repurchase its equity shares and settle its obligation for cash or by transferring other assets; and certain financial instruments that include an obligation that may be settled in a variable number of equity shares, has a fixed or benchmark tied value at inception that varies inversely with the fair value of the equity shares. Under Canadian gAAP certain convertible debentures have been accounted for with the principal component of the debenture being treated as equity. the amortization of debt issue expenses of $3.3 million over a three-year period results in the permanent reclassification of these items between contributed surplus and retained earnings.
j. income taxesUnder Canadian gAAP, future income taxes are calculated based on enacted or substantively enacted tax rates applicable to future years. Under U.S. gAAP, only enacted rates are used in the calculation of future income taxes. this gAAP difference resulted in no difference in the financial position, results of operations or cash flows of the Company for the years presented.
As of January 1, 2007, the Company adopted, for U.S. gAAP purposes, current Accounting Standards Codification (“ASC”) updated guidance on Accounting for Uncertainty in Income taxes. this guidance clarifies financial statement recognition and disclosure requirements for uncertain tax positions taken or expected to be taken in a tax return. guidance is also provided on the derecognition of previously recognized tax benefits and the classification of tax liabilities on the balance sheet. the adoption of this interpretation did not have a material impact on the Company’s Consolidated Financial Statements. the Company has not derecognized any tax benefits or recognized any changes in classification of tax liabilities in the years ending December 31, 2010, 2009, or 2008.
k. Comprehensive incomethe Company adopted CICA Section 1530 on January 1, 2007, which aligns treatment under U.S. gAAP and Canadian gAAP for the reporting and display of the other comprehensive income (“OCI”) and its components. the following table illustrates Comprehensive Income for the years ended December, 2010, 2009 and 2008 under U.S. gAAP.
2010 2009 2008
Net income under US gAAP $ 9,103 $ 47,889 $ 23,423
Unrealized gain on available for sale securities
7,728 1,850 8,418
Comprehensive net income under US gAAP
16,831 49,736 31,841
Attributable to non-controlling interest
$ 1,827 $ 1,097 $ 765
Attributable to common shareholders
$ 15,004 $ 48,642 $ 31,076
l. transition to international Financial reporting standardsthe Company will report consolidated financial statements in accordance with International Financial Reporting Standards (IFRS) for 2011, with comparative figures for the corresponding periods for 2010. As such the Company will not be presenting a reconciliation to U.S. gAAP in future periods.

PAN AMERICAN SILVER CORP. | ANNUAL REPORt 201088
notes:

DIRECTORSRoss J. Beaty – ChairmanGeoff Burns – President & Chief Executive Officer Michael Carroll (Independent)Bill A. Fleckenstein (Independent)Michael J.J. Maloney (Independent)Robert Pirooz – General CounselDavid Press (Independent)Walter Segsworth (Independent)Paul B. Sweeney (Independent)
EXECUTIVE MANAGEMENT – VANCOUVERGeoff Burns – President & Chief Executive OfficerSteven Busby – Chief Operating Officer Andres Dasso – Sr. VP, Mining OperationsRob Doyle – Chief Financial Officer Delaney Fisher – Corporate Secretary & Legal CounselGeorge Greer – VP, Project DevelopmentSean McAleer – VP, Human Resources & SecurityRobert Pirooz – General CounselMichael Steinmann – Executive VP, Geology & ExplorationWayne Vincent – VP, Accounting & Financial ReportingMartin Wafforn – VP, Technical Services
AUDITORSDeloitte & Touche LLP, Chartered Accountants2800 – 1055 Dunsmuir StreetVancouver, British ColumbiaCanada, V7X 1P4
LEGAL COUNSELBorden Ladner Gervais1200 – 200 Burrard StreetVancouver, British Columbia,Canada, V7X 1T2
AUTHORIZED CAPITAL200,000,000 common shares without par value
ISSUED CAPITALDecember 31, 2010: 107,791,368 common shares
TRADING INFORMATIONNASDAQ: PAASTSX: PAA
REGISTRAR & TRANSFER AGENTComputershare Investor Services Inc.510 Burrard Street, 3rd FloorVancouver, British ColumbiaCanada, V6C 3B91-800-564-6253
ANNUAL GENERAL MEETINGWednesday, May 18, 2011Four Seasons Hotel, Seasons Ballroom 791 West Georgia St. Vancouver, BC
EXECUTIVE MANAGEMENT – VANCOUVER (L to R) Wayne Vincent, Sean McAleer, Delaney Fisher, Steve Busby, George Greer, Geoff Burns, Rob Doyle, Martin Wafforn, Michael Steinmann, Robert Pirooz, Andres Dasso.
DIRECTORS (L to R) Bill A. Fleckenstein, David Press, Robert Pirooz, Ross Beaty, Geoff Burns, Walter Segsworth, Michael Carroll, Paul Sweeney. Not pictured: Michael Maloney.
TABLE OF CONTENTS
Financial Highlights 02
Operations/Projects Map 03
Chairman’s Message to the Shareholders 04
President’s Message to the Shareholders 06
The Silver Market 2010 08
Exploration 10
Project Development: Navidad 13
Social Responsibility 16
Cautionary Note to US Investors 20
Properties at a Glance 21
Financial Statements 22
Corporate Information IBC
CAUTIONARY NOTE REGARDING FORWARD-LOOKING STATEMENTS
CERTAIN OF THE STATEMENTS AND INFORMATION IN THIS ANNUAL REPORT CONSTITUTE “FORWARD-LOOKING STATEMENTS” WITHIN THE MEANING OF THE UNITED STATES PRIVATE
SECURITIES LITIGATION REFORM ACT OF 1995 AND “FORWARD-LOOKING INFORMATION” WITHIN THE MEANING OF APPLICABLE CANADIAN PROVINCIAL SECURITIES LAWS RELATING
TO THE COMPANY AND ITS OPERATIONS. ALL STATEMENTS, OTHER THAN STATEMENTS OF HISTORICAL FACT, ARE FORWARD-LOOKING STATEMENTS. WHEN USED IN THIS ANNUAL
REPORT THE WORDS, “BELIEVES”, “EXPECTS”, “INTENDS”, “PLANS”, “FORECAST”, “OBJECTIVE”, “OUTLOOK”, “POSITIONING”, “POTENTIAL”, “ANTICIPATED”, “BUDGET”, AND OTHER SIMILAR
WORDS AND EXPRESSIONS, IDENTIFY FORWARD-LOOKING STATEMENTS OR INFORMATION. THESE FORWARD-LOOKING STATEMENTS OR INFORMATION RELATE TO, AMONG OTHER
THINGS: FUTURE PRODUCTION OF SILVER, GOLD AND OTHER METALS; FUTURE CASH COSTS PER OUNCE OF SILVER; THE PRICE OF SILVER AND OTHER METALS; THE EFFECTS OF LAWS,
REGULATIONS AND GOVERNMENT POLICIES AFFECTING PAN AMERICAN’S OPERATIONS OR POTENTIAL FUTURE OPERATIONS, INCLUDING BUT NOT LIMITED TO, LAWS IN THE PROVINCE
OF CHUBUT, ARGENTINA, WHICH, CURRENTLY HAVE SIGNIFICANT RESTRICTIONS ON MINING; FUTURE SUCCESSFUL DEVELOPMENT OF THE NAVIDAD PROJECT, THE LA PRECIOSA
PROJECT, AND OTHER DEVELOPMENT PROJECTS OF THE COMPANY; THE SUFFICIENCY OF THE COMPANY’S CURRENT WORKING CAPITAL, ANTICIPATED OPERATING CASH FLOW OR ITS
ABILITY TO RAISE NECESSARY FUNDS; THE ACCURACY OF MINERAL RESERVE AND RESOURCE ESTIMATES; ESTIMATED PRODUCTION RATES FOR SILVER AND OTHER PAYABLE METALS
PRODUCED BY THE COMPANY; TIMING OF PRODUCTION AND THE CASH AND TOTAL COSTS OF PRODUCTION AT EACH OF THE COMPANY’S PROPERTIES; THE ESTIMATED COST OF
AND AVAILABILITY OF FUNDING NECESSARY FOR SUSTAINING CAPITAL; ONGOING OR FUTURE DEVELOPMENT PLANS AND CAPITAL REPLACEMENT, IMPROVEMENT OR REMEDIATION
PROGRAMS; THE ABILITY OF THE COMPANY TO REDUCE ENVIRONMENTAL IMPACTS, INCLUDING A REDUCTION IN GREENHOUSE GAS EMISSIONS, AND TO IMPROVE SUSTAINABILITY IN ITS
OPERATIONS AND PROJECTS; THE ESTIMATES OF EXPECTED OR ANTICIPATED ECONOMIC RETURNS FROM THE COMPANY’S MINING PROJECTS, AS REFLECTED IN TECHNICAL REPORTS
OR OTHER ANALYSES PREPARED IN RELATION TO DEVELOPMENT OF PROJECTS; ESTIMATED EXPLORATION EXPENDITURES TO BE INCURRED ON THE COMPANY’S VARIOUS PROPERTIES;
FORECAST CAPITAL AND NON-OPERATING SPENDING; FUTURE SALES OF THE METALS, CONCENTRATES OR OTHER PRODUCTS PRODUCED BY THE COMPANY; AND THE COMPANY’S PLANS
AND EXPECTATIONS FOR ITS PROPERTIES AND OPERATIONS.
THESE STATEMENTS REFLECT THE COMPANY’S CURRENT VIEWS WITH RESPECT TO FUTURE EVENTS AND ARE NECESSARILY BASED UPON A NUMBER OF ASSUMPTIONS AND ESTIMATES
THAT, WHILE CONSIDERED REASONABLE BY THE COMPANY, ARE INHERENTLY SUBJECT TO SIGNIFICANT BUSINESS, ECONOMIC, COMPETITIVE, POLITICAL AND SOCIAL UNCERTAINTIES
AND CONTINGENCIES. MANY FACTORS, BOTH KNOWN AND UNKNOWN, COULD CAUSE ACTUAL RESULTS, PERFORMANCE OR ACHIEVEMENTS TO BE MATERIALLY DIFFERENT FROM
THE RESULTS, PERFORMANCE OR ACHIEVEMENTS THAT ARE OR MAY BE EXPRESSED OR IMPLIED BY SUCH FORWARD-LOOKING STATEMENTS CONTAINED IN THIS ANNUAL REPORT
AND THE COMPANY HAS MADE ASSUMPTIONS AND ESTIMATES BASED ON OR RELATED TO MANY OF THESE FACTORS. SUCH FACTORS INCLUDE, WITHOUT LIMITATION: FLUCTUATIONS
IN SPOT AND FORWARD MARKETS FOR SILVER, GOLD, BASE METALS AND CERTAIN OTHER COMMODITIES (SUCH AS NATURAL GAS, FUEL OIL AND ELECTRICITY); FLUCTUATIONS IN
CURRENCY MARKETS (SUCH AS THE PERUVIAN SOL, MEXICAN PESO, ARGENTINE PESO, BOLIVIAN BOLIVIANO AND CANADIAN DOLLAR VERSUS THE U.S. DOLLAR); RISKS RELATED
TO THE TECHNOLOGICAL AND OPERATIONAL NATURE OF THE COMPANY’S BUSINESS; CHANGES IN NATIONAL AND LOCAL GOVERNMENT, LEGISLATION, TAXATION, CONTROLS OR
REGULATIONS AND POLITICAL OR ECONOMIC DEVELOPMENTS IN CANADA, THE UNITED STATES, MEXICO, PERU, ARGENTINA, BOLIVIA OR OTHER COUNTRIES WHERE THE COMPANY MAY
CARRY ON BUSINESS IN THE FUTURE; RISKS AND HAZARDS ASSOCIATED WITH THE BUSINESS OF MINERAL EXPLORATION, DEVELOPMENT AND MINING (INCLUDING ENVIRONMENTAL
HAZARDS, INDUSTRIAL ACCIDENTS, UNUSUAL OR UNEXPECTED GEOLOGICAL OR STRUCTURAL FORMATIONS, PRESSURES, CAVE-INS AND FLOODING); RISKS RELATING TO THE CREDIT
WORTHINESS OR FINANCIAL CONDITION OF SUPPLIERS, REFINERS AND OTHER PARTIES WITH WHOM THE COMPANY DOES BUSINESS; INADEQUATE INSURANCE, OR INABILITY TO OBTAIN
INSURANCE, TO COVER THESE RISKS AND HAZARDS; EMPLOYEE RELATIONS; RELATIONSHIPS WITH AND CLAIMS BY LOCAL COMMUNITIES AND INDIGENOUS POPULATIONS; AVAILABILITY
AND INCREASING COSTS ASSOCIATED WITH MINING INPUTS AND LABOUR; THE SPECULATIVE NATURE OF MINERAL EXPLORATION AND DEVELOPMENT, INCLUDING THE RISKS OF
OBTAINING NECESSARY LICENSES AND PERMITS AND THE PRESENCE OF LAWS AND REGULATIONS THAT MAY IMPOSE RESTRICTIONS ON MINING, INCLUDING THOSE CURRENTLY IN
THE PROVINCE OF CHUBUT, ARGENTINA; DIMINISHING QUANTITIES OR GRADES OF MINERAL RESERVES AS PROPERTIES ARE MINED; GLOBAL FINANCIAL CONDITIONS; THE COMPANY’S
ABILITY TO COMPLETE AND SUCCESSFULLY INTEGRATE ACQUISITIONS AND TO MITIGATE OTHER BUSINESS COMBINATION RISKS; CHALLENGES TO, OR DIFFICULTY IN MAINTAINING, THE
COMPANY’S TITLE TO PROPERTIES AND CONTINUED OWNERSHIP THEREOF; THE ACTUAL RESULTS OF CURRENT EXPLORATION ACTIVITIES, CONCLUSIONS OF ECONOMIC EVALUATIONS,
AND CHANGES IN PROJECT PARAMETERS TO DEAL WITH UNANTICIPATED ECONOMIC OR OTHER FACTORS; INCREASED COMPETITION IN THE MINING INDUSTRY FOR PROPERTIES,
EQUIPMENT, QUALIFIED PERSONNEL, AND THEIR COSTS; AND THOSE FACTORS IDENTIFIED UNDER THE CAPTION “RISKS RELATED TO PAN AMERICAN’S BUSINESS” IN THE COMPANY’S
MOST RECENT FORM 40-F AND ANNUAL INFORMATION FORM FILED WITH THE UNITED STATES SECURITIES AND EXCHANGE COMMISSION AND CANADIAN PROVINCIAL SECURITIES
REGULATORY AUTHORITIES. INVESTORS ARE CAUTIONED AGAINST ATTRIBUTING UNDUE CERTAINTY OR RELIANCE ON FORWARD-LOOKING STATEMENTS. ALTHOUGH THE COMPANY
HAS ATTEMPTED TO IDENTIFY IMPORTANT FACTORS THAT COULD CAUSE ACTUAL RESULTS TO DIFFER MATERIALLY, THERE MAY BE OTHER FACTORS THAT CAUSE RESULTS NOT TO BE AS
ANTICIPATED, ESTIMATED, DESCRIBED OR INTENDED. THE COMPANY DOES NOT INTEND, AND DOES NOT ASSUME ANY OBLIGATION, TO UPDATE THESE FORWARD-LOOKING STATEMENTS
OR INFORMATION TO REFLECT CHANGES IN ASSUMPTIONS OR CHANGES IN CIRCUMSTANCES OR ANY OTHER EVENTS AFFECTING SUCH STATEMENTS OR INFORMATION, OTHER THAN AS
REQUIRED BY APPLICABLE LAW.

PAN AMERICAN SILVER CORP. ANNUAL REPORT 2010
15 Years of Harvesting Silver
VANCOUVER OFFICECORPORATE HEADQUARTERS
Pan American Silver Corp.1500 – 625 Howe StreetVancouver, British ColumbiaCanada, V6C 2T6
T. 604-684-1175 F. [email protected]
www.panamericansilver.com
MEXICO OFFICE
Plata Panamericana S.A. de C.V.T. 52-618-128-0709 x 101F. 52-618-128-0692 x 102Country Manager – Chris Warwick
PERU OFFICE
Pan American Silver Peru S.A.C.T. 51-1-618-9700 F. 51-1-618-9729Country Manager – Jorge Ugarte
ARGENTINA OFFICE
Pan American Silver ArgentinaT. 54-11-4816-3220F. 54-11-4816-3227Country Manager – Bret Boster
BOLIVIA OFFICE
Pan American Silver (Bolivia) S.A.T. 59-1-2-279-6690 F. 59-1221-54216Country Manager – Andres Gonzales
PAN
AM
ER
ICA
N S
ILVE
R C
OR
P. A
NN
UA
L RE
POR
T 2010