Embed Size (px)
Citation preview

1 1
Lecturer: Ronald K. HansonWoodard Professor, Dept. of Mechanical EngineeringPh.D. Stanford, Aero/Astro; at Stanford since 1972
15 Lecture Short Course at Princeton University
Copyright ©2013 by Ronald K. HansonThis material is not to be sold, reproduced or distributed without prior
written permission of the owner, Ronald K. Hanson.
Focus:Molecular Spectroscopy, Laser Absorption and LIF
Today:Overview, Motivation, Examples

1 2
Objectives and Content
• Introduction to fundamentals of molecular spectroscopy & photo-physics
• Emphasis on laser absorption and laser-induced fluorescence in gases
• Introduction to shock tubes as a primary tool for studying combustion chemistry, including recent advances and kinetics applications
• Example laser diagnostic applications including:• multi-parameter sensing in different types of propulsion flows and engines• species-specific sensing for shock tube kinetics studies• PLIF imaging in high-speed flows
Lecture 1: Overview & Introductory Material
3
Course Overview:Spectroscopy and Lasers
4
What is Spectroscopy?
• Interaction of Radiation (Light) withMatter (in our case, Gases).
• Examples: IR Absorption, Emission
Why Lasers?
• Enables Important DiagnosticMethods
• LIF, Raman, LII, PIV, CARS, …
• Our Emphasis: Absorption and LIF
• Why: Sensitive and Quantitative!
Calculated IR absorption spectra of HBr
Typical emission spectra of high-temperature airbetween 560-610nm.
1000 1500 2000 2500 3000
0.01
0.1
1
10
100
1000
CO2
CH3
C2H4
Min
imu
m D
ete
citiv
ity [p
pm]
Temperature [K]
1atm,15cm,1MHz
H2ONH2
1000 1500 2000 2500 3000
0.01
0.1
1
10
100
1000
OH
Min
imum
Det
eciti
vity
[ppm
]
Temperature [K]
1atm,15cm,1MHz
CH
CN
Minimum Detectivity using Laser Absorption
4

1 3
Course Overview:Role of Lasers in Energy Sciences
5
Example Applications:Remote sensing, combustion and gasdynamic diagnostics, process control, energy systems and environmental monitoring.
Common Measurements:Species concentrations, temperature (T), pressure (P), density (ρ), velocity (u), mass flux (ρu).
Coal-fired power plants
Coal gasifiers Swirl burners
IncineratorsOH PLIF in spray flame
Course Overview:Roles of Laser Sensing for Propulsion Ground Test
TDL Sensing in Pratt & Whitney PDE
@ China Lake, CA
TDL Sensing in SCRAMJET @ WPAFB
Applicable to large-scale systems as well as laboratory science
248 nm beam
Signal
PLIF in plume of Titan IV @ Aerojet
PLIF imaging of H2 jet in model SCRAMJET
@Stanford
TDL Sensing in IC-Engines @ Nissan & Sandia
Validate simulations and
models
Characterize test facilities
Understandcomplex reactive
environments
Optical Diagnostics
6

1 4
Course Overview:Role of Lasers in Combustion Kinetics: Shock Tubes
Ring Dye Lasers(UV & Vis)
Diode Lasers(Near IR & Mid-IR)
CO2 Lasers(9.8-10.8 m)
Ti:Sapphire Laser(Deep UV)
He-Ne Laser(3.39 m)
UV/Vis/IREmissionDetectorsIncident Beam
Detector
Transmitted Beam Detector
PressurePZT
P5
T5
P2
T2 VRS
ReflectedShock Wave
7
Advantages of Reflected Shock Wave Experiments• Near-Ideal Constant V or Constant P Platform• Well-Determined Initial T & P• Lack of Transport Effects Negligible Non-uniformities
• Clear Access for Sensitive, Quantitative Laser Diagnostics
Course Overview:Lasers and Shock Tube: Time-Histories & Kinetics
Multi-wavelength laser absorption species time-histories provide quantitative kinetics targets form model refinement and validation
OH laser absorption provides high-accuracy measurements of elementary reaction rate constants
1494K, 2.15 atm300ppm heptane, =1
JetSurF 2.0H+O2 = OH+O
8

1 5
Useful Texts, Supplementary Reading
9
G. Herzberg, Atomic spectra and atomic structure, 1944.
G. Herzberg, Spectra of diatomic molecules, 1950.
G. Herzberg, Molecular spectra and molecular structure, volume II,Infrared and Raman Spectra of Polyatomic Molecules, 1945.
G. Herzberg, Molecular spectra and molecular structure, volume III,Electronic spectra and electronic structure of polyatomic molecules, 1966.
C.N. Banwell and E.M. McCash, Fundamentals of molecular spectroscopy, 1994.
S.S. Penner, Quantitative molecular spectroscopy and gas emissivities, 1959.
A.C.G. Mitchell and M.W.Zemansky, Resonance radiation and excited atoms, 1971.
C.H. Townes and A.L. Schawlow, Microwave spectroscopy, 1975.
M. Diem, Introduction to modern vibrational spectroscopy, 1993.
W.G. Vincenti and C.H. Kruger, Physical gas dynamics, 1965.
A.G. Gaydon and I.R. Hurle, The shock tube in high-temperature chemical physics, 1963.
J.B. Jeffries and K. Kohse-Hoinghaus, Applied combustion diagnostics, 2002.
A.C. Eckbreth, Laser diagnostics for combustion temperature and species, 1988.
W. Demtroder, Laser spectroscopy: basic concepts and instrumentation, 1996.
R.W. Waynant and M.N. Ediger, Electro-optics handbook, 2000.
J.T. Luxon and D.E.Parker, Industrial lasers and their applications, 1992.
J.Hecht, Understanding lasers: An entry level guide, 1994.
K.J.Kuhn, Laser engineering, 1998.
Lecture Schedule
10
1. Overview & IntroductionCourse Organization, Role of Quantum Mechanics,Planck's Law, Beer's Law, Boltzmann distribution
2. Diatomic Molecular SpectraRotational Spectra (Microwaves)Vibration-Rotation (Rovibrational) Spectra (Infrared)
3. Diatomic Molecular SpectraElectronic (Rovibronic) Spectra (UV, Visible)
13. Laser-Induced Fluorescence (LIF)Two-Level ModelMore Complex Models
14. Laser-Induced Fluorescence: Applications 1Diagnostic Applications (T, V, Species)PLIF for small molecules
15. Laser-Induced Fluorescence: Applications 2Diagnostic Applications & PLIF for large moleculesThe Future
7. Electronic Spectra of DiatomicsTerm Symbols, Molecular Models: Rigid Rotor, Symmetric Top, Hund's Cases, Quantitative Absorption
8. Case Studies of Molecular SpectraUltraviolet: OH
9. TDLAS, Lasers and FibersFundamentals and Applications in Aeropropulsion
4. Polyatomic Molecular SpectraRotational Spectra (Microwaves)Vibrational Bands, Rovibrational Spectra
5. Quantitative Emission/ AbsorptionSpectral absorptivity, Eqn. of Radiative TransferEinstein Coefficients/Theory, Line Strength
6. Spectral LineshapesDoppler, Natural, Collisional and Stark broadening,Voigt profiles
10. TDLAS Applications in Energy ConversionTunable Diode Laser Applications in IC EnginesCoal-Fired Combustion
11. Shock Tube TechniquesWhat is a Shock Tube?Recent Advances, ignition Delay Times
12. Shock Tube ApplicationsMulti-Species Time HistoriesElementary Reactions
Monday
Tuesday
Wednesday
Thursday
Friday

1 6
Lecture 1: Introductory Material
1. Role of Quantum Mechanics
- Planck’s Law
2. Absorption and Emission
3. Boltzmann Distribution
4. Working examples
11
∆E
Eelec
Evib
Erot
Quantum Mechanics: Quantized Energy levels
“Allowed” transitions
12
Eint = Eelec + Evib + Erot
1. Role of QM - Planck’s Law
How are energy levels specified?Quantum numbers for electronic, vibrational and rotational states.
We will simply accept these rules from QM.}

1 7
1. Role of QM - Planck’s Law
Quantum Mechanics
13
Small species, (e.g., NO, CO, CO2, and H2O), have discreterovibrational transitions
Large molecules (e.g., HCs) have blended features
Quantized Energy States (discrete energy levels)
Discrete spectraPlanck’s Law:∆E = Eupper (E’) – Elower (E”)
= h= hc/λ= hc Energy in wavenumbers
Energy state or level
Absorption
Emission
“Allowed” transitions
Energy
∆E
c = λ
~ 3 x 1010 cm/s Wavelength [cm]
Frequency [s-1]
Note interchangability of λ & ν
2. Absorption and Emission
Types of spectra: Absorption; Emission; Fluorescence; Scattering (Rayleigh, Raman)
Absorption: Governed by Beer’s Law
14
Beer-Lambert Law LSPLnTI
Iij
t
expexpexp
0
Number density of species j in absorbing state [molec./cm3]
Cross section for absorption [cm2/molec.]
Path length [cm]
Absorbance
I0, ν T, P, χi,vIt
L
GasWavelength
Tran
smis
sion
1 8
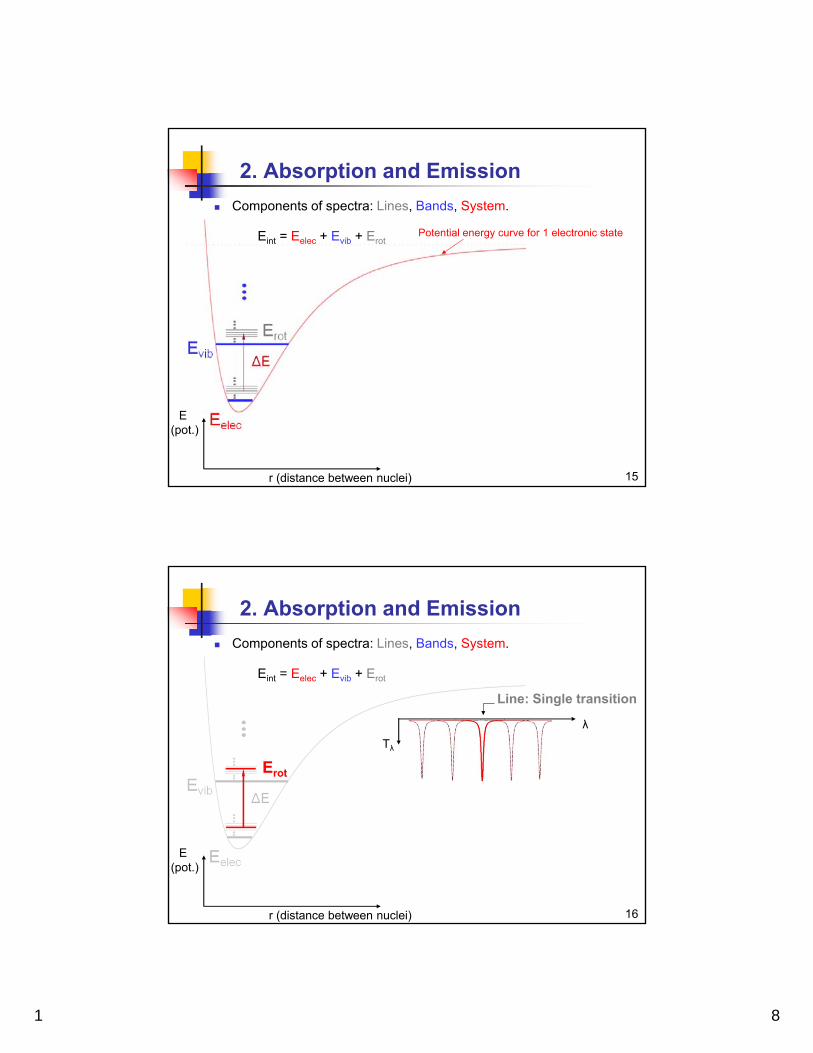
2. Absorption and Emission
Components of spectra: Lines, Bands, System.
15
Eint = Eelec + Evib + Erot
r (distance between nuclei)
E(pot.)
Potential energy curve for 1 electronic state
2. Absorption and Emission
Components of spectra: Lines, Bands, System.
16
Eint = Eelec + Evib + Erot
Erot
Line: Single transition
λ
Tλ
r (distance between nuclei)
E(pot.)
1 9
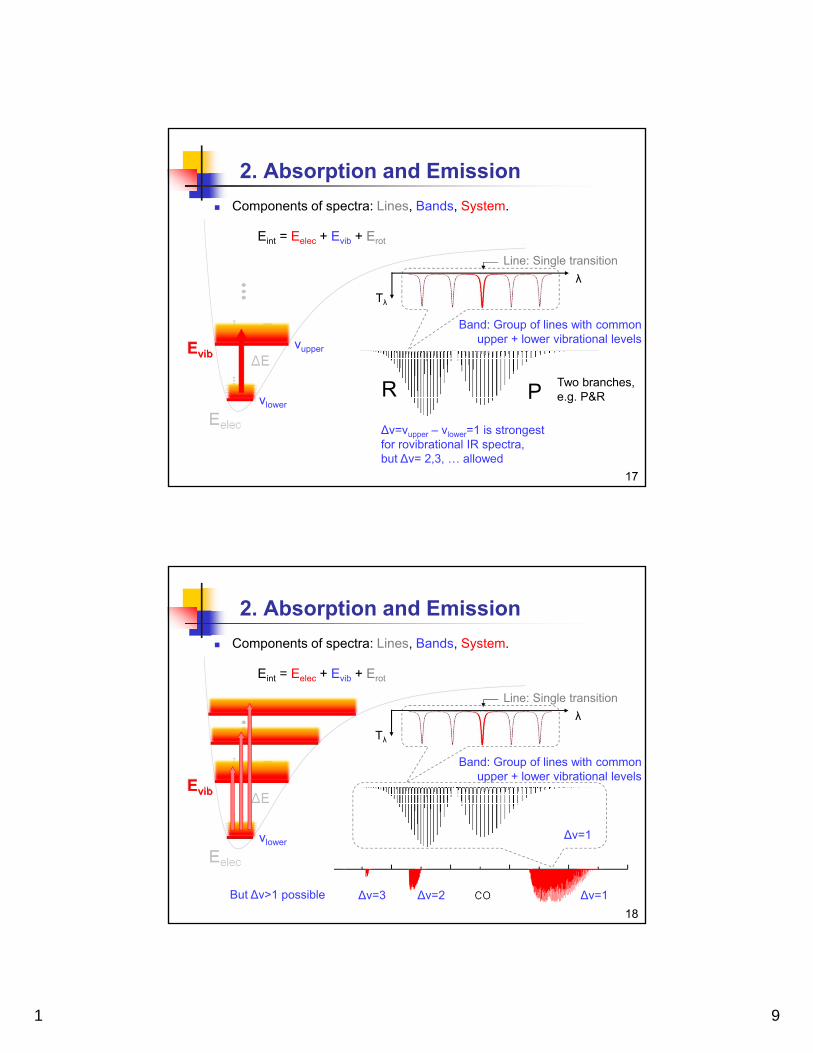
2. Absorption and Emission
Components of spectra: Lines, Bands, System.
17
Eint = Eelec + Evib + Erot
Evib
Line: Single transition
Band: Group of lines with common upper + lower vibrational levels
λ
Tλ
∆v=vupper – vlower=1 is strongestfor rovibrational IR spectra,but ∆v= 2,3, … allowed
vupper
vlowerR P
Two branches,e.g. P&R
2. Absorption and Emission
Components of spectra: Lines, Bands, System.
18
Eint = Eelec + Evib + Erot
Evib
Line: Single transition
Band: Group of lines with common upper + lower vibrational levels
λ
Tλ
∆v=1∆v=2∆v=3
∆v=1
But ∆v>1 possible
vlower

1 10
2. Absorption and Emission
Components of spectra: Lines, Bands, System.
19
Eelec
System: Transitions between different
electronic states Comprised of multiple bands between
two electronic states Different combinations of vupper and
vlower such that “bands” with vupper-vlower=const. appear
C3Πu
B3Πg
A3Σ+uN2(1+)
Eint = Eelec + Evib + Erot
N2(2+)
Nitrogen
Example: N2
First positive SYSTEM: B3Πg→A3Σ+
u
2. Absorption and Emission
Components of spectra: Lines, Bands, System.
20
Eelec
System
Example: High-temperature air emissionspectra (560-610nm)
C3Πu
B3Πg
A3Σ+uN2(1+)
N2(2+)
Nitrogen
12→8
11→7 10→6
9→5
8→47→3
6→2
vupper=v'vlower=v"
v'-v"=4
Eint = Eelec + Evib + Erot

1 11
2. Absorption and Emission
Components of spectra: Lines, Bands, System.
21
SystemExample: Typical emission spectra of DC discharges
UV Visible-NIR
2. Absorption and Emission
22
OH 2Σ−2Π (0,0)
CH 2∆−2Π
CH 2Σ−2Π
CH 2Σ−2Π
NH 3Π−3Σ
In early days, spectra were recorded on film!But now we have lasers.
Components of spectra: Lines, Bands, System.

1 12
How is Tλ (fractional transmission) measured?
2. Absorption and Emission
23
Transmission (Tλ)
Absorption
λ
Tunable Laser Test media; Flame Iλ; Detector
1.0
∆λ = Full width at half maximum
λ0 = Line center
∆λ = f(P,T)
A resolved line has shape!
Do lines have finite width/shape? Yes!
3 key elements of spectra Line position
Line strength
Line shapes
2. Absorption and Emission
24
Covered in course

1 13
How strong is a transition?
3. Boltzmann Distribution
25
Proportional to particle population in initial energy level n1
S12
Energy level 1
Energy level 2
∆E=hν
n1
Boltzmann fraction of absorber species i in level 1
QkT
g
n
nF
ii
ii
exp
elecvibroti
ii QQQ
kTgQ
expPartition function
- Equilibrium distribution of molecules of a single species over its allowed quantum states.
defines T
TDL sensing for aero-propulsion Diode laser absorption sensors offer prospects for time-resolved, multi-
parameter, multi-location sensing for performance testing, model validation, feedback control
4. Working Examples – 1
26
Exhaust(T, species, UHC, velocity, thrust)
Inlet and Isolator(velocity, mass flux, species,
shocktrain location)
Combustor(T, species, stability)
l1 l2 l3 l4 l5
Diode Lasers
Fiber Optics
Acquisition and Feedback to Actuators
l6
Sensors developed for T, V, H2O, CO2, O2, & other species
Prototypes tested and validated at Stanford
Several applications successful in ground test facilities
Future opportunities for use in flight

1 14
TDL Sensing to Characterize NASA Ames ArcJet Facilities High-Enthalpy Flow for Materials and Vehicle Testing
4. Working Examples – 2
27
High pressure gas Arc heater Nozzle
High velocity low pressure
flow for hypersonic
vehicle testing
30ft
10ft
10ft
TDL Sensing to Characterize NASA Ames ArcJet Facilities High-Enthalpy Flow for Materials and Vehicle Testing
4. Working Examples – 2
28
High pressure gas Arc heater Nozzle
High velocity low pressure
flow for hypersonic
vehicle testing
Goals: (1) Time-resolved temperature sensing in the arc heater: O to infer T(2) Investigate spatial uniformity within heater (multi-path absorption)
Challenges: Extreme Conditions T=6000-8000K, P= 2-9 bar, I~2000A, 20 & 60 MWDifficult access (mechanical, optical, and electrical)
Cooling water
Anode Cathode
Test cabin
Inlet Air
TDL Sensor
Constrictor Tube
Cooling Argon

1 15
Temperature from Atomic O Absorption Measurement
4. Working Examples – 2
29
Atomic oxygen energy diagram
777.2 nm
3P23P13P0
5P35P25P1844.6 nm
3P0,1,2
3S01 5S0
2
135.8 nm130.5 nm
Fundamental absorption transitions from O are VUV but excited O in NIR
Equilibrium population of O-atom in 5S02 extremely temperature sensitive
0.6
0.4
0.2
0.0
777.28777.24777.20777.16777.12
Wavelength (nm)
-0.05
0.00
0.05
Data Fitting
Ab
sorb
ance
Res
idu
als
Atomic oxygen absorption measured in the arc heater
nO*= 6.64 x 1010 cm-3
Tpopulation= 7130±120 K
4. Working Examples – 2 Arc current at 2000A, power 20MW
Last 200 seconds of run arc current decreased 100A
Measured temperature captures change in arc conditions
Precise temperature measurements• 18K or 0.3% standard deviation• 200ms time resolution
18 KArc current
decreased ~100A
TDL sensor provides new tool for routine monitoring of arcjet performance
30

1 16
1392 nm
1469 nm
2678 nm
Flow from Engine
NozzleExit
Fiber-Coupled Light to Engine
Transmitted Light Caught onto Multi-Mode Fibers
Detector for H2O Wavelengths
Detector for CO2
Wavelength
Pitch Optics
Catch Optics
H2O & T
CO2
NozzleEntrance
4855 nmCOOR
Port for KistlerPressure Sensor
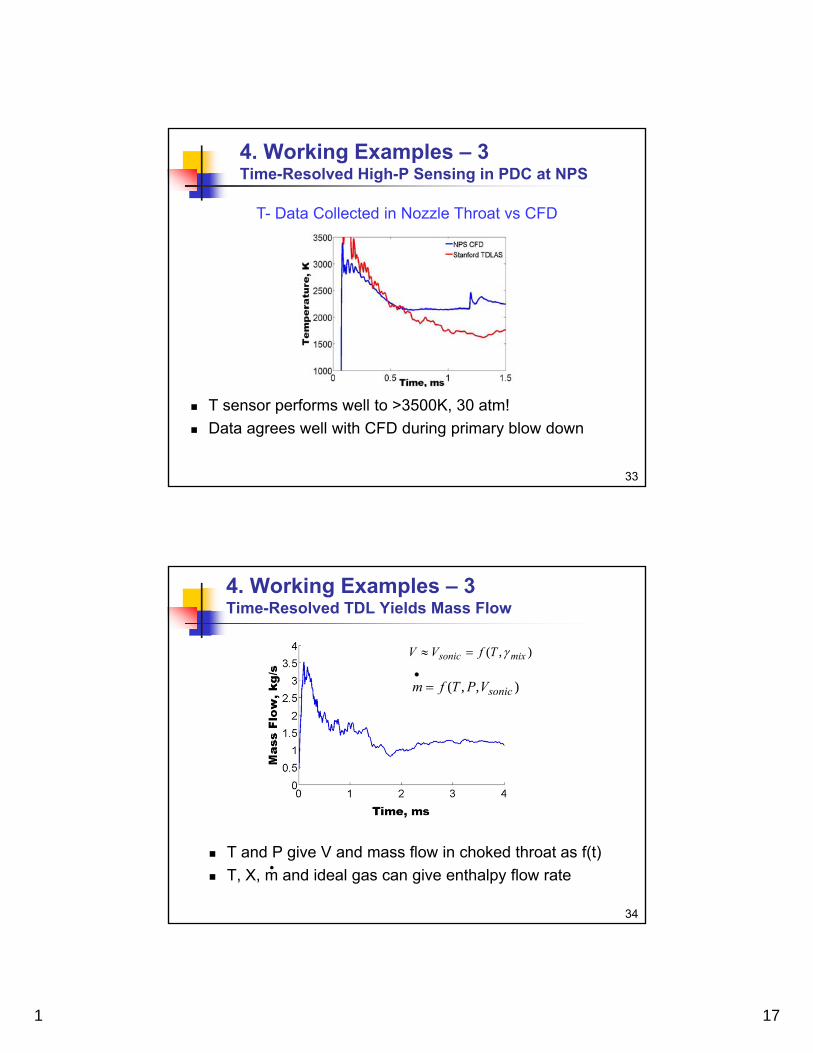
4. Working Examples – 3Time-Resolved High-P Sensing in PDC at NPS
Pulse-detonation combustor gives time-variable P/T
Time-resolved measurements monitor performance & test CFD
Assumption:
Choked flow T
gives velocity
T, P, V & Xi
yields
Enthalpy Flux
31
Pulse-detonation combustor gives time-variable P/T
Time-resolved measurements monitor performance & test CFD
Exhaust to ambient
Pulsed detonations
P
chamber
throat
Assumption: Choked flow
T gives velocity
T, P, V & Xi Enthalpy Flux1469 nm1392 nm
Throat Sensors
T & XH2O
([email protected]; [email protected])
32
4. Working Examples – 3Time-Resolved High-P Sensing in PDC at NPS
1 17
T- Data Collected in Nozzle Throat vs CFD
T sensor performs well to >3500K, 30 atm!
Data agrees well with CFD during primary blow down
33
4. Working Examples – 3Time-Resolved High-P Sensing in PDC at NPS
4. Working Examples – 3Time-Resolved TDL Yields Mass Flow
),,( sonicVPTfm
),( mixsonic TfVV
T and P give V and mass flow in choked throat as f(t)
T, X, m and ideal gas can give enthalpy flow rate.
34

1 18
H
m
hstag (T )
Time-resolved data provide key measures of engine performance
Power
Mass flow dynamics
H integrated over complete cycle for ηth
4 Consecutive Cycles
Tref = 298 K
35
4. Working Examples – 3Time-Resolved TDL Yields Enthalpy Flow Rate
Next: Diatomic Molecular Spectra
• Rotational and Vibrational Spectra
36