Embed Size (px)
Citation preview

Bega and Brogo Rivers Flood Study at Bega| 30011228 | Final Report | 06 June 2014 104
15 DESIGN EVENTS MODELLING
15.1 Design Rainfall
The temporal patterns and design rainfalls for design events up to the 1%AEP were derived from
procedures in AR&R giving a relationship between rainfall intensity, duration, and frequency (known as IFD).
The following key parameters were obtained from the Bureau of Meteorology website based on procedures
in AR&R87.
Table 15.1: Geographic Rainfall Factors for Bega and Brogo Rivers Catchment
Factor Value
Skewness G 0.17
F2 4.23
F50 15.69
Table 15.2: Log Normal Intensities for Bega and Brogo Rivers Catchment
Duration 2 Year ARI 50 Year ARI
1 hr 34.93 78.02
12 hr 8.08 18.8
72 hr 2.95 6.6
The basic IFD data above was applied in the XP-RAFTS model for design events of 10%, 5% , 2% and 1% AEP
events. A graph of the IFD data showing the relationship between rainfall intensity, duration, and
frequency is shown below.
Figure 15.1: Design Rainfall Relationship – Intensity Duration Frequency
Bega and Brogo Rivers Flood Study at Bega| 30011228 | Final Report | 06 June 2014 105
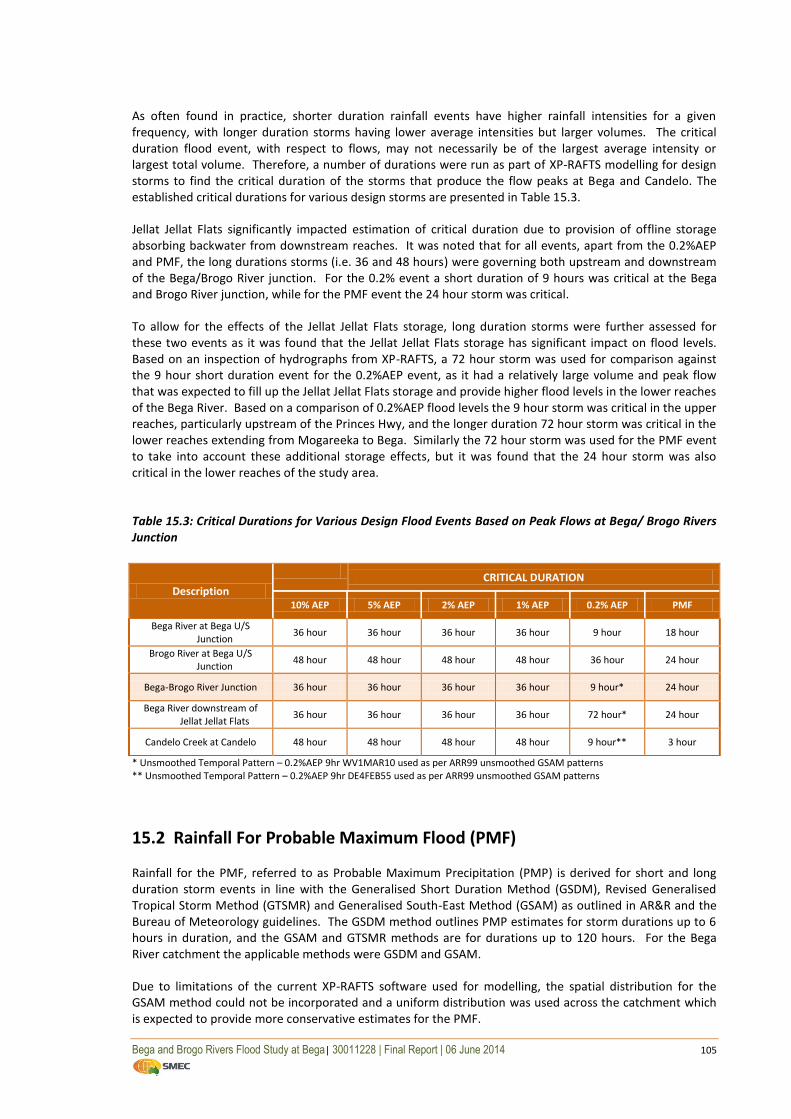
As often found in practice, shorter duration rainfall events have higher rainfall intensities for a given
frequency, with longer duration storms having lower average intensities but larger volumes. The critical
duration flood event, with respect to flows, may not necessarily be of the largest average intensity or
largest total volume. Therefore, a number of durations were run as part of XP-RAFTS modelling for design
storms to find the critical duration of the storms that produce the flow peaks at Bega and Candelo. The
established critical durations for various design storms are presented in Table 15.3.
Jellat Jellat Flats significantly impacted estimation of critical duration due to provision of offline storage
absorbing backwater from downstream reaches. It was noted that for all events, apart from the 0.2%AEP
and PMF, the long durations storms (i.e. 36 and 48 hours) were governing both upstream and downstream
of the Bega/Brogo River junction. For the 0.2% event a short duration of 9 hours was critical at the Bega
and Brogo River junction, while for the PMF event the 24 hour storm was critical.
To allow for the effects of the Jellat Jellat Flats storage, long duration storms were further assessed for
these two events as it was found that the Jellat Jellat Flats storage has significant impact on flood levels.
Based on an inspection of hydrographs from XP-RAFTS, a 72 hour storm was used for comparison against
the 9 hour short duration event for the 0.2%AEP event, as it had a relatively large volume and peak flow
that was expected to fill up the Jellat Jellat Flats storage and provide higher flood levels in the lower reaches
of the Bega River. Based on a comparison of 0.2%AEP flood levels the 9 hour storm was critical in the upper
reaches, particularly upstream of the Princes Hwy, and the longer duration 72 hour storm was critical in the
lower reaches extending from Mogareeka to Bega. Similarly the 72 hour storm was used for the PMF event
to take into account these additional storage effects, but it was found that the 24 hour storm was also
critical in the lower reaches of the study area.
Table 15.3: Critical Durations for Various Design Flood Events Based on Peak Flows at Bega/ Brogo Rivers
Junction
Description
CRITICAL DURATION
10% AEP 5% AEP 2% AEP 1% AEP 0.2% AEP PMF
Bega River at Bega U/S
Junction 36 hour 36 hour 36 hour 36 hour 9 hour 18 hour
Brogo River at Bega U/S
Junction 48 hour 48 hour 48 hour 48 hour 36 hour 24 hour
Bega-Brogo River Junction 36 hour 36 hour 36 hour 36 hour 9 hour* 24 hour
Bega River downstream of
Jellat Jellat Flats 36 hour 36 hour 36 hour 36 hour 72 hour* 24 hour
Candelo Creek at Candelo 48 hour 48 hour 48 hour 48 hour 9 hour** 3 hour
* Unsmoothed Temporal Pattern – 0.2%AEP 9hr WV1MAR10 used as per ARR99 unsmoothed GSAM patterns
** Unsmoothed Temporal Pattern – 0.2%AEP 9hr DE4FEB55 used as per ARR99 unsmoothed GSAM patterns
15.2 Rainfall For Probable Maximum Flood (PMF)
Rainfall for the PMF, referred to as Probable Maximum Precipitation (PMP) is derived for short and long
duration storm events in line with the Generalised Short Duration Method (GSDM), Revised Generalised
Tropical Storm Method (GTSMR) and Generalised South-East Method (GSAM) as outlined in AR&R and the
Bureau of Meteorology guidelines. The GSDM method outlines PMP estimates for storm durations up to 6
hours in duration, and the GSAM and GTSMR methods are for durations up to 120 hours. For the Bega
River catchment the applicable methods were GSDM and GSAM.
Due to limitations of the current XP-RAFTS software used for modelling, the spatial distribution for the
GSAM method could not be incorporated and a uniform distribution was used across the catchment which
is expected to provide more conservative estimates for the PMF.

Bega and Brogo Rivers Flood Study at Bega| 30011228 | Final Report | 06 June 2014 106
As per current AR&R99 guidelines, the temporal patterns applied to 0.2%AEP used GSDM smoothed and
GSAM unsmoothed methods that provide a gradual flood frequency curve from large to extreme flood
events.
15.3 Ocean Water Levels from Site Specific Analysis
For the current study a detailed site-specific analysis of ocean water levels for design events was
undertaken opposite of adopting the conservative default 1%AEP water level of 2.6 mAHD, in line with
recommendations of Flood Risk Management Guide (OEH, 2010). This approach provided a downstream
boundary that is more applicable to the particular entrance, a more accurate estimate of ocean levels and a
less conservative modelling results, in particular flood levels within the floodplain.
The site specific analysis included modelling in specific coastal modelling software programs (SWAN, ACES,
and SBEACH) to determine design flood levels for application as downstream boundary conditions.
The procedure steps allowed for determination of the wave setup for storm events ranging from 1 to 100yr
ARI including nearshore wave transformation, refraction coefficient and shoaling. A typical high tide was
selected after observation of tidal data. The storm surge levels were estimated using the Fort Denison
water level analysis (Figure C2 of the Appendix C of the attached “09698FortDenSeaLevRiseStudy.pdf”). Figure 7.1 from the FRM guide was then used for the timing of storm and tide.
While the default boundary condition is targeted towards the 1%AEP event, the site specific analysis can
apply to a range of different sized flood events. The site specific analysis resulted in peak ocean levels
ranging from about 2.02 mAHD in the 20%AEP, to 2.40 mAHD for the 1%AEP. The different components
used in developing the site specific analysis are presented in Appendix B.
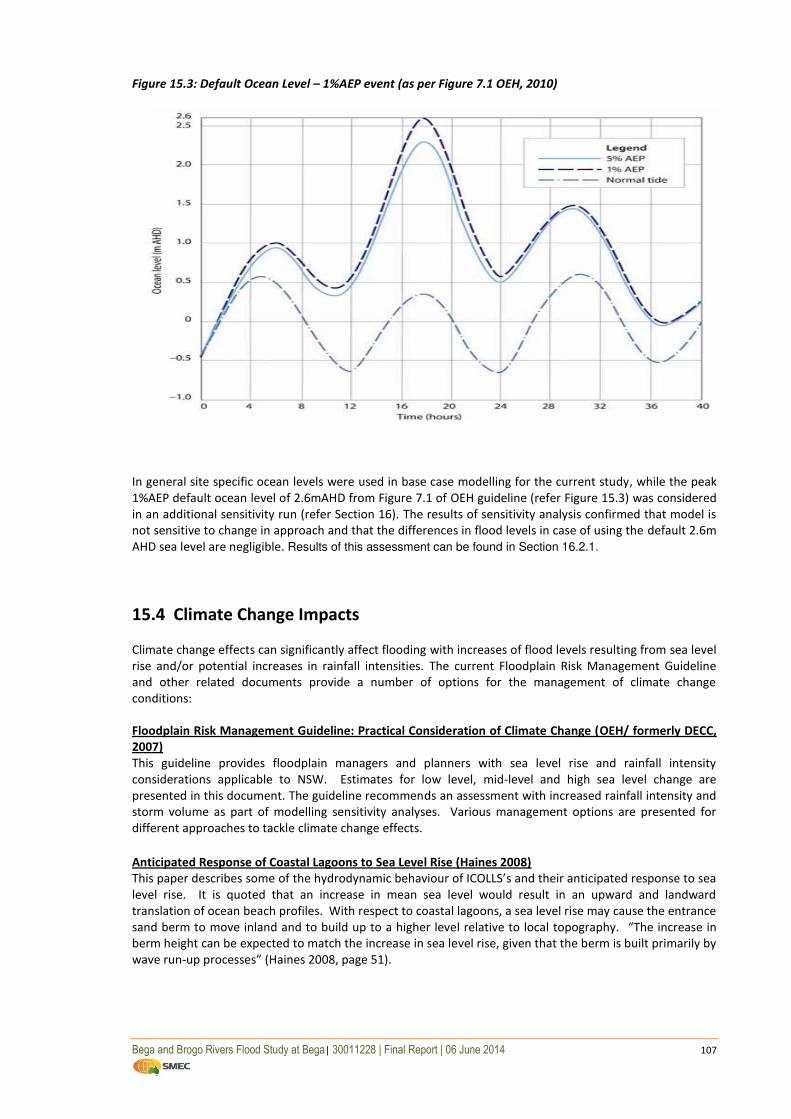
The analysis provides the mean storm water level that varies with time (unsteady). A plot of the 1%AEP
design tailwater levels developed by the site-specific analysis is shown in Figure 15.2 and the default 1%AEP
tailwater in Figure 15.3.
Figure 15.2: Site Specific Analysis – 1%AEP event
Bega and Brogo Rivers Flood Study at Bega| 30011228 | Final Report | 06 June 2014 107
Figure 15.3: Default Ocean Level – 1%AEP event (as per Figure 7.1 OEH, 2010)
In general site specific ocean levels were used in base case modelling for the current study, while the peak
1%AEP default ocean level of 2.6mAHD from Figure 7.1 of OEH guideline (refer Figure 15.3) was considered
in an additional sensitivity run (refer Section 16). The results of sensitivity analysis confirmed that model is
not sensitive to change in approach and that the differences in flood levels in case of using the default 2.6m
AHD sea level are negligible. Results of this assessment can be found in Section 16.2.1.
15.4 Climate Change Impacts
Climate change effects can significantly affect flooding with increases of flood levels resulting from sea level
rise and/or potential increases in rainfall intensities. The current Floodplain Risk Management Guideline
and other related documents provide a number of options for the management of climate change
conditions:
Floodplain Risk Management Guideline: Practical Consideration of Climate Change (OEH/ formerly DECC,
2007)
This guideline provides floodplain managers and planners with sea level rise and rainfall intensity
considerations applicable to NSW. Estimates for low level, mid-level and high sea level change are
presented in this document. The guideline recommends an assessment with increased rainfall intensity and
storm volume as part of modelling sensitivity analyses. Various management options are presented for
different approaches to tackle climate change effects.
Anticipated Response of Coastal Lagoons to Sea Level Rise (Haines 2008)
This paper describes some of the hydrodynamic behaviour of ICOLLS’s and their anticipated response to sea level rise. It is quoted that an increase in mean sea level would result in an upward and landward
translation of ocean beach profiles. With respect to coastal lagoons, a sea level rise may cause the entrance
sand berm to move inland and to build up to a higher level relative to local topography. “The increase in
berm height can be expected to match the increase in sea level rise, given that the berm is built primarily by
wave run-up processes” (Haines 2008, page 51).

Bega and Brogo Rivers Flood Study at Bega| 30011228 | Final Report | 06 June 2014 108
NSW Flood Risk Management Guide: Incorporating sea level rise benchmarks in flood risk assessments
(OEH 2010)
This guide updates the sea level rise section of the Floodplain Risk Management Guideline: Practical
Consideration of Climate Change (DECC 2007). The benchmarks for NSW sea level rise are drawn from the
NSW Sea Level Rise Policy Statement (2009). This guide identifies that:
“flood studies need to account for the coincidence of catchment and coastal flooding and their varying
influence with location in the tidal waterway in deriving flood levels and associated flood planning levels.
This requires appropriate assumptions on downstream boundary conditions and initial water levels and
examination of a number of combined catchment and coastal flooding scenarios” (OEH 2010).
The appendix of OEH (2010) provides recommendations on modelling of the interaction of catchment and
coastal flooding.
Bega River would be classified as Class 3 – catchments that normally drain directly to the ocean via shoaled
entrances, or Class 4 – catchments with normally closed or partially blocked entrances. Modelling
approaches are recommended including the use of steady/unsteady flow models, fixed/dynamic entrance
conditions, initial water levels, envelope approaches to flood planning levels, default/site specific analyses
of downstream boundary conditions, and sea level rise predictions.
15.4.1 Sea Level Rise
Former DECCW guidelines indicated that the 2007 Intergovernmental Panel for Climate Change (IPCC)
Fourth Assessment Report provided a range of future sea level rises depending on the level of future carbon
emissions. The upper range scenario allows for 59 cm sea level rise by 2095, plus an additional allowance
for ice-melt uncertainty of up to 20 cm. Further to this, CSIRO advocate up to a further 12 cm of sea level
rise due to local effects caused by the East Australia Current, totalling 91cm. Thus, the upper-range
scenario is for 91 cm of sea level rise for the NSW coast by the end of the century, and similarly 40cm by
2050. The former NSW Sea Level Rise Policy Statement (2009) similarly recommends sea level rise
estimates of 0.4m and 0.9m for the 2050 and 2100 scenario respectively, relative to the 1990 mean sea
level. The same benchmarks are recommended in the OEH Floodplain Risk Management Guide (OEH,
2010), however current NSW Government policy, introduced following the commissioning of this study,
requires councils to adopt their own sea level rise projections.
As indicated above the global trend in mean sea-level rise can vary with location around the world.
However a plot of the global trend sourced from the BoM Annual Climate Summary 2012 is shown in Figure
15.4 below showing that sea levels since 1993 has been generally rising at an average rate of 3.2mm/year.
This plot shows a definite upward trend in sea level rise,
Figure 15.4: Measurements of Global Mean Sea Level from Satellites from Jan 1993 to Dec 2012, source:
CSIRO (BoM, 2012)
Bega and Brogo Rivers Flood Study at Bega| 30011228 | Final Report | 06 June 2014 109
Sea level rise estimates used in the preliminary FPL’s developed in the current study source 0.4m SLR for the
Scenario 1 and 0.9m for Scenario 2 based on the abovementioned estimates. This is consistent with the
project brief developed prior to the change in NSW Government policy and is consistent with best currently
available information including the NSW Chief Scientist and Engineer Report (April 2012). In addition to sea
level rise impacting on the ocean levels, the effects of sea level rise can potentially increase the
accumulation of sand along the river bed and at the berm and associated heights at the entrance opening.
There have also been recent changes to the NSW Government policy on sea level rise associated with the
stage 2 Coastal Reforms. It is therefore recommended that council undertake a more detailed assessment
of the potential impacts of sea level rise on flood risk as part of developing its Floodplain Risk Management
Plan.
15.4.2 Increase of Rainfall Intensities
Climate change can also include increases in rainfall intensities in addition to sea level rise, although the
changes to rainfall patterns and distributions are less known or predictable. Climate change associated with
increases in rainfall can impact on hydrologic and hydraulics processes, where flows and flood levels can be
affected. The current OEH guidelines advocate assessment of this impact for an increase range of 10-30%
for consideration in floodplain management process. For the current study a 10 and 30% increase in rainfall
intensities were assessed during the sensitivity analysis, using the 1%AEP event as a base case.
15.4.3 Management Options for Climate Change Impacts
Apart from the recommended assessment of the impact of these changes on flooding affectations in
existing conditions, considering the need to provide solid planning tools for a longer development period,
the predicted sea level rise and increases in rainfall intensities can be considered for inclusion in modelling
as a basic condition for design events. This issue requires a thorough communication with and
consideration of Council to assure that the most appropriate and economically justifiable approach is
adopted.
For the purpose of this study, the sea level rise component and rainfall intensity increase effects were not
included in basic design modelling, however they were considered separately as part of the Sensitivity
Analysis. In addition, a preliminary assessment of flood planning levels was carried out including sea level
rise (SLR) and results presented for the existing conditions and year 2050 and 2100 projections. Refer
Appendix H.
Based on these scenarios a number of approaches can be adopted in the Floodplain Risk Management of
the study area. It is understood that Council will further consider the impacts of climate change in the next
stage of the floodplain risk management process during preparation of the Floodplain Risk Management
Study.
15.5 Coincidental Flooding from the River and Ocean
In order to establish the appropriate downstream conditions, an estimate was made for the joint probability
of coincidence of occurrence of the peak flows from the Bega River and water level conditions from the
ocean. The peak levels from the ocean were adjusted to coincide with the peak flow in the main river, using
a more frequent design water level in line with current floodplain management practice. For example, peak
flows in the river under the 0.2% AEP flood event corresponded with peak water levels from the ocean
producing the 2% AEP flood event.
This approach is considered to be more appropriate than if the same AEP was used for both the catchment
flows and ocean levels, which is less likely to occur and was considered to be too conservative as it would
significantly exceed the given AEP. The combinations of catchment and ocean flooding with different sized
flood combinations are shown in Table 15.4 based on the estimated joint probabilities.

Bega and Brogo Rivers Flood Study at Bega| 30011228 | Final Report | 06 June 2014 110
Table 15.4: Coincidental Flooding of Bega River from Catchment and Ocean Flooding
River Flood Frequency Ocean Levels
Frequency Basis for Recommendation
PMF 1% AEP Estimated ( based on current FRM practice)
0.2% AEP 2% AEP Estimated ( based on current FRM practice)
1% AEP* 5% AEP Joint probability assessment and envelope as per current OEH
guidelines with managed and unmanaged cases
1% AEP* tide Joint probability assessment and envelope as per current OEH
guidelines
5% AEP* 1%AEP Joint probability assessment and envelope as per current OEH
guidelines
2% AEP 5% AEP Estimated ( based on current FRM practice)
5% AEP 10% AEP Estimated ( based on current FRM practice)
10% AEP 20% AEP Estimated ( based on current FRM practice)
*envelope approach required for establishment of preliminary flood planning levels
In line with recommendations in OEH guidelines the highlighted scenarios were considered in preparation
of Preliminary Flood Planning Levels.
For the base case modelling, managed entrance conditions were applied with the exception of 5%AEP
catchment with 1% AEP Ocean flooding, where the entrance was initially open to provide a conservative
estimate where floodwaters from the ocean can fill the lagoon and tidal waterway early in the storm. In
addition to these conditions an unmanaged entrance was assessed to consider no maintenance of the
entrance and the effects on preliminary flood planning levels.
Peak flowrates and corresponding peak ocean levels are presented in Table 15.5.
Table 15.5: Catchment and Ocean Flooding Combinations
DESCRIPTION UNIT JOINT PROBABILITY PARAMETERS
AEP catchment flooding - 10% 5% 2% 5% 1% 1% 0.2% PMF
Peak Flowrate
catchment flooding at
Bega-Brogo Rivers junction*
m3/s 5056 6373 7810 6373 9231 9231
10424/
8791 23395
Peak Flowrate
catchment flooding at
Mogareeka
m3/s 3319 4165 5194 4224 6350 6110
5635/
7196 18734
AEP ocean flooding - 20% 10% 5% 1% tide 5% 2% 1%
Peak Level
Ocean Boundary Condition m
3/s 2.02 2.09 2.18 2.40 0.86 2.18 2.29 2.40
*Quickflow component only
Bega and Brogo Rivers Flood Study at Bega| 30011228 | Final Report | 06 June 2014 111
15.6 Assessment of Blockage
15.6.1 Basis for Assessment
As part of the recent revision of publication Australian Rainfall and Runoff currently underway, the Stage 2
Report has been recently released (February 2013) and includes blockage issues, blockage analysis and
assessment, design and analysis of drainage systems, pit and pipe blockages, the management of blockage,
generic blockage factors, and further recommendations. Alternative methodologies for the analysis and
assessment of blockages outlined in the report include:
Scheme A (based on papers by Barthelmess, Rigby, Silveri, et al);
Scheme B (by Witheridge); or
Generic Blockage Factors.
Scheme A Methodology uses a method based on the likelihood and consequences of blockage. The
likelihood uses a qualitative base value for debris reaching a structure based on the consideration of debris
availability, mobility, and transportability, to determine a “Debris Potential” for difference sized events.
Using Scheme A, events are categorised as:
Design floods smaller than 20 year ARI;
Design floods between 20 year and 200 year ARI;
Design Floods greater than the 200 year ARI.
Following an estimate of the length of the longest 10% of debris that could arrive at the site (termed L10),
quantitative estimates for blockages at structures are provided in terms of a percentage blockage where
100% blockage represents a fully blocked structure. The consequences of blockage are then rated as either
Very Low, Low, Moderate, High or Very High and the previously determined percentage blockages modified.
In this way the likelihood and consequences are used in a risk based assessment.
Scheme B Methodology incorporates likelihood and consequences into the assessment with 5 levels of
consequence based on the cost of damages, health, environment, social impacts, impacts to the
community, and legal implications. Once categorises for likelihood and consequences are determined, a
risk matrix is used to determine a “risk level”. Following the determination of risk level, approaches to
blockages at individual hydraulic structures are recommended in addition to the degree of blockage for
cross drainage structures or not-cross drainage structures. Blockage conditions are quoted as “design” or “severe” blockage under different flood events with suggested values available for adoption.
Generic Blockage Factors are provided in the Stage 2 report of AR&R – Blockage
A table of generic blockage factors are provided depending on type of structure, design or severe blockage.
However, some factors stated under this method are difficult to estimate without specific knowledge of
debris accumulation potential for different sized floods, and would rely on significant assumptions on
blocking conditions.
Annual Average Rainfall
The annual average rainfall is used to help assess the debris potential for blockage calculations in the above
Scheme A methodology. The temporal distribution of average annual rainfall was plotted for 7 sites within
the catchment as shown in Fig. 15.5, indicating a medium level of variability. A spatial plot of average
annual totals obtained from the Bureau of Meteorology is also presented (Fig 15.6) indicating a medium
level of average annual rainfall near the Bega region.

Bega and Brogo Rivers Flood Study at Bega| 30011228 | Final Report | 06 June 2014 112
Figure 15.5: Temporal Distribution of Annual Rainfall
Figure 15.6: Average Annual Rainfall across NSW (source BoM)
15.6.2 Adopted Approach
The adopted approach for this study applied the methodologies from Scheme A of the AR&R Stage 2 report
on blockage, as it was considered to be relatively straight forward, while comprehensive analysis of
blockage for the bridges modelled in the current study.
The debris availability describes the potential for the production of debris at source before mobilisation and
transport of debris. The debris availability for the Bega/Brogo Rivers catchment has been categorised as
“Medium” based on indicative characteristics in the AR&R Stage 2 Report. The Medium level of Availability
is mainly based on:
Bega and Brogo Rivers Flood Study at Bega| 30011228 | Final Report | 06 June 2014 113
source areas that generally fall between High and Low categories, suggesting Medium.
the existence of state forest areas, grazing land with stands of trees, suggesting Medium.
Totals of Average Annual rainfall, and temporal distribution of Annual Rainfall, suggesting
Medium.
considerable fallen limbs, leaves and high levels of floor litter, suggests High.
NOT Arid, suggest Medium or Low.
NOT Urban with cars and stored loose material close to water courses, and NOT a
considerable distance from watercourses, suggesting Medium.
Debris mobility refers to the ease with which the available debris is initially mobilised at the on-set of debris
movement from the source and before the transportation phase. The debris mobility for the current study
has been categorised as “Medium” based on indicative characteristics in the AR&R Stage 2 Report. The
Medium level of Mobility is mainly based on:
Areas generally falling between the High and Low Categories, suggesting Medium.
Steep catchments in the upper reaches of the catchment and mild slopes in the mid to
lower reaches of the catchment, suggesting Medium.
Totals of Average Annual rainfall, suggesting Medium.
With cover not considered to be Arid, suggesting Medium to Low.
The debris transportability refers to the “ease with which the mobilised debris is transported”. The debris
transportability for the current study has been categorised as “High” based on indicative characteristics in the AR&R Stage 2 report. The High level of Transportability is mainly based on:
Bed slopes less than 1% grade, suggested Low category.
Wide streams relative to debris load dimensions, suggesting High.
Banks are prone to scour during a design event, suggesting High.
Totals of Average Annual rainfall, and temporal distribution of Annual Rainfall, suggesting
Medium.
The three categories for the debris availability, mobility and transportability are combined to give (Medium-
Medium-High). The Debris Potential is then read from the AR&R documentation as corresponding to a
Medium level of debris potential. However given the large amount of damage and large degree of debris
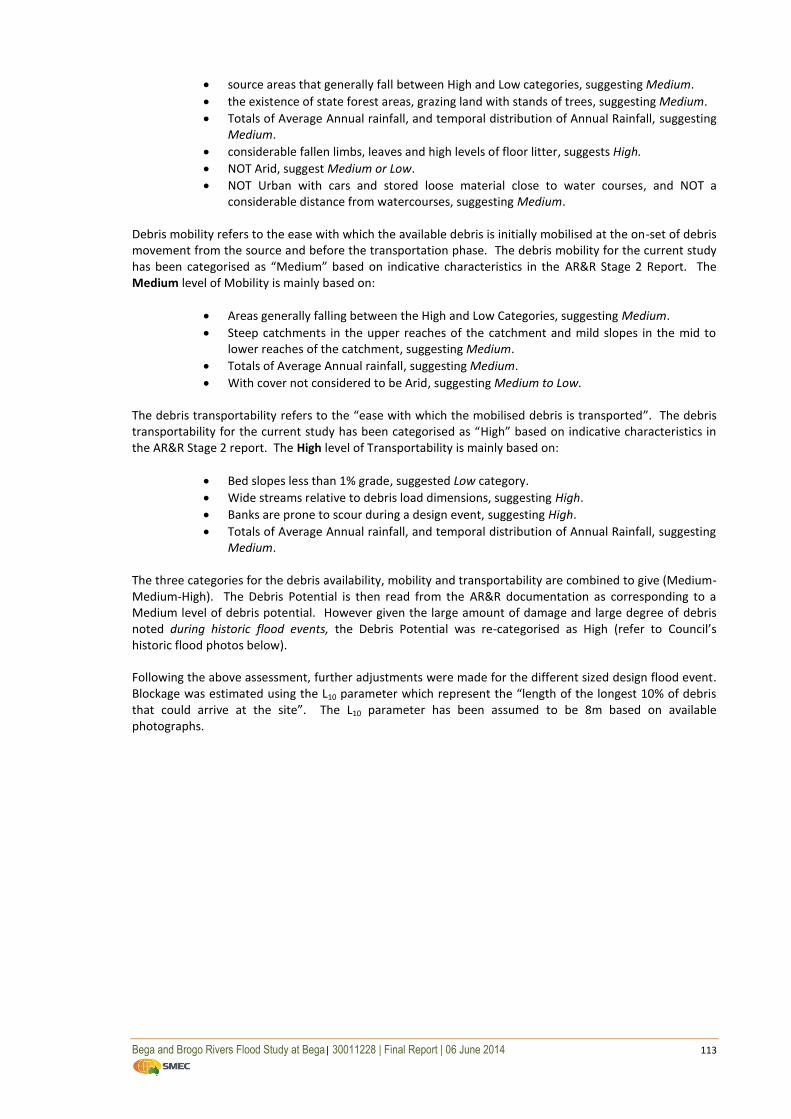
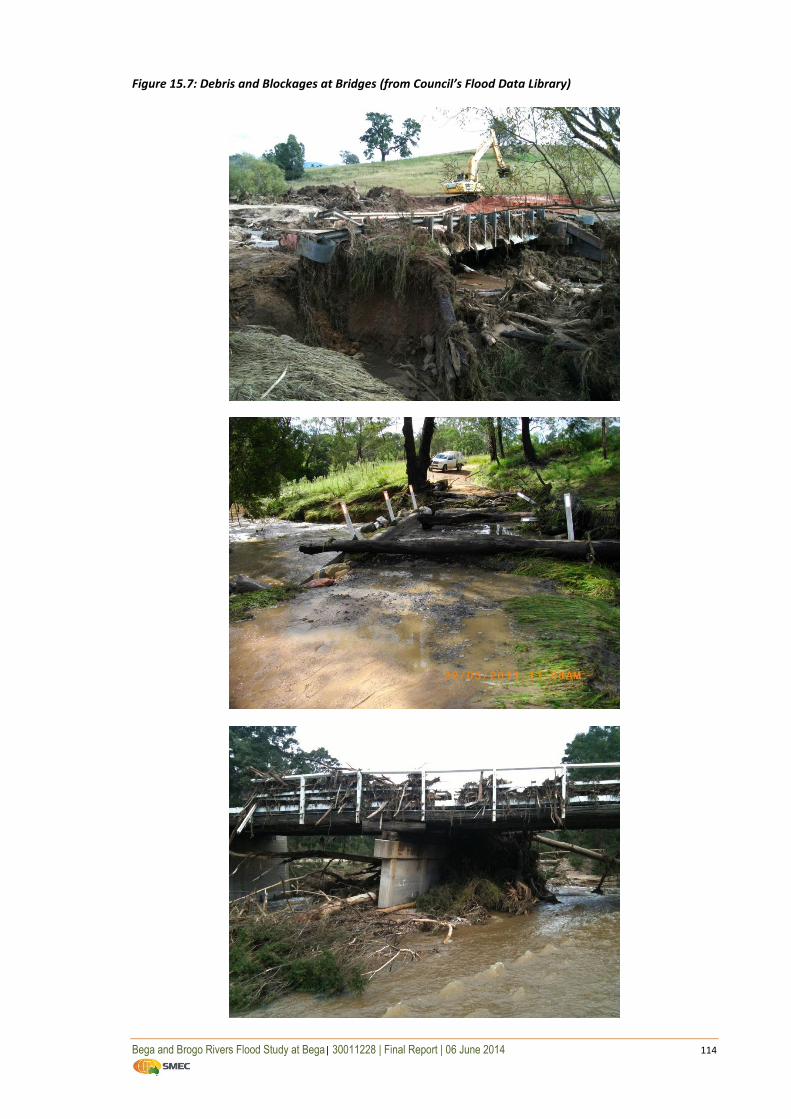
noted during historic flood events, the Debris Potential was re-categorised as High (refer to Council’s historic flood photos below).
Following the above assessment, further adjustments were made for the different sized design flood event.
Blockage was estimated using the L10 parameter which represent the “length of the longest 10% of debris that could arrive at the site”. The L10 parameter has been assumed to be 8m based on available
photographs.
Bega and Brogo Rivers Flood Study at Bega| 30011228 | Final Report | 06 June 2014 114
Figure 15.7: Debris and Blockages at Bridges (from Council’s Flood Data Library)

Bega and Brogo Rivers Flood Study at Bega| 30011228 | Final Report | 06 June 2014 115
For the design events used in this study the base debris potential gives the following Blockage Levels.
Table 15.6: Most Likely Blockage Levels Based on Debris Potential Alone
Design Flood Event Base Debris
Potential
“Most Likely” Blockage Level (BDES)
W<L10 L10 ≤ W ≤ 3*L10 W>3*L10 10% AEP Medium 50% 10% 0%
5% AEP Medium 50% 10% 0%
2% AEP High 100% 20% 10%
1% AEP High 100% 20% 10%
0.2% AEP High 100% 20% 10%
PMF High 100% 20% 10%
*W refers to control dimension taken here as the diagonal measurement of the opening
Depending on the consequences associated with failure of a structure, the “most likely” blockage levels are
adjusted to cater for the varying consequence levels. A possible (‘severe’) blockage level increases the likely
blockages where the consequences of severe blockage levels are high.

Bega and Brogo Rivers Flood Study at Bega| 30011228 | Final Report | 06 June 2014 116
Table 15.7: Blockage Levels Based on Likelihood and Consequences
Design Flood
Event
Consequence
Level Additional Risk
“Most Likely” Blockage Level (BDES)
W<L10 L10 ≤ W ≤
3*L10 W>3*L10
10% AEP High Design 50% 10% 0%
5% AEP High Design 50% 10% 0%
2% AEP High Design 100% 20% 10%
1% AEP Very High Severe 100% 40% 20%
0.2% AEP Very High Severe 100% 40% 20%
PMF Very High Severe 100% 40% 20%
*W refers to control dimension taken here as the diagonal measurement of the opening
The derived blockage factors were then applied to each individual bridge segment for the various sized
design flood events (refer Appendix C). To simplify application in modelling the segmental blockage factors
were then generalised for overall bridge span. The results are summarised in Table 15.8 below for each
bridge in the modelled system.
Table 15.8: Adopted Blockage Factors for Bridges within the Modelling Area
Bridge Blockage Factors (%)
10% AEP 5% AEP 2% AEP 1% AEP 0.2% AEP PMF Princes Highway Large Span
Bridge 0 0 10 20 20 20
Tarraganda Lane bridge
– Bega River 10 10 20 40 40 40
Tarraganda Lane bridge
– Bega River Anabranch 10 10 20 40 40 40
Tathra - Bermagui Bridge 10 10 20 40 40 40
Candelo 10 10 20 40 40 40

Bega and Brogo Rivers Flood Study at Bega| 30011228 | Final Report | 06 June 2014 117
15.7 Design Event Runs
15.7.1 Scenarios for Design Modelling Runs
Following the hydrologic and hydraulic models calibration and adoption of design parameters, the
hydrologic model was run for the design events, including 10%, 5%, 2%, 1%, 0.2% AEP and PMF events. This
provided the quickflow component, with baseflows subsequently added to form total flow hydrographs
required as input into the XP-SWMM2D hydraulic model. The effects of full water storages in Brogo and
Cochrane Dam were considered by applying initial values set at full storage volumes/ levels for each design
flood event.
XP-SWMM2D was then run for all design storms with a combination of catchment and ocean flooding
subject to unsteady, dynamically changing berm conditions as discussed in Section 14.8.3. The combination
of catchment and ocean flooding was run to include coincidental peaks as suggested in OEH guidelines. The
timing of the peaks from the catchment flows and ocean levels was adjusted to occur simultaneously in
order to produce the critical flood conditions.
Maps showing modelled design flood event parameters including flood extents, water levels, depths and
velocities are presented in Appendix F and Appendix K.
15.7.2 Flood Behaviour
Both the Bega and Brogo River sub-catchments are noted to contribute significantly to flooding at Bega. In
the 1%AEP flood the estimated peak flowrate along Bega River is 6160 m3/s and along Brogo River 3155
m3/s. At the junction the maximum combined peak flowrate was 9230 m
3/s, well above that of any single
river alone.
It was noted that flooding along Bega River is subject to a large reduction in peak flowrate from the Bega-
Brogo Rivers junction to the outlet at Mogareeka. This is largely attributed to the influence that Jellat Jellat
Flats has as a storage area plus the storage routing along Bega River floodplain.
Jellat Jellat Flats is an off-line storage between Bega and Mogareeka that gets engaged during significant
flood events. Downstream of Jellat Jellat Flats flows are constrained into a relatively narrow river channel
with limited conveyance capacity. The result is that flows get attenuated at Jellat Jellat Flats and the peak
flowrates are significantly reduced in the lower reaches of Bega River, while a backwater effect occurs from
the downstream channel impacting on upstream flood levels.
Overflows occurred from Jellat Jellat Flats into Wallagoot Lake in the PMF Event while for the other events
flows between Jellat Jellat Flats and Wallagoot Lake were not linked.
A plot of the water surface profiles from the 10%, 5%, 2%, 1%, 0.2% AEP events and PMF events in
conjunction with the joint probability approximations (i.e. 20%, 10%, 5%, 5%, 2%, 1%AEP respectively) are
shown in Figure 15.6 below. The 1%AEP water surface profile indicates flood depths of about 10m, 11m,
and 13m at the crossings along Bega River at Princes Hwy and Tarraganda Lane main bridge and at Jellat
Jellat Flats respectively. PMF depths are about 17m, 20m and 22m respectively. Compared to previously
developed (1979) water surface profiles supplied by Council, the profiles of the design events computed in
the current study are higher.

Bega and Brogo Rivers Flood Study at Bega| 30011228 | Final Report | 06 June 2014 118
Figure 15.8: Water Surface Profiles along Bega River

Bega and Brogo Rivers Flood Study at Bega| 30011228 | Final Report | 06 June 2014 119
The computed design water levels at flood gauges within the modelling area and their relationship to the
gauge RL is presented in the following table.
Table 15.9: Design Flood Levels at Flood Gauges within the Modelling Area
Station
No Station Name
Flood
Gauge
0RL
(mAHD)
Coordinates Design Flood Level
mAHD / Local Gauge Level mRL
Latitude Longitude 10% 5% 2% 1% 0.2% PMF
219900 Bega River @ Bega 5.701 -36.669 149.830 13.96 14.48 14.99 15.49 15.86 22.83
8.26 8.78 9.29 9.79 10.16 17.13
219026 Bega River @
Warraguburra 0.54 -36.702 149.872
9.85 11.02 12.38 13.48 14.6 22.32
9.31 10.48 11.84 12.94 14.06 21.78
219410 Bega River @
Tathra (Bega Live) 0.00 -36.703 149.978
3.35 3.48 3.59 4.02 4.37 6.84
3.35 3.48 3.59 4.02 4.37 6.84
NOTE: Highlighted values represent design flood levels relative to the local gauge. Local gauge levels at Station 219410 are to AHD.
Although some additional flood gauges operated by NSW State Water exist in the modelling area (Stations
219064- Brogo River @ Apps Crossing, 219063- Bega @ Darceys and 219065- Bega River @ Barrage), the
flood level vs. gauge level relationship could not be established as the gauge zero level (0RL) was not
available in mAHD.
An initial comparison of the 1%AEP and PMF flood extents in the vicinity of the proposed Princes Highway
upgrade is shown below. The upgrade alignment is superimposed on the pre-upgrade flood extents
computed in the current study. The upgrade appears to have minimal interaction with flooding based on
the existing layout but the affectation might need to be confirmed once the construction is complete and
WAE (Works-As-Executed) levels have been confirmed.
Figure 15.9: Approximate Location of Proposed Upgrade

Bega and Brogo Rivers Flood Study at Bega| 30011228 | Final Report | 06 June 2014 120
The Candelo Creek model was run for the same set of design events with the modelled flood levels along
the creek and flood maps shown in Appendix J and Appendix K respectively. The maps show a range of
flood extents, with the 10%AEP event primarily confined to the creek in the area near Candelo Bridge but
overflowing the banks and potentially cutting access to roads and affecting some properties in other areas.
The affectation increases with less frequent events. The PMF is a significantly larger event with more
overbank flow and properties affected.
Some areas of Candelo along the local flowpaths and creek gullies may be subject to additional flooding
from backwaters (such as at Gordon Street, along Power Street, Eden and Pambula Streets, Tantawangalo-
Mountain Road, the southern end of Myrtle-Mountain Road). Flooding along these areas could not be
mapped as it would require significantly more survey data.
Modelling of Brogo Dam indicates that the dam is subject to overtopping above the dam crest level
(118.10mAHD) in the PMF event based on Probable Maximum Precipitation Design Flood (PMPDF).This
highlights that the dam might need to be raised to minimise potential for dam failure due to excessive
overtopping. In terms of flood mitigation functionality of the dam, there is no available airspace which
could be utilised for flood mitigation. Detailed dambreak studies for Brogo and Cochrane Dams are
recommended to assess the likely consequences of dam failure on downstream properties.
15.7.3 Capacity of Hydraulics Structures
The modelling indicates that the existing large span Princes Highway Bridge has a capacity around the
0.2%AEP but no available freeboard in the 0.2%AEP (i.e. flood levels reach above the soffit level but are
below the deck level). The Tarraganda Lane main bridge and Tarraganda Lane anabranch bridge are subject
to overtopping in frequent events, such as the 10%AEP event and above. The Tathra-Bermagui bridge near
Mogareeka is subject to overtopping in the 5%AEP event but with no available freeboard even in the
smaller, 10%AEP event. Similarly, the bridge at Candelo has approximately 10%AEP capacity.
The overtopping of bridge sites for a range of different sized flood events, together with corresponding
flood levels and associated freeboards , is listed in Tables 15.10 and 15.11.
Table 15.10: Design Flood Levels at Hydraulic Structures
CROSSING
DESIGN FLOOD LEVEL (mAHD)
Road
Level
(m AHD)
10% AEP 5% AEP 2% AEP 1% AEP 0.2%AEP PMF
Princes Highway 17.90 14.32 14.86 15.48 16.15 16.63 22.86
Tarraganda Bridge –
Bega River 10.27 12.09 12.62 13.23 14.08 15.04 22.57
Tarraganda Bridge –
Bega River Anabranch 10.33 12.37 12.87 13.45 14.25 15.21 22.76
Tathra-Bermagui 3.45 3.36 3.50 3.64 4.43 4.65 7.24
Candelo Creek 101.48 100.42 101.60 102.25 102.92 103.45 107.67
* highlighted values indicate overtopping of the structure

Bega and Brogo Rivers Flood Study at Bega| 30011228 | Final Report | 06 June 2014 121
Table 15.11: Freeboard at Hydraulic Structures
CROSSING
Approx.
Bridge
Soffit
Level
(m AHD)
FREEBOARD TO BRIDGE SOFFIT (m)
10% AEP 5% AEP 2% AEP 1% AEP 0.2%AEP PMF
Princes Highway 16.53 2.21 1.67 1.05 0.38 -0.10 -6.33
Tarraganda Bridge –
Bega River 9.51 -2.58 -3.11 -3.72 -4.57 -5.53 -13.06
Tarraganda Bridge –
Bega River Anabranch 9.71 -2.66 -3.16 -3.74 -4.54 -5.50 -13.05
Tathra-Bermagui 2.33 -1.03 -1.17 -1.31 -2.10 -2.32 -4.91
Candelo Creek 100.36 -0.06 -1.24 -1.89 -2.56 -3.09 -7.31
* highlighted values indicate no freeboard to soffit of the bridge
*negative value of freeboard indicates overtopping of the soffit with the depth of overtopping as per the value in the table
The results also indicate that the Princes Highway bridge at Bega River is subject to overtopping in events
greater than the 0.2%AEP and overtopping of the deck by about 5.0m in the PMF event. In the 1%AEP
design flood event the Princes Highway bridge had 0.38m of freeboard available to the soffit level. The
results indicated that the PMF flows may overtop the Tarraganda Lane crossings by about 12.3m.
At the main Bega River crossing - Tarraganda Lane, the bridge is overtopped in all events modelled including
the 10%AEP event. The freeboard in the 1%AEP event was about -4.6m (i.e. no available freeboard to the
soffit) with the road level overtopping by about 3.8m in the 1%AEP event. In the 10%%AEP event the road
level is subject to overtopping by about 1.8m.
At the Tarraganda Lane anabranch crossing south of the main Bega River crossing, the bridge may be
subject to overtopping by about 2.0m in the 10%AEP event and about 3.9m in the 1%AEP event. The results
indicated that during the PMF, flows may overtop the Tarraganda Lane Anabranch crossing by 12.4m. The
freeboard to the soffit level at this crossing was about -4.5m in the 1%AEP design flood event (i.e. no
freeboard).
The Tathra bridge is subject to overtopping in the 5%AEP by about 0.1m, by about 1.0m in the 1%AEP, and
by about 3.8m in the PMF. The available freeboard in the 1%AEP design event is about -2.1m to the soffit
level, i.e. no freeboard.
The relatively low capacities at the bridge crossings may be indicative of the relatively large flows from the
catchment, relatively restricted channel capacity particularly leading into Bega, and downstream of Jellat
Jellat Flats, and high potential for blockages at bridge crossings due to debris potential, likelihood and
consequences.
The estimated duration of overtopping of each bridge is presented in Table 15.12.

Bega and Brogo Rivers Flood Study at Bega| 30011228 | Final Report | 06 June 2014 122
Table 15.12: Duration of Bridge Overtopping in Design Events
CROSSING DURATION OF BRIDGE OVERTOPPING (Hours)**
10% AEP 5% AEP 2% AEP 1% AEP 0.2%AEP PMF
Princes Highway - - - - - 29.0
Tarraganda Bridge –
Bega River 19.3 22.8 27.3 31.8 > 71.5 > 74.5
Tarraganda Bridge –
Bega River Anabranch 21.8 27.8 29.8 32.8 > 71.5 > 74.5
Tathra-Bermagui - 1.3 9.3 17.8 31.0 > 74.5
Candelo Creek - 0.7 3.0 5.6 6.4 6.2
* highlighted values indicate overtopping of the structure
** May be subject to longer durations of bridge overtopping
The overtopping durations may need to be considered in the development of an emergency response to
assist in preparing the community for flood events and evacuation plans. Although overtopping from real-
time historic floods can vary from design floods, the PMF design event may be considered as an extreme
case and could be used for this assessment to determine the duration of road closures. Further assessment
of emergency management issues may be considered as part of the next stage of the flood planning process
(Floodplain Risk Management Study).
The impact of Jellat Jellat Weir had an insignificant impact on major flooding as it overtopped by more than
8m in all modelled design events. The width of the floodplain controlling the ingress of water in the area of
Jellat Jellat Weir is about 2km which represents a much larger waterway area compared to the weir.
15.7.4 Other Considerations
The effects of existing and future development were considered by:
Using the LEP2012, where impervious percentages were applied to individual subareas in the
hydrologic model. No changes to these percentages were applied for future development as the
hydrology was not considered sensitive to imperviousness under the present condition of the
catchment which is predominately rural landscapes including farmland and forested areas.
The roughness for areas along the Bega/Brogo River floodplain represented used in the XP-
SWMM2D model were based on aerial photographs, dated 2010 and assumed to apply to existing
and future development as it is not envisaged that major changes to development will occur in this
area due to existing level of flood affectation.
The impact of the proposed RMS road upgrade included a preliminary assessment by
superimposing the current 1%AEP and PMF flood extents using pre-upgrade conditions with the
design layout, indicating that most of the proposed road is outside of the 1%AEP and PMF flood
extents.
Future consequences as a result of potential climate change conditions such as increased rainfall
intensity and sea level rise has been assessed separately as part of the sensitivity analyses. Sea
level rise was incorporated in the preparation of preliminary flood planning levels.