Embed Size (px)
Citation preview

15. Canopy Arthropods and Their Response to ForestDisturbance
T.D. Schowalter and D.A. Crossley, Jr.
Most ecological studies of forest canopy arthropods have focused on populationdynamics. These studies have contributed much to our understanding of populationresponses to changes in environmental conditions. Moreover, advances in populationtheory have indicated the importance of understanding the dynamics of species assem-blages. Population irruptions do not result simply from changes in abiotic or host con-ditions, but also reflect competitive interactions within guilds and predisposingchanges in host or predator conditions affected by other guilds (Schowalter 1985). Barkbeetle population irruptions, for example, may result from host stress aggravated bydefoliator populations (Berryman and Wright 1978).
The nature of interactions within and between arthropod guilds and the effects ofthose interactions on primary productivity have suggested regulatory roles (Mattsonand Addy 1975; Odum 1969; Patten and Odum 1981). Schowalter (1981, 1985)advanced the cybernetic view of ecosystems by proposing that the state of preda-tor—prey interactions varies as a function of ecosystem carrying capacity. Resource sub-sidy promotes prey population growth while resource stress promotes predatorpopulation growth. This view also casts succession as a consequence of regulatoryresponses to delayed disturbance, i.e., as a succession of associations adapted todecreasing disturbance frequency, rather than as a goal-oriented community strategy.However, few studies have documented changes in arthropod assemblages resultingfrom changes in environmental conditions. Forest canopy arthropods have been partic-ularly difficult to study because of their taxonomic complexity and difficulty of accessto them.
208 T.D. Schowalter and D.A. Crossley, Jr.
Studies of canopy arthropod assemblages at Coweeta have produced an extensivedata set documenting assemblage structure across a wide range of ecosystem states. Inthis chapter, these data are used to assess the magnitude of canopy arthropod responsesto changing environmental conditions, to evaluate the relative importances of factorsinfluencing arthropod responses, and to identify mechanisms of regulation.
Canopy Arthropod Responses to Disturbance
We have compiled data from four watershed-level studies representing 8 watershed-years. Included are four studies of canopy arthropods in mature canopies (Chapter 14this volume, H. Peturssen and Crossley unpubl. data; Risley 1983; Schowalter et al1981c), one study of arthropods in first and second-year regrowth (Schowalter et al.1981c), and one study of arthropods in 13-year-old regrowth (Risley 1983). Arthropodmass intensities (mg/kg foliage) on three late successional dominants (chestnut oak(Quercus prinus L.), red maple (Acer rubrum L.), hickory (Carya spp.), and three earlysuccessional dominants (dogwood (Cornus Florida L.), tulip poplar (Liriodendrontulipifera L.), and black locust (Robinia pseudoacacia L.) across this successional gra-dient are presented in Tables 15.1 through 15.6. Canopy arthropod guild structure
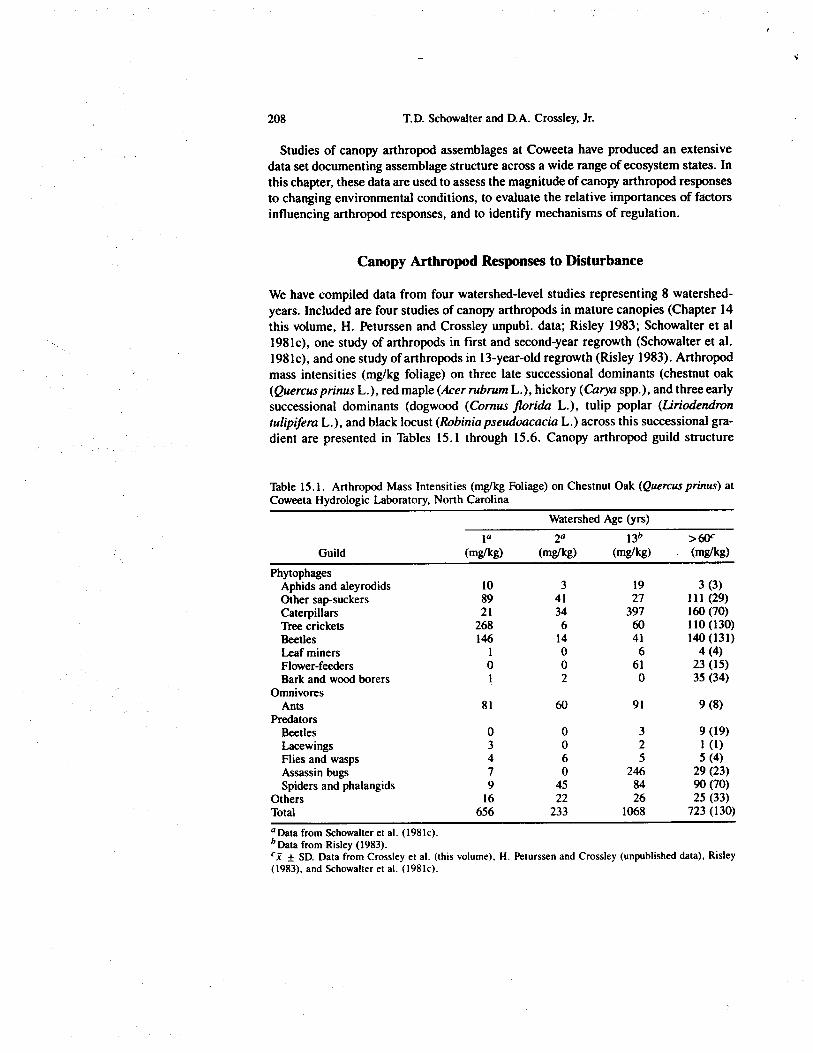
Table 15.1. Arthropod Mass Intensities (mg/kg Foliage) on Chestnut Oak (Quercus prinus) atCoweeta Hydrologic Laboratory, North Carolina
Guild
Watershed Age (yrs)la
(mg/kg)2°
(mg/kg)13b
(mg/kg)>60c(mg/kg)
PhytophagesAphids and aleyrodids 10 3 19 3 (3)Other sap-suckers 89 41 27 111 (29)Caterpillars 21 34 397 160 (70)Tree crickets 268 6 60 110 (130)Beetles 146 14 41 140 (131)Leaf miners 1 0 6 4 (4)Flower-feeders 0 0 61 23 (15)Bark and wood borers 1 2 0 35 (34)
OmnivoresAnts 81 60 91 9 (8)
PredatorsBeetles 0 0 3 9 (19)Lacewings 3 0 2 1 (I)Flies and wasps 4 6 5 5 (4)Assassin bugs 7 0 246 29 (23)Spiders and phalangids 9 45 84 90 (70)
Others 16 22 26 25 (33)Total 656 233 1068 723 (130)'Data from Schowalter et al. (1981c).b Data from Risley (1983).
± SD. Data from Crossley et al. (this volume), H. Peturssen and Crossley (unpublished data), Risley(1983), and Schowalter et al. (1981c).
Chapter 15. Canopy Arthropod Response to Forest Disturbance 209
Table 15.2. Arthropod Mass Intensities (mg/kg Foliage) on Hickories (Carya spp.) at CoweetaHydrologic Laboratory, North Carolina
Guild
Watershed Age (yrs)la
(mg/kg)2°
(mg/kg)136
(mg/kg)>60c
(mg/kg)Phytophages
Aphids and aleyrodids 25 7 2 5 (4)Other sap-suckers 159 66 133 82 (49)Caterpillars 2 47 196 117 (85)Tree crickets 0 333 251 27 (32)Beetles 35 3 72 48 (46)Leaf miners 0 0 1 0Flower-feeders 0 1 14 18 (9)Bark and wood borers 0 89 0 19 (9)
OmnivoresAnts 36 43 22 13 (8)
PredatorsBeetles 0 0 2 3 (2)Lacewings 0 0 3 4 (5)Flies and wasps 1 1 2 3 (2)Assassin bugs 50 11 49 11 (15)Spiders and phalangids 40 3 90 58 (25)
Others 18 4 73 32 (30)Total 366 605 910 453 (147)
a Data from Schowalter et al. (1981 c).b Data from Risley (1983).
± SD. Data from Crossley et al. (this volume), H. Peturssen and Crossley (unpublished data), Risley(1983), and Schowalter et al. (1981c).
Table 15.3. Arthropod Mass Intensities (mg/kg Foliage) on Red Maple (Acer rubrum) atCoweeta Hydrologic Laboratory, North Carolina
Guild
Watershed Age (yrs)la
(mg/kg)2°
(mg/kg)136
(mg/kg)>60c
(mg/kg)
PhytophagesAphids and aleyrodids 33 13 6 5 (5)Other sap-suckers 94 61 36 52 (24)Caterpillars 15 14 550 80 (54)Tree crickets 21 1 0 71 (133)Beetles 96 15 47 65 (59)Leaf miners 1 0 4 7 (8)Flower-feeders 31 13 21 18 (15)Bark and wood borers 5 23 0 32 (34)
OmnivoresAnts 273 26 2 5 (3)
(Continued)
210 T.D. Schowalter and D.A. Crossley, Jr.
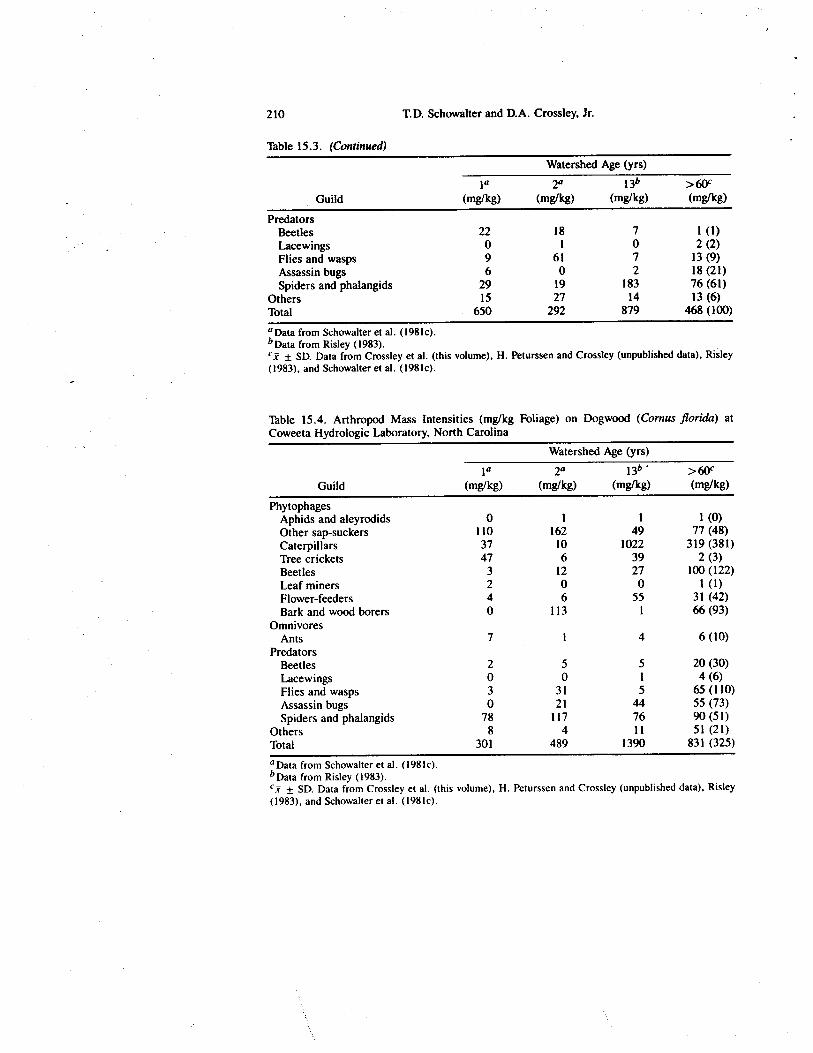
Table 15.3. (Continued)
Guild
Watershed Age (yrs)la
(mg/kg)2°
(mg/kg)13b
(mg/kg)>60c(mg/kg)
PredatorsBeetles 22 18 7 1 (1)Lacewings 0 1 0 2 (2)Flies and wasps 9 61 7 13 (9)Assassin bugs 6 0 2 18 (21)Spiders and phalangids 29 19 183 76 (61)
Others 15 27 14 13 (6)Total 650 292 879 468 (100)a Data from Schowalter et al. (1981c).b Data from Risley (1983).
± SD. Data from Crossley et al. (this volume), H. Peturssen and Crossley (unpublished data), Risley(1983), and Schowalter et al. (198k).
Table 15.4. Arthropod Mass Intensities (mg/kg Foliage) on Dogwood (Cornus florida) atCoweeta Hydrologic Laboratory, North Carolina
Guild
Watershed Age (yrs)la
(mg/kg)2°
(mg/kg)13" •
(mg/kg)>60c(mg/kg)
PhytophagesAphids and aleyrodids 0 1 1 1 (0)Other sap-suckers 110 162 49 77 (48)Caterpillars 37 10 1022 319 (381)Tree crickets 47 6 39 2 (3)Beetles 3 12 27 100 (122)Leaf miners 2 0 0 1 (1)Flower-feeders 4 6 55 31 (42)Bark and wood borers 0 113 1 66 (93)
OmnivoresAnts 7 1 4 6 (10)
PredatorsBeetles 2 5 5 20 (30)Lacewings 0 0 1 4 (6)Flies and wasps 3 31 5 65 (110)Assassin bugs 0 21 44 55 (73)Spiders and phalangids 78 117 76 90 (51)
Others 8 4 11 51 (21)Total 301 489 1390 831 (325)°Data from Schowalter et al. (1981c).b Data from Risky (1983).ex ± SD. Data from Crossley et al. (this volume), H. Peturssen and Crossley (unpublished data), Risley(1983), and Schowalter et al. (1981c).
Chapter 15. Canopy Arthropod Response to Forest Disturbance 211
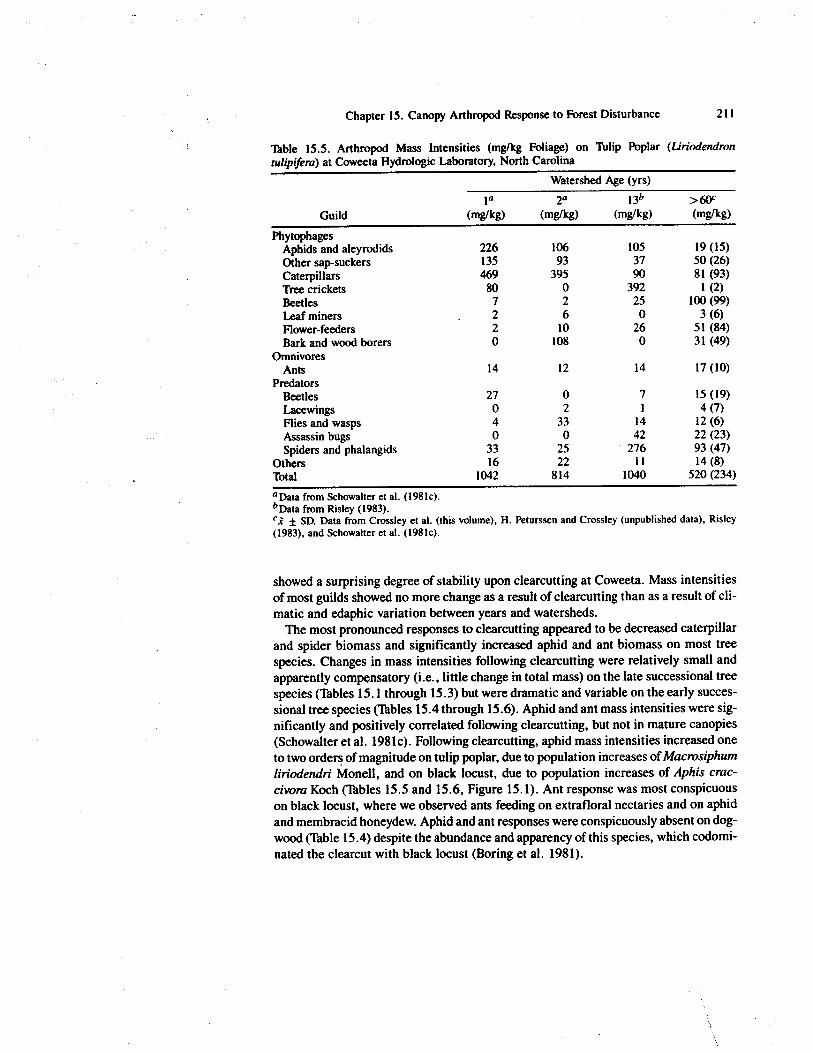
Table 15.5. Arthropod Mass Intensities (mg/kg Foliage) on Tulip Poplar (Liriodendrontulipifera) at Coweeta Hydrologic Laboratory, North Carolina
Guild
Watershed Age (yrs)la
(mg/kg)2a
(mg/kg)13b
(mg/kg)>60c(mg/kg)
PhytophagesAphids and aleyrodids 226 106 105 19 (15)Other sap-suckers 135 93 37 50 (26)Caterpillars 469 395 90 81 (93)Tree crickets 80 0 392 1 (2)Beetles 7 2 25 100 (99)Leaf miners 2 6 0 3 (6)Flower-feeders 2 10 26 51 (84)Bark and wood borers 0 108 0 31 (49)
OmnivoresAnts 14 12 14 17 (10)
PredatorsBeetles 27 0 7 15 (19)Lacewings 0 2 1 4 (7)Flies and wasps 4 33 14 12 (6)Assassin bugs 0 0 42 22 (23)Spiders and phalangids 33 25 276 93 (47)
Others 16 22 11 14 (8)Total 1042 814 1040 520 (234)°Data from Schowalter et al. (1981c).b Data from Risley (1983).`1 ± SD. Data from Crossley et al. (this volume), 1-1. Peturssen and Crossley (unpublished data), Risley(1983), and Schowalter et al. (1981c).
showed a surprising degree of stability upon clearcutting at Coweeta. Mass intensitiesof most guilds showed no more change as a result of clearcutting than as a result of cli-matic and edaphic variation between years and watersheds.
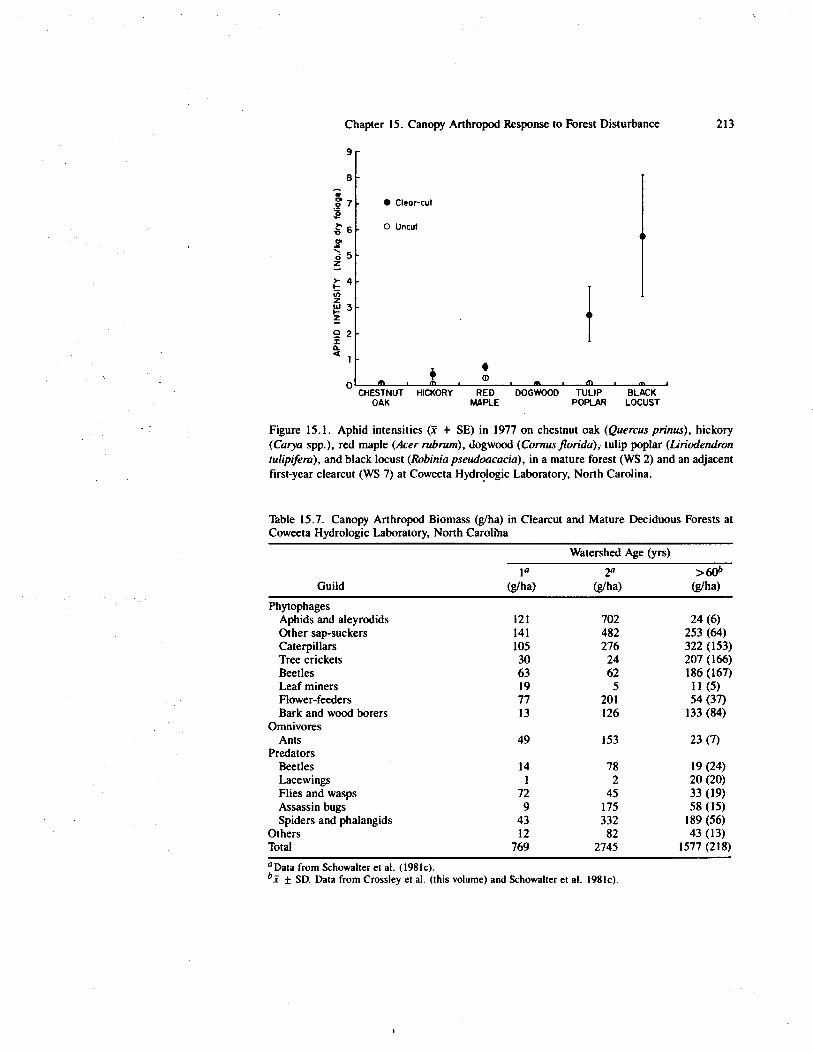
The most pronounced responses to clearcutting appeared to be decreased caterpillarand spider biomass and significantly increased aphid and ant biomass on most treespecies. Changes in mass intensities following clearcutting were relatively small andapparently compensatory (i.e., little change in total mass) on the late successional treespecies (Tables 15.1 through 15.3) but were dramatic and variable on the early succes-sional tree species (Tables 15.4 through 15.6). Aphid and ant mass intensities were sig-nificantly and positively correlated following clearcutting, but not in mature canopies(Schowalter et al. 1981c). Following clearcutting, aphid mass intensities increased oneto two orders of magnitude on tulip poplar, due to population increases of Macrosiphumliriodendri Monell, and on black locust, due to population increases of Aphis crac-civora Koch (Tables 15.5 and 15.6, Figure 15.1). Ant response was most conspicuouson black locust, where we observed ants feeding on extrafloral nectaries and on aphidand membracid honeydew. Aphid and ant responses were conspicuously absent on dog-wood (Table 15.4) despite the abundance and apparency of this species, which codomi-nated the clearcut with black locust (Boring et al. 1981).
212 T.D. Schowalter and D.A. Crossley, Jr.
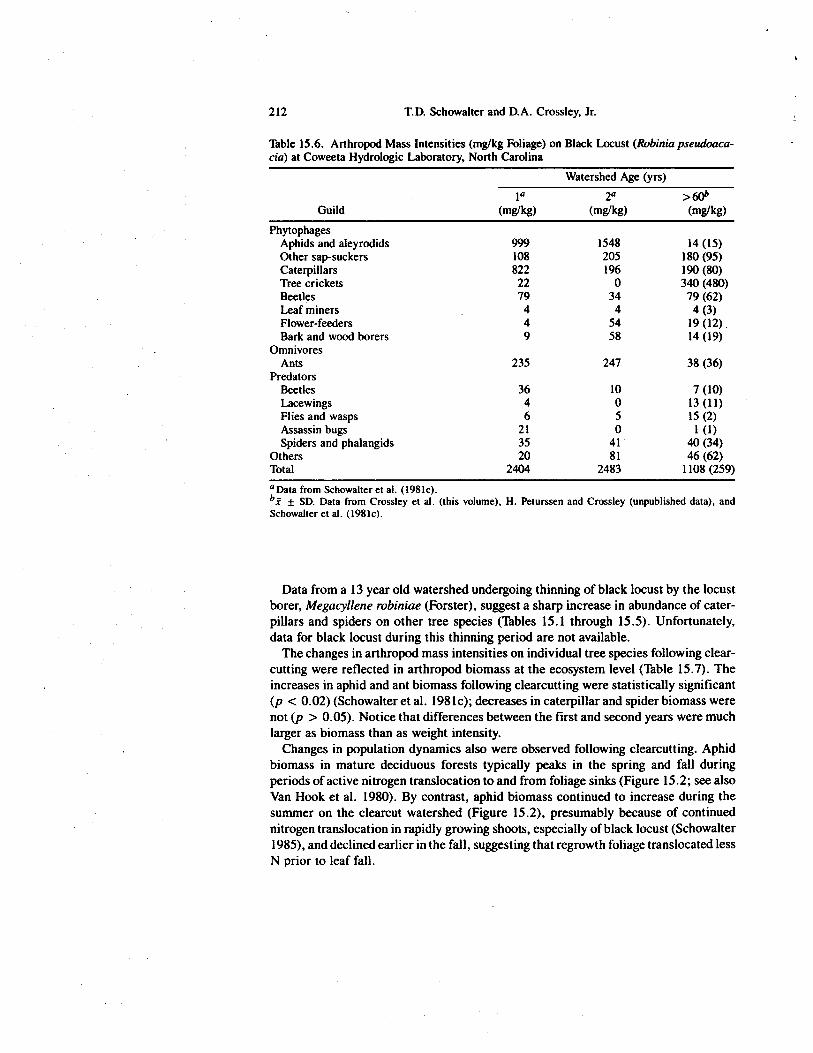
Table 15.6. Arthropod Mass Intensities (mg/kg Foliage) on Black Locust (Robinia pseudoaca-cia) at Coweeta Hydrologic Laboratory, North Carolina
Guild
Watershed Age (yrs)l a
(mg/kg)2°
(mg/kg)>60b
(mg/kg)Phytophages
Aphids and aleyrodids 999 1548 14 (15)Other sap-suckers 108 205 180 (95)Caterpillars 822 196 190 (80)Tree crickets 22 0 340 (480)Beetles 79 34 79 (62)Leaf miners 4 4 4 (3)Flower-feeders 4 54 19 (12)Bark and wood borers 9 58 14 (19)
OmnivoresAnts 235 247 38 (36)
PredatorsBeetles 36 10 7 (10)Lacewings 4 0 13 (11)Flies and wasps 6 5 15 (2)Assassin bugs 21 0 1 (1)Spiders and phalangids 35 41 40 (34)
Others 20 81 46 (62)Total 2404 2483 1108 (259)°Data from Schowalter et al. (1981c).bz ± SD. Data from Crossley et al. (this volume), H. Peturssen and Crossley (unpublished data), andSchowalter et al. (1981c).
Data from a 13 year old watershed undergoing thinning of black locust by the locustborer, Megacyllene robiniae (Forster), suggest a sharp increase in abundance of cater-pillars and spiders on other tree species (Tables 15.1 through 15.5). Unfortunately,data for black locust during this thinning period are not available.
The changes in arthropod mass intensities on individual tree species following clear-cutting were reflected in arthropod biomass at the ecosystem level (Table 15.7). Theincreases in aphid and ant biomass following clearcutting were statistically significant(p < 0.02) (Schowalter et al. 1981c); decreases in caterpillar and spider biomass werenot (p > 0.05). Notice that differences between the first and second years were muchlarger as biomass than as weight intensity.
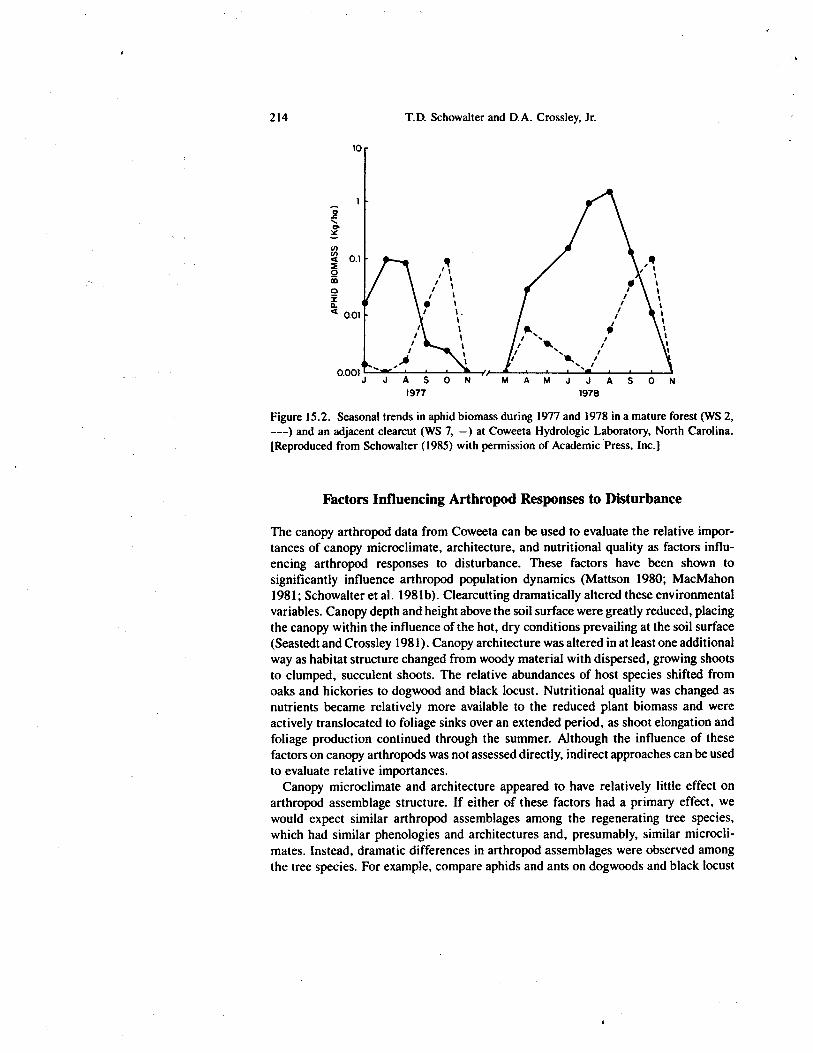
Changes in population dynamics also were observed following clearcutting. Aphidbiomass in mature deciduous forests typically peaks in the spring and fall duringperiods of active nitrogen translocation to and from foliage sinks (Figure 15.2; see alsoVan Hook et al. 1980). By contrast, aphid biomass continued to increase during thesummer on the clearcut watershed (Figure 15.2), presumably because of continuednitrogen translocation in rapidly growing shoots, especially of black locust (Schowalter1985), and declined earlier in the fall, suggesting that regrowth foliage translocated lessN prior to leaf fall.
Chapter 15. Canopy Arthropod Response to Forest Disturbance 213
V;7
0'.6
5z>-
- 4
z 3■—zCi- 2cL
0 CHESTNUT HICKORY RED DOGWOOD TULIPOAK MAPLE POPLAR
Figure 15.1. Aphid intensities + SE) in 1977 on chestnut oak (Quercus prinus), hickory(Carya spp.), red maple (Acer rubrum), dogwood (Cornus florida); tulip poplar (Liriodendrontulipifera), and black locust (Robinia pseudoacacia), in a mature forest (WS 2) and an adjacentfirst-year clearcut (WS 7) at Coweeta Hydrologic Laboratory, North Carolina.
Table 15.7. Canopy Arthropod Biomass (g/ha) in Clearcut and Mature Deciduous Forests atCoweeta Hydrologic Laboratory, North Carolina
Guild
Watershed Age (yrs)la
(g/ha)2°
(g/ha)> 60b
(g/ha)Phytophages
Aphids and aleyrodids 121 702 24 (6)Other sap-suckers 141 482 253 (64)Caterpillars 105 276 322 (153)Tree crickets 30 24 207 (166)Beetles 63 62 186 (167)Leaf miners 19 5 11 (5)Flower-feeders 77 201 54 (37)Bark and wood borers 13 126 133 (84)
OmnivoresAnts 49 153 23 (7)
PredatorsBeetles 14 78 19 (24)Lacewings 1 2 20 (20)Flies and wasps 72 45 33 (19)Assassin bugs 9 175 58 (15)Spiders and phalangids 43 332 189 (56)
Others 12 82 43 (13)Total 769 2745 1577 (218)°Data from Schowalter et al. (1981c).bx ± SD. Data from Crossley et al. (this volume) and Schowalter et al. 1981c).
BLACKLOCUST
S 0
10
I/ 1
1 %
• 1
11
JASON1977
M A M J J A1978
0.001
2D.
< 0.120
0a.a.< 0.01
214 T.D. Schowalter and D.A. Crossley, Jr.
Figure 15.2. Seasonal trends in aphid biomass during 1977 and 1978 in a mature forest (WS 2,---) and an adjacent clearcut (WS 7, —) at Coweeta Hydrologic Laboratory, North Carolina.[Reproduced from Schowalter (1985) with permission of Academic Press, Inc.]
Factors Influencing Arthropod Responses to Disturbance
The canopy arthropod data from Coweeta can be used to evaluate the relative impor-tances of canopy microclimate, architecture, and nutritional quality as factors influ-encing arthropod responses to disturbance. These factors have been shown tosignificantly influence arthropod population dynamics (Mattson 1980; MacMahon1981; Schowalter et al. 198 1 b). Clearcutting dramatically altered these environmentalvariables. Canopy depth and height above the soil surface were greatly reduced, placingthe canopy within the influence of the hot, dry conditions prevailing at the soil surface(Seastedt and Crossley 1981). Canopy architecture was altered in at least one additionalway as habitat structure changed from woody material with dispersed, growing shootsto clumped, succulent shoots. The relative abundances of host species shifted fromoaks and hickories to dogwood and black locust. Nutritional quality was changed asnutrients became relatively more available to the reduced plant biomass and wereactively translocated to foliage sinks over an extended period, as shoot elongation andfoliage production continued through the summer. Although the influence of thesefactors on canopy arthropods was not assessed directly, indirect approaches can be usedto evaluate relative importances.
Canopy microclimate and architecture appeared to have relatively little effect onarthropod assemblage structure. If either of these factors had a primary effect, wewould expect similar arthropod assemblages among the regenerating tree species,which had similar phenologies and architectures and, presumably, similar microcli-mates. Instead, dramatic differences in arthropod assemblages were observed amongthe tree species. For example, compare aphids and ants on dogwoods and black locust

Chapter 15. Canopy Arthropod Response to Forest Disturbance 215
which assumed canopy dominance following clearcutting (Tables 15.4 and 15.6). Fur-thermore, arthropod mass intensities in mature forests showed considerable variationbetween years and watersheds (Tables 15.1 through 15.6) despite relatively constantcanopy microclimate and architecture.
This assessment is not intended to suggest that individual arthropod species were notaffected by changes in canopy microclimate and architecture. Rather, our data indicatethat, at the guild level of resolution, any effect of these factors was masked by compen-satory responses among arthropod species or by responses to other factors.
The observed responses of canopy arthropods to clearcutting at Coweeta appeared tobe explained best by changes in nutritional factors. This explanation is supported byseveral lines of evidence. First, the most dramatic arthropod response occurred onblack locust, a nitrogen-fixing legume (Table 15.6). Nitrogen availability is known toinfluence aphid populations (Mattson 1980; Van Hook et al. 1980) and, thereby, toinfluence ant foraging behavior indirectly (Messina 1981; Schowalter et al. 1981c).Nitrogen availability also directly influenced ant foraging behavior at Coweeta. Blacklocust shoots on the clearcut produced extrafloral nectaries, which attracted ants inearly spring prior to aphid population growth (Schowalter, Crossley and Seastedt,personal observation). Aphid and ant biomass subsequently increased on black locustthrough positive feedback. Second, fertilization experiments involving 4-year-oldblack locust (Hargrove et al. 1984) resulted in arthropod responses similar to thoseobserved as a result of clearcutting. Addition of nitrogen-phosphorus-potassium fer-tilizer resulted in increased foliar nitrogen and phosphorus (but not potassium) concen-trations. Hargrove et al. (1984) observed an initial increase in foliage loss todefoliators, but a subsequent decrease due to a combination of a tolerance response(increased foliage production) and a resistance response (reduced foliage consump-tion). These responses resembled the increased defoliator biomass the first year aftercutting, followed by greatly reduced defoliator biomass the second year, especially onblack locust (Tables 15.1 through 15.6). Third, an apparent increase in caterpillarbiomass coincided with a locust borer population irruption and increased nitrate exporton the 13-year-old successional stand (Tables 15.1 through 15.6), suggesting thatchanges in the nitrogen regime resulting from locust borer activity increased foliagenutritional quality for caterpillars.
These data indicate an important influence of nutritional factors on canopy arthro-pods and also explain some variations in the pattern of arthropod responses on differenttree species. Different nutrient uptake rates between tree species could account fordifferent arthropod responses. The most dramatic and variable arthropod reponsesoccurred on the early successional tree species, Cornus and Robinia (Tables 15.4through 15.6), which showed the most rapid responses to clearcutting. Species specificresponses of trees to the altered availability of nutrients following clearcutting alteredfoliar nutrient pools (Chapter 12) in ways which could elicit differing responses fromthe arthropod guilds. For example, increased nitrogen can affect sap-suckers positivelyand defoliators negatively, while increased potassium can have the opposite effect(Bogenschiitz and KOnig 1976), depending on the nutrient allocation pattern of theplant (Schowalter 1985).
The conspicuous absence of aphid and ant responses on dogwood is particularlyintriguing (Table 15.4). The failure of aphids to respond suggests that dogwood's nitro-
216 T.D. Schowalter and D.A. Crossley, Jr.
gen budget was not affected by clearcutting. The failure of ants to respond suggests non-random foraging influenced by aphid abundance. However, the apparent absence of antresponse on tulip poplar, which did support increased aphid populations, and also antattraction to extrafloral nectaries on black locust suggest that nutritional factors wereinvolved as well. Thus, indirect evidence indicates that nutritional factors were theprimary stimuli influencing canopy arthropod responses to clearcutting at Coweeta.
Regulatory Effects of Canopy Arthropod Responses
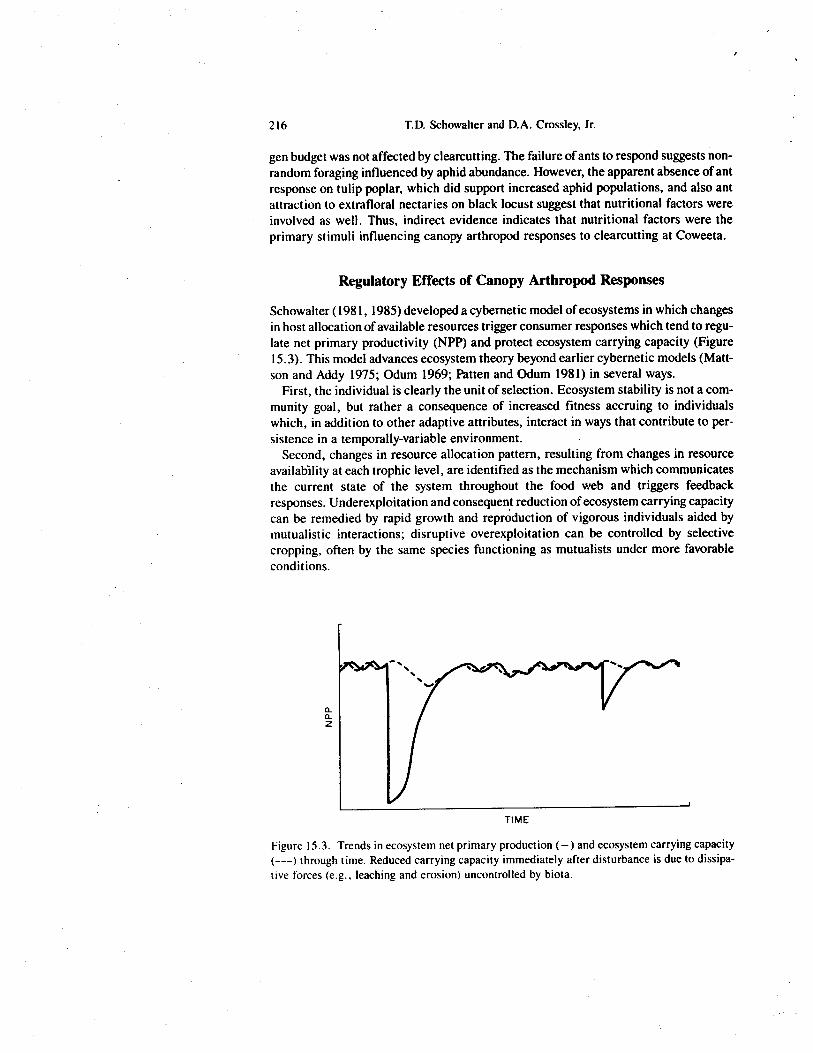
Schowalter (1981, 1985) developed a cybernetic model of ecosystems in which changesin host allocation of available resources trigger consumer responses which tend to regu-late net primary productivity (NPP) and protect ecosystem carrying capacity (Figure15.3). This model advances ecosystem theory beyond earlier cybernetic models (Matt-son and Addy 1975; Odum 1969; Patten and Odum 1981) in several ways.
First, the individual is clearly the unit of selection. Ecosystem stability is not a com-munity goal, but rather a consequence of increased fitness accruing to individualswhich, in addition to other adaptive attributes, interact in ways that contribute to per-sistence in a temporally-variable environment.
Second, changes in resource allocation pattern, resulting from changes in resourceavailability at each trophic level, are identified as the mechanism which communicatesthe current state of the system throughout the food web and triggers feedbackresponses. Underexploitation and consequent reduction of ecosystem carrying capacitycan be remedied by rapid growth and reproduction of vigorous individuals aided bymutualistic interactions; disruptive overexploitation can be controlled by selectivecropping, often by the same species functioning as mutualists under more favorableconditions.
az
TIME
Figure 15.3. Trends in ecosystem net primary production (—) and ecosystem carrying capacity(---) through time. Reduced carrying capacity immediately after disturbance is due to dissipa-tive forces (e.g., leaching and erosion) uncontrolled by biota.
Chapter 15. Canopy Arthropod Response to Forest Disturbance 217
Predation
Mutuolism
a.a.z
0TIME
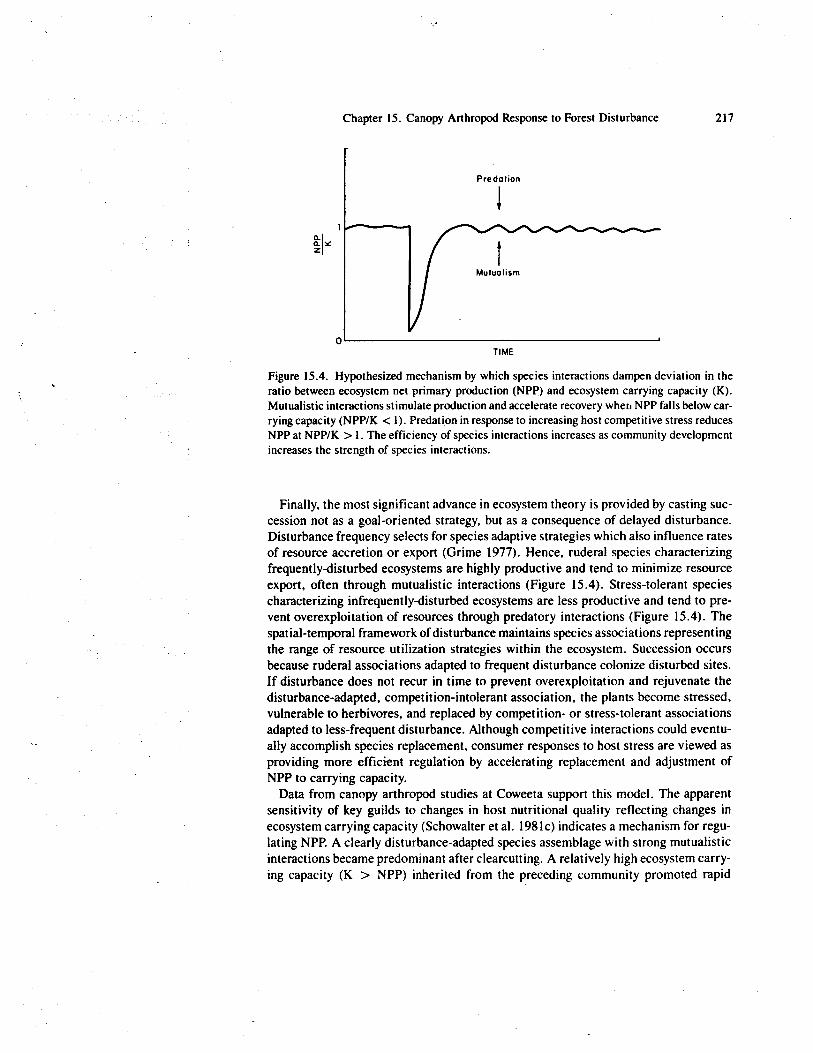
Figure 15.4. Hypothesized mechanism by which species interactions dampen deviation in theratio between ecosystem net primary production (NPP) and ecosystem carrying capacity (K).Mutualistic interactions stimulate production and accelerate recovery when NPP falls below car-rying capacity (NPP/K < 1). Predation in response to increasing host competitive stress reducesNPP at NPP/K > 1. The efficiency of species interactions increases as community developmentincreases the strength of species interactions.
Finally, the most significant advance in ecosystem theory is provided by casting suc-cession not as a goal-oriented strategy, but as a consequence of delayed disturbance.Disturbance frequency selects for species adaptive strategies which also influence ratesof resource accretion or export (Grime 1977). Hence, ruderal species characterizingfrequently-disturbed ecosystems are highly productive and tend to minimize resourceexport, often through mutualistic interactions (Figure 15.4). Stress-tolerant speciescharacterizing infrequently-disturbed ecosystems are less productive and tend to pre-vent overexploitation of resources through predatory interactions (Figure 15.4). Thespatial-temporal framework of disturbance maintains species associations representingthe range of resource utilization strategies within the ecosystem. Succession occursbecause ruderal associations adapted to frequent disturbance colonize disturbed sites.If disturbance does not recur in time to prevent overexploitation and rejuvenate thedisturbance-adapted, competition-intolerant association, the plants become stressed,vulnerable to herbivores, and replaced by competition- or stress-tolerant associationsadapted to less-frequent disturbance. Although competitive interactions could eventu-ally accomplish species replacement, consumer responses to host stress are viewed asproviding more efficient regulation by accelerating replacement and adjustment ofNPP to carrying capacity.
Data from canopy arthropod studies at Coweeta support this model. The apparentsensitivity of key guilds to changes in host nutritional quality reflecting changes inecosystem carrying capacity (Schowalter et al. 1981c) indicates a mechanism for regu-lating NPP. A clearly disturbance-adapted species assemblage with strong mutualisticinteractions became predominant after clearcutting. A relatively high ecosystem carry-ing capacity (K > NPP) inherited from the preceding community promoted rapid
218 T.D. Schowalter and D.A. Crossley, Jr.
growth. Productivity was enhanced by stimulation of plant growth (especially of blacklocust) by nitrogen-fixing microorganisms (Boring et al. 1981), stimulation of nitrogen-fixation by aphids (Petelle 1980), and stimulation of aphid productivity, and perhapsplant protection, by ants (Schowalter et al. 1981c; Tilman 1978; but see Fritz 1983).Cycling of nitrogen, potassium, sodium, and perhaps phosphorus, was accelerated bycanopy arthropod feeding (Hargrove et al. 1984; Schowalter et al. 1981c; Seastedtet al. 1983).
Rapid growth by the colonizing association eventually should result in overexploita-tion of resources (K < NPP) despite soil nutrient retention and nitrogen accretion.Such a situation could explain the irruptions of locust borer and defoliator populationswhich reduced NPP, increased nitrate and potassium mobilization (Schowalter andCrossley 1983; Schowalter et al. 1981a), and which appear to be accelerating a succes-sional transition from the ruderal community to a more stress-tolerant community(sensu Grime 1977).
Finally, periodic overexploitation of resources is likely to continue in mature forestsas a result of fluctuating environmental conditions (Figure 15.3). We have observedfall cankerworm [Alsophila pometaria (Harris)] population irruptions initially reduc-ing NPP, but subsequently increasing mobilization and availability of nutrients (espe-cially nitrogen), and, ultimately, increasing NPP (Swank et al. 1981). Such regula-tion might be enhanced by the differing sensitivities of different arthropod guildsto different types or intensities of environmental change (Bogenschiitz and KOnig1976; Schowalter 1985).
Conclusions
Studies of canopy arthropod assemblages at Coweeta support a hypothesis that hostresource allocation pattern and consumer response constitute the mechanism forcybernetic control of NPP in temporally-variable environments. We recognize the needfor increased resolution of canopy arthropod assemblage structural and functionalinteractions. If the functional interactions between species represent mechanisms forcybernetic control of NPP, then increased species diversity and community connec-tivity should contribute to ecosystem stability only to the extent that redundancyensures an adequate response. Furthermore, the relative importances of mutualistic,competitive, and predatory interactions at any point in time should indicate the instan-taneous direction and amplitude of deviation of NPP from ecosystem carrying capacity(Figure 15.4). Consequently, the instantaneous abundance of particular taxa does notnecessarily indicate ecological importance. Regulation can be accomplished most effi-ciently by small, inexpensive (in terms of resource needs) biomass, which can berapidly multiplied (e.g., as in insects) and amplified through indirect effects (e.g.,stimulation of nitrogen-fixation). Increased understanding of canopy arthropod assem-blages and responses to changes in environmental conditions will contribute toecosystem management strategies.
Reprinted from
W.T. Swank and D.A. Crossley Jr.Ecological Studies, Vol. 66:Forest Hydrology and Ecology at Coweeta© 1988 Springer-Verlag New York. Inc.Printed in the United States of America
32_
Springer-VerlagNew York Berlin HeidelbergLondon Paris Tokyo
![Mapping forest canopy height globally with spaceborne lidarjosh.yosh.org/publications/Simard et al 2011 - Mapping forest canopy... · canopy height product [Lefsky, 2010], and differences](https://img.dokumen.tips/doc/110x75/5f5e82f94a05bb798848773c/mapping-forest-canopy-height-globally-with-spaceborne-et-al-2011-mapping-forest.jpg)