Embed Size (px)
Citation preview

19.04.23 1
Specialised somatic health care 2013
Juha Rainio and Tarja Räty
Specialised somatic health care 2013, Statistical report 1/2015

Changes in the number of inpatient and day surgical care days as well as inpatient visits in specialised somatic health care indexed by age group, 2006–2013, year 2006 = 100
19.04.23 Specialised somatic health care 2013, Statistical report 1/2015 2

Patients in inpatient care and day surgery in specialised health care by age group, 2003–2013 (%)
19.04.23 Specialised somatic health care 2013, Statistical report 1/2015 3
2003 2004 2005 2006 2007 2008 2009 2010 2011 2012 2013
0-14 yr 11,2 10,5 10,5 10,7 10,9 10,8 10,6 10,7 10,7 10,5 9,9
15-64 yr 57,8 58,4 58,0 57,6 57,1 57,2 57,0 56,4 55,8 55,0 54,5
65-74 yr 14,0 13,9 13,9 13,8 13,7 13,8 14,0 14,1 14,7 15,4 16,1
75+ yr 17,0 17,2 17,6 17,9 18,3 18,3 18,4 18,8 18,7 19,1 19,5
total 100,0 100,0 100,0 100,0 100,0 100,0 100,0 100,0 100,0 100,0 100,0
patients 662 075 660 395 672 641 664 863 656 888 656 529 648 229 649 921 655 138 646 393 640 519
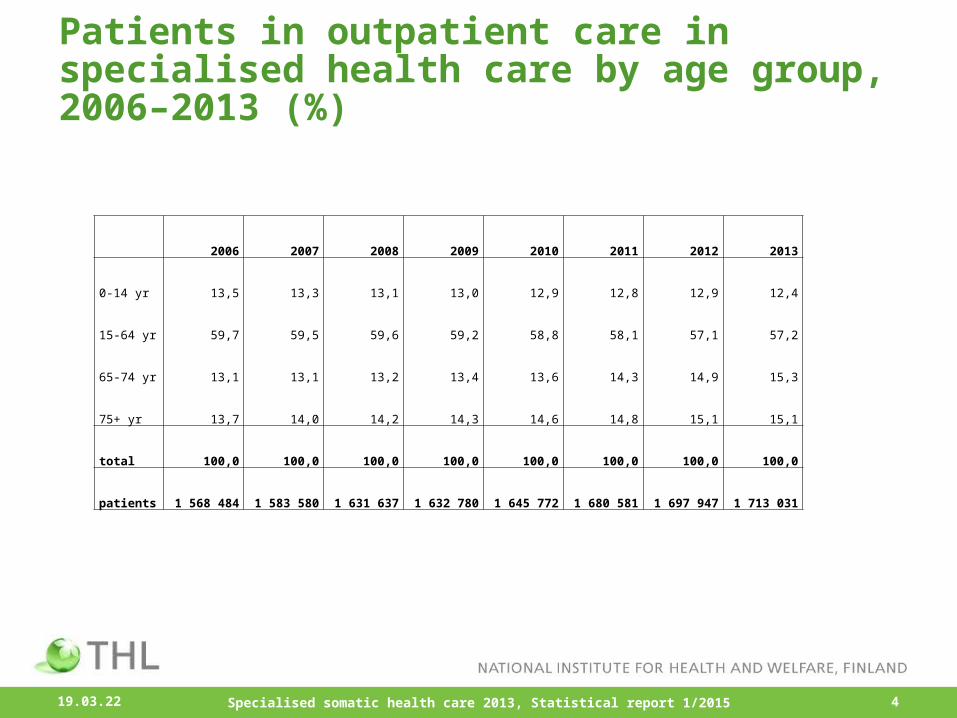
Patients in outpatient care in specialised health care by age group, 2006–2013 (%)
19.04.23 Specialised somatic health care 2013, Statistical report 1/2015 4
2006 2007 2008 2009 2010 2011 2012 2013
0-14 yr 13,5 13,3 13,1 13,0 12,9 12,8 12,9 12,4
15-64 yr 59,7 59,5 59,6 59,2 58,8 58,1 57,1 57,2
65-74 yr 13,1 13,1 13,2 13,4 13,6 14,3 14,9 15,3
75+ yr 13,7 14,0 14,2 14,3 14,6 14,8 15,1 15,1
total 100,0 100,0 100,0 100,0 100,0 100,0 100,0 100,0
patients 1 568 484 1 583 580 1 631 637 1 632 780 1 645 772 1 680 581 1 697 947 1 713 031

Inpatient periods of care and care days as well as outpatient visits in specialised health care by age group in 2006, 2009, 2012 and 2013 (%)
19.04.23 Specialised somatic health care 2013, Statistical report 1/2015 5
1 Statistics Finland: mid-year population 2013
2006 2009 2012 2013 2006 2009 2012 2013 2006 2009 2012 2013 2006 2009 2012 2013
0-14 yr 17,2 16,7 16,4 16,4 9,6 9,6 9,5 9,1 7,3 7,6 7,5 7,5 11,0 10,5 10,4 10,4
15-64 yr 66,6 66,5 65,1 64,2 53,4 53,1 51,1 50,6 45,1 46,3 44,0 43,1 59,5 58,6 55,9 54,9
65-74 yr 8,7 9,0 10,2 10,9 15,8 15,8 17,3 17,0 18,1 18,2 19,8 20,1 15,3 15,8 17,7 18,3
75+ yr 7,6 7,9 8,3 8,5 21,1 21,4 22,0 9,0 29,5 27,9 28,7 29,3 14,3 15,0 16,1 16,4
total 100,0 100,0 100,0 100,0 100,0 100,0 100,0 100,0 100,0 100,0 100,0 100,0 100,0 100,0 100,0 100,0
Proportion of population1 Care episodes in inpatient care and day surgery
Care dayss in inpatient care and day surgery
Outpatients visits in specialised health care
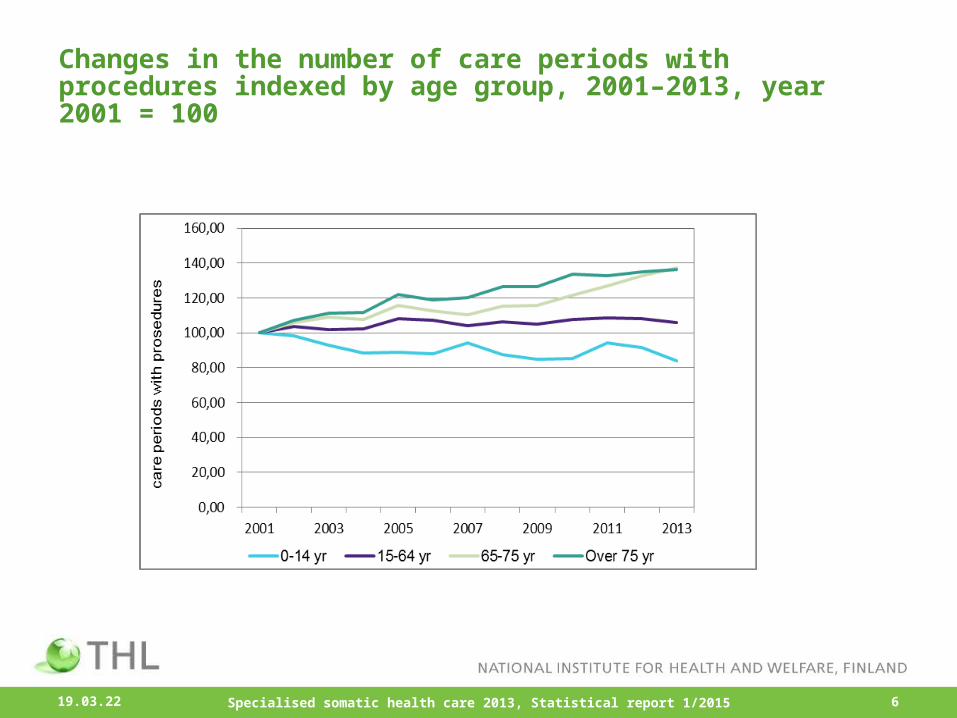
Changes in the number of care periods with procedures indexed by age group, 2001–2013, year 2001 = 100
19.04.23 Specialised somatic health care 2013, Statistical report 1/2015 6

Periods of care, care days and outpatient visits, 2001–2013, whole country¹
19.04.23 Specialised somatic health care 2013, Statistical report 1/2015 7
¹ Data on outpatient visits in specialised somatic health care have been collected since 1998, but the figures are
comparable only from 2006 onwards.

Care days and outpatient visits in specialised health care, 2013, per 1 000 inhabitants
19.04.23 Specialised somatic health care 2013, Statistical report 1/2015 8

Periods of care based on an emergency admission, as a percentage of all periods of care by specialty, 2002–2013
19.04.23 Specialised somatic health care 2013, Statistical report 1/2015 9

Periods of care in inpatient care by hospital district per 1 000 inhabitants in 2013, day surgery and less than 2-day periods differentiated
19.04.23 Specialised somatic health care 2013, Statistical report 1/2015 10

Emergency room visits in specialised health care per 1 000 inhabitants by hospital district, 2006–2013
19.04.23 Specialised somatic health care 2013, Statistical report 1/2015 11

Periods of care, care days, outpatient visits and patients by specialty, 2013
19.04.23 Specialised somatic health care 2013, Statistical report 1/2015 12
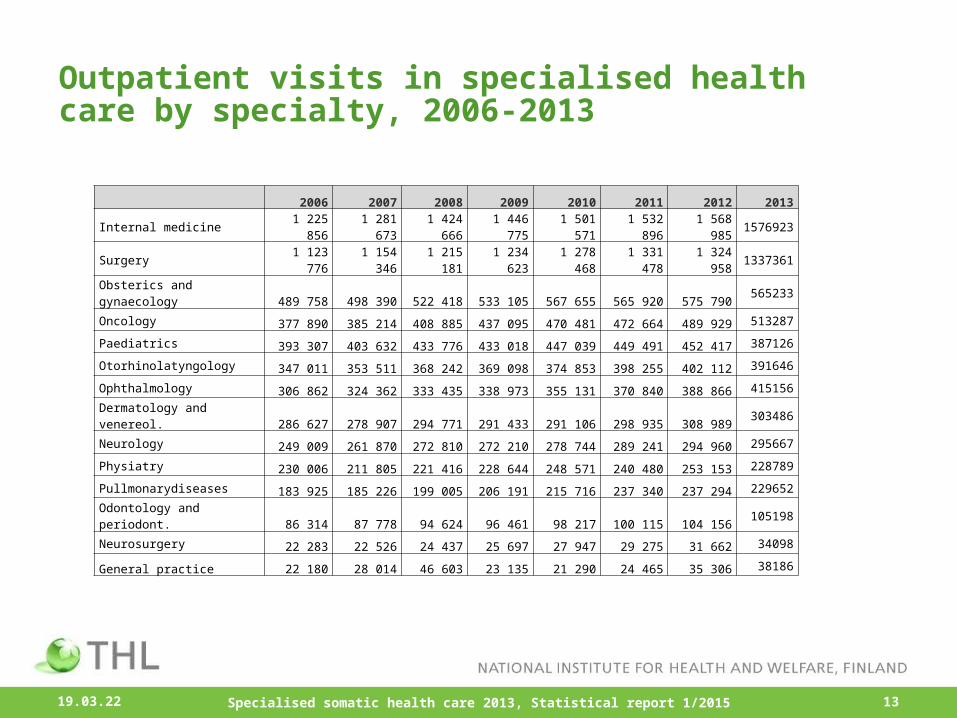
Outpatient visits in specialised health care by specialty, 2006-2013
19.04.23 Specialised somatic health care 2013, Statistical report 1/2015 13
2006 2007 2008 2009 2010 2011 2012 2013
Internal medicine 1 225 856 1 281 673 1 424 666 1 446 775 1 501 571 1 532 896 1 568 985 1576923
Surgery 1 123 776 1 154 346 1 215 181 1 234 623 1 278 468 1 331 478 1 324 958 1337361
Obsterics and gynaecology 489 758 498 390 522 418 533 105 567 655 565 920 575 790 565233
Oncology 377 890 385 214 408 885 437 095 470 481 472 664 489 929 513287
Paediatrics 393 307 403 632 433 776 433 018 447 039 449 491 452 417 387126
Otorhinolatyngology 347 011 353 511 368 242 369 098 374 853 398 255 402 112 391646
Ophthalmology 306 862 324 362 333 435 338 973 355 131 370 840 388 866 415156
Dermatology and venereol. 286 627 278 907 294 771 291 433 291 106 298 935 308 989 303486
Neurology 249 009 261 870 272 810 272 210 278 744 289 241 294 960 295667
Physiatry 230 006 211 805 221 416 228 644 248 571 240 480 253 153 228789
Pullmonarydiseases 183 925 185 226 199 005 206 191 215 716 237 340 237 294 229652
Odontology and periodont. 86 314 87 778 94 624 96 461 98 217 100 115 104 156 105198
Neurosurgery 22 283 22 526 24 437 25 697 27 947 29 275 31 662 34098
General practice 22 180 28 014 46 603 23 135 21 290 24 465 35 306 38186

Index for number of care days in the major specialties in specialised somatic health care, 2003–2013 (2003 = 100)
19.04.23 Specialised somatic health care 2013, Statistical report 1/2015 14
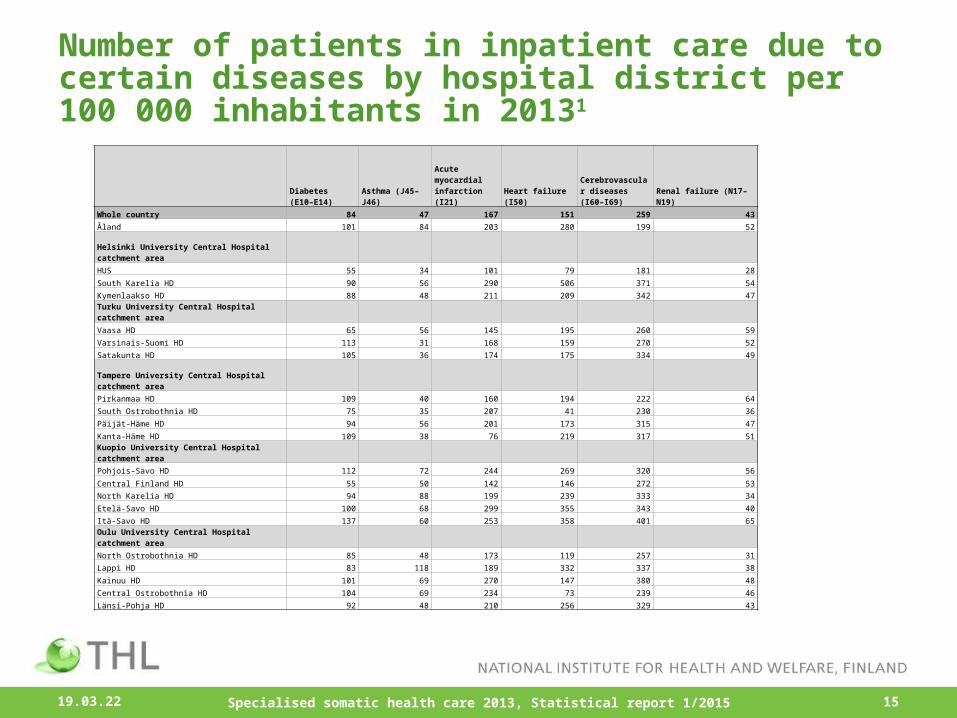
Number of patients in inpatient care due to certain diseases by hospital district per 100 000 inhabitants in 20131
19.04.23 Specialised somatic health care 2013, Statistical report 1/2015 15
Diabetes (E10–E14)
Asthma (J45–J46)
Acute myocardial infarction (I21) Heart failure (I50)
Cerebrovascular diseases (I60–I69) Renal failure (N17–N19)
Whole country 84 47 167 151 259 43
Åland 101 84 203 280 199 52
Helsinki University Central Hospital catchment area
HUS 55 34 101 79 181 28
South Karelia HD 90 56 290 506 371 54
Kymenlaakso HD 88 48 211 209 342 47Turku University Central Hospital catchment area
Vaasa HD 65 56 145 195 260 59
Varsinais-Suomi HD 113 31 168 159 270 52
Satakunta HD 105 36 174 175 334 49
Tampere University Central Hospital catchment area
Pirkanmaa HD 109 40 160 194 222 64
South Ostrobothnia HD 75 35 207 41 230 36
Päijät-Häme HD 94 56 201 173 315 47
Kanta-Häme HD 109 38 76 219 317 51Kuopio University Central Hospital catchment area
Pohjois-Savo HD 112 72 244 269 320 56
Central Finland HD 55 50 142 146 272 53
North Karelia HD 94 88 199 239 333 34
Etelä-Savo HD 100 68 299 355 343 40
Itä-Savo HD 137 60 253 358 401 65
Oulu University Central Hospital catchment area
North Ostrobothnia HD 85 48 173 119 257 31
Lappi HD 83 118 189 332 337 38
Kainuu HD 101 69 270 147 380 48
Central Ostrobothnia HD 104 69 234 73 239 46
Länsi-Pohja HD 92 48 210 256 329 43

Periods of care with procedures by category, 2002–2013
19.04.23 Specialised somatic health care 2013, Statistical report 1/2015 16
2004 2005 2006 2007 2008 2009 2010 2011 2012 2013
All episodes with procedures and interventions 507 349 566 571 543 355 531 755 550 764 578 753 621 731 625 083 645 038 648 070 Non-surgical 101 164 134 127 118 931 113 431 123 981 158 246 192 414 189 743 217 272 224 459 Non-surgical, radiological 27 544 56 938 37 850 39 064 37 029 65 294 99 646 93 396 107 310 96 694 Surgical (A-Q) 406 185 432 444 424 964 418 324 426 783 420 507 429 317 435 340 427 766 423 611 Elective surgical 335 553 360 914 351 952 346 295 351 200 344 181 349 548 355 574 354 142 234 229 Day-patients 194 773 214 155 215 014 214 406 215 484 218 908 230 319 238 936 239 338 189 382
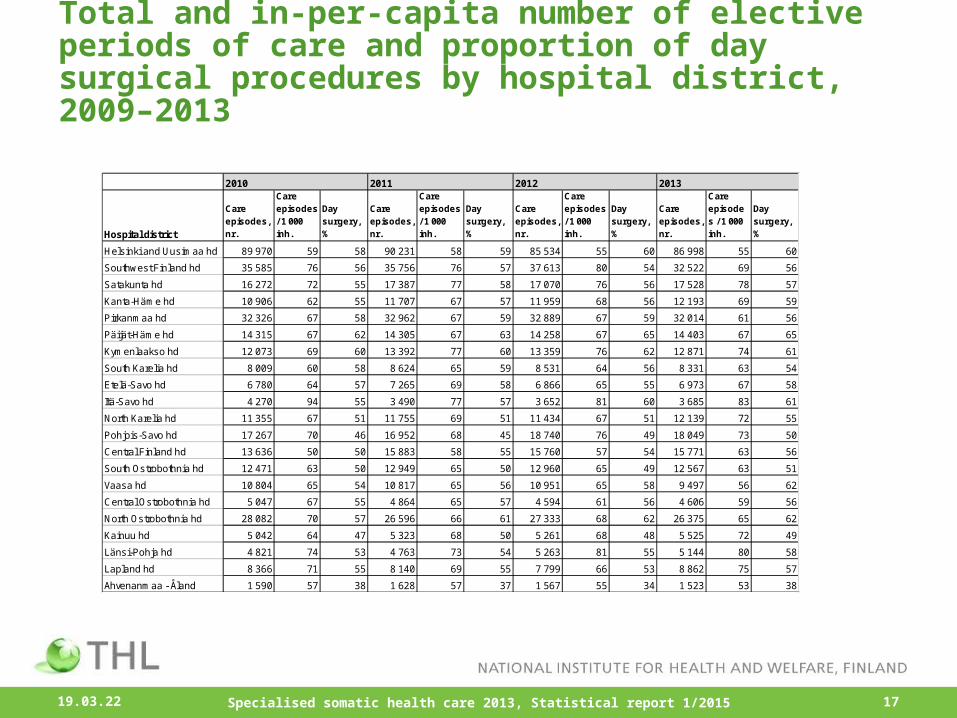
Total and in-per-capita number of elective periods of care and proportion of day surgical procedures by hospital district, 2009–2013
19.04.23 Specialised somatic health care 2013, Statistical report 1/2015 17
Hospital district
Care episodes, nr.
Care episodes / 1 000 inh.
Day surgery, %
Care episodes, nr.
Care episodes / 1 000 inh.
Day surgery, %
Care episodes, nr.
Care episodes / 1 000 inh.
Day surgery, %
Care episodes, nr.
Care episodes / 1 000 inh.
Day surgery, %
Helsinki and Uusimaa hd 89 970 59 58 90 231 58 59 85 534 55 60 86 998 55 60
Southwest Finland hd 35 585 76 56 35 756 76 57 37 613 80 54 32 522 69 56
Satakunta hd 16 272 72 55 17 387 77 58 17 070 76 56 17 528 78 57
Kanta-Häme hd 10 906 62 55 11 707 67 57 11 959 68 56 12 193 69 59
Pirkanmaa hd 32 326 67 58 32 962 67 59 32 889 67 59 32 014 61 56
Päijät-Häme hd 14 315 67 62 14 305 67 63 14 258 67 65 14 403 67 65
Kymenlaakso hd 12 073 69 60 13 392 77 60 13 359 76 62 12 871 74 61
South Karelia hd 8 009 60 58 8 624 65 59 8 531 64 56 8 331 63 54
Etelä-Savo hd 6 780 64 57 7 265 69 58 6 866 65 55 6 973 67 58
Itä-Savo hd 4 270 94 55 3 490 77 57 3 652 81 60 3 685 83 61
North Karelia hd 11 355 67 51 11 755 69 51 11 434 67 51 12 139 72 55
Pohjois-Savo hd 17 267 70 46 16 952 68 45 18 740 76 49 18 049 73 50
Central Finland hd 13 636 50 50 15 883 58 55 15 760 57 54 15 771 63 56
South Ostrobothnia hd 12 471 63 50 12 949 65 50 12 960 65 49 12 567 63 51
Vaasa hd 10 804 65 54 10 817 65 56 10 951 65 58 9 497 56 62
Central Ostrobothnia hd 5 047 67 55 4 864 65 57 4 594 61 56 4 606 59 56
North Ostrobothnia hd 28 082 70 57 26 596 66 61 27 333 68 62 26 375 65 62
Kainuu hd 5 042 64 47 5 323 68 50 5 261 68 48 5 525 72 49
Länsi-Pohja hd 4 821 74 53 4 763 73 54 5 263 81 55 5 144 80 58
Lapland hd 8 366 71 55 8 140 69 55 7 799 66 53 8 862 75 57
Ahvenanmaa - Åland 1 590 57 38 1 628 57 37 1 567 55 34 1 523 53 38
2010 2011 2012 2013

Periods of care in specialised somatic health care by diagnosis group, 2013
19.04.23 Specialised somatic health care 2013, Statistical report 1/2015 18

Most common single character code procedures measured by total number of periods of care, 2000–2013
19.04.23 Specialised somatic health care 2013, Statistical report 1/2015 19

Patients who died during a period of care with procedures in 2013, single character codes, number and relative proportion of deaths
19.04.23 Specialised somatic health care 2013, Statistical report 1/2015 20

Patients who died during a period of care with procedures in 2013, three character codes, number and relative proportion of deaths1
19.04.23 Specialised somatic health care 2013, Statistical report 1/2015 21
Patients DeathsDeaths, % of patients
WX8 Intensive care 5 424 345 6.36
KA_4 Dialysis 609 61 10.02
NFQ Excision, reconstruction and fusion of hip joint 663 41 6.18
GBB Tracheostomy and related operations 325 31 9.54
PDG Operations for aneurysm of infrarenal abdominal aorta and iliac arteries 280 40 14.29
AAK Operations on skull and dura 268 8 2.99
FC_3 Repair of aortic arch 253 20 7.91
FX_3 Other investigations of hearth function 173 4 2.31
FNC Aorto-coronary venous bypass 172 13 7.56
GA_ Diagnostic radiology chest wall, pleura and diaphragm 155 4 2.58
JK_2 Other procedures of biliary tract 203 7 3.45
JDH Operations on pylorus and duodenum 171 9 5.26
PEE Thrombectomy or embolectomy of femoral artery and branches 118 8 6.78
GAB Thoracotomy 100 8 8.00
JDC Partial gastrectomy 124 5 4.03
FKD Prosthetic replacement of mitral valve 93 8 8.60
JDE Anastomosis of stomach without concurrent gastrectomy 76 3 3.95
AAA Diagnostic intracranial procedures 78 5 6.41
FXA Intraoperative total cardiopulmonary bypass 62 16 25.81
1Excluding procedures with less than 50 patients and resuscitation (WX9).

Specialised somatic health care 2013
•A total of 1.78 million patients used specialised somatic health services in 2013.
•Inpatient care and day surgery had about 640 000 patients during the year, and there were nearly 1.7 million outpatient visits.
•Nearly 44 per cent of all periods of care in specialised health care are based on an emergency admission.
•The proportion of periods of care that started as an emergency admission of all periods of care varies greatly between specialties.
•There are differences in service selections between private and public hospitals.
•Most surgical operations performed in private hospitals were day surgeries.
19.04.23 Specialised somatic health care 2013, Statistical report 1/2015 22