Embed Size (px)
Citation preview
7/16/2019 14879762-EKG.ppt
http://slidepdf.com/reader/full/14879762-ekgppt 1/94
Electrocardiogram
Hanan Fathy
2008

7/16/2019 14879762-EKG.ppt
http://slidepdf.com/reader/full/14879762-ekgppt 2/94

7/16/2019 14879762-EKG.ppt
http://slidepdf.com/reader/full/14879762-ekgppt 3/94
Pacemaker = sinoatrial node
Impulse travels across atria
Reaches AV node
Transmitted along interventricular septum inBundle of His
Bundle splits in two (right and left branches)
Purkinje fibres

7/16/2019 14879762-EKG.ppt
http://slidepdf.com/reader/full/14879762-ekgppt 4/94
Overall
direction
of
cardiac
impulse

7/16/2019 14879762-EKG.ppt
http://slidepdf.com/reader/full/14879762-ekgppt 5/94
• An EKG is a method of measuring,
displaying and recording the electrical
activity of a heart
• Electrical stimuli is amplified to create
a “rhythm strip” by a machine thatconsistently produces representations
of the heart‟s electrical activity

7/16/2019 14879762-EKG.ppt
http://slidepdf.com/reader/full/14879762-ekgppt 6/94
• Bipolar Leads - leads have one
positive and one negative
• Limb Leads - Leads I, II, and III• Lead II is most common due to
ability to visualize P wave
– Lead I = left arm + and right arm - – Lead II = left leg + and right arm -
– Lead III = left leg + and left arm -

7/16/2019 14879762-EKG.ppt
http://slidepdf.com/reader/full/14879762-ekgppt 7/94
• Augmented LimbLeads
–
Leads aVR, aVL, aVF – Utilizes the four limb
leads
– Heart is the focal point
–
Current flows fromheart outward toextremities
– EKG machine mustboost amplification due
to positions of theseleads

7/16/2019 14879762-EKG.ppt
http://slidepdf.com/reader/full/14879762-ekgppt 8/94
• Chest Leads
– Called precordial or vector
[V] leads
– Look at horizontal or transverse plane
– Proper placement is
important for correct
interpretation – Should be measured each
time pads placed

7/16/2019 14879762-EKG.ppt
http://slidepdf.com/reader/full/14879762-ekgppt 9/94
• 6 are chest electrodes• Called V1-6 or C1-6
• 4 are limb electrodes
– Right arm R ide
– Left arm Your
– Left leg Green
– Right leg Bike
– Remember
• The right leg electrode is a
neutral or “dummy”!

7/16/2019 14879762-EKG.ppt
http://slidepdf.com/reader/full/14879762-ekgppt 10/94
Precordial (chest) leads
• V1⇒Right bundle branch system
• V2⇒Right anterior surface
• V3⇒Right anterior septal surface
• V4⇒Left anterior surface
• V5⇒Left ventricle
• V6⇒
Lateral surface

7/16/2019 14879762-EKG.ppt
http://slidepdf.com/reader/full/14879762-ekgppt 11/94
ECG machines can run at 50 or 25 mm/sec.
Major grid lines are 5 mm apart, at standard
25 mm/s, 5 mm corresponds to .20 seconds.Minor lines are 1 mm apart, at standard 25
mm/s, 1 mm corresponds to .04 seconds.
Voltage is measured on vertical axis.
Standard calibration is 0.1 mV per mm of
deflection.

7/16/2019 14879762-EKG.ppt
http://slidepdf.com/reader/full/14879762-ekgppt 12/94
• Arrhythmia: Abnormal rhythm
• Baseline: Flat, straight, isoelectric
line
•
Waveform: Movement away from thebaseline, up or down
• Segment: A line between waveforms
• Interval: A waveform plus a segment
• Complex: Combination of several
waveforms

7/16/2019 14879762-EKG.ppt
http://slidepdf.com/reader/full/14879762-ekgppt 13/94

7/16/2019 14879762-EKG.ppt
http://slidepdf.com/reader/full/14879762-ekgppt 14/94
• The excitation begins atthe sinus (SA) node and
spreads along the atrial
walls
• The resultant electricvector is shown in yellow
• Cannot propagate across
the boundary between atriaand ventricle
• The projections on Leads
I, II and III are all positive

7/16/2019 14879762-EKG.ppt
http://slidepdf.com/reader/full/14879762-ekgppt 15/94
Direction of impulse (axis)
Towards t
electrode
= positive
deflection
Away from
theelectrode
= negative
deflection

7/16/2019 14879762-EKG.ppt
http://slidepdf.com/reader/full/14879762-ekgppt 16/94
Electrophysiology

7/16/2019 14879762-EKG.ppt
http://slidepdf.com/reader/full/14879762-ekgppt 17/94
Cardiac Current Flow

7/16/2019 14879762-EKG.ppt
http://slidepdf.com/reader/full/14879762-ekgppt 18/94
Cardiac Current Flow

7/16/2019 14879762-EKG.ppt
http://slidepdf.com/reader/full/14879762-ekgppt 19/94

7/16/2019 14879762-EKG.ppt
http://slidepdf.com/reader/full/14879762-ekgppt 20/94

7/16/2019 14879762-EKG.ppt
http://slidepdf.com/reader/full/14879762-ekgppt 21/94
• If the heart rate is regular
– Count the number of large squares betweenR waves
• i.e. the RR interval in large squares
• Rate = 300
RR
e.g. RR = 4 large squares
300/4 = 75 beats per minute

7/16/2019 14879762-EKG.ppt
http://slidepdf.com/reader/full/14879762-ekgppt 22/94

7/16/2019 14879762-EKG.ppt
http://slidepdf.com/reader/full/14879762-ekgppt 23/94
If the rhythm is irregular it may be better to estimate the rate using the rhythm
strip at the bottom of the ECG (usually
lead II)
The rhythm strip is usually 25cm long
(250mm i.e. 10 seconds)If you count the number of R waves on
that strip and multiple by 6 you will get
the rate

7/16/2019 14879762-EKG.ppt
http://slidepdf.com/reader/full/14879762-ekgppt 24/94
I s the rhythm regular?
The easiest way to tell is to take a sheet of paper and line up one edge with the tips of
the R waves on the rhythm strip.
Mark off on the paper the positions of 3 or 4R wave tips
Move the paper along the rhythm strip so thatyour first mark lines up with another R wavetip
See if the subsequent R wave tips line upwith the subsequent marks on your paper

7/16/2019 14879762-EKG.ppt
http://slidepdf.com/reader/full/14879762-ekgppt 25/94
Interpretation of ECG
Normal heart rhythm has consistent R-R interval.
Mild variations due to breathing also normal.

7/16/2019 14879762-EKG.ppt
http://slidepdf.com/reader/full/14879762-ekgppt 26/94
Sinus Rhythm
– Definition:Cardiac impulse originates from thesinus node. Every QRS must be preceded by a P
wave.
– (This does not mean that every P wave must befollowed by a QRS – such as in 2nd degree heart
block where some P waves are not followed by a
QRS, however every QRS is preceded by a Pwave and the rhythm originates in the sinus node,hence it is a sinus rhythm. It could be said that itis not a normal sinus rhythm)

7/16/2019 14879762-EKG.ppt
http://slidepdf.com/reader/full/14879762-ekgppt 27/94
Sinus arrhythmia
• There is a change in heart rate depending on the phase of respiration
• Q. If a person with sinus arrhythmia inspires,what happens to their heart rate?
• A. The heart rate speeds up. This is because oninspiration there is a decrease in intrathoracic
pressure, this leads to an increased venous returnto the right atrium. Increased stretching of the
right atrium sets off a brainstem reflex(Bainbridge‟s reflex) that leads to sympatheticactivation of the heart, hence it speeds up)
• This physiological phenomenon is more apparent
in children and young adults

7/16/2019 14879762-EKG.ppt
http://slidepdf.com/reader/full/14879762-ekgppt 28/94
Sinus bradycardia
• Rhythm originates in the sinus node
• Rate of less than 60 beats per minute
Sinus tachycardia
• Rhythm originates in the sinus node
• Rate of greater than 100 beats per minute

7/16/2019 14879762-EKG.ppt
http://slidepdf.com/reader/full/14879762-ekgppt 29/94
• Step 1: Are there P waves?
• Step 2: Are there QRS complexes?
• Step 3: Are the P waves and QRS complexes related?

7/16/2019 14879762-EKG.ppt
http://slidepdf.com/reader/full/14879762-ekgppt 30/94
Example 1
• STEP 1.
–Are there P waves?

7/16/2019 14879762-EKG.ppt
http://slidepdf.com/reader/full/14879762-ekgppt 31/94
Example 1 Continued
• Are there P waves?
– Yes, P waves are easily identifiableand regular in rate.

7/16/2019 14879762-EKG.ppt
http://slidepdf.com/reader/full/14879762-ekgppt 32/94
Example 1 Continued
• STEP 2.
– Are there QRS complexes?

7/16/2019 14879762-EKG.ppt
http://slidepdf.com/reader/full/14879762-ekgppt 33/94
Example 1 Continued
• STEP 2.
– Yes there are normal, narrow, QRS
complexes.

7/16/2019 14879762-EKG.ppt
http://slidepdf.com/reader/full/14879762-ekgppt 34/94
Example 1 Continued
• STEP 3
– Are they related, 1:1?

7/16/2019 14879762-EKG.ppt
http://slidepdf.com/reader/full/14879762-ekgppt 35/94
Example 1 Continued
• STEP 3
– Are they related, 1:1?• Yes, there is one P wave for every QRS.
•This is called a sinus rhythm

7/16/2019 14879762-EKG.ppt
http://slidepdf.com/reader/full/14879762-ekgppt 36/94
Example 2
• Follow steps 1-3 as demonstrated in Ex.1.
• This is also a sinus rhythm.
• Note: The P waves are smaller, yet their regularity in
relation to the QRS complexes gives them away.

7/16/2019 14879762-EKG.ppt
http://slidepdf.com/reader/full/14879762-ekgppt 37/94
Example Three
• Following the same steps, this one doesn‟tmatch up!?!?

7/16/2019 14879762-EKG.ppt
http://slidepdf.com/reader/full/14879762-ekgppt 38/94
Example 3 continued
• Step 1 – Are there P waves?
• Yes,
– Note: notice the dotted arrows indicate thelocation of P waves buried in the strongerelectrical activity of the QRS complexes.

7/16/2019 14879762-EKG.ppt
http://slidepdf.com/reader/full/14879762-ekgppt 39/94
Example 3 Continued
• STEP 2
– Are there QRS complexes?
•Yes, there are normal, narrow
QRS complexes.

7/16/2019 14879762-EKG.ppt
http://slidepdf.com/reader/full/14879762-ekgppt 40/94
Example 3 Continued
• STEP 3.
– Are they related?
• NO, they are both regular in shape and rate, but
there is no relation between them.
– This shows a Complete Heart Block, also called a
3rd degree block.
– Can the Heart effectively pump blood if the Atria
and Ventricles are not working together?

7/16/2019 14879762-EKG.ppt
http://slidepdf.com/reader/full/14879762-ekgppt 41/94
Supraventricular tachycardias• These are tachycardias where the impulse
is initiated in the atria (sinoatrial node,atrial wall or atrioventricular node)
• If there is a normal conduction pathway
when the impulse reaches the ventricles, anarrow QRS complex is formed, hencethey are narrow complex tachycardias
• However if there is a conduction problemin the ventricles such as LBBB, then a
broad QRS complex is formed. Thiswould result in a form of broad complextachycardia

7/16/2019 14879762-EKG.ppt
http://slidepdf.com/reader/full/14879762-ekgppt 42/94
Atrial FibrillationFeatures:
• There maybe tachycardia
• The rhythm is usually irregularly
irregular • No P waves are discernible – instead
there is a shaky baseline
– This is because there is no order to atrialdepolarisation, different areas of atriumdepolarise at will

7/16/2019 14879762-EKG.ppt
http://slidepdf.com/reader/full/14879762-ekgppt 43/94
Atrial Fibrillation

7/16/2019 14879762-EKG.ppt
http://slidepdf.com/reader/full/14879762-ekgppt 44/94
Atrial flutter
Features:
• There is a saw-tooth baseline which
rises above and dips below theisoelectric line
• This is created by circular circuits of depolarisation set up in the atria

7/16/2019 14879762-EKG.ppt
http://slidepdf.com/reader/full/14879762-ekgppt 45/94
Cardiac Rhythm: Supraventricular NORMAL SINUS RHYTHM Impuses originate at S-A node at normal rate
SINUS TACHYCARDIA Impuses originate at S-A node at rapid rate
All complexes normal, evenly spaced
Rate > 100/min
SINUS TACHYCARDIA
Impuses originate at S-A node at rapid rate
All complexes normal, rhythm is irregular
- >
7/16/2019 14879762-EKG.ppt
http://slidepdf.com/reader/full/14879762-ekgppt 46/94
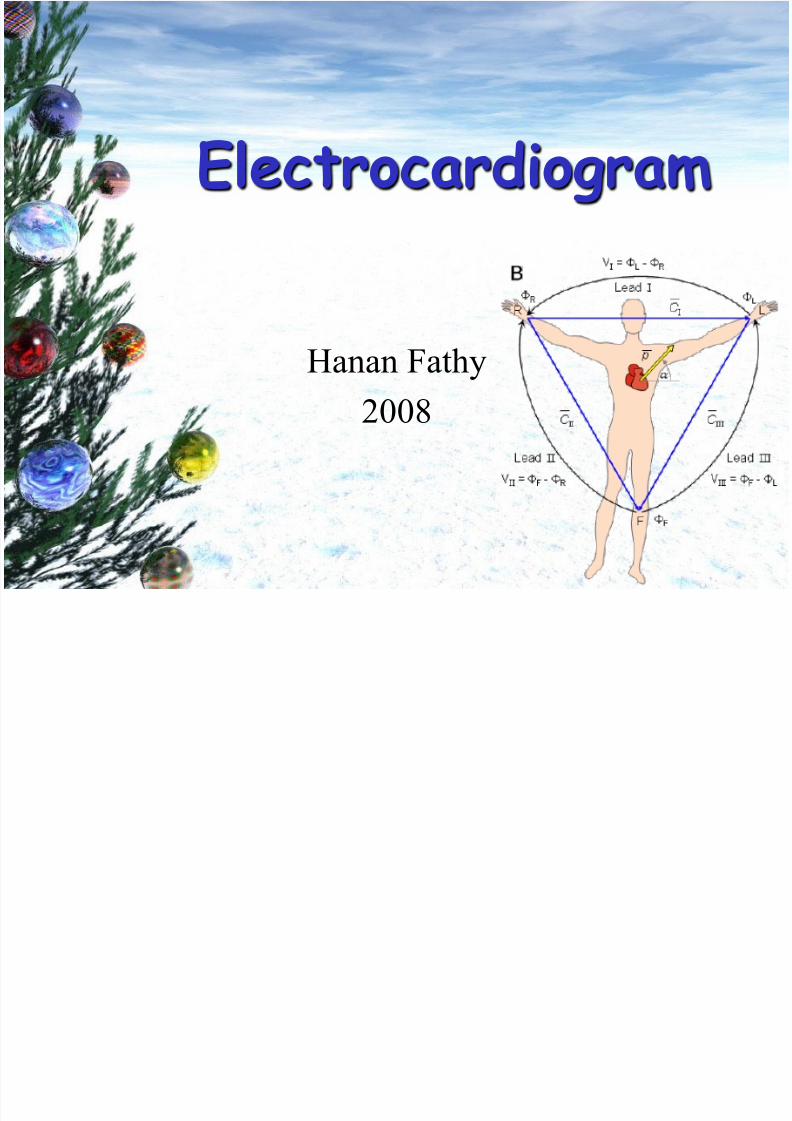
Cardiac Rhythm: Supraventricular
ATRIAL FLUTTER Impulses travel in circular course in atria – No interval between T and P
Rapid flutter waves, ventricular response irregular
ATRIAL FIBRILLATION Impuses have chaotic, random pathways in atria
Baseline irregular, ventricular response irregular

7/16/2019 14879762-EKG.ppt
http://slidepdf.com/reader/full/14879762-ekgppt 47/94
Cardiac Rhythm: Ventricular PREMATURE VENTRICULAR CONTRACTION A single impulse originates at right ventricle
Time interval between normal R peaksis a multiple of R-R intervals
VENTRICULAR TACHYCARDIA Impulse originate at ventricular pacemaker – odd/wide QRS complex - often due to myocardial infarction
Wide ventricular complexes
Rate> 120/min

7/16/2019 14879762-EKG.ppt
http://slidepdf.com/reader/full/14879762-ekgppt 48/94
Cardiac Rhythm: Ventricular VENTRICULAR FIBRILLATION Chaotic ventricular depolarization – ineffective at pumping blood – death within minutes
Rapid, wide, irregular ventricular complexes
PACER RHYTHM Impulses originate at transvenous pacemaker
Wide ventricular complexes preceded by pacemaker spike
Rate is the pacer rhythm
A i i S i d

7/16/2019 14879762-EKG.ppt
http://slidepdf.com/reader/full/14879762-ekgppt 49/94
Activation Sequence DisordersA-V BLOCK, FIRST DEGREE
Atrio-ventricular conduction lengthened
P-wave precedes each QRS-complex but PR-interval is > 0.2 s
A-V BLOCK, SECOND DEGREE
Sudden dropped QRS-complex
Intermittently skipped ventricular beat
B dl b h Bl k

7/16/2019 14879762-EKG.ppt
http://slidepdf.com/reader/full/14879762-ekgppt 50/94
Bundle-branch Block RIGHT BUNDLE-BRANCH BLOCK
QRS duration greater than 0.12 s
Wide S wave in leads I, V5 and V6
V i l T h di

7/16/2019 14879762-EKG.ppt
http://slidepdf.com/reader/full/14879762-ekgppt 51/94
Ventricular Tachycardia
• Usually secondary to infarction
• Circuits of depolarisation are set up indamaged myocardium
• This leads to recurrent earlyrepolarisation of the ventricle leadingto tachycardia
• As the rhythm originates in the
ventricles, there is a broad QRScomplex
• Hence it is one of the causes of a broad complex tachycardia (along
with supraventricular tachycardia with
V i l fib ill i

7/16/2019 14879762-EKG.ppt
http://slidepdf.com/reader/full/14879762-ekgppt 52/94
Ventricular fibrillation
• Completely disordered ventricular
depolarisation
• Not compatible with a cardiac
output
• Results in a completely irregular
trace consisting of broad QRS
complexes of varying widths,
heights and rates

7/16/2019 14879762-EKG.ppt
http://slidepdf.com/reader/full/14879762-ekgppt 53/94

7/16/2019 14879762-EKG.ppt
http://slidepdf.com/reader/full/14879762-ekgppt 54/94
Elements of the tracing
7/16/2019 14879762-EKG.ppt
http://slidepdf.com/reader/full/14879762-ekgppt 55/94
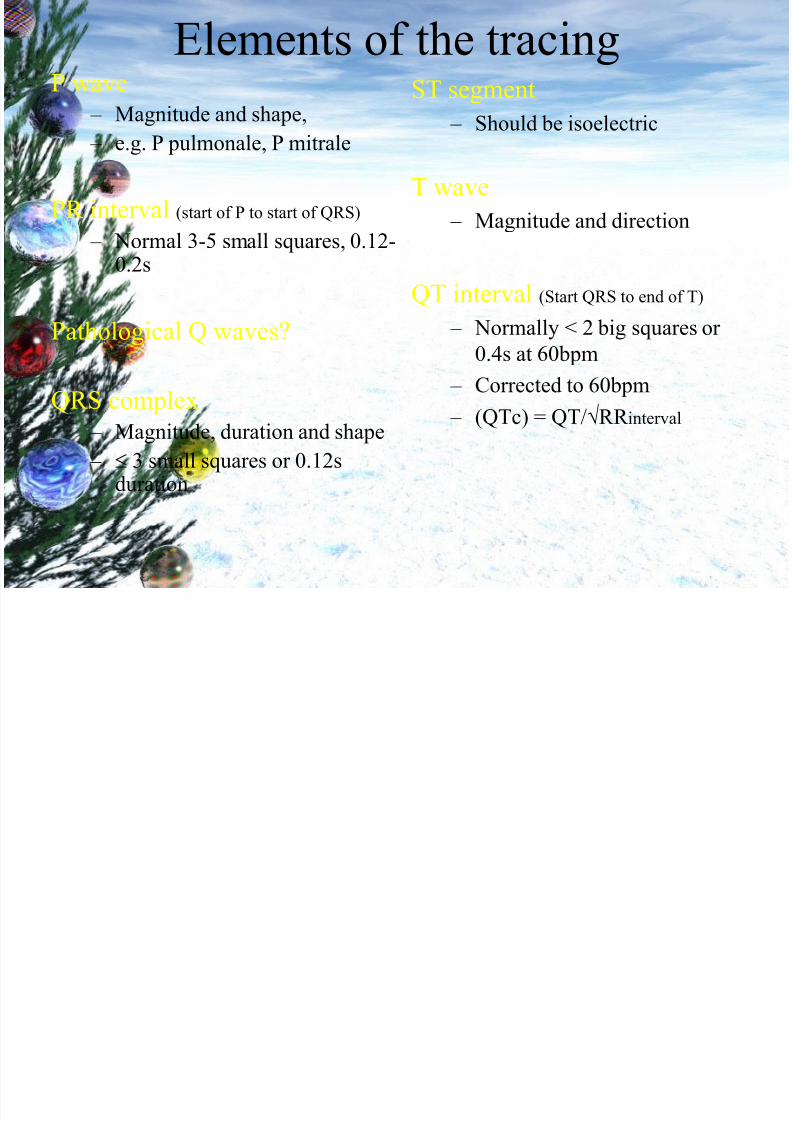
Elements of the tracingP wave
– Magnitude and shape,
– e.g. P pulmonale, P mitrale
PR interval (start of P to start of QRS)
– Normal 3-5 small squares, 0.12-0.2s
Pathological Q waves?
QRS complex
– Magnitude, duration and shape
– 3 small squares or 0.12sduration
ST segment
– Should be isoelectric
T wave
– Magnitude and direction
QT interval (Start QRS to end of T)
– Normally < 2 big squares or
0.4s at 60bpm
– Corrected to 60bpm
– (QTc) = QT/RR interval

7/16/2019 14879762-EKG.ppt
http://slidepdf.com/reader/full/14879762-ekgppt 56/94
Further work
• Check out the various quizzes / games
available on the Imperial Intranet
• Get doctors on the wards to run through a
patient‟s ECG with you

7/16/2019 14879762-EKG.ppt
http://slidepdf.com/reader/full/14879762-ekgppt 57/94
Case Study of Beau
• Beau is an 11 y/o 45 lb. Male Australian
Shepard.
• Physical exam: see overhead• Beau presents with a moderate, chronic, nocturnal
cough with mild dyspnea. Secondary exam also
reveals a pounding irregular heartbeat and Grade 4
murmur.
• Electrocardiogram was ordered in addition to other
tests. Result:
Point of Origin Name

7/16/2019 14879762-EKG.ppt
http://slidepdf.com/reader/full/14879762-ekgppt 58/94
Point of Origin Name
• SA Node- Sinus rhythm
– Causes regular, rounded P waves, and normal,narrow QRS complexes
• Atria-Atrial rhythm
– Causes irregularly shaped P waves, but still
normal, narrow QRS complexes
• AV Node-Junctional rhythm
– Normal, narrow QRS complexes with no P
waves
• Perkinjie Fibers- Ventricular rhythm
– No P waves, and irregular, wide QRS
complexes

7/16/2019 14879762-EKG.ppt
http://slidepdf.com/reader/full/14879762-ekgppt 59/94
• The axis can be though of as the
overall direction of the cardiac
impulse or wave of depolarisation of the heart
• An abnormal axis (axis deviation) cangive a clue to possible pathology

7/16/2019 14879762-EKG.ppt
http://slidepdf.com/reader/full/14879762-ekgppt 60/94
A normal axis
can lie
anywhere
between -30
and +90degrees
or +120
degrees
according to
some
An axis falling
outside the normal
range can be left
axis deviation
right axisdeviation
or extreme
axis
deviation
7/16/2019 14879762-EKG.ppt
http://slidepdf.com/reader/full/14879762-ekgppt 61/94
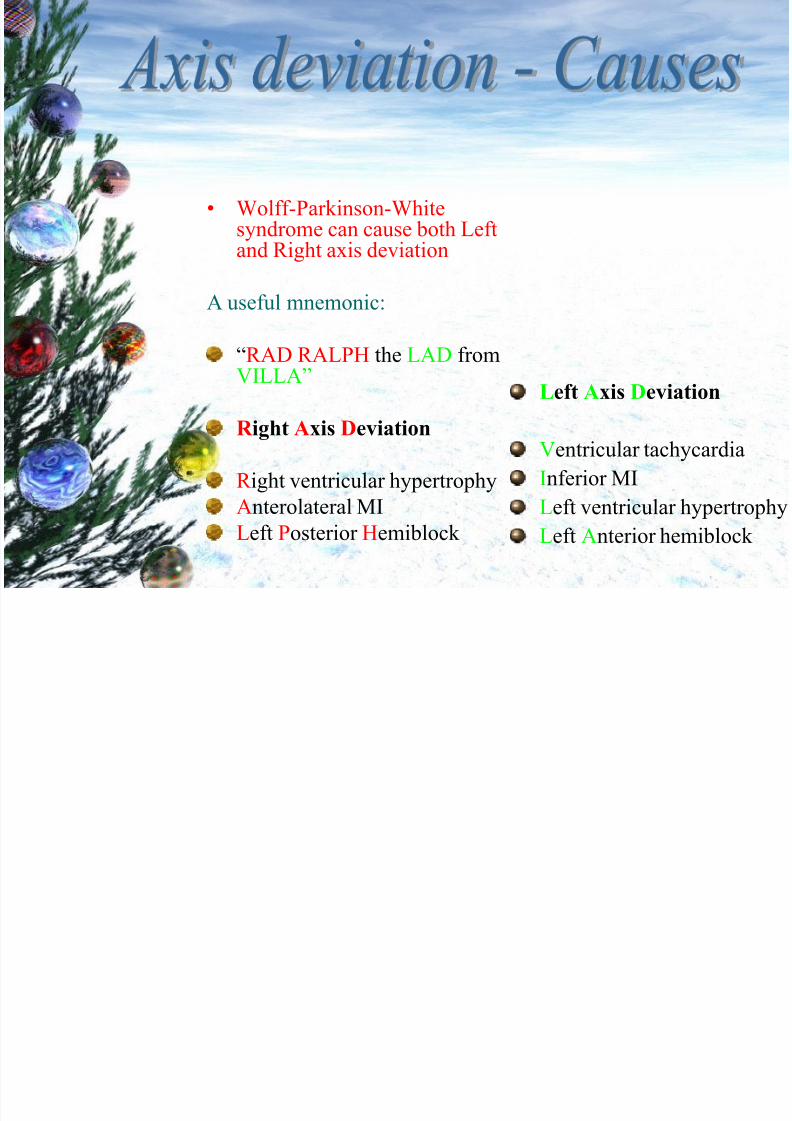
• Wolff-Parkinson-Whitesyndrome can cause both Leftand Right axis deviation
A useful mnemonic:
“RAD RALPH the LAD from VILLA”
R ight Axis Deviation
R ight ventricular hypertrophy
Anterolateral MI
Left Posterior Hemiblock
Left Axis Deviation
Ventricular tachycardia
Inferior MI
Left ventricular hypertrophy
Left Anterior hemiblock
The P wave

7/16/2019 14879762-EKG.ppt
http://slidepdf.com/reader/full/14879762-ekgppt 62/94
The P wave
The P wave represents atrial depolarisation
It can be thought of as being made up of two separate waves due to
right atrial depolarisation and left atrial depolarisation.
Which occurs first?
Right atrial depolarisation
right atrial depolarisation
Sum of
right and
left waves
left atrial depolarisation
The P wave

7/16/2019 14879762-EKG.ppt
http://slidepdf.com/reader/full/14879762-ekgppt 63/94
The P wave
Dimensions
• No hard and fast rules
Height
– a P wave over 2.5mm should arouse suspicion
Length
– a P wave longer than 0.08s (2 small squares) shouldarouse suspicion
The P wave

7/16/2019 14879762-EKG.ppt
http://slidepdf.com/reader/full/14879762-ekgppt 64/94
The P waveHeight
• A tall P wave (over 2.5mm) can be called P pulmonale
• Occurs due to R atrial hypertrophy
• Causes include: – pulmonary hypertension,
– pulmonary stenosis
– tricuspid stenosis
normal P pulmonale
>2.5mm
The P wave

7/16/2019 14879762-EKG.ppt
http://slidepdf.com/reader/full/14879762-ekgppt 65/94
The P waveLength
• A P wave with a length >0.08 seconds (2
small squares) and a bifid shape is called
P mitrale
• It is caused by left atrial hypertrophy and
delayed left atrial depolarisation • Causes include:
– Mitral valve disease
– LVH
normal P mitrale
The PR interval

7/16/2019 14879762-EKG.ppt
http://slidepdf.com/reader/full/14879762-ekgppt 66/94
The PR interval
The PR interval is measured between
the start of the P wave to the start of the QRS complex
(therefore if there is a Q wave before
the R wave the PR interval is measured
from the start of the P wave to the start
of the Q wave, not the start of the R wave)
The PR interval

7/16/2019 14879762-EKG.ppt
http://slidepdf.com/reader/full/14879762-ekgppt 67/94
The PR interval corresponds to thetime period between depolarisation
of the atria and ventricular
depolarisation.
A normal PR interval is between
0.12 and 0.2 seconds ( 3-5 small
squares)
The PR interval

7/16/2019 14879762-EKG.ppt
http://slidepdf.com/reader/full/14879762-ekgppt 68/94
If the PR interval is short (less than
3 small squares) it may signify thatthere is an accessory electrical pathway between the atria and the
ventricles, hence the ventriclesdepolarise early giving a short PR interval.
One example of this is Wolff-Parkinson-White syndrome wherethe accessory pathway is called the
bundle of Kent.
Depolarisation begins at

7/16/2019 14879762-EKG.ppt
http://slidepdf.com/reader/full/14879762-ekgppt 69/94
Depolarisation begins at
the SA node
The wave of
depolarisation spreads
across the atria
It reaches the AV node
and the accessory bundle
Conduction is delayed as
usual by the in-built delay
in the AV node
However, the accessory
bundle has no such delay
and depolarisation begins
early in the part of the
ventricle served by thebundle
As the depolarisation in this part of the ventricle
does not travel in the high speed conduction
pathway, the spread of depolarisation across the
ventricle is slow, causing a slow rising delta wave
Until rapid depolarisation
resumes via the normal
pathway and a more normal
complex follows
The PR interval

7/16/2019 14879762-EKG.ppt
http://slidepdf.com/reader/full/14879762-ekgppt 70/94
If the PR interval is long (>5 small
squares or 0.2s):
If there is a constant long PR interval
1st degree heart block is present
First degree heart block is a longer
than normal delay in conduction at the
AV node
The PR interval

7/16/2019 14879762-EKG.ppt
http://slidepdf.com/reader/full/14879762-ekgppt 71/94
• If the PR interval looks as though it is
widening every beat and then a QRScomplex is missing, there is 2nd degree heart
block, Mobitz type I. The lengthening of
the PR interval in subsequent beats is
known as the Wenckebach phenomenon
• (remember (w)one, Wenckebach, widens)
• If the PR interval is constant but then thereis a missed QRS complex then there is 2nd
degree heart block, Mobitz type II
Th PR i t l

7/16/2019 14879762-EKG.ppt
http://slidepdf.com/reader/full/14879762-ekgppt 72/94
The PR interval
• If there is no discernable
relationship between the P waves
and the QRS complexes, then 3rd
degree heart block is present
Heart block (AV node block)

7/16/2019 14879762-EKG.ppt
http://slidepdf.com/reader/full/14879762-ekgppt 73/94
ea t b oc ( V ode b oc )
Summary
• 1st degree
– constant PR, >0.2 seconds
• 2nd degree type 1 (Wenckebach)
– PR widens over subsequent beats then a QRSis dropped
• 2nd degree type 2
– PR is constant then a QRS is dropped
• 3rd degree
– No discernable relationship between p wavesand QRS complexes
The Q wave

7/16/2019 14879762-EKG.ppt
http://slidepdf.com/reader/full/14879762-ekgppt 74/94
QAre there any pathological Q waves?
• A Q wave can be pathological if it is: – Deeper than 2 small squares (0.2mV)
and/or
– Wider than 1 small square (0.04s)
and/or
– In a lead other than III or one of the leads thatlook at the heart from the left (I, II, aVL, V5and V6) where small Qs (i.e. not meeting thecriteria above) can be normal
Normal if in
I,II,III,aVL,V5-6
Pathological
anywhere
The QRS height

7/16/2019 14879762-EKG.ppt
http://slidepdf.com/reader/full/14879762-ekgppt 75/94
Q g
• If the complexes in the chest
leads look very tall, consider leftventricular hypertrophy (LVH)
• If the depth of the S wave in V1added to the height of the R wave
in V6 comes to more than 35mm,
LVH is present
QRS width

7/16/2019 14879762-EKG.ppt
http://slidepdf.com/reader/full/14879762-ekgppt 76/94
Q
• The width of the QRS complex should be less than 0.12 seconds (3 small
squares)
• Some texts say less than 0.10 seconds
(2.5 small squares)
• If the QRS is wider than this, itsuggests a ventricular conduction
problem – usually right or left bundle
branch block (RBBB or LBBB)
QRS width

7/16/2019 14879762-EKG.ppt
http://slidepdf.com/reader/full/14879762-ekgppt 77/94
QRS widthIt is then useful to look at leads V1 and V6
• If left bundle branch block is present, theQRS complex may look like a „W‟ in V1 and/or an „M‟ shape in V6
• If right bundle branch block is present,there may be an „M‟ in V1 and/or a „W‟in V6
• This can be remembered by themnemonic:
• WiLLiaM MaRR oW
QRS width

7/16/2019 14879762-EKG.ppt
http://slidepdf.com/reader/full/14879762-ekgppt 78/94
QRS width
• If LBBB is present, it is verydifficult to interpret the followingST segment
• If there is new onset LBBB, it mayrepresent an MI
• Bundle branch block is causedeither by infarction or fibrosis(related to the ageing process)
The ST segment

7/16/2019 14879762-EKG.ppt
http://slidepdf.com/reader/full/14879762-ekgppt 79/94
The ST segment• The ST segment should sit on the isoelectric
line
• It is abnormal if there is planar (i.e. flat)
elevation or depression of the ST segment
• Planar ST elevation can represent an MI or
Prinzmetal‟s (vasospastic) angina
• Planar ST depression can represent
ischaemia
Th ST t

7/16/2019 14879762-EKG.ppt
http://slidepdf.com/reader/full/14879762-ekgppt 80/94
The ST segment
• If the ST segment is elevated butslanted, it may not be significant
• If there are raised ST segments inmost of the leads, it may indicate
pericarditis – especially if the ST
segments are saddle shaped. Therecan also be PR segment depression
Myocardial infarction

7/16/2019 14879762-EKG.ppt
http://slidepdf.com/reader/full/14879762-ekgppt 81/94
Myocardial infarction
• Within hours: – T wave may become peaked
– ST segment may begin to rise
• Within 24 hours: – T wave inverts (may or may not persist)
– ST elevation begins to resolve
– If a left ventricular aneurysm forms, ST
elevation may persist
• Within a few days:
– pathological Q waves can form and usually
persist
Myocardial infarction

7/16/2019 14879762-EKG.ppt
http://slidepdf.com/reader/full/14879762-ekgppt 82/94
Myocardial infarction
• The leads affected determine the
site of the infarct
• Inferior II, III, aVF
• Anteroseptal V1-V4
• Anterolateral V4-V6, I, aVL
• Posterior Tall wide R and ST↓ inV1 and V2
Acute Anterior MI

7/16/2019 14879762-EKG.ppt
http://slidepdf.com/reader/full/14879762-ekgppt 83/94
ST elevation
Inferior MI

7/16/2019 14879762-EKG.ppt
http://slidepdf.com/reader/full/14879762-ekgppt 84/94
ST elevation
The T wave
7/16/2019 14879762-EKG.ppt
http://slidepdf.com/reader/full/14879762-ekgppt 85/94
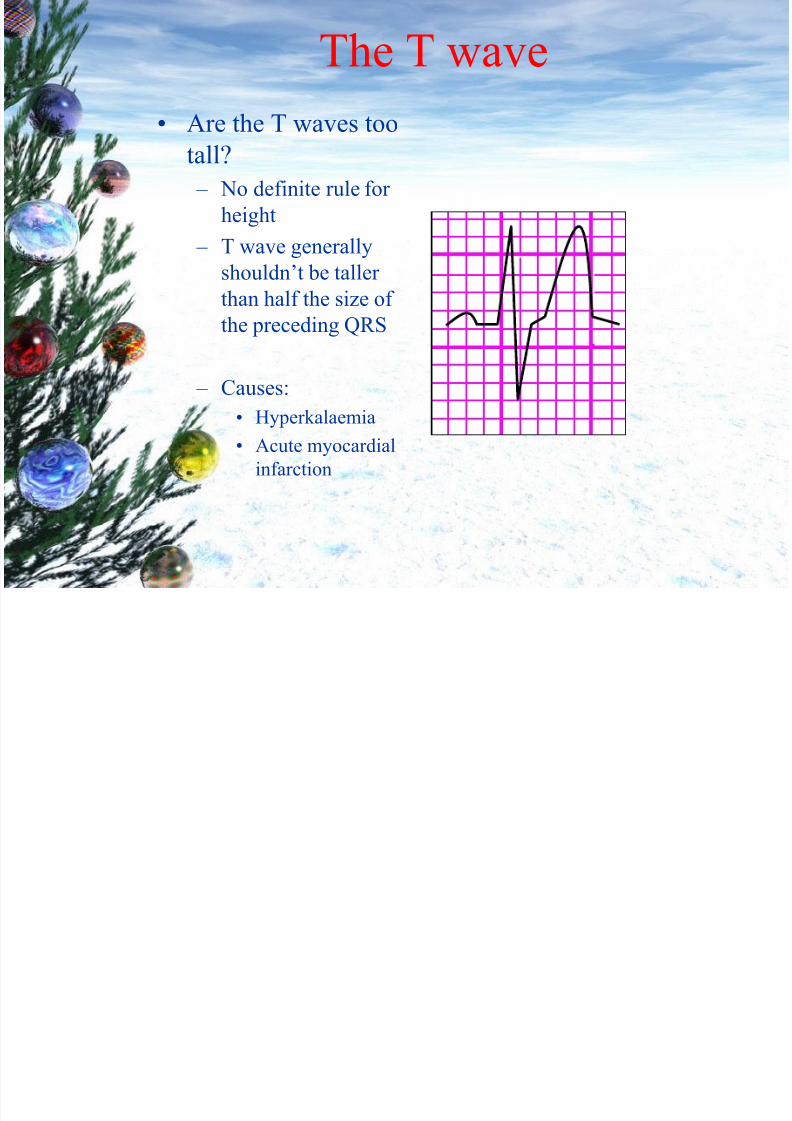
The T wave
• Are the T waves too
tall? – No definite rule for
height
– T wave generally
shouldn‟t be taller than half the size of
the preceding QRS
– Causes:
• Hyperkalaemia
• Acute myocardial
infarction
The T wave

7/16/2019 14879762-EKG.ppt
http://slidepdf.com/reader/full/14879762-ekgppt 86/94
The T wave
• If the T wave is flat, it may indicatehypokalaemia
• If the T wave is inverted it mayindicate ischaemia
The QT interval

7/16/2019 14879762-EKG.ppt
http://slidepdf.com/reader/full/14879762-ekgppt 87/94
The QT interval
• The QT interval is measured from the start
of the QRS complex to the end of the Twave.
• The QT interval varies with heart rate
• As the heart rate gets faster, the QTinterval gets shorter
• It is possible to correct the QT intervalwith respect to rate by using the followingformula:
– QTc = QT/√RR (QTc = corrected QT)
The QT interval

7/16/2019 14879762-EKG.ppt
http://slidepdf.com/reader/full/14879762-ekgppt 88/94
The QT interval
• The normal range for QTc is 0.38-
0.42
• A short QTc may indicate
hypercalcaemia
• A long QTc has many causes
• Long QTc increases the risk of developing an arrhythmia
The U wave

7/16/2019 14879762-EKG.ppt
http://slidepdf.com/reader/full/14879762-ekgppt 89/94
The U wave
• U waves occur after the T wave
and are often difficult to see
• The are thought to be due to
repolarisation of the atrial
septum
• Prominent U waves can be a sign
of hypokalaemia,
hyperthyroidism
C St d f B

7/16/2019 14879762-EKG.ppt
http://slidepdf.com/reader/full/14879762-ekgppt 90/94
Case Study of Beau
• EKG reveals a Sinus Arrhythmia, – Beaus heart is “firing off” PrematureAtrial Contractions, “PAC‟s.
• Potentially indicative of atrialenlargement, or other heart irritability,which may or may not be related toBeau’s cough and current presentation.

7/16/2019 14879762-EKG.ppt
http://slidepdf.com/reader/full/14879762-ekgppt 91/94

7/16/2019 14879762-EKG.ppt
http://slidepdf.com/reader/full/14879762-ekgppt 92/94

7/16/2019 14879762-EKG.ppt
http://slidepdf.com/reader/full/14879762-ekgppt 93/94

7/16/2019 14879762-EKG.ppt
http://slidepdf.com/reader/full/14879762-ekgppt 94/94