Embed Size (px)
Citation preview

home of championswaipa
20092019
10-Year Plan

Waipa District CouncilPrivate Bag 2402Te Awamutu 3840Phone: 0800 WAIPADC (0800 924 723)Email: [email protected]: www.waipadc.govt.nz
Council Offi ces:Te Awamutu Council Offi ces Cambridge Council Offi ces101 Bank Street 23 Wilson StreetTe Awamutu Cambridge

10‐year Plan (2009‐19) 1
A great place to live, work and play
2 Waipa District Council
10‐Year Plan Statement
The ‘10‐year Plan 2009‐19’ is Council’s Long Term Council Community Plan (LTCCP) developed in accordance with Part 6 of the Local Government Act 2002 which deals with planning, decision‐making and accountability requirements for councils. Council is required by law to prepare and adopt a 10‐year Plan by 1 July 2009. The 10‐year Plan will be adopted in accordance with the special consultative procedure under the Local Government Act 2002. Council’s Policy Committee, acting under delegated authority from Council, approved the draft 10‐year Plan on 10 March 2009 releasing it for public submission from 16 March until 17 April 2009. The Policy Committee considered submissions during the week starting 12 May 2009. The Policy Committee will recommend the Plan for adoption by Council (including amendments resulting from the special consultative procedure). The 10‐year Plan will be adopted on 30 June 2009 and it will take effect from 1 July 2009. Please note: Actual results for 2009‐19 may vary from the information presented in the adopted 10‐year Plan 2009‐19 and the information contained within this document may not be appropriate for purposes other than guiding community input into Council decision‐making. Information relating to future years will be updated in subsequent 10‐year Plan amendments and Annual Plans. The achievements in any year will be presented in Council’s Annual Report for that year.

10‐year Plan (2009‐19) 3
Whakatauki
Hutia te rito o te harakeke
Kei whea te tauranga o te kómako e ko? Ki mai koe, ki ahau
He aha te mea nui o ténei ao? Máku e ki atu
He tangata, He tangata, He tangata
If you remove the heart of the flax Where will the bellbird then rest?
If you should ask me What is the main thing in this world?
I will say to you It is people, it is people, it is people
4 Waipa District Council
Council Mission and Goals
Purpose (Mission) To partner the community in promoting the wellbeing of the Waipa District and its people. Vision The Home of Champions. Key Goal Waipa District ‐ The great place to live, work and play. Supporting Goals
1. To recognise and foster awareness and the enhancement of the unique cultural, historic, environmental and recreational character and strengths of the District.
2. To ensure prudent stewardship of the natural and physical resources of the District. 3. To provide facilities and services to meet the expectations of residents and ratepayers. 4. To maximise the contribution of Council’s assets in promoting the sustainable development
of the District. 5. To form strong and productive partnerships with other authorities, community organisations
and the private sector to provide the District with development opportunities. 6. To provide services and/or actively support Community Boards and community and welfare
organisations in meeting the physical, recreational, employment, cultural and social needs of the residents of the District.
7. To act as an advocate to promote the social, economic, cultural and environmental wellbeing of residents of the District.
8. To encourage the active and positive involvement of residents and ratepayers in Council’s decision‐making processes.
9. To implement the legal obligations of a territorial authority governing Waipa District.

10‐year Plan (2009‐19) 5
Foreword by the Mayor and Chief Executive
There are many attributes that shape Waipa’s strong and unique identity; we will strive to protect and enhance these as we plan for the future. Waipa – Home of Champions Council is pleased to present this 10‐year Plan for 2009‐19 which continues to support the District’s vision: Waipa – Home of Champions. This vision, which represents a wider view of a ‘champion’, reflects the community’s long term aspirations (community outcomes), and seeks to improve the wellbeing of residents to establish Waipa as a great place to live, work and play. The quality of our environment, heritage, facilities and services and recreational opportunities are what residents have identified as making Waipa a favoured place to live. Council remains committed to maintaining, enhancing and promoting these unique features and its long‐term plans reflect that commitment. Council acknowledges that it is one of many agencies that contribute to the positive development of the District. There are many businesses, community agencies and voluntary groups working within our District that also contribute to the achievement of our community outcomes. This Plan outlines the services, activities and projects that Council intends to undertake from 1 July 2009 to 30 June 2019. Challenging Times We are fortunate to have a District that is in great heart and is well positioned to weather the economic challenges. Council is mindful of these challenges and their impact on residents and ratepayers. In preparing this Plan, Council has made significant changes to planned capital works programmes and operational activities presented in earlier Plans in order to reduce rating requirements over the 10 years. It is important to note that rating requirements are also determined by external factors, such as increased energy and construction costs, and the costs of complying with regional and national standards. In addition, the flow‐on effect of significant projects undertaken in previous years has increased rating requirements. In making changes to proposed activities and programmes, Council seeks to reduce rating pressures while continuing the work essential to maintaining core community services. Waipa is, and will continue to be, a growing District and it is important to make provision for the future as well as providing for the present. Growth brings positive benefits to the District but puts pressure on community infrastructure, services and operating costs. The development of Council’s infrastructural assets (such as water supply and wastewater disposal) have long lead in times, consequently, we need to plan now for the next 10 years and beyond. In many cases this planning horizon extends to 15 or 20 years.

6 Waipa District Council
Making Choices Waipa residents have high expectations of the quality of services and infrastructure provided and Council must balance this with the financial impact it creates. Choices have to be made and consideration needs to be given to the implications and risks associated with those choices. Affordability and sustainability must underpin our planning and decision‐making for the present and the future. In preparing this Plan for 2009‐19, Council has had regard to past and recent community feedback. In doing so, it has followed some key principles, including:
▪ Community outcomes are considered in decision‐making ▪ Primary focus is given to maintaining the key infrastructure needed to support core services ▪ Levels of service to remain generally unchanged, unless otherwise indicated ▪ Some community projects, which reflect increased levels of service, will be timed to suit
funding availability or not proceed as previously signalled due to economic challenges ▪ Community projects which rely on external funding will only proceed to the extent that
availability of this funding allows ▪ Future councils must have the capacity and flexibility to respond to future community
needs within acceptable levels of affordability and sustainability This Plan signals a period of consolidation and financial constraint. The impact and risks associated with this are identified and managing these risks is critical for Council. As circumstances change, plans may need to be altered to reflect new priorities. Key Projects The projects presented in this Plan are required to renew and upgrade infrastructural assets, maintain levels of service, provide for increased environmental and health standards and to support growth and development. Most are essential and failing to do them will compromise levels of service, community safety and wellbeing or put Council at odds with its statutory responsibilities. A list of the key projects/initiatives proposed over the next 10 years is provided in the Plan. They include:
▪ Completion of the Waipa 2050 project (includes a District growth strategy, Town Concept Plans and the review of the District Plan)
▪ Upgrading the Cambridge wastewater plant ▪ Development of Karapiro Domain ▪ Construction of a new swimming complex in Cambridge ▪ Upgrading the Te Awamutu town centre (Heart of Te Awamutu) ▪ Construction of a new Cultural/Heritage Centre for Te Awamutu ▪ Upgrading of the Te Awamutu, Kihikihi, Cambridge and Pukerimu water supplies ▪ Ongoing support for the Maungatautari Ecological Island project ▪ Introduction of expanded bus services connecting Cambridge and Te Awamutu/Kihikihi with
Hamilton

10‐year Plan (2009‐19) 7
It must be noted that many worthwhile projects that are consistent with Council’s vision were considered for inclusion in this Plan. However, funding constraints and economic challenges mean that they have been modified, deferred or have not been included at all. Rating/Financial Overview Council activities and projects are funded either from rates, fees and charges, development contributions, depreciation, financial reserves and loans or some combination of these. Wherever possible, Council seeks to obtain funds from sources other than rates. There are different rates for different purposes. These include a general rate for all activities, a ward rate and rates for community facilities, capital works, stormwater, rural fire, sewerage, water, recycling and community halls. This 10‐year Plan requires total rate revenue of $35 million, $38 million and $41 million for the first three years which represents annual increases of 5.6%, 6.9% and 6.2% respectively. Growth in the number of new rateable properties is expected to contribute a further 2.1% in each of the first three years. The increase in rates is a reflection of:
▪ Additional service demands from a growing community ▪ The effect of costs associated with capital works projects and programmes undertaken over
the past 5‐10 years ▪ Increased value of infrastructural assets and the need to fund increased levels of
depreciation ▪ Increases in contract costs and the costs of materials ▪ Increased costs associated with statutory obligations
The capital expenditure proposed in the Plan will increase debt levels (loans) from $25 million to $89.9 million over the next 10 years. The projected levels of borrowing are within Councils’ limits and allow some capacity and flexibility for future borrowing should circumstances warrant it. Community Consultation The process to develop this 10‐year Plan has been extensive and work started shortly after the adoption of the 2006‐16 10‐year Plan in June 2006. Council has drawn on community input, including surveys, focus groups, submissions and feedback received during consultation on a range of matters over the past two years. In preparing this Plan, Council has looked to allocate funding to the key areas identified by Council and the community. The Plan builds on and maintains the progress made in recent years, but intends that this be done in a way that is sustainable and affordable. The extensive and diverse range of services provided in the Plan and changes in property valuations mean the rating impacts from it are different for different ratepayers. Rate levels have been provided in the Plan for a range of indicator properties so that residents and ratepayers can get an indication of expected rating levels for 2009/10 and beyond.

8 Waipa District Council
The draft 10‐year Plan was presented for public consultation and feedback during March and April 2009. More than 630 submissions were received and these were considered by Council, resulting in a number of changes to the draft Plan. A summary of these changes is presented later in this Plan.
Alan Livingston Mayor JP
John Inglis Chief Executive

10‐year Plan (2009‐19) 9
Contents Page
10‐Year Plan Statement 2 Whakatauki 3 Council Mission and Goals 4 Foreword by the Mayor and Chief Executive 5 Contents Page 9
SECTION 2 – INTRODUCTION 11 What is the 10‐year Plan? 12 Sections in the 10‐year Plan 14 Map of Waipa District 17 Waipa District – Home of Champions 18 Challenges for Council – Overview 22 Key Initiatives – Overview 24 Financial Overview and Strategy 33 Assumptions 37
SECTION 3 ‐ COMMUNITY VISION 41 Background to Community Vision 42 Waipa District Community Outcomes 43 Waikato Region’s Community Outcomes 44 Iwi (Māori) Community Outcomes 49 Measuring Progress Towards Achieving Community Outcomes 53 State of Waipa District Summary 60 Partnering for Success – About the Process 62 Community Action – Current and Future Projects 63
SECTION 4 ‐ COUNCIL’S RESPONSE 65 Challenges for Council 66 Council’s Role – Links to Strategic Planning 71 Key Achievements 2006‐2009 73 Community Satisfaction Survey Results 79 Highlights of Council Planned Activities 2009‐2019 80
SECTION 5 ‐ COUNCIL’S ACTION PLAN 89 Council’s Response 90 Guide to Significant Activities 91 The Link Between Council Activities and Community Outcome Themes 93 Governance and Strategic Direction 95 Environmental Services 105 Recreation and Heritage 114 Amenity Services 133 Transport Management 146 Stormwater 161 Water Treatment and Supply 172 Wastewater Treatment and Disposal 184 Support Services 193

10 Waipa District Council
SECTION 6 ‐ FINANCIAL PLANNING 199 Introduction 200 Prospective Statement of Financial Performance 202 Prospective Statement of Changes in Equity 203 Prospective Statement of Financial Position 204 Prospective Cash Flow Statement 205 Statement of Cost of Services 206 Statement of Borrowing 207 Statement of Accounting Policies 208 Significant Forecasting Assumptions 218 Capital Expenditure Programme 222 Projects Considered but not Funded 223
SECTION 7 – POLICIES AND PLANS 225 LGA Required Policies and Plans 226 Significance Policy 227 Revenue and Financing Policy 230 Funding Impact Statement 247 Rates Breakdown – Indicator Properties 257 Treasury Management Policy 259 Development Contribution Policy 268 Policy on Private Sector Partnerships 318 Policy on the Remission and Postponement of Rates 322 Policy on the Remission and Postponement of Rates on Māori Freehold Land 326 Waste Management Plan 329 Assessment of Water and Sanitary Services 332
SECTION 8 ‐ COUNCIL CONTROLLED ORGANISATIONS 335 SECTION 9 ‐ ORGANISATIONAL SNAPSHOT 341
Introduction 342 Your Councillors 343 Elected Members 344 Opportunities for Community Involvement in Council Decision‐Making 345 Māori Involvement in Decision‐Making 346 Council Committees 347 Community Boards 352 Management Structure 354
GLOSSARY 355 APPENDIX 361
Future Proof 362 Proposed Disposal of Endowment Land 366 Changes Made From the Draft 10‐year Plan 367 List of Submitters to the Draft 10‐year Plan 370 Auditor’s Report 377

10‐year Plan (2009‐19) 11
Section 2 – INTRODUCTION
In this section: What is the 10‐year Plan? Sections in the 10‐year Plan About Waipa District – Home
of Champions Challenges for Council Proposals Financial Overview and
Strategy Assumptions

12 Waipa District Council
What is the 10‐year Plan?
The 10‐year Plan is Council’s major planning and decision‐making document for the future of Waipa District. It describes what Council is going to do, when it is going to be done and how much it is going to cost. The Plan is a focus document for promoting the wellbeing of the community, ensuring that Council is meeting the needs of the community and advancing the achievement of community outcomes. Council must ensure resources are used in a sustainable manner, that means taking into account the needs of the present while not making it harder for future generations to meet their needs. Affordability must also be a given consideration. Sustainability, affordability and wellbeing must be balanced and there will be occasions where Council is faced with making decisions to promote certain aspects of wellbeing where those decisions may have a significant negative effect elsewhere. These details are included in the 10‐year Plan for the community to consider. The Plan covers a 10 year period and is reviewed and republished every three years. In the interim years, Council produces an Annual Plan which is based on information from the 10‐year Plan. Each year Council publishes an Annual Report which documents its financial position and an overview of the progress made during the year against the plan for that year The diagram below shows the relationship between the three documents/processes. Council’s 10‐year Plan 2006‐16 outlines the services, activities and projects Council intended to provide from 1 July 2006 to 30 June 2016. The 10‐year Plan 2009‐19 reviews and updates the projections contained within the previous plan. It also contains detail regarding the significant activities and the financial implications of what is proposed to be undertaken by Council for the period 1 July 2009 to 30 June 2019. The 2010/11 Annual Plan will be based on the second year of this Plan.
10‐YEAR PLAN
(every three years)
Shows projects and programmes and how they relate to community
outcomes
ANNUAL REPORT ANNUAL PLAN
(every year)
Shows how actual activities line up with what was proposed
(each year between the 10‐year Plan)
Shows changes for years 2 and 3 of the 10‐year Plan

10‐year Plan (2009‐19) 13
Preparation of the 10‐year Plan – Community Input Since 2006 there have been a number of opportunities for community input in the development of this 10‐year Plan, including Levels of Service and Community Outcomes review workshops, the Heart of Te Awamutu open day and Annual Plan 2008/09 open days. The information provided has been used in the development of various sections of this Plan and in Council’s decision‐making. Specific community consultation for the 10‐year Plan 2009‐19 began in October 2008 with three ‘Shaping Waipa’ open days. The purpose of these open days was to enable our communities to find out about the opportunities and challenges facing the District, and to provide information about the 10‐year Plan, Waipa 2050 and FutureProof projects. It is important that residents are involved with Council decision‐making and direction setting and for Council to clearly align activities and services with community expectations. In order to facilitate this community involvement in decision‐making Council’s consultation on the draft 10‐year Plan included open days and a series of public meetings. More than 630 submissions were received and considered by Council. The provisions of this Plan reflects community input received during the consultation process.

14 Waipa District Council
Sections in the 10‐year Plan
The 10‐year Plan contains a number of sections, an overview of these is provided below. Section 1: Preface This section welcomes you to the Plan and contains a foreword by the Mayor and Chief Executive that establishes the context for the 10‐year Plan. It highlights the challenges, opportunities, key projects and programmes and sets out the expected rating levels for 2009/10. Section 2: Introduction This section introduces Waipa District, providing an overview of what makes it the home of champions. A summary of the key initiatives for 2009‐19 are included as matters of particular interest to the public, having been finalised as a result of the consultation process. The section also sets out Council’s financial strategy, providing an overview of the financial issues and the expected expenditure (capital and operating) and borrowing levels, along with details of changes made to Local Government Act 2002 required policies. Section 3: Community Vision Community outcomes represent the long‐term aspirations of the community and provide a focus for Council in determining what activities, services and projects will be undertaken over the next ten years. Council is required to take a lead role in reporting progress on the achievement of community outcomes, details of the monitoring and reporting process are outlined in this section. The community outcomes identified at Waikato regional level and those specific to Waipa District’s Iwi authorities are also presented. Council works with a number of organisations to achieve the community outcomes and this is discussed in this section, along with some of the issues identified during recent consultation and key projects that can help address those issues. Section 4: Council’s Response This section details the issues considered when preparing this 10‐year Plan. Details of the key achievements since the adoption of the 10‐year Plan 2006‐16 are provided. Also included is a summary of the key findings of the 2008 State of Waipa District report and a summary of the key results from the 2008 (NRB) Community Satisfaction Survey.

10‐year Plan (2009‐19) 15
The link between Waipa’s community outcomes, issues such as the current economic environment, rising costs, affordability, growth and Council’s strategic planning are highlighted. These provide a context for Council’s activities, services and overall decision‐making processes. The highlights of Council’s planned activities for the next 10 years and the key issues on which feedback is sought are outlined for consideration. Section 5: Council’s Action Plan Council’s activities and services form a large part of the response to achieving the community vision. This section sets out nine significant activities that cover all of Council’s activities – Governance and Strategic Direction, Environmental Services, Recreation and Heritage, Amenity Services, Transport Management, Stormwater, Water Treatment and Supply, Wastewater Treatment and Disposal, and Support Services. For each of these significant activities, the following information is provided:
▪ The activities that make up each significant activity ▪ The community outcomes to which the activity contributes ▪ The key projects expected to be undertaken over the 10‐year period ▪ The levels of service to be provided, the progress Council intends to make and the
measures that Council will use to assess performance and progress ▪ The operating and capital cost, funding forecasts and cost of services for the activity
Section 6: Financial Planning This section provides the financial statements that Council will be operating under for the 10 year period, 2009‐19. It includes the key financial assumptions on which the 10‐year Plan is based, a summary of the capital expenditure programme and a list of projects considered but not included. Section 7: Policies and Plans The Local Government Act 2002 requires certain policies to be included in a 10‐year plan. Council has made some changes to these policies, a summary of which is included in Section 2. A Funding Impact Statement and the impacts of the proposed activities on the 2009/10 rate levels for a range of indicator properties are included. Council’s policy is to seek development contributions (as per the Local Government Act 2002) to support funding of growth‐related infrastructure. Council has recently reviewed this Policy and this is included in this section. Council is also required to include summaries of its Waste Management Plan and the Assessments of Water and Sanitary Services. Section 8: Council Controlled Organisations A Council Controlled Organisation (CCO) is an organisation which a council (or councils) has 50% or more of the shareholding or appoints 50% or more of the members of the company. Council has direct involvement (shares) in three such organisations – Waikato Regional Airport Limited, Local Authority Shared Services Limited, and New Zealand Local Government Insurance Corporation.

16 Waipa District Council
The nature of each organisation, its activities and the key performance targets are outlined in this section. Section 9: Organisational Snapshot This section contains information about the elected members and the political structures within the District. It also provides an overview of the management structure within Council, how people can participate in Council decision‐making, and an outline of how Council supports and promotes Māori involvement in decision‐making.

10‐year Plan (2009‐19) 17
Map of Waipa District
18 Waipa District Council
Waipa District – Home of Champions
Details of the attributes – our community, heritage, environment, sport and recreation, and our economy – that contribute towards Waipa District being the home of champions are outlined here. Our Community Waipa District is predominantly rural, lying at the heart of the Waikato Region. Situated between Waikato District to the north and Otorohanga District to the south, Waipa covers an area of 147,019ha. Other neighbours include the Waikato, Matamata‐Piako and South Waikato districts.
▪ Since 2001 the population of Waipa District has increased by 9.1% (from 40,293 to 42,501)1, and growth is expected to continue at a rate of approximately 1.8% per year.
▪ Te Awamutu (and Kihikihi) has a population of 11,736 (as at 2006). ▪ Cambridge has a population of 13,310 (as at 2006). ▪ Waipa District accounts for 1.1% of the population of New Zealand. ▪ There is an older population in our District as compared with the New Zealand average
(Waipa’s median age is 37.5, compared with 35.9 for New Zealand). ▪ 79.9% of people in Waipa are European, compared with 67.6% for the whole of New
Zealand and 13.1% are Māori, compared with 14.6% for New Zealand. ▪ For people in Waipa aged 15 years and over, the median income is $26,500, compared with
the New Zealand median of $24,400. ▪ The unemployment rate in Waipa is lower than New Zealand as a whole (3.4% in 2006
compared with 5.1% for New Zealand). Our Heritage Waipa District has a rich history, containing Māori tradition and early European settlement. Key dates and features include:
▪ Tainui first settled in the Waikato area as early as the 15th Century, with the mighty Waikato River being a major factor influencing settlement patterns.
▪ The 180km Waipa River was an important waterway for Māori encouraging settlement in numerous pa sites and servicing extensive kumara gardens along the river flats.
▪ In the early 1800s a huge battle (Hingakaka) occurred between rival Māori tribes near Te Awamutu at Ngaroto, with up to 10,000 warriors involved. Another important pre‐European battle occurred at Taumataiwiwi.
▪ In 1856 the assembled chiefs of the region offered Te Wherowhero the title of Te Arikinui – Chief of Chiefs. Tainui accepted the honour and responsibility and in 1858 Te Wherowhero was crowned Kingi Potatau, the first Māori King. From then, in direct line, the descent continues to the present Māori King. Kingitanga is a symbolic bond that links Tainui together.
1 This information is from the 2006 Census, Statistics New Zealand, Quick Stats about Waipa District. http://www.stats.govt.nz/census/census‐outputs/quickstats/aboutAPlace.htm

10‐year Plan (2009‐19) 19
▪ Agricultural development occurred from the early 1800s in the Te Awamutu area. European farming practice began being employed from the 1840s including the establishment of flourmills and permanent buildings being erected.
▪ The first churches were established in the District in the 1840‐50s, including the Otawhao Mission Station, St Johns Church (1854) and St Paul’s Church (1856).
▪ In the 1860's the Tainui people were self sufficient and flourishing in trade and production of food. During the latter part of this period, Te Wherowhero emerged as the paramount chief of the Tainui people establishing his own system of internal self government.
▪ Waipa District and the surrounding area was a focal point for the Waikato Land Wars, with many significant battles taking place here (including a major battle at Orakau).
▪ In 1864 military headquarters were established at Camp Cambridge, named after Queen Victoria’s first cousin, the Duke of Cambridge, which later became the town of Cambridge.
▪ A frontier post, first named Alexandra (now named Pirongia) was surveyed in 1864 after the Waikato Land Wars and was settled by soldiers of the 2nd Waikato Militia Regiment. The Alexandra Redoubt in Pirongia, built in 1868, is the best preserved surviving fortification of this type in New Zealand.
▪ Rail links were established between Auckland and Ohaupo in 1878 and between Te Awamutu and Taumarunui in 1903, opening up the area and leading to a rapid increase in population and wealth in the District.
▪ Cambridge and Te Awamutu have excellent museums that house the historical artefacts of the District and the Pirongia Historic Visitor’s Centre provides a wealth of information about Pirongia district.
Our Environment Waipa District has many unique environmental features, including the following:
▪ A variety of outstanding landscapes ▪ A high concentration of fertile soils, plentiful water and a temperate climate, making the
District well suited to agriculture and horticulture ▪ A number of significant natural features, such as unique peat lakes, indigenous forest,
wildlife habitats and recreational hydro‐lakes. The latter includes Lake Karapiro, an internationally recognised aquatic sports venue and Lake Arapuni
▪ The Kakepuku, Pirongia and Maungatautari mountains ▪ The Waikato and Waipa rivers ▪ The Maungatautari Ecological Island Project, described as Australasia’s largest inland
ecological island, which was established to remove pests and restore the mountain’s native ecology.
Sport and Recreation Waipa District is home base for many national and international sports through the provision of sports venues and facilities. There are also numerous passive and active recreational spaces for the community throughout the District and with 84ha of open space per 1,000 residents (including Maungatautari Mountain) compared with the New Zealand average of 27.1ha per 1,000.
▪ The District is a training base for many sports including rowing, cycling and equine, and a number of Olympic and other champions are based in the area.
▪ Te Awamutu’s outdoor sports stadium incorporates a cycling velodrome and athletic facilities.

20 Waipa District Council
▪ Events such as national and international basketball and netball tournaments, car shows, caged bird shows, gymnastic competitions, concerts and dinners are held at the Trust Waikato Te Awamutu Events Centre. The centre also provides year‐round swimming and gym facilities.
▪ Cambridge is encircled by a wide green belt of about 300ha that houses a diverse range of sporting clubs including BMX and motocross, rugby, soccer, athletics, polo and riding groups, horse racing (harness).
▪ Te Awamutu has established rugby, soccer, netball, bowls, cricket, croquet and racquet clubs along with polo and speedway at nearby Kihikihi. Walks around peat lakes and Kahikatea forests are easily accessible.
▪ Lake Karapiro has hosted national and international events, including rowing, waka ama (outrigger canoe racing) and GP Hydroplane racing while also providing for local yachting and water skiing events.
▪ There are opportunities for casual walking, with established heritage trails in both Te Awamutu and Cambridge, and tracks around Lake Te Ko Utu, Lake Cameron and Lake Ngaroto, one‐day walks are available on Mount Kakepuku and Maungatautari and overnight tramping and camping on Mount Pirongia. Some rivers, streams and hydro‐lakes offer opportunities for recreational fishing, swimming and picnicking.
▪ The Cambridge area is world renowned for its thoroughbred studs and the Cambridge Trotting Club provides one of the best day/night trotting club venues in the country.
▪ Golf is very well catered for with courses at Te Awamutu, Cambridge, Lochiel, Pirongia, Stuart Alexander and Ngahinapouri.
Hydroplanes being prepared for racing on Lake Karapiro

10‐year Plan (2009‐19) 21
Our Economy The rural aspect of Waipa District and the abundance of high quality soils have, to a large extent, shaped the District’s economy. However, new industries are emerging and are contributing to growth in the District.
▪ The economy of the District is largely based on agriculture, and, in particular, the grazing of high quality pasture.
▪ Dairying is a major activity, but we also have significant numbers of beef cattle, sheep and deer. There are two major dairy factories in the District, one in Te Awamutu and one in Hautapu (north of Cambridge).
▪ Horticulture is also prominent within the District, with the likes of asparagus, blueberries and strawberries being grown.
▪ Cambridge is recognised as the centre of New Zealand’s bloodstock industry. This creates demand for the specialist skills needed to support this industry.
▪ The internationally renowned New Zealand National Agricultural Fieldays, held at Mystery Creek, is held annually and attracts visitors from throughout New Zealand and overseas.
▪ Hamilton International Airport is located within Waipa District, close to the boundary with Hamilton City. The Airport contributes not only to the economy of Waipa District, but also to that of the Waikato Region. Airport Development Plans, including Titanium Park, will further enhance the Airport’s economic contribution to the District and region.
▪ The importance of the tourism industry is recognised with Council’s support of the two I‐Site Centres within the District. Council also supports a wide range of events from the District Promotion Fund.
▪ Building statistics for the year ended March 2008 showed that permits were issued for 411 new dwellings with a value of $117.9 million, which means more than one new dwelling is being constructed in the District every day of the year.
▪ The total value of all building consents issued in 2007/08 was $154 million, which is $3 million a week being spent on building work in Waipa District.
Looking down on the Fieldays at Mystery Creek

22 Waipa District Council
Challenges for Council – Overview
The current economic conditions reinforce the importance of Council taking a sustainable approach to its activities and services. Consideration of how best to do this has part of the consultation with the community through the 10‐year Plan process. Council is required to balance the often competing interests and expectations of residents and stakeholder groups and to do so in a way that is affordable. Council wants to ensure that its actions achieve the best possible outcome for the District, so that the decisions taken now provide the expected benefits in years to come. Council strives to be sustainable in the way it operates, by using resources efficiently and finding more cost‐effective ways of doing things. Council faces a number of challenges when considering the activities and plans proposed for the next 10 years. These are summarised below and set out in more detail in Section 4. Climate Change This is a global issue and New Zealand’s response is being driven by central government. Research indicates that climate change impacts will be variable between and within regions, and Council has regard to possible impacts, including costs, in its future planning. While these impacts are not considered significant over the next 10 years, Council is taking account of likely impacts through its long term infrastructure planning. In addition, mitigation measures, such as reviewing flood hazard areas, will be undertaken as part of the District Plan review process. Managing Growth Recent growth within the District has been at or above the national average and this trend is expected to continue as Waipa’s central location and quality of life attributes make it an attractive place to live. This growth, while providing benefits such as increased local investment and additional rateable properties, places pressure on existing infrastructure and our environment, so our long term planning for growth needs to take account of these pressures to ensure it is both appropriate and well located for maximum benefit and to retain the special character of our District. Council acknowledges that growth needs to be proactively managed and is undertaking Waipa 2050 – a comprehensive planning initiative which includes a growth strategy for the District, development blueprints for major urban areas and a review of the District Plan. Community Expectations and the Focus on Core Infrastructure Waipa residents have high expectations when it comes to the standard and quality of facilities and services provided by Council. In recent years, Council has responded to community desires and introduced a number of new services, all of which have added to rating levels. Affordability issues mean that Council must ensure funding for the maintenance of essential infrastructure (such as water, wastewater and roads) is not compromised by a desire to further develop community facilities. Council, through this 10‐year Plan, intends to maintain a strong focus on core infrastructure, with ‘nice to have’ projects being advanced only as priorities and funding allows.

10‐year Plan (2009‐19) 23
Legislative Change and Compliance In recent years there have been major changes to the legislative environment within which Council operates. Such changes are driven by central Government, and invariably impose additional requirements and cost on Council. There is often limited ability for Council to fund such requirements from sources other than rates. Some of these requirements, such as increased public health and environmental standards, are seen as positive actions, yet the investment required is usually significant, for which residents receive little in the way of an improved service. Natural and Cultural Heritage Significant landscapes, lakes, waterways, native forests and our cultural heritage are important considerations for Waipa District and they remain under threat because of development pressures and ignorance. Council promotes the protection and enhancement of these features and they contribute to making Waipa District a special place. In advancing heritage activities, Council will continue to work with community groups and other agencies to achieve the greatest benefits from the limited resources available. Community Partnerships Achievement of the Waipa community outcomes is a responsibility for all. Council has a lead role, but it is only one of many local, regional and national groups and agencies whose work makes a positive local contribution. The pressure on resources is increasing, so doing more with the available funding is essential and Council is proactively strengthening existing partnerships and establishing new ones. Cost Pressures Council, like all businesses, households and organisations, is subject to the effects of inflation and has been improving efficiency, through initiatives such as bulk purchasing arrangements, to help offset this impact. However, unlike most businesses, there are areas of Council’s operation where increases in the cost of energy, materials and contract services combine to be significantly higher than the general rate of inflation. In areas of infrastructure management the cost of some materials and services has increased by more than 40% over the past three years. Containing these costs is difficult because the standard of service is at risk. While Council’s approach through this 10‐year Plan is to defer non‐essential work, this is done acknowledging an increased risk of service interruption. Council is also mindful of not under‐funding maintenance unnecessarily, which could create a significant problem for the future. These risks are being managed through asset management programmes and financial strategies. Revaluation of Assets – Depreciation Levels Council uses depreciation to partially fund the future replacement of assets and the funding of depreciation is through rates. The level of depreciation is linked to the value of the assets and Council has, in the past, revalued assets on a 3‐yearly cycle. The revaluation cycle will be spread across each of the coming 10 years, with one class of assets being revalued each year. This will also have the effect of spreading the depreciation impact on an annual basis, and thereby smoothing rating increases. A revaluation of roading assets is underway in 2008/09 with the increased depreciation representing a 2% rate increase for 2009/10.

24 Waipa District Council
Key Initiatives – Overview
This Plan covers all of the activities, programmes and projects Council intends to undertake over the next 10 years. In finalising the Plan Council was mindful of the need to strike the right balance in terms of affordability, maintaining existing infrastructure/essential services and developing new community facilities and services. In making these decisions Council was guided by community feedback. As part of the draft 10‐year Plan consultation process Council sought feedback on six key proposals:
▪ Cambridge Community Pool ▪ Heritage and Cultural Centre (Te Awamutu)2 ▪ Public Transport (Cambridge and Te Awamutu Bus Services) ▪ Seal Extensions ▪ Maungatautari Ecological Island Project ▪ Waste Management – Council Policy and the Cambridge Refuse Transfer Station
Council has considered the community feedback, and the decisions made in relation to each proposal are outlined below. Also provided in this section are summaries of the changes made to key policies, levels of service, risks, Council’s intentions regarding endowment land, and changes made to projects. Projects Cambridge Community Pool A heated covered swimming pool for Cambridge was a key inclusion in the 10‐year Plan 2006‐16, reflecting Council’s commitment to meeting the expectations of a growing Cambridge community. A concept design for constructing a new facility on the existing Williamson Street site has been completed with a projected cost of $15.1 million ($1.1 million of which is inflation). The funding of this project will be from borrowing, community fundraising and sales of property owned by Council. The design, which is currently being completed, is based on the new pool facility being constructed within the general footprint of the existing 50 metre outdoor pool, which will be demolished. The facility is to provide a 25 metre x 8 lane fitness pool, leisure/therapy pool, learn to swim water space and toddler/babies area. The new facility will enhance the indoor‐outdoor connection that is a key advantage of the Williamson Street site. Council has decided to retain the project in the 10‐year Plan but delay the start of construction until 2012/13. In making this decision Council was concerned about the low level of community ownership of the project and the ability for the community to raise funding given the current economic conditions. 2 The proposal was referred to as ‘Cultural Centre (Te Awamutu)’ in the draft 10‐year Plan and Summary.

10‐year Plan (2009‐19) 25
The adjusted timing of project provides an opportunity for the community to refocus on the project and allow further review of the project as part of the development of the 2012‐22 10‐year Plan. Council has retained the requirement for the community to raise a third of the total funding and that a minimum of 75% of the community funding must be secured before Council will give its final approval for construction of the new facility. Heritage and Cultural Centre (Te Awamutu) A key project within the Heart of Te Awamutu initiative is a heritage and cultural centre which this Plan proposes will commence in 2013 (completed in 2016) at a projected cost of $14.2 million. It is expected that at least a third of the cost of building the facility will be funded externally from Council through the likes of donations and other community fundraising activities. A proportion of the project cost (approximately one‐third) is expected to be funded by rates. Based on initial thinking the Centre is expected to showcase local art and cultural activities and the District’s rich heritage. It would replace the existing Te Awamutu Museum and may provide facilities for performing and visual arts. Council envisages that the Centre will be of a standard that reflects the significance of local heritage, providing an outstanding interactive experience for visitors and establish Te Awamutu as a visitor destination – a facility that all residents will get great benefit from and be proud of. Council decided to retain the project in the 10‐year Plan on the basis that the timing provides the opportunity for the community to take ownership of it. Council will make a final decision on the project as part of the development of the 2012‐22 10‐year Plan. As this is a preliminary proposal a feasibility/scoping study will be undertaken to develop a concept design (based on the likely activities of the Centre) and identify how the project could be funded. This process will involve working with stakeholders groups, and Council has made funding ($40,000) available to support this work. The Te Awamutu Library is currently operating below the New Zealand library standard regarding floor space, having only 26% of the suggested requirement3. Proceeding with a Heritage and Cultural Centre would provide opportunities for the Library to be included in the new Centre or allow it to expand into the existing Te Awamutu Museum space. Public Transport (Cambridge and Te Awamutu Bus Services) In 2008 Council conducted a review of passenger transport services for the District in conjunction with Environment Waikato. The review, which was prompted by the impending re‐tendering of the Cambridge‐Hamilton service, showed that there is demand for a higher level of service than is currently provided. Based on community feedback Council has confirmed the introduction of an improved service between Te Awamutu/Kihikihi and Hamilton, and Cambridge and Hamilton, with these being integrated with the Hamilton City services and managed by Environment Waikato. These will be subsidised services, with Council funding 25% of the costs remaining after fares are deducted. The New Zealand Transport Agency will fund 50% of the remaining costs and Environment Waikato 25% (via the Hamilton City Passenger Transport Rate). The cost of Council’s share of the total estimated funding requirements is $115,000 per annum. 3 The percentage is calculated as at 2008 and is based on half of the total District population (44,321) being served by the Te Awamutu Library.

26 Waipa District Council
While the proposed increase in the level of service accounts for part of the cost, the minimum standard for contracted bus services has increased and this makes up the balance. New services are expected to commence towards the end of 2009. Seal Extensions Council administers 1,058kms of roads, of which approximately 985kms are currently sealed. Approximately 32kms of the roads currently not sealed are considered inappropriate for sealing because of the high costs (including initial capital cost and ongoing maintenance costs), leaving 41kms that can be sealed. This Plan confirms a seal extension programme of $7.1 million over the 10 year period, although no funding is signalled in 2009/10. The approved level of funding will allow at least a further 18kms of road to be sealed over the 10‐year period. The proposed level of funding reflects a long‐standing community expectation that Council will continue to advance seal extensions across the District. Seal extensions are not eligible for government subsidy. However, around 50% of the initial capital cost of the proposed 10‐year programme is expected to be met by development contributions. The remainder will be funded by rates. Maungatautari Ecological Island Project Council is responsible, by way of agreement with the Department of Conservation, for the management of the Maungatautari Scenic Reserve. The Maungatautari Ecological Island project has seen the scenic reserve and forested private land enclosed within a mammalian pest‐proof perimeter fence, constructed by the Maungatautari Ecological Island Trust (MEIT). Council recognises the significant value of this project in terms of improving the environmental and economic wellbeing of the District and is committed to working with MEIT, Environment Waikato (EW) and the Department of Conservation (DoC) to maximise the value of this initiative. To maintain the integrity of the project approximately $1 million per annum is required, and Council is working with the Trust, EW and DoC to secure this level of funding. Council has confirmed funding of $300,000 per year in this Plan, which will be funded across the District. Waste Management – Recycling, Council Policy and the Cambridge Refuse Transfer Station The new Waste Minimisation Act has recently been passed into law. The Act introduces a range of new requirements aimed at achieving waste reduction in line with the Government’s waste strategy. Provisions include producer responsibilities and the introduction of waste levies. The impacts of these new provisions are being assessed and revenue from waste levies (in the order of $130,000 per annum) is expected. This revenue must be directed to waste minimisation initiatives as signalled in Council’s Waste Management Plan. The Plan, which details a range of waste minimisation initiatives, is due for review before June 2010, this is within the period required by the new Act. Current economic conditions have meant that prices received for some recycled materials have dropped significantly and they are not expected to increase in 2009. Council recognises the cost pressure this places on Smart Environmental Limited (who Council contracts to provide the recycling service) and will work with the company to ensure continuation of this well‐supported service.

10‐year Plan (2009‐19) 27
Retaining the same level of service (frequency and materials collected) is likely to result in an increase in cost, although the amount is not yet known. Any increase could be funded by raising the level of the recycling rate and/or offset by increases using revenue from the waste levy. The Cambridge Transfer Station is privately owned and operated by EnviroWaste, who have advised that the facility is not commercially viable because of low levels of public use. EnviroWaste have advised that the facility will close for public use unless Council provides financial support. Having regard to the level of community support for maintaining public access to the facility, Council has confirmed it will provide funding to EnviroWaste. The cost of this arrangement is $28,000 per annum and adds $3.74 per annum to rates for properties in the Cambridge and Maungatautari wards. In making this decision Council acknowledges that it is inconsistent with the current policy of not rating for and providing refuse collection and disposal services. This policy, which is set out in Council’s Waste Management Plan, is based on the private sector being able to cost‐effectively provide basic waste management services to residents of Waipa District. The Waste Management Plan is scheduled to be reviewed in 2010, and the funding for the Cambridge Transfer Station will be reconsidered as part of the review process. Levels of Service In early 2008, Council conducted a review of its levels of service through a public consultation process. For some services, such as Transport Management (pavement smoothing), Street Lighting, Libraries and Wastewater Treatment (odour control), the target previously set is well in excess of the level of achievement. The cost of achieving these levels of service in a few years is prohibitive. In some cases, such as the Te Awamutu Library, this Plan includes provision for increasing the level of service through a one‐off project. In other cases, such as Street Lighting, new and targeted upgrading works will achieve the standard required, but funding constraints limit Council’s ability to implement a comprehensive enhancement programme. In light of these constraints, Council has confirmed revised levels of service and targets in Section 5 of this Plan. These revised levels of service are not expected to significantly impact on the community. However, Council will continue to monitor the level of achievement, having particular regard to community satisfaction and use this information to review and set future levels of service. Risks Outlined in this section are details of the risks that Council has identified and considers important for the community to be aware of. Infrastructure Risks In developing this Plan it has been necessary to balance an acceptable level of risk around the maintenance and renewal of existing key infrastructure and the need to provide for growth and provide an appropriate level of community facilities.

28 Waipa District Council
Council has considered the following risks and believes that the Plan is an appropriate response to them given the current economic climate. It is important, however, that the community is aware of these risks. Water Supply and Treatment The risks to effective, efficient and safe delivery of drinking water to the District include:
Management of increases in demand for water as a result of growth and unrestricted use Aging pipelines Response to increasing statutory compliance requirements
The Plan has allowed some additional funding to deal with aging pipelines, however, this will only maintain the current life expectancy of the pipes. The pattern of growth in the District to date places significant stresses on the infrastructure and will require an extensive renewal programme over the next 20 years. The risks associated with water supply and treatment will increase unless the level of demand can be managed at an appropriate level and there is an initiative proposed to achieve this. Wastewater Treatment and Disposal The risks around wastewater are considered to be moderate. The key risks are:
Stricter enforcement of discharges to the environment Reduced public acceptance of wastewater related overflows and odours Aging pipelines and other infrastructure High costs of servicing newer growth areas
There is no direct provision for the reduction of overflow or odour incidents in the Plan. However, an increased provision has been made for pipe renewals which should assist in controlling overflows by reducing groundwater infiltration to the network. The Plan includes a proposed major upgrade of the Cambridge wastewater treatment plant to ensure compliance with resource consent conditions. Stormwater There is an ongoing moderate level of risk in the operational delivery of stormwater services. The level of planned expenditure limits resourcing to managing the highest priority areas only, which may result in an increase in surface flooding events. There is also no provision for major stormwater pipeline failures. Projects – Review of Capital Works Programme In finalising this Plan Council has had regard to the projects signalled in the 2006‐16 10‐year Plan, as well as new projects and initiatives identified in the meantime. In light of changing circumstances Council is signalling a new capital works programme in this Plan.

10‐year Plan (2009‐19) 29
These changes are the result of new infrastructure priorities, the need to provide for growth, limited funding and changed project scope. Whilst there are various funding sources available to fund the increased capital expenditure, a significant portion of the additional costs will be funded from increased borrowing. The list below provides an outline of the changes made to develop the proposed 10‐year capital works programme. Projects signalled in the 2006‐16 10‐year Plan, but not included in this Plan:
New Cambridge Museum Upgrade to the Te Rore Water Scheme Water Main extension to Maungakawa Wastewater – removal of bio‐solids Kihikihi Water Supply – new third bore
New projects that have been included in this 10‐year Plan:
Hautapu Industrial Growth Cell ‐ growth Bond Road Plan Change – growth Picquet Hill Plan Change – growth Cambridge Bypass Interchange
Projects that have significantly changed from what was outlined in the 2006‐16 Plan:
New Cultural Centre and Te Awamutu Library Cambridge Town Pool Development (now referred to as Cambridge Community Pool) New Reserve Development at Lake Karapiro (Geck Property) Roading Safety Improvements Pavement Rehabilitation Reseals Seal Extensions Cambridge Deferred Residential area ‐ growth Develop New Water Source for Te Awamutu Water Main – Taylor’s Hill to Dairy Factory Cambridge Wastewater Treatment Plant Upgrade
Projects that have been considered but not included in either the 2006‐16 or 2009‐19 Plans due to a lack of funding:
Footpath Improvements (new footpath construction) Western Arterial Land Purchases Leamington‐Karapiro Cycleway Cycling and Walking capital works initiatives as per Council’s Cycling and Walking Strategy District Wide Water Metering Cambridge Town Hall Refurbishment Streetlight Upgrades District Wide Pump Station Emergency Storage Upgrades District Wide Odour Removal (Wastewater)
A project listed above could be advanced if an additional source of funding is secured.

30 Waipa District Council
Changes to Policies Council is required to include specific policies in its 10‐year Plan and full copies of these are provided in Section 7. Most of these policies remain largely unchanged from the 2006‐16 10‐year Plan. Below is a brief summary of the changes that have been made. Significance Policy This Policy is considered to work well and only one change was made –the significance threshold for capital expenditure has increased from $3 million to $5 million or 15% of the annual capital expenditure budget whichever is the greater. The change was considered to be appropriate as it updates the Policy to take account of inflation since 2003 when the previous policy was developed. Development Contributions The existing Development Contributions Policy has been reviewed to ensure developers meet the actual costs Council incurs to provide growth related infrastructure. This is achieved by ensuring the level of contributions include inflation and align with the proposed capital works programme. In addition to amending the contribution fees and associated methodology, there have also been amendments made to the text within the Policy which will aid in the interpretation and administration of it. The table below compares the fees from the 2006 Development Contribution Policy and the new fees, the principle reasons for the amendment are also provided.
Catchment 2006 Fee (Current)
Proposed 2009 Fee
Reasons for change
Te Awamutu $23,864 $23,200 Water:
Major spending on new water source not yet confirmed
Reticulation growth
Stormwater:
Reduced expenditure due to greater use of detention/retention structures within developments
Wastewater:
Reticulation growth expenditure now charged over large number of growth HEUs
Kihikihi $21,596 $24,891 Inflation
Picquet Hill ‐ $33,104 New catchment requiring significant growth works to service greenfields development
Pirongia $16,998 $20,345 Inflation
Bond Road ‐ $25.65/m2 New catchment requiring significant growth works to service greenfields development
Cambridge/ Karapiro
$16,790 $27,250 Water:
New works are required due to growth in Cambridge North and Hautapu industrial area

10‐year Plan (2009‐19) 31
Wastewater:
Increased costs of treatment plant upgrade
Stormwater:
Reduced expenditure due to greater use of detention and retention structures within developments
Cambridge North
$19,283 $46,306 The 2006 development contribution underestimated the cost of servicing demand
Stormwater:
Inclusion of land cost for swale construction has increased the contribution required
Rural $11,340 $15,946 Inflation
Maungakawa $23,340 ‐
Ohaupo $11,340 ‐
Development contributions have been taken out of the Policy as the works proposed in the 2006 10‐year Plan are no longer being completed within the term of this 10‐year Plan.
Treasury Management Policy The Treasury Management Policy, which incorporates the Liability Management and Investment Policies, was reviewed to ensure it met current and future requirements. As a result, two changes were made – the per capita borrowing limit was removed and the gross interest expense not exceed 15% of annual rates and fees and charges revenue. Revenue and Financing Policy Following the review of this Policy, a number of changes were made, including:
▪ New rates have been introduced for the Cambridge Community Pool (year 2013/14), and Cambridge Community Sports Hall.
▪ Operating projects in the Support activity which span more than one year may be funded by borrowing, for example the review of the District Plan
▪ The general rate subsidy has been removed. ▪ Beneficiaries and funding tables show a range of rates rather than absolute percentages. ▪ A new category for the Support activity has been introduced. ▪ District wide funding is made up of general and ward rates, the proportions of these rates
may be adjusted to meet Council’s funding and social objectives. Policy on the Remission and Postponement of Rates A change was made to this Policy allowing Council to partially remit the sewerage charge for not for profit organisations where the number of toilets installed exceeds the number required under the building code.
32 Waipa District Council
Sale of Endowment Land Council intends to dispose of endowment land within the District that is surplus to requirements. These are properties that have been vested in Council ownership over time. The proceeds of these sales will be reinvested, including the development of community facilities that will provide a long term benefit to the Waipa community, such as the Cambridge Community Pool, new Lake Karapiro (Geck) Reserve and the Te Awamutu Heritage/Cultural Centre. The properties Council intends to dispose of are listed in Appendix 1 of this Plan, as required by section 141(b) of the Local Government Act 2002. If the purpose a property was vested in Council for, differs from the purpose to which the proceeds of any sale will be put, Council will seek approval from the Minister of Local Government under section 140(4)(a)(ii) of the Act.

10‐year Plan (2009‐19) 33
Financial Overview and Strategy
Budgets have been prepared based on service levels agreed with each activity and are supported by a detailed business planning process. Details of activities’ forecasts can be seen in the significant activities section (Section 5). The planning process has been underway for most of the year and in recent months this has been significantly affected by the global economic crisis that has unfolded. The financial challenges Council is faced with include rising costs and uncertainties around inflation, keeping rates to an affordable level, balancing the management of core business with meeting community objectives, forecasting and managing growth and the general uncertainty around the coming years and the length of the economic downturn. Affordability Council has worked hard to ensure rates are kept at an affordable level for the foreseeable future. Early in the planning for preparing the draft 10‐year Plan it was thought that a range of 5‐7% average rates increase per year may be acceptable to the community. However, with the effects of the economic downturn now being felt, Council has tried to keep the average increase closer to 4%, although this has not been possible in the early years. In year 1 the proposed increase of 5.6% includes a higher level of depreciation arising from a revaluation of assets. In year 2 the proposed increase of 6.9% includes additional costs arising from the Karapiro Domain project. In year 3 and 4 the proposed increases are 6.2% and 5.1%, and year 5 is proposed at 5.5% resulting from the additional costs of operating the new Cambridge Community Pool. All other years are closer to 4%. The following graph shows the forecast average rate increases for existing ratepayers.
0.0%
2.0%
4.0%
6.0%
8.0%
10.0%
09/10 10/11 11/12 12/13 13/14 14/15 15/16 16/17 17/18 18/19
Years
Percentage
Average Rate Increase

34 Waipa District Council
Whilst the average rate increase is quoted, each property will be individually calculated with rates based on property valuations and the specific services provided. Valuation and Rating Properties in the District were revalued in 2008, with the new values taking effect for rating purposes in year 1. These new values will not alter the total rates required, but will have an effect on the rates charged on individual properties. Overall the capital value of the District increased by 40% but this increase was not evenly spread across the District, for example rural property increased by 56%, residential property increased by 26%. These results have the effect of changing the level of rates between property types, with rural properties of high value carrying the highest proportion of rates increase and urban properties a lesser increase. The modelling of rates resulted in rural properties facing an increase of more than 10%, with the urban properties’ increase around 3%. As part of the review of the Revenue and Financing Policy, it was agreed that the proportions of general rates and targeted ward rates would be determined bearing in mind the effect of fixed charges on lower value residential properties, the effect of capital value rates on high capital value rural properties and relativities between rural and urban ratepayers. Council has done this in the past by using what was known as a general rate subsidy. By adjusting the proportion of general and ward rates by a small margin, the impact has been to reduce the rural rates and increase urban rates. Operating Expenditure Operating costs are forecast to increase by $34 million over the 10 year period. Generally these increases will be funded by rates or user charges. Increased costs arise from: Increase to Levels of Service Some service levels have been increased after consultation with the community, but for other services Council has determined not to save money by reducing service levels. This strategy has resulted in a significant challenge to provide services at today’s cost plus a basic inflation rate. Growth of the District The planned growth, while providing benefits such as increased local investment and additional rateable properties, will result in more households in the District and this will increase costs as existing services will be provided to more properties. Inflation – Price Increases Estimated cost has been used to forecast year 1, with inflation applied to the remaining 9 years. Inflation rates vary depending on the type of cost and these rates are shown in the Financial Section. The inflation rates have been developed by Business and Economic Research Limited, with the exception of inflation on staffing costs, which has been based on Council’s own forecast.

10‐year Plan (2009‐19) 35
Higher Depreciation Depreciation increases as new assets are purchased or developed. A three‐yearly revaluation of assets also drives a higher level of depreciation. For the coming 10 years it is planned to spread the revaluation cycle across each year, with one class of asset being revalued each year. This will also have the effect of spreading the depreciation impact on an annual basis, and thereby smoothing rating increases. A revaluation of roading assets is underway in 2008/9 with water, waste water and stormwater assets to be revalued in 2009/10. Land and buildings will be revalued in 2011/12. Higher Interest Costs to Service Increased Borrowing The benefit of borrowing is that assets can be developed earlier using borrowed money. The downside effect of this is that additional assets drive higher costs, such as loan repayments, interest and depreciation, and these costs must be funded by rates and user charges. Capital Expenditure Essential renewal and upgrade works necessary to maintain core infrastructure is determined via a long term planning strategy resulting in asset management plans. These plans take into account the forecast growth of the District and make provision for future capacity requirements from growth. There are also a number of amenity type projects which have arisen from community demand. Council is forecasting $348 million capital over the ten years, with significant capital projects planned for the following ten year period. The initial estimated cost of all types of projects was $500 million and, as a significant amount of this is funded by borrowing, it generated an unacceptable and unaffordable increase in rates to cover the additional loan interest and depreciation. There has therefore been a process of prioritisation using a ranking system with essential core infrastructure being the first priority. The projects included in the forecast can be seen in each significant activity (Section 5), and there is a further schedule in the Financial section (Section 6) showing projects not included. Following consultation with the community, a final decision was made by Council as to which projects would proceed. Funding Section 100 of the Local Government Act requires Council to cover its operating expenses from revenue unless it considers it prudent not to do so. In preparing the 10‐year Plan, there are some instances where Council considers it financially prudent not to fully fund the operating expenses within the year in which they occur and these are shown in the Financial Statements. These include the non funding of infrastructural asset write‐offs and minor amounts of depreciation on community buildings. The total cost of operating and capital is $90 million in year 1, then increasing annually. Council must ensure it has sufficient funds to pay for these and takes the view that, wherever possible, sources other than rates will be found. Funding sources include rates, fees and charges, subsidies, development contributions, loans, vested assets and interest. There is a full explanation of which funding is used for each type of expenditure in the Revenue and Financing Policy (Section 7). Sources of funding are illustrated on the following page.

36 Waipa District Council
Sources of Funds Borrowing Council’s infrastructure and community assets generally have long economic lives and long term benefits. Borrowing to have these assets now and pay for them over time is seen as an appropriate way of spreading cost and promoting intergenerational equity between current and future ratepayers. Where Council has available internal cash reserves, these will be used for its borrowing requirements and this is known as internal borrowing. The interest from internal borrowing is used to offset the rates required from the community, providing a reduction in rates. If there are no available cash reserves, borrowing with the external market will be undertaken. The borrowing referred to in the 10‐year Plan is external borrowing. The Liability Management Policy specifies the borrowing limits that will be applied to control and manage borrowing. Over the 10 years, borrowing is forecast to increase to $89.9 million in year 7 and $78.9 million in year 10, with each year meeting the borrowing limits in the policy. This level of borrowing is significantly higher than in the 2006 10‐year Plan and this is being driven by core infrastructure upgrades, additional projects, increased project scope, higher costs than anticipated in earlier years and the significant growth that the District has undergone in the last few years. Council has a strong balance sheet and the amount of borrowing is not considered to be excessive. The restriction to borrowing is around the additional interest placing an unacceptable burden on ratepayers and the level of interest is controlled by a limit set in the Policy. There is some flexibility within the loan portfolio as it is acknowledged that over time critical projects which had not been planned may crop up. There have not been any contingencies built into the capital forecast but it would be possible to either borrow more or less depending on the needs at the time. Development contributions provide income to support the capital costs of growth. The exact timing of the collection of this income is outside of Council’s control. The forecast borrowing includes a component to borrow funds until the development contributions are received, with the receipt of the cash immediately repaying any loan. Interest costs arising from these loans will be a charge to current ratepayers.
Rates
Development ContributionsSubsidies
Fees & Charges
Vested Assets
Interest Revenue
Loans
Reserves

10‐year Plan (2009‐19) 37
Assumptions
FORECASTING ASSUMPTIONS RISK LEVEL OF UNCERTAINTY
REASON AND FINANCIAL EFFECT OF UNCERTAINTY
Change of Government The newly elected coalition Government has signalled the likelihood of changes in a number of areas of government policy and legislation. The detail of these changes was unknown when the draft 10‐year Plan was prepared, however they could have significant impacts on council operations. The most significant legislative changes already flagged are outlined below:
Resource Management Act: Government has signalled that it will make a number of changes to streamline the Act and the processes that flow from it. Currently there is insufficient information to amend our plans to reflect any required actions.
Changes may require a significant change in the Resource Management functions of Council
Low
Resource Management Act: There is insufficient information to assess the impacts. Potentially the changes could affect a number of Council’s resource management planning processes.
Emissions Trading Scheme: The new Government has signalled its intention to make changes to the proposed scheme or to promote an entirely different policy setting. Currently there is insufficient information to amend our plans to reflect any actions that may be required.
Uncertainty about associated costs and revenues
High Emissions Trading Scheme: The main impact would be on Council’s energy costs and any potential credit that might be received for Council’s forestry plantation.
Societal and Demographical Changes
A number of key demographic changes are anticipated in Waipa District over the next 20 years, for example the proportion of the population aged 65 years and over will increase from 14% in 2006 to 21% in 2021 and 27% in 2031.
Demographic changes may require a change to the services offered by Council and may affect the community’s ability to pay for services
Low This will require Council to monitor its services over time with regard to how this change might affect the nature and level of service it offers. This will occur primarily through community outcomes and level of service review process. However, no changes have been made to Council’s planning at this stage.

38 Waipa District Council
FORECASTING ASSUMPTIONS RISK LEVEL OF UNCERTAINTY
REASON AND FINANCIAL EFFECT OF UNCERTAINTY
Climate Change Council is guided by Ministry for the Environment advice in relation to climate change. This advice notes that the New Zealand climate is already changing and provides a range of projections of possible consequences and policy responses. Council assumes that this advice is appropriate and represents the best planning approach to climate change.
Planning may not have sufficiently taken account of the localised effects of climate change and the consequential impacts on the economic, social, environmental and cultural wellbeing of the community
High Over the next 50 years indications are that Waipa District can expect wetter conditions than present with more intense rainfall events. These predictions have been factored in to long‐term infrastructure planning, although the impacts are not considered significant over the next 10 years. Flood hazard areas will be reviewed as part of the District Plan review that is currently underway. Council will continue to be guided by Ministry for the Environment advice in its response to climate change and is incorporating this into its planning processes, particularly with regard to asset planning and flood protection. Council has joined Communities for Climate Protection (CCP‐NZ) – a community‐based initiative aimed at reducing greenhouse gas emissions locally while achieving economic and social benefits.
Waikato‐Tainui Raupatu Claims (Waikato River) Settlement Bill The Waikato‐Tainui Rautapu Claims (Waikato River) Settlement Bill is currently before Parliament. It is likely that the passage of the Bill will lead to some form of co‐management with respect to some of Council’s local government and resource management functions. However, the full consequences of the legislation and its implementation will not be known for some time and Council has based its planning on current arrangements.
New co‐management processes may add significantly to Council’s costs
High Waipa District Council was involved in the development of the Waikato River Vision and Strategy and will work in good faith with Waikato‐Tainui to ensure these outcomes are achieved. This relationship is further strengthened by the membership of Waipa Mayor Alan Livingston on the Guardians of the Waikato River Establishment Committee. The Guardians will promote the restoration and protection of the Waikato River for future generations. We will also supervise the implementation of the vision and strategy.

10‐year Plan (2009‐19) 39
FORECASTING ASSUMPTIONS RISK LEVEL OF UNCERTAINTY
REASON AND FINANCIAL EFFECT OF UNCERTAINTY
Projected Growth Change Factors
Council will continue to provide services and perform functions to approximately the same standards as at present.
The growth of rateable properties in the District has been estimated to increase by 2% per annum.
Population growth has been estimated at 1.8% based on projections undertaken by the Waikato University Population Studies Centre for Future Proof (the Hamilton Sub‐regional Growth Strategy.)
Growth is more or less than forecast
Medium The global economic situation creates uncertainty around achievement of estimated growth.
Based on recent growth rates, there is existing capacity to accommodate this level of growth for the next 3‐5 years. The majority of growth related expenditure occurs in later years of the Plan. Council will continue to monitor actual rates of growth and if there is a significant change, appropriate amendments will be made to the 10‐year Plan.
In addition to these assumptions, a number of financial assumptions are included in Section 6 of this Plan, including:
▪ Useful lives of significant assets ▪ Sources of funds for future replacement of significant assets ▪ Projected growth change factors ▪ Cost factors ▪ NZTA Subsidy rate ▪ Revaluation of non‐current assets ▪ Interest rates ▪ External funding

40 Waipa District Council

10‐year Plan (2009‐19) 41
Section 3 ‐ COMMUNITY VISION
In this section: Background to Community
Vision Waipa District Community
Outcomes Waikato Region’s
Community Outcomes Iwi (Māori) Community
Outcomes Measuring Progress Towards
Achieving Community Outcomes
State of Waipa District Summary
Partnering for Success Community Action
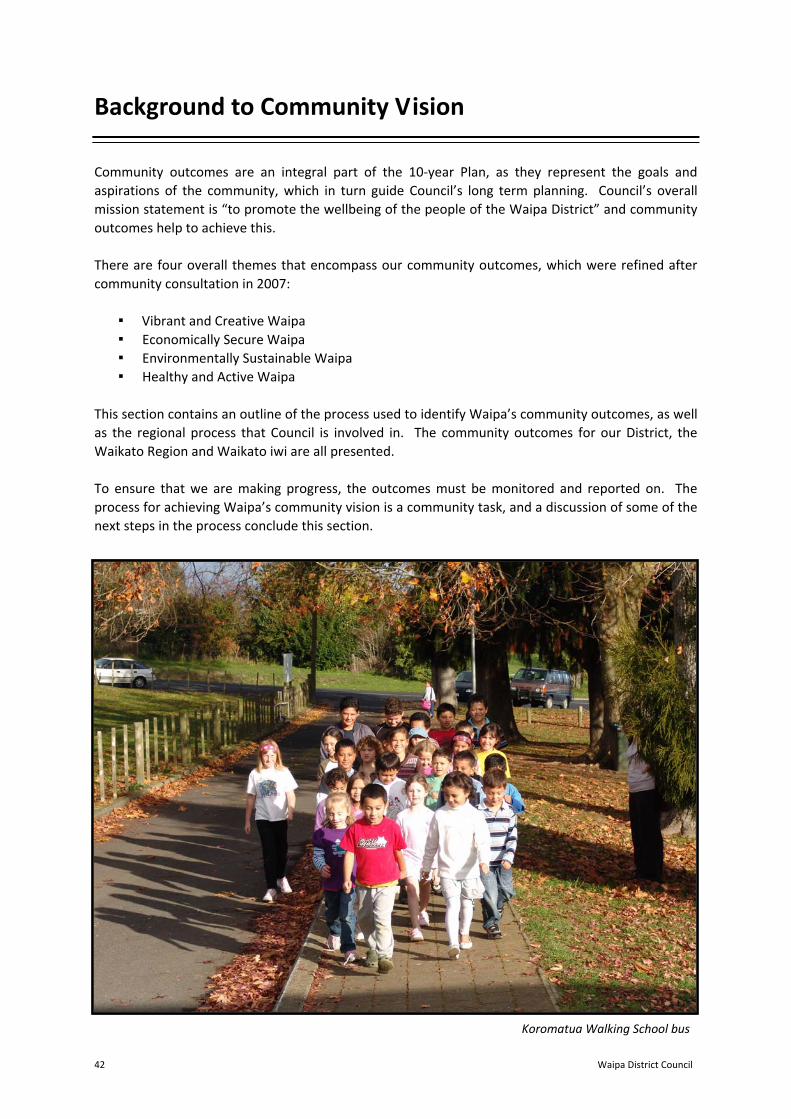
42 Waipa District Council
Background to Community Vision
Community outcomes are an integral part of the 10‐year Plan, as they represent the goals and aspirations of the community, which in turn guide Council’s long term planning. Council’s overall mission statement is “to promote the wellbeing of the people of the Waipa District” and community outcomes help to achieve this. There are four overall themes that encompass our community outcomes, which were refined after community consultation in 2007:
▪ Vibrant and Creative Waipa ▪ Economically Secure Waipa ▪ Environmentally Sustainable Waipa ▪ Healthy and Active Waipa
This section contains an outline of the process used to identify Waipa’s community outcomes, as well as the regional process that Council is involved in. The community outcomes for our District, the Waikato Region and Waikato iwi are all presented. To ensure that we are making progress, the outcomes must be monitored and reported on. The process for achieving Waipa’s community vision is a community task, and a discussion of some of the next steps in the process conclude this section.
Koromatua Walking School bus

10‐year Plan (2009‐19) 43
Waipa District Community Outcomes
In 2002 Waipa District Council undertook a district‐wide consultation process to identify community outcomes, 22 outcomes aligned to five wellbeing themes were developed from that feedback. As Council is required to review the community outcomes every six years, a review was undertaken in 2007 so that any amendments could be included in the 2009‐19 planning cycle. The 2007 process included general and Māori‐specific workshops. Ideas from these workshops were crafted into statements which were then presented to the wider community for feedback and from that revised outcomes relating to four (rather than five) wellbeing areas were drafted. These were checked against the Waikato Regional outcomes for consistency and alignment before being confirmed as Waipa’s community outcomes for 2009‐19. The revised outcomes are summarised below under the four wellbeing areas. Vibrant and Creative Waipa We are proud to be part of Waipa District, we participate in artistic and cultural activities and we work together to plan for the future.
Outcomes for this theme cover our unique, rich and diverse heritage, Māori heritage, the special character of our towns, celebrating achievement and participation in decision making. Economically Secure Waipa Our district is economically secure and provides opportunities for employment and growth.
Outcomes for this theme cover forward zoning planning, links between towns and the District, Waipa as a tourist destination, appropriate infrastructure, major industries supporting the local area, safety and accessibility of public buildings, transport options, and buying local. Environmentally Sustainable Waipa We value and protect our unique landscapes and healthy natural environment while managing growth.
Outcomes for this theme cover the protection of special areas, pest control, the link between healthy environments and healthy people, sustainable land management, maintaining water quality and efficient use of water, waste reduction, preservation of the environment including sites and landscapes significant to Māori and reducing reliance on non‐renewable energy. Healthy and Active Waipa We have healthy and active lifestyles with access to a range of health, educational and recreational facilities and services. Housing is affordable and we feel safe.
Outcomes for this theme cover recreational spaces, playgrounds and facilities, good quality housing, educational opportunities at all levels, coordinated community services, equal opportunities for Māori and non‐Māori, protection and care of families, resource sharing, the importance of Te Reo, and partnerships between Māori, iwi and hapū and central and local government.
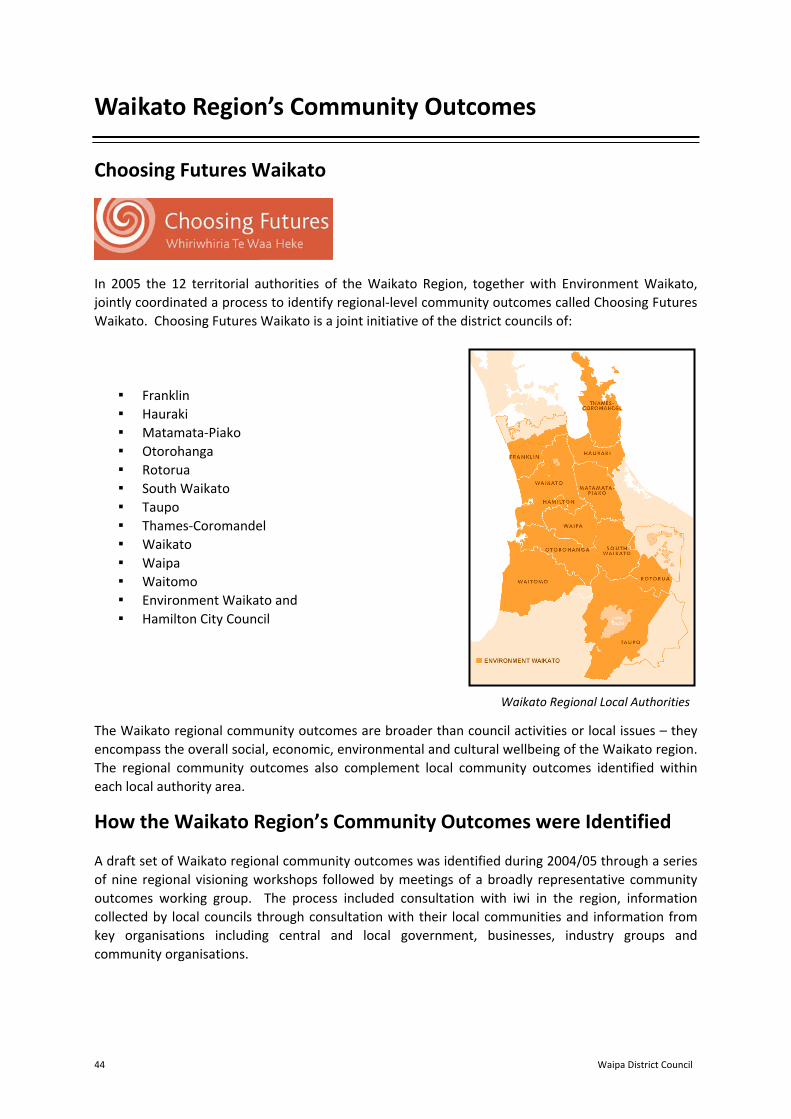
44 Waipa District Council
Waikato Region’s Community Outcomes
Choosing Futures Waikato In 2005 the 12 territorial authorities of the Waikato Region, together with Environment Waikato, jointly coordinated a process to identify regional‐level community outcomes called Choosing Futures Waikato. Choosing Futures Waikato is a joint initiative of the district councils of:
▪ Franklin ▪ Hauraki ▪ Matamata‐Piako ▪ Otorohanga ▪ Rotorua ▪ South Waikato ▪ Taupo ▪ Thames‐Coromandel ▪ Waikato ▪ Waipa ▪ Waitomo ▪ Environment Waikato and ▪ Hamilton City Council
The Waikato regional community outcomes are broader than council activities or local issues – they encompass the overall social, economic, environmental and cultural wellbeing of the Waikato region. The regional community outcomes also complement local community outcomes identified within each local authority area. How the Waikato Region’s Community Outcomes were Identified A draft set of Waikato regional community outcomes was identified during 2004/05 through a series of nine regional visioning workshops followed by meetings of a broadly representative community outcomes working group. The process included consultation with iwi in the region, information collected by local councils through consultation with their local communities and information from key organisations including central and local government, businesses, industry groups and community organisations.
Waikato Regional Local Authorities

10‐year Plan (2009‐19) 45
A draft set of Waikato regional community outcomes was reviewed by key stakeholders and promoted for community feedback before being signed off in November 2005. These outcomes are included in the table below along with the Waipa community outcomes that they align to. The Waikato regional community outcomes are grouped into five themes:
▪ Sustainable Environment ▪ Quality of Life ▪ Sustainable Economy ▪ Culture and Identity ▪ Participation and Equity
Theme Waikato Region Waipa District4
Environment Sustainable Environment – The Waikato region values and protects its diverse, interconnected natural environments. a) The iconic landscapes and natural features of our
environment define and sustain us. We respect and celebrate them as Taonga.
b) Our natural environment is protected and respected. Its ecological balance is restored, its air, soil and water quality is improved and its native biodiversity is enhanced.
c) We are aware of what we need to do to look after our environment. Our region is renowned for linking environmental awareness with community action.
d) The traditional role of Iwi and Hapū as Kaitiaki is acknowledged, respected and enabled.
e) Our coastal and waterway environments are restored and preserved and access to them is maintained.
f) Our region’s waterways have consistently high water quality.
g) We use land management practices that protect and sustain our soil and land.
h) We reduce our reliance on non‐renewable energy. i) Waste reduction, recycling, energy conservation and
energy efficiency are promoted and are part of how we all live.
Environmentally Sustainable Waipa Community Outcomes (C) 1‐9
Quality of Life Quality of Life – The Waikato region is a great place to live, providing the services and opportunities we need to live well. a) We are healthy with active lifestyles and enjoy a total sense
of wellbeing. Everyone has access to affordable quality health services throughout the Waikato region.
b) Education provides opportunities so we can reach our full potential as individuals and contribute to the wellbeing of the whole region.
c) Māori enjoy the same quality of health, education, housing, employment and economic outcomes as non‐Māori.
d) We have a choice of healthy and affordable housing that
Healthy and Active Waipa Community Outcomes (D) 1‐9, 11
4 For a full list of Waipa District’s community outcomes refer to the table on pages 54 to 59.

46 Waipa District Council
Theme Waikato Region Waipa District4 we are happy to live in and that is close to places for work, study and recreation.
e) Māori have the ability to live on ancestral land in quality, affordable housing.
f) Our communities and government work together so that we are safe, feel safe and crime is reduced.
g) We can work and participate in the communities where we live and there are quality work opportunities for people of all ages and skill levels.
h) We can participate in recreation and leisure activities that meet our diverse needs and we have opportunities to enjoy the Waikato region’s natural places and open spaces in responsible ways.
i) Families are strong and our communities are supportive of them.
j) Older people are valued and children are valued and protected. Young people have work, education and leisure opportunities and are included in making decisions that will affect their future.
Economy Sustainable Economy – The Waikato region balances a thriving economy with looking after its people, places and environment. a) Our region has economic growth and development that is
well‐planned and balanced with environmental, cultural and social needs and values.
b) Our regional and local economies are robust and diverse, providing opportunities throughout the Waikato region.
c) We have reliable, efficient and well‐planned infrastructure and services, including transport that is safe, interconnected and easy to get to and use.
d) We take a practical and coordinated approach to planning and providing services which works effectively across boundaries and sectors and responds to our communities’ needs.
e) The growth, wealth and uniqueness of the Māori economy is acknowledged and supported.
f) Our economy is built on land‐based industries and we encourage planning and practices that protect and sustain our productive resources.
g) We have a tourism industry that recognises the region’s cultural and environmental heritage and values and supports economic growth.
h) Our region has a reputation for entrepreneurship, innovation, research and education, attracting investment and people to work, study and visit.
Economically Secure Waipa Community Outcomes (B) 1‐10
Culture and Identity
Culture and Identify – The Waikato region identifies with – and values – its land, air, rivers and waterways, mountains, flora, fauna and its people. a) We are proud of our region’s distinctive identity, its strong
Māori tanga, and its rich and diverse natural and cultural
Vibrant and Creative Waipa Community Outcomes (A) 1‐5

10‐year Plan (2009‐19) 47
Theme Waikato Region Waipa District4 heritage.
b) Heritage sites and landscapes of significance to whanau, hapū and iwi are preserved and valued.
c) Our historic buildings and places are retained and cared for. New developments are designed to be sensitive to people, places and the environment.
d) All our communities have cultural and recreational events and facilities. We identify with and take part in our communities, building good community spirit.
e) Art, culture and creativity can be a part of everyone’s life. We all have opportunities for creative expression and our creative industries are supported and promoted.
Participation and Equity
Participation and Equity – The Waikato region builds strong, informed communities and has a culture that encourages people and communities to play their part. a) All our people and communities can participate in decision‐
making. We are educated, informed and have the resources we need to take responsibility for our own futures.
b) Iwi, hapū and Māori work together with central government, local government and community organisations in mutually beneficial partnerships.
c) Our communities understand partnerships under the Treaty of Waitangi and representation and processes for these partnerships have integrity.
d) The unique status of Tangata Whenua is respected and reflected in community processes.
e) Māori have the opportunity to participate in community development and decision‐making at Marae, hapū and iwi levels.
f) We are knowledgeable about and show respect for the many and diverse cultures of the people who live here.
Vibrant & Creative Waipa Community Outcomes (A) 6 and 7 Healthy and Active Waipa Community Outcomes (D) 10
Environment Waikato is working towards achieving these regional community outcomes and holds the statutory responsibility for monitoring and reporting progress. What Has Happened Over the Past Three Years? MARCO Indicators The local authorities in the Waikato region have committed to work in partnership to identify and gather information to evaluate and report progress towards achieving community outcomes through the Monitoring and Reporting Community Outcomes’ (MARCO) working group formed to develop a coordinated approach.

48 Waipa District Council
Work started in 2005 to identify and select suitable indicators or key measures that can be used to monitor and report on progress. From a list of over 200 initial indicators the MARCO group identified a set of 75 key indicators based on a technical assessment (measurability, cost effectiveness, understandability), relevance for local community outcomes (survey of all territorial authorities) and relevance to the regional community outcomes (workshop with community stakeholders). The 75 indicators are grouped into the five major themes containing the 38 outcomes. Many of the indicators developed are also used at a local level for monitoring and reporting progress towards achieving outcomes at district or city level. Refer to www.choosingfutures.co.nz for a list of the indicators and their results. A parallel process, working with iwi in the Waikato region to come up with specific indicators that relate to those community outcomes relevant to Māori/iwi, is also underway. The MARCO group coordinated the collation of all available data about the 75 key indicators. In December 2006, a baseline data analysis report was published (available on www.choosingfutures.co.nz) and a further report was published in April 2007 which summarised the data collected about the indicators and provided an overview of the region, including current states and long‐term trends for important aspects of the region’s wellbeing. It also highlighted areas where there are gaps in the data and work has begun to fill these. The 2007 baseline report was updated in 2008 to incorporate new data. This report provided the basis for the first regional community outcomes report that includes further interpretation and discussion of the results, describes some successful collaborative projects and highlights remaining problems. The regional community outcomes report feeds into the district/city monitoring reports on community outcomes and will be repeated every three years. This will help to track and review progress towards community outcomes. The MARCO group will continue to coordinate the monitoring efforts of councils and their communities in the Waikato region and work closely with Statistics NZ and other central government departments to avoid duplication and to ensure the most cost effective gathering of timely and good quality data. Further Information For further information about the MARCO process at Choosing Futures Waikato (CFW), visit www.choosingfutures.co.nz or contact: Choosing Futures Waikato c/‐ Environment Waikato PO Box 4010 Hamilton East Hamilton 3247 Email: [email protected]

10‐year Plan (2009‐19) 49
Iwi (Māori) Community Outcomes
In recognition of the unique status of Māori as tangata whenua, and in response to specific Māori provisions of the Local Government Act 2002, iwi specific outcomes were developed for:
▪ Raukawa Trust Board ▪ Maniapoto Māori Trust Board ▪ Waikato Raupatu Lands Trust
Representatives of Ngati Tuwharetoa and Hauraki iwi did not pursue the development of iwi outcomes. These representatives supported the development of iwi specific outcomes, but also encouraged councils to recognise the existing planning documents of their iwi. The Waipa District is encompassed by the rohe (geographical boundaries) of Waikato, Maniapoto and Raukawa iwi. Therefore, it is appropriate that the outcomes identified by these iwi authorities are included alongside the Waipa District and Waikato Region outcomes presented in this 10‐year Plan. The outcomes developed by Maniapoto, Raukawa and Waikato iwi are listed (verbatim) below. All enquiries regarding these outcomes should be directed to the appropriate iwi authority. Waikato‐Tainui Community Outcomes Waikato‐Tainui comprises 67 Marae and 33 Hapū. Te Kauhanganui o Waikato Inc is the tribal parliament of Waikato‐Tainui and Te Arataura is its executive. The outcomes identified by Waikato‐Tainui are:
▪ To restore and protect the Waikato River for future generations ▪ The successful implementation of Whakatupuranga Waikato ‐Tainui 2050 ▪ Waikato‐Tainui exercises mana‐whakahaere over its taonga ▪ Waikato‐Tainui values the education of all its people ▪ Waikato‐Tainui recognises its partnership with the Crown ▪ Waikato‐Tainui undertakes to resolve its excluded Waitangi Tribunal Claims that remain
outstanding from its 1995 Raupatu Settlement ▪ To advance the tribal development of Waikato‐Tainui for the betterment of tribal members
and their communities ▪ Waikato‐Tainui values Te Kotahitanga and Matauranga of its people ▪ Waikato‐Tainui to be leaders in safe and healthy lifestyles ▪ Sustainable equitable economic development is important to Waikato‐Tainui
Waipa District Council and Waikato‐Tainui both seek to work with each other in good faith to achieve the Waikato‐Tainui outcomes and to assist Council to fulfil its obligations to Māori under the Local Government Act 2002.

50 Waipa District Council
Maniapoto Community Outcomes Ngāti Maniapoto is an iwi of the Tainui confederation. Ngāti Maniapoto occupies the southern region of the territory of the Tainui tribes. The outcomes identified by Ngāti Maniapoto are:
▪ Protection and respect for natural features of our environment as Taonga ▪ The acknowledgment of, respect for and enabling of the traditional role of iwi and Hapū as
Kaitiaki ▪ The restoration of the ecological balance of the natural environment with the improvement
of air, soil and water quality together with the enhancement of its native biodiversity ▪ The restoration and preservation of coastal and waterway environments together with the
maintenance of access to them ▪ Improving environmental awareness and ensuring action ▪ The use of energy from renewable sources in all areas ▪ The promotion of waste reduction, recycling, energy conservation and energy efficiency ▪ Equitable outcomes in terms of the quality of health, education, housing, employment and
economic growth ▪ The ability to live on ancestral land in quality, affordable housing ▪ Support for and encouragement of healthy, active lifestyles and a total sense of wellbeing ▪ Acknowledgment and support for the growth and uniqueness of the Māori economy within
the Maniapoto region ▪ Pride in a regional distinctive identity, including Māoritanga, and a rich and diverse cultural
heritage ▪ Preservation of sites of significance ▪ Local government systems should recognise and provide for the representation of the
iwi/Hapū Treaty partner ▪ Iwi, Hapū and Māori work together with central government, local government and
community organisations in mutually beneficial partnerships ▪ Communities understand partnerships under the Treaty of Waitangi ▪ Opportunities to participate in community development and decision‐making at Marae,
Hapū and iwi levels For further information about Maniapoto Community Outcomes, visit www.maniapoto.iwi.nz or contact: Maniapoto Māori Trust Board PO Box 36 Te Kuiti 3941 Phone (07) 878 6234 Email [email protected]. Raukawa Community Outcomes The Raukawa tribal area includes the areas of Atiamuri, Mokai, Mangakino, Te Awamutu, Kihikihi, Maungatautari, Arapuni, Matamata, Cambridge, Putaruru, Tirau and Tokoroa. This tribal region includes the following territorial authorities:

10‐year Plan (2009‐19) 51
▪ Taupo ▪ Otorohanga ▪ Environment Bay of Plenty ▪ Rotorua ▪ Waipa ▪ South Waikato ▪ Matamata Piako ▪ Waitomo ▪ Environment Waikato
The outcomes identified by the Raukawa community are as follows:
RAUKAWA FOCUS OUTCOME
Pukenga Being accomplished or skilled
Individuals are encouraged to pursue opportunities to reach their potential and add value to community wellbeing. Community leadership is fostered and nurtured. Development of hapū, marae and whanau is achieved with the assistance of key stakeholders.
Ukaipo Land as sustenance for our people
Iwi and Māori have the ability to live on and develop ancestral land in quality, affordable housing and in sustainable manner that suits each hapū, marae and whanau.
Wairau Spiritually as the essence of our being
Our community is proud of our rohe’s distinctive identity, characteristics, rich diverse natural and cultural heritage.
Kaitiakitanga Guardianship, our responsibility to our environment
We respect the iconic landscapes and natural features of our environment as taonga that define and sustain us. Our natural environment is protected and respected to ensure that its ecological balance is restored and biodiversity is enhanced by improving the quality of air, soil and water. The traditional role of iwi and hapū as kaitiaki is acknowledged, respected and enabled. Flora, fauna, wetlands and waterways are preserved, restored, protected and sustainably managed within the Raukawa takiwa. Heritage sites and landscapes of significance to whanau, hapū and iwi are preserved and valued.
Whanaungatanga Relationships
Mokopuna, rangatahi, pakeke, kaumatua live and grow in safe and positive communities. All people are valued and protected and have opportunities to participate in decision‐making that will affect their future. There is quality of life for individuals and families in the Raukawa takiwa.
Rangatiratanga Chieftainship, independence of will
The unique status of tangata whenua is respected and reflected in community development processes. Iwi infrastructure is recognised and accepted as key to strong, sustainable community development.

52 Waipa District Council
RAUKAWA FOCUS OUTCOME
The Māori economy is acknowledged and supported. Raukawa takes responsibility for its own future by actively participating in decision‐making as educated, informed and resourced stakeholders. Raukawa engages in development and enterprise that is socially, environmentally and culturally responsible and sustainable.
Manaakitanga Caring for others
The community is aware of and acknowledges the many diverse cultures of the people in the Raukawa takiwa.
Kotahitanga Being of one mind to achieve common goals
Our communities understand the Treaty of Waitangi in all its many facets. The Treaty is recognised as a key component in partnerships between Raukawa and its many stakeholders. Iwi and Māori work together with key stakeholders in mutually beneficial partnerships. Raukawa business and commercial development is fostered through the creation and promotion of an innovative and entrepreneurial culture.
Sharing Memories

10‐year Plan (2009‐19) 53
Measuring Progress Towards Achieving Community Outcomes
Progress towards achieving community outcomes needs to be monitored and the results reported on at least every three years. In 2005, local authorities in the Waikato Region committed to work together to identify and monitor regional outcomes. A working group, ‘Monitoring and Reporting Community Outcomes’ (MARCO) was formed, and Waipa District Council is a member of it. A regional report on monitoring achievement was published in 2006 and an update in 2008. A copy of this report is available on the Choosing Futures website www.choosingfutures.co.nz. Council is required to take a lead role in reporting progress on the achievement of Waipa’s community outcomes. Council monitors progress using a set of measurements called indicators that were identified in 2006 at both a district and regional level. The State of Waipa District report has recently been published to show progress towards achievement of Waipa’s 2002 community outcomes. A summary of the key results is provided in Section 4 of this 10‐year Plan. Future State of Waipa District Reporting For this 10‐year Plan, a revised set of indicators has been aligned to the revised set of community outcomes, largely based on the 2006 set for consistency. This list is an indicative one and may change as various indicators are replaced in line with regional monitoring or as more suitable indicators are identified. A full State of Waipa District report will be published every six years with an interim report published every 3 years, with the next report due in 2012. The diagram below shows the cycle of activity. Community Outcomes Identification and Monitoring Cycle
6 YEAR CYCLE
COMMUNITY OUTCOMES
Identified / reviewed
INDICATORS
Identified / reviewed
INTERIM 3‐YEARLY
State of the District Reporting(results feed into 3‐yearly
10‐year Plan)
STATE OF THE DISTRICT
Report published showing progress towards community
outcomes achieved(results feed into 3‐yearly
10‐year Plan)

54 Waipa District Council
The proposed indicators for the next State of Waipa District report are detailed in the tables below (these are aligned to the revised set of community outcomes), along with some of the key organisations who can work towards achieving the outcomes. Waipa’s Community Outcomes, monitoring indicators and some contributing organisations
A. VIBRANT AND CREATIVE WAIPA – Cultural Wellbeing
Community Outcome Indicators Contributors 1. We are proud of our District’s
unique identity and its rich and diverse archaeological, natural and cultural heritage.
2. We have a vibrant Māori community and our Māori heritage is embraced and celebrated District wide and showcased as an integral part of the visual amenity of our towns.
3. The special character and heritage of our towns and villages is retained and promoted.
4. We identify with and take part in our communities and enjoy participating in creative, recreational and cultural activities that build vibrant community spirit, both locally and at District level.
5. Individual and group achievement is recognised and celebrated District wide.
6. We all have meaningful opportunities to participate in making decisions that help shape the Waipa of the future.
7. Our communities recognise that Waipa District is enriched by our multi cultural makeup and the unique status and role of tangata whenua is respected and reflected in community processes.
▪ Residents’ rating of sense of pride in the way their region / town looks and feels.
▪ Number of buildings and places listed on the Historic Trust Register.
▪ Number of people employed in the cultural sector.
▪ Participation levels – sport and active leisure.
▪ Participation in cultural and art activities.
▪ Community satisfaction with cultural facilities provided.
▪ Percentage of voter turnout at local and general elections.
▪ Community satisfaction with the way their Council involves the public in the decisions it makes.
▪ Community satisfaction with Council performance.
▪ Community satisfaction with elected members.
▪ Percentage of residents perceiving that they are knowledgeable and show respect for the many and diverse cultures of people who live here.
▪ Armistice in Cambridge ▪ Cambridge Community Arts
Council ▪ Te Awamutu Community Arts
Council ▪ Cambridge Community
Marae ▪ Historical Societies ▪ Information Centres ▪ New Zealand Historic Places
Trust ▪ Waipa Heritage Council

10‐year Plan (2009‐19) 55
B. ECONOMICALLY SECURE WAIPA – Economic Wellbeing
Community Outcome Indicators Contributors 1. Provision of industrial and
residential areas is well balanced, carefully zoned to maintain our rural / semi‐rural nature and planned well into the future.
2. Our towns are economically independent of Hamilton and each town maintains its own vibrant and unique character while maintaining strong links to the District as a whole.
3. A diversity of employment options and business opportunities is provided within the District.
4. Our District is a tourist destination of choice and our tourism industry promotes our special local features and supports economic growth.
5. We have reliable, efficient and well planned water, wastewater and stormwater infrastructure that supports development and growth while continuing to meet the needs of residents.
6. Our strong dairy and equine industries help support our prosperous communities and planning and practices are encouraged that protect and sustain our productive resources.
7. Public buildings and public transport options are safe, accessible to people of all ages and abilities and signage is clear and visible.
8. We have reliable, efficient and well planned transport infrastructure systems that provide easy access to and through our towns.
▪ Number of vacant commercial sites in Cambridge / Te Awamutu.
▪ Land use. ▪ Extent of urban / rural
residential areas. ▪ Proximity to work, study and
recreation. ▪ Number and type of new
businesses set up in past year.
▪ Number of businesses and employees by industry.
▪ Number and type of new businesses still operating after 3 years.
▪ Unemployment rate (Māori / non Māori).
▪ Work opportunities matching skills.
▪ Number, type and people attending community based events at key sites.
▪ Satisfaction with Council’s services / facilities.
▪ Quality of public water supply.
▪ Number of complaints received regarding infrastructure capabilities (utilities).
▪ Development contributions collected and percentage spent on upgrading / developing infrastructure.
▪ Number of public health related complaints.
▪ Number of requisitions issued and / or closures of commercial premises due to environmental health standards not being met.
▪ Residents’ frequency of use of public transport in previous 12 months.
▪ Active Transport Cambridge and Te Awamutu
▪ Age Concern ▪ Chambers of Commerce ▪ Citizens Advice Bureaux ▪ Community Boards ▪ Community Employment
Group ▪ Department of Labour ▪ Federated Farmers ▪ Fonterra ▪ Hamilton International
Airport ▪ NZ Transport Agency ▪ Ministry of Transport ▪ Mystery Creek ▪ New Zealand Trade and
Enterprise ▪ Pirongia Tourism Association ▪ Ratepayers Associations ▪ Te Awamutu Alive ▪ Telecom Ltd ▪ Transit New Zealand ▪ WEL Networks ▪ Work and Income

56 Waipa District Council
B. ECONOMICALLY SECURE WAIPA – Economic Wellbeing
Community Outcome Indicators Contributors 9. The growth, wealth and
uniqueness of the local Māori economy is acknowledged and supported.
10. The ‘buy local’ philosophy is encouraged and locally sourced products and services are supported.
▪ Residents’ rating of whether public transport is convenient.
▪ Length of sealed / unsealed roads in the District.
▪ Community satisfaction with roading and transport options.
▪ Total vehicle kilometres travelled per annum.
▪ Number and type of complaints received regarding transportation network.
C. ENVIRONMENTALLY SUSTAINABLE WAIPA – Environmental Wellbeing
Community Outcome Indicators Contributors 1. Our special natural
landscapes and native biodiversity, such as peat lakes, riparian and indigenous forest areas are protected, maintained and enhanced, ecological corridors are developed and animal and plant pests are controlled.
2. We are aware of the links between the health of our environment and our own health. Local organisations and individuals are regularly involved in environmental care activities.
3. We use land management practices that protect and sustain our soil and land, and our District’s high quality soils are protected from increasing ‘development’ demands by concentrating growth around existing settlements rather than intruding on rural areas.
▪ Area of land subject to environmental protection by type.
▪ Area and condition of protected wetlands and peat lakes (including water level and water quality).
▪ Location, area and type of pest control operation.
▪ People’s personal environmental attitudes.
▪ Area of vacant land available for development for residential, commercial, industrial and rural residential purposes.
▪ Incidents of water use restrictions (frequency and duration).
▪ Level and compliance with resource consent conditions achieved by Council’s water supply and wastewater treatment plants.
▪ Lake / River water quality for ecological health.
▪ Cambridge Tree Trust ▪ Department of Conservation ▪ Environment Waikato ▪ Enviroschools ▪ Fish and Game ▪ Friends of Barrett Bush ▪ Kakepuku Mountain
Conservation Project ▪ Keep Te Awamutu Beautiful
Society ▪ Maungakawa Tui 2000 ▪ Maungatautari Ecological
Island Trust ▪ Ministry for the Environment ▪ New Zealand Historic Places
Trust ▪ Pirongia Historic Visitor
Centre ▪ Pirongia Te Aroaro o Kahu
Restoration Society ▪ Waikato Biodiversity Forum
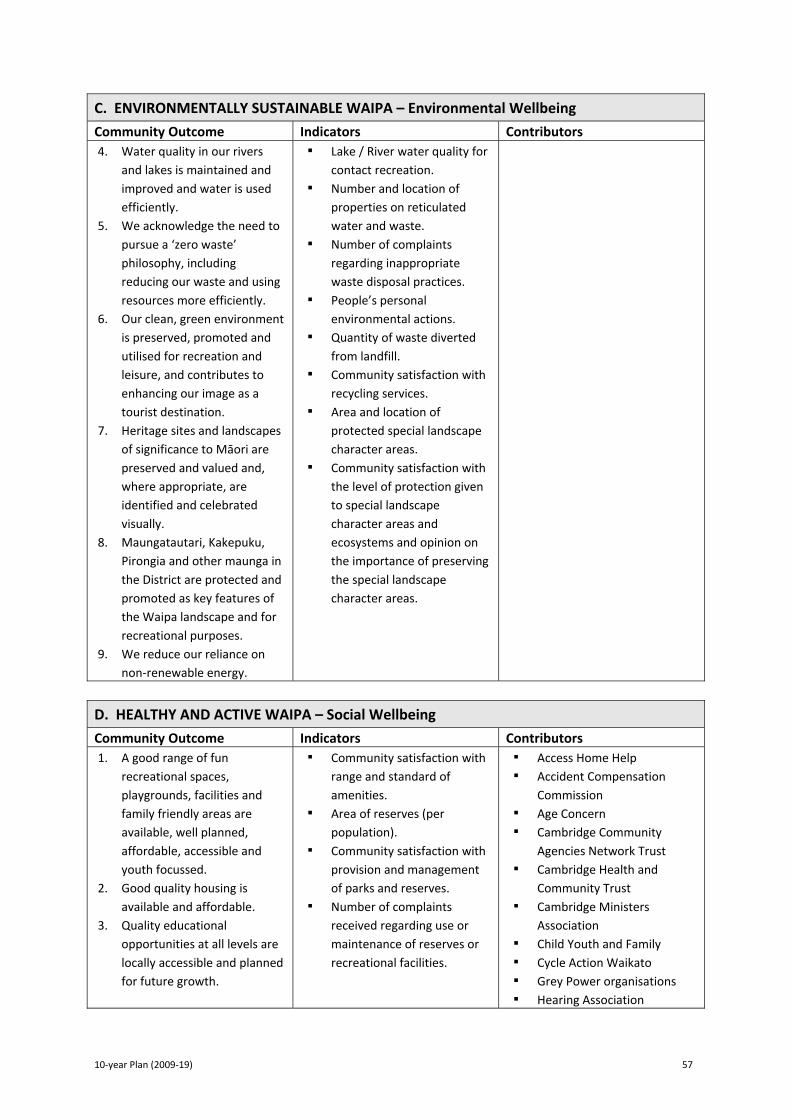
10‐year Plan (2009‐19) 57
C. ENVIRONMENTALLY SUSTAINABLE WAIPA – Environmental Wellbeing
Community Outcome Indicators Contributors 4. Water quality in our rivers
and lakes is maintained and improved and water is used efficiently.
5. We acknowledge the need to pursue a ‘zero waste’ philosophy, including reducing our waste and using resources more efficiently.
6. Our clean, green environment is preserved, promoted and utilised for recreation and leisure, and contributes to enhancing our image as a tourist destination.
7. Heritage sites and landscapes of significance to Māori are preserved and valued and, where appropriate, are identified and celebrated visually.
8. Maungatautari, Kakepuku, Pirongia and other maunga in the District are protected and promoted as key features of the Waipa landscape and for recreational purposes.
9. We reduce our reliance on non‐renewable energy.
▪ Lake / River water quality for contact recreation.
▪ Number and location of properties on reticulated water and waste.
▪ Number of complaints regarding inappropriate waste disposal practices.
▪ People’s personal environmental actions.
▪ Quantity of waste diverted from landfill.
▪ Community satisfaction with recycling services.
▪ Area and location of protected special landscape character areas.
▪ Community satisfaction with the level of protection given to special landscape character areas and ecosystems and opinion on the importance of preserving the special landscape character areas.
D. HEALTHY AND ACTIVE WAIPA – Social Wellbeing
Community Outcome Indicators Contributors 1. A good range of fun
recreational spaces, playgrounds, facilities and family friendly areas are available, well planned, affordable, accessible and youth focussed.
2. Good quality housing is available and affordable.
3. Quality educational opportunities at all levels are locally accessible and planned for future growth.
▪ Community satisfaction with range and standard of amenities.
▪ Area of reserves (per population).
▪ Community satisfaction with provision and management of parks and reserves.
▪ Number of complaints received regarding use or maintenance of reserves or recreational facilities.
▪ Access Home Help ▪ Accident Compensation
Commission ▪ Age Concern ▪ Cambridge Community
Agencies Network Trust ▪ Cambridge Health and
Community Trust ▪ Cambridge Ministers
Association ▪ Child Youth and Family ▪ Cycle Action Waikato ▪ Grey Power organisations ▪ Hearing Association

58 Waipa District Council
D. HEALTHY AND ACTIVE WAIPA – Social Wellbeing
Community Outcome Indicators Contributors 4. Community services are
coordinated and delivered effectively and efficiently to maximise resources while meeting the needs of our residents.
5. Everyone has access to affordable quality health and childcare services.
6. Māori enjoy the same quality of health, education, housing, employment and economic outcomes as non‐Māori.
7. Families and caregivers are protected and valued and our communities accept responsibility for our children and other vulnerable members.
8. Inequity in income and access to services and employment is reduced and resources are shared appropriately.
9. The importance of te reo is recognised and promoted through promotion and support of appropriate educational facilities.
10. Iwi, hapū and Māori work together with central government, local government and community organisations in mutually beneficial partnerships.
11. Our communities and agencies work together so that we are safe, we feel safe, crime is reduced and there is a zero tolerance approach to anti‐social behaviour.
▪ Number and location of parks, reserves and sports grounds in the District.
▪ Household crowding (Canadian Crowding Index).
▪ Home mortgage affordability.▪ Rent to income ratio. ▪ Home ownership rates. ▪ Community satisfaction with
availability of educational facilities.
▪ Educational attainment of the adult population.
▪ School decile ratings. ▪ School leavers with no formal
education. ▪ Participation in early
childhood education. ▪ Barriers to accessing General
practitioners (GPs). ▪ Number of GPs per 100,000
population. ▪ Community satisfaction with
range and quality of health services available.
▪ Community satisfaction with availability of childcare facilities.
▪ Life expectancy at birth (Māori / non‐Māori).
▪ Social deprivation index (Māori / non‐Māori).
▪ Community perceptions of quality of life.
▪ Suicide rates. ▪ Rate of notifications to child
youth and family services (CYFS).
▪ Avoidable mortality and hospitalisation rates.
▪ Road traffic crashes and casualties.
▪ Level of unpaid work. ▪ Residents’ perception of
access to adequate family services and support networks.
▪ Housing New Zealand ▪ Kainga Aroha ▪ Kihikihi Domain Sports
Incorporated ▪ Kindergartens ▪ Māori Women’s Welfare
League ▪ Ministry of Education ▪ Ministry of Social
Development ▪ New Zealand Fire Service ▪ Police ▪ Rosetown Counselling Centre ▪ Schools ▪ Select Security ▪ Sport and Recreation New
Zealand (SPARC) ▪ Sport Waikato ▪ Synergy (Cambridge) Trust ▪ Te Awamutu Gracelands
Trust ▪ Te Awamutu Health and
Welfare Forum ▪ Te Awamutu Safer
Community Trust ▪ Te Awamutu Youth Services ▪ Te Puni Kokiri ▪ Te Wananga o Aotearoa ▪ Tribal Youth ▪ Waikato District Health
Board ▪ Waikato Primary Health ▪ Waikato Valley Emergency
Management Group (CDEMG)

10‐year Plan (2009‐19) 59
D. HEALTHY AND ACTIVE WAIPA – Social Wellbeing
Community Outcome Indicators Contributors ▪ Median weekly income. ▪ Number of Māori speakers
(in Māori and total population).
▪ Rates and location of notifiable diseases.
▪ Community perception of safety.
▪ Number of requisitions issued due to environment health standards not being met.
▪ Reported criminal offences and resolution rates.
▪ Number of recorded offences by type.
▪ Number of ACC claims.
Olympic Champions Parade 2008
60 Waipa District Council
State of Waipa District Summary
A report on the state of Waipa District has recently been published to show progress towards achievement of Waipa’s 2002 community outcomes. In this section, we summarise under the five community outcomes goals5, what the indicator information (based on data to July 2008) tells us about the state of Waipa District. Community Health: Healthy Waipa People in Waipa District rate their overall quality of life higher than people in most other parts of the Waikato Region. Within the District, life expectancy has increased and suicide rates have decreased over recent years. The number of deaths and injuries from motor vehicle crashes has increased since 2003, although it had been significantly declining for several years before that. Waipa people say that they are physically active, and there is less household crowding in Waipa than in the Waikato overall. Environmental Health: Sustainable Waipa Within Waipa District, initiatives to increase the area of land subject to environmental protection, and that focus on retaining and restoring indigenous biodiversity, together with the recent introduction of kerbside recycling are all making a difference to the District’s environmental sustainability. However, ongoing issues such as deteriorating ecological and recreational lake and river water quality, the condition of Waipa’s peat lakes, and pressures from plant and animal pests, will need collaborative action if the District is to make meaningful progress. Economic Wellbeing: Economically Secure Waipa Employment rates are improving in Waipa and compare favourably with New Zealand figures, reflecting a sustained period of economic growth for the District. Housing costs are rising, making home ownership unaffordable for many, while weekly rents have also increased markedly in the past two years. The Waikato Region (including Waipa) has consistently contributed around 9% to the New Zealand economy over the past two years. Social Wellbeing: Vibrant and Strong Waipa A high proportion of Waipa residents are proud of the way their district looks and feels. They are also satisfied with the performance of their elected Council members.
5 Note: following the Community Outcomes review, there are now only four community outcome goal areas.

10‐year Plan (2009‐19) 61
However, the decline that is occurring nationwide in the number of people participating in local body elections is also happening in Waipa. Lower proportions of eligible people voted in the last local body elections and less than half the Waipa residents surveyed thought they had enough say in what Council does. Over the past year, the number of criminal offences in Waipa has decreased, while crime resolution rates have increased. Waipa people feel safer in their community, during both the day and night, than those in the Waikato Region in general. Notifications to Child, Youth and Family Services have increased markedly since 2004, and people do not rate highly the level of support available in the community from social networks and agencies. However, attitudes in the District towards people of diverse cultures are positive. Service Provision: Liveable Waipa Waipa residents’ satisfaction with Waipa District Council’s utilities and road services remains high, as does satisfaction with the educational facilities, parks and reserves that are provided in the District. However, there is still a need for a more sustainable water supply, as water use restrictions were required during the 2007/08 summer drought. There is also a need for more sustainable transport options, such as public transport and cyclist‐friendly infrastructure.

62 Waipa District Council
Partnering for Success – About the Process
Although Council has a key role in achieving community outcomes, the whole community has a part to play. A number of local organisations have expressed interest in working together on this task, and other key organisations, such as government agencies, health and service agencies, iwi/Māori organisations and the private sector have the resources and the ability to make a vital contribution. Council recognises the importance of building and strengthening relationships with local organisations and is continuing to focus on joint approaches to progressing community outcomes. In July 2008 representatives of key organisations were invited to participate in workshops to identify partnership opportunities to work towards achieving these. It is hoped these collaborative relationships will be strengthened and activities more aligned over time to work effectively towards the achievement of Waipa’s community outcomes. Regular partner meetings are planned for 2009 to enable this to be achieved. Those organisations identified as having a role to play are outlined in the table on page 54‐59. There may be more organisations that can contribute, please let Council know if your organisation would like to be included in future partnership opportunities. Each organisation has a different role to play in contributing to the achievement of each community outcome. The nature of Council’s responsibility towards individual community outcomes and its ability to influence them also varies from outcome to outcome. Regardless of whether Council is a primary service provider or a regulator, it is responsible for ensuring that its activities, services, policies and decisions contribute towards the achievement of community outcomes. It is expected that the activities of other agencies will show similar alignment. In outcomes such as education and health, agencies other than Council will take a lead role while Council can contribute in other ways. The community outcomes process has enabled better discussion between central and local government organisations on identifying and working together to deliver community outcomes. Local government has also gained experience in facilitating community involvement and raising community awareness through the community outcomes process. The information generated from the ‘partnership’ workshops has fed into the development of Council’s Strategic Plan which sets out priority areas and strategies for achieving them in relation to community outcomes.

10‐year Plan (2009‐19) 63
Community Action – Current and Future Projects
Where to From Here The following table contains details of some of the key issues in achieving community outcomes that have emerged from consultation with local organisations. Council currently has some projects underway that can partly address those issues and these are identified in the table along with other key organisations that have a role in working towards achieving progress in these areas.
KEY ISSUE CONTRIBUTING AGENCIES COUNCIL’S PROJECTS
Greater protection of heritage required – incentives etc.
Develop ecological corridors
▪ Historical Societies
▪ New Zealand Historic Places Trust
▪ Waipa Heritage Council
▪ District Plan Review
▪ Heritage Strategy
Town centres to recognise Māori history
▪ Iwi Consultative Committee
▪ Nga Iwi Toopu o Waipa
▪ Heart of Te Awamutu
Identify character and promote Waipa, encourage tourism
▪ Information Centres / i‐sites
▪ Promotion Strategy Review
Public transport and alternative transport options required
▪ Active Transport Cambridge & Te Awamutu
▪ New Zealand Transport Agency
▪ Public Transport Level of Service Review
▪ Cycle/Walking Strategy
Manage water quality in lakes / rivers
▪ Department of Conservation
▪ Environment Waikato
▪ Fonterra
▪ Peat Lakes Accord
▪ Stormwater/Wastewater plant upgrades
Youth mentoring programmes – to be more cooperative / collaborative
▪ Child Youth & Family
▪ Cambridge Community House
▪ Cambridge Community Marae
▪ New Zealand Police
▪ Cambridge Community Social Services Committee
▪ Youth Council
▪ Mayor’s Taskforce for Jobs
▪ Kainga Aroha Community House
Water use and conservation ▪ Environment Waikato
▪ Fonterra
▪ Water Conservation Demand Management Strategy
Section 4 of this 10‐year Plan discusses Council’s role towards achieving Waipa’s community outcomes in more detail.

64 Waipa District Council

10‐year Plan (2009‐19) 65
Section 4 ‐ COUNCIL’S RESPONSE
In this section: Challenges for Council Council’s Role Key Achievements 2006‐
2009 Community Satisfaction
Survey Results Highlights of Council Planned
Activities 2009‐2019

66 Waipa District Council
Challenges for Council
Council’s purpose is to promote the wellbeing of Waipa residents now and into the future and to support the development of the District in a sustainable way. In doing so, Council must balance competing interests and expectations of residents and stakeholder groups in a way that is affordable and sustainable. In looking at the activities and plans proposed for the next 10 years, Council has strived to use resources efficiently and to find innovative, cost‐effective ways of operating. However it faces a number of challenges and these are outlined in this section. Climate Change Climate change is a global issue and, as such, New Zealand’s response is being driven by central government through the Ministry for the Environment. Based on the research undertaken to date, the impacts of climate change are likely to differ between and within regions. Council is mindful of the need to consider the possible affects of climate change when planning for the future. Over the next 50 years indications are that Waipa District can expect wetter conditions than present with more intense rainfall events. These predictions have been factored in to our long‐term infrastructure planning, although the impacts are not considered significant over the next 10 years. Flood hazard areas will be reviewed as part of the District Plan review that is currently underway. Council will work with other agencies to assess the likely ongoing impacts for the District and determine the most appropriate strategies to respond to them. As an initial step, Council has joined Communities for Climate Protection (New Zealand), a collaborative initiative involving other councils, with a focus on developing joint programmes and actions to reduce greenhouse gas emissions and respond to climate change impacts. Managing Growth In recent years Waipa District has experienced growth at or about the national average. This growth has occurred over a relatively short period and is expected to continue over the long term. Although population and household growth have positive benefits for the District, especially economically, it places pressure on existing infrastructure and the natural environment, as well as increasing the demand for building and the associated infrastructure. Determining what is appropriate growth, both in terms of type and level, and where it should occur, is a key strategic issue for Council and the community. As growth has occurred, there have been concerns about the risk of eroding the special character of the District and its communities. Growth needs to be managed proactively which is why Waipa 2050 is underway ‐ a comprehensive planning initiative encompassing a growth strategy to guide future development, the preparation of development blueprints for major urban areas and the review of the District Plan. Details of Waipa 2050 can be found in the Section 2 and Section 5.
10‐year Plan (2009‐19) 67
Legislative Change and Compliance In recent years there have been major changes to the legislative framework within which local government operates. Examples of key changes include:
▪ Local Government Act 2002 ▪ Local Government (Rating) Act 2002 ▪ Building Act 2004 ▪ Resource Management Act 1991 (notably amendments 2005 and 2006) ▪ Land Transport Act 2003 ▪ New Zealand Drinking Water Standards 2008
Perhaps the most significant of these changes has been the introduction of the Local Government Act (LGA), which has broadened the focus of councils to promote the wellbeing of communities and to do that in conjunction with communities. The LGA also introduced a much stronger focus on participatory democracy in local government. Changes to legislation are invariably driven by a need for improvement, however, the means of achieving it may come at significant cost. These additional requirements are imposed on Council and must be complied with, no additional funding is provided by central government. Often, there is only limited ability to cover these additional costs with specific fees and charges, so invariably funding is through rates. Rising public health and environmental standards are generally seen as positive actions, however, they are also a source of significant additional cost. Compliance with Drinking Water Standards and meeting resource consent requirements for wastewater discharges can lead to investment totalling millions of dollars, sometimes without any significant increase in the level of service to ratepayers. While many of these costs might not be avoidable, it is important that residents and ratepayers are aware of the costs imposed on Council by external agencies. Cost details for the relevant significant activities are highlighted in Section 5. Community Expectations and Focus on Core Infrastructure Generally, Waipa residents have high expectations about the standard and quality of facilities and services provided by Council. The quality of the Cambridge CBD upgrade, development at Karapiro Domain, Te Awamutu Events Centre, Cambridge Town Hall upgrade and the new Te Awamutu public toilets are evidence of those expectations and standards. When planning for the future, community expectations tend to lead to new services and increased levels of service. The recent introduction of kerbside recycling is an example of a new service and this Plan includes a proposal for a significant service level increase to the current bus services connecting Cambridge and Te Awamutu/Kihikihi with Hamilton. Both of these services provide significant environmental and economic benefits to the community, but they result in increased levels of rates. However, Council supports such initiatives from a sustainability perspective because the long‐term benefits, such as reduced waste to landfill, are expected to significantly exceed the costs.

68 Waipa District Council
Council’s capital works programme is heavily focused on network infrastructure – particularly water, wastewater and roads. This is important because of the need to maintain and develop the assets that support the delivery of essential services. Council recognises this need and the importance of not under‐funding development of core assets which might otherwise create an affordability burden for future Councils and ratepayers. Council also acknowledges that wellbeing is linked to the suitability and availability of community facilities. However, in the same way that major network infrastructure has been duplicated across the District (between Cambridge and Te Awamutu), there is an expectation that community facilities will continue to be duplicated. Such expectations come at a very high cost, so it is important that communities are aware of the cost and, in turn, have the opportunity to consider what level of service they want to fund. When considering new or enhanced community facilities, Council will consider opportunities for complementary service provision between Cambridge and Te Awamutu working with stakeholders to promote more efficient use of existing facilities and entering into partnerships for the provision of community facilities. A focus on maintaining core infrastructure will mean ‘nice to have’ infrastructure, such as community facilities, can only be developed as priorities and funding allow. Affordability issues dictate that only two or three major community projects will be able to be advanced in any 10‐year period. Residents need to share their views as to what those projects should be. Natural and Cultural Heritage The protection of landscapes, lakes, waterways and indigenous forest are important issues for Waipa as it is these natural features that contribute to making Waipa District a unique and special place. Council, in partnership with community groups and government agencies, has a long history in protecting and enhancing the District’s natural heritage and biodiversity. The District also has a rich and unique cultural heritage, with early Māori settlement dating from the 15th Century and European settlement in the 1800s. While Waipa was the location of several major pre‐European tribal battles, it is the land wars of the mid‐1800s that featured prominently in shaping New Zealand as a nation. The development of the District, and the people who have played a significant role in that process, forms part of our heritage. It is this rich cultural heritage that, in part, prompted Council to assume operation of the District’s two museums (Cambridge and Te Awamutu) and to provide support funding for the operation of the Pirongia Historic Visitor Centre. Council’s involvement in heritage activities is being advanced as part of a Heritage Policy and Implementation Strategy. This policy and strategy are due to be reviewed over the next two years, 2010/11‐2011/12. Most of Council’s work in heritage is undertaken in partnership with community groups and other agencies. There are a large number of opportunities in the area of heritage so there tends to be more worthwhile initiatives than available funding. Given these pressures, Council proposes to focus its heritage activities in the following areas:
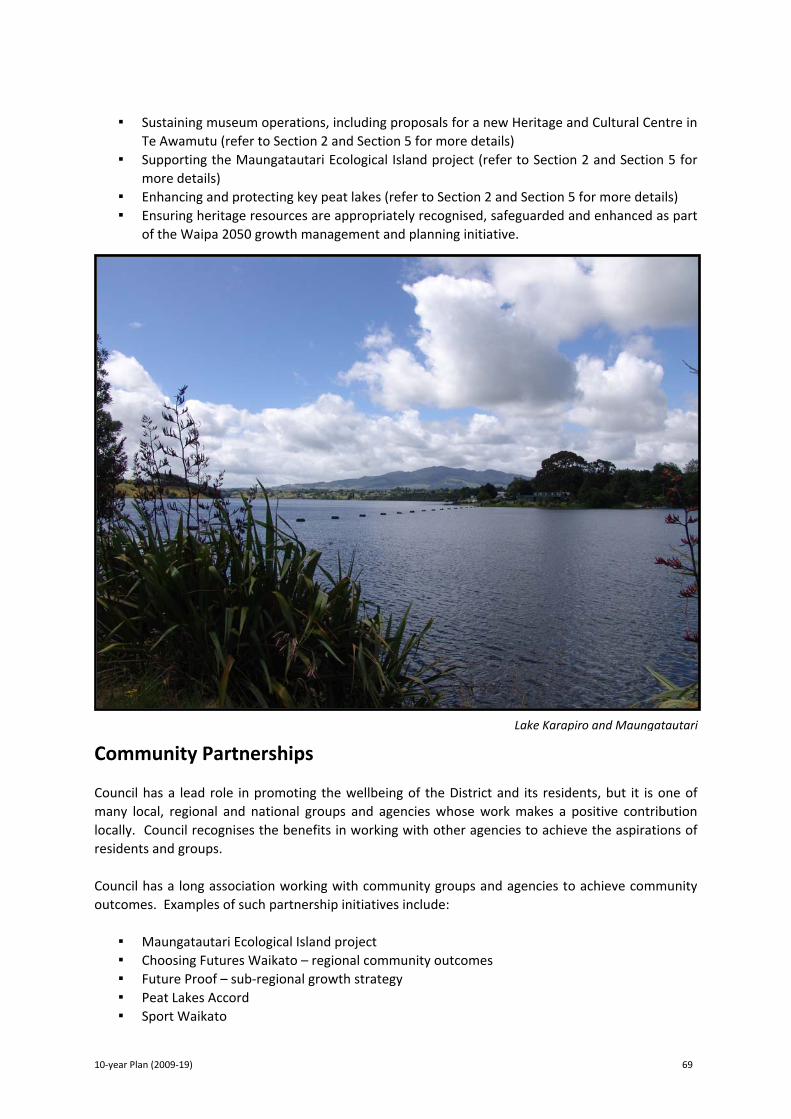
10‐year Plan (2009‐19) 69
▪ Sustaining museum operations, including proposals for a new Heritage and Cultural Centre in
Te Awamutu (refer to Section 2 and Section 5 for more details) ▪ Supporting the Maungatautari Ecological Island project (refer to Section 2 and Section 5 for
more details) ▪ Enhancing and protecting key peat lakes (refer to Section 2 and Section 5 for more details) ▪ Ensuring heritage resources are appropriately recognised, safeguarded and enhanced as part
of the Waipa 2050 growth management and planning initiative.
Community Partnerships Council has a lead role in promoting the wellbeing of the District and its residents, but it is one of many local, regional and national groups and agencies whose work makes a positive contribution locally. Council recognises the benefits in working with other agencies to achieve the aspirations of residents and groups. Council has a long association working with community groups and agencies to achieve community outcomes. Examples of such partnership initiatives include:
▪ Maungatautari Ecological Island project ▪ Choosing Futures Waikato – regional community outcomes ▪ Future Proof – sub‐regional growth strategy ▪ Peat Lakes Accord ▪ Sport Waikato
Lake Karapiro and Maungatautari

70 Waipa District Council
▪ Information Centres ▪ Waikato Triennial Forum ▪ New Zealand Police ▪ Te Awamutu Safer Community Trust ▪ Te Awamutu Events Centre ▪ Karapiro Domain development ▪ Kihikihi Domain management ▪ Civil Defence Emergency Management
The pressure on resources is increasing as funding becomes more difficult to obtain, so doing more with the available resources is essential. Partnership and joint initiatives are opportunities to do more. As a result of the review of the Waipa community outcomes, Council is proactively fostering relationships with stakeholders and a plan to support this is currently being prepared. Cost Pressures Council, like other businesses, is subject to the effect of inflation on the activities and services undertaken. In recent years general inflation has been about 3%, which means, in general terms, that a 3% increase in rates each year has been necessary to maintain existing levels of service. In recent years Council has moved to minimise this inflationary pressure by increasing efficiencies. There are areas of Council operation, particularly infrastructural services (such as water, wastewater and roads), where increases in the cost of energy, materials and contract services are significantly greater than the average rate of inflation. Projections indicate that the cost of materials and services will continue to rise faster than general inflation, placing further pressure on Council’s ability to contain rates without compromising the standards of service. While it is Council’s priority to maintain levels of service, some desirable work, such as that required to assure the integrity of infrastructure, is not expected to be undertaken. Not doing this work increases the risk of infrastructure failure and a possible temporary reduction in the level of service provided. Maintenance of roads has reached a level that Council considers to be unsustainable, as levels of funding in recent years has not been sufficient to prevent further deterioration of the road network. This position is supported by residents who, through the annual community satisfaction survey, have signalled increased levels of dissatisfaction. Significantly increased expenditure levels have been signalled in this Plan to address this, although the level of funding is such that recent cost increases have eroded its full value. The level of funding is considered the maximum affordable at this time, although Council anticipates scope for further funding increases in the latter part of the 10‐year period. The level of achievement will be assessed annually, including determining resident satisfaction levels and funding levels reviewed accordingly. Council is managing these risks through the asset management programmes and financial strategies set out in this Plan. Specific risks are highlighted in Section 5. Monitoring levels of service and performance will help Council identify and adjust funding priorities in future years.

10‐year Plan (2009‐19) 71
Council’s Role – Links to Strategic Planning
While the issues, outlined on the previous pages, provide the context for Council decision‐making, the community outcomes serve as a basis for Council activities. They also provide guidance and alignment for other strategic planning documents that Council has or will develop in the future. The 10‐year Plan provides the basis for proposing and securing the resources needed to implement the strategic documents. For example, the policies and objectives of the Strategic Plan, District Plan, Community Leisure Plan and Asset Management Plan should be aligned with the principles of the 10‐year Plan and the community outcomes. Synergy between these documents will ensure consistency of Council’s policy initiatives and decision‐making. As well as the 10‐year Plan, Annual Plan and Annual Report, the other key plans prepared by Council include: Strategic Plan This sets the vision, overall direction and framework for Council’s
activities.* District Plan This is a base document for Council in its guidance of development
in the District in compliance with the Resource Management Act 1991 and its 2005 and 2006 amendments.
Asset Management Plans and Activity Management Plans
These have been developed over a number of years in the main areas of physical service provision by Council (i.e. water supply, stormwater, wastewater treatment and disposal, transport management).
Reserve Management Plans Council has developed several plans over the last few years in line with the Reserves Act 1977.
* The Strategic Plan is currently being prepared, and is expected to be confirmed mid‐2009. An outline of the draft Strategic Plan is given
below.
Strategic Framework
WAIPA HOME OF CHAMPIONS THE GREAT PLACE TO LIVE, WORK AND PLAY
Heritage Strategy
Creativity Strategy
Leisure Strategy
Cycling and Walking Strategy
Environment Strategy
Waipa 2050District Growth
Strategy
Vibrant and Creative Waipa
Healthy and Active Waipa
Economically Secure Waipa
Environmentally Sustainable Waipa
Economic Development and
Promotions Strategy
Transport Strategy
Community Outcomes / Strategic Intent
Key Strategies
Wellbeings ECONOMIC CULTURAL SOCIAL ENVIRONMENTAL
Vision and Purpose

72 Waipa District Council
The strategies, listed on the previous page, represent the key elements of Council’s strategic framework and will set the priorities and direction Council intends to take in promoting the wellbeing of Waipa District. These strategies provide the link between community outcomes and Council’s significant activities. Work on the District Growth Strategy and Environment Strategy is currently underway, with both expected to be completed in 2009. The Cycling and Walking Strategy was prepared in 2008. Council has a Heritage Strategy and Leisure Strategy (Community Leisure Plan), but these will require review in the context of Council’s updated strategic direction. The remaining strategies are expected to be developed by 30 June 2011. The key Council documents, as outlined on the previous page, and their link and contribution to the community outcomes process, is illustrated in the following diagram. Community Outcomes Process and links to Council’s Strategic Documents
COMMUNITY OUTCOMES(6 yearly)
WORK PROGRAMMES OF CONTRIBUTING AGENCIES
MONITORING REPORTS(3 yearly)
Monitoring of progress towards achievement of community
outcomes
COUNCIL’S STRATEGIC PLAN
10‐YEAR PLAN(3 yearly)
DISTRICT PLANASSET MANAGEMENT
PLANS
ANNUAL REPORT ANNUAL PLAN
What Council did compared to what it said it would do on an
annual basis
What Council will do on an annual basis
What Council departments will do towards achieving Community Outcomes
Local Government Central Government Maori NGOs Private Sector Other
Facilitated by Council / Regional Council
STATE OF THE DISTRICT REPORT

10‐year Plan (2009‐19) 73
Key Achievements 2006‐2009
All of the activities, services and projects undertaken (or supported) by Council are intended to improve the social, cultural, economic and environmental wellbeing of the Waipa community. Since the adoption of the 2006‐16 10‐year Plan a number of key initiatives have commenced and/or been completed, with each making a significant and positive contribution to community wellbeing. These initiatives are listed below: Heart of Te Awamutu Project The purpose of this project, which was initiated in 2007, is to prepare a long‐term development plan for the central area of Te Awamutu. The key outputs of the Plan will be a design concept to guide future development and a prioritised programme of works. To assist in preparing the Plan, Council established a Steering Group who then invited community input and feedback on initial proposals and used the information to prepare a draft Concept Plan and Programme of Works. These were subject to a full public consultation process and Council confirmed the Plan (with amendments) in August 2008 following consideration of submissions. In 2008/09 available funding means that Council is able to progress two projects – the Walk of Fame and an enhancement of Alexandra Street. The timing of further projects is subject to confirmation as part of this 10‐year Plan. Waste Management and Recycling In June 2005 Council adopted a Waste Management Plan that set out Council’s intended role with regard to waste management services in the District. This included a decision that refuse collection services should continue to be provided by private companies. Council’s role would be to protect and promote public health and minimise nuisance, while ensuring residents had access to appropriate refuse collection and disposal services. The Waste Management Plan included a commitment by Council to establish a kerbside recycling service for urban areas, which commenced in March 2007. In addition to that a kerbside service for rural households commenced in July 2007. Streetsmart Limited is contracted by Council to undertake the recycling work, with the charge for 2008/09 being $50.00 for each rural and urban household. All households in the District now have access to a regular collection service and the 2008 community (National Research Bureau (NRB)) survey showed a 90% satisfaction level for those using the service. Council has entered into a short‐term arrangement with EnviroWaste to ensure residents have continued access to the Cambridge refuse transfer station which is owned and operated by EnviroWaste. This arrangement will expire at the end of June 2009 and before then Council will consult with Cambridge residents regarding the future of the facility and associated costs (and their funding) for maintaining appropriate levels of service.

74 Waipa District Council
Karapiro Domain Development Work is progressing on the development of the Karapiro Domain in general accordance with the Strategic Plan adopted by Council in 2005. Designs and concept plans have been finalised, with the staging of development to coincide with the World Rowing Championships at Lake Karapiro in 2010. Council’s focus is to ensure the nature of the development serves the wider community, rather than any particular interest group. A new entrance road, new toilet and shower block in the lower camping ground and embankment improvements have been completed. Designs for a new events/community centre, to replace the existing sports complex, are being finalised, and construction is scheduled to commence in March 2009. In July 2008, construction commenced on a High Performance Centre (funded by Rowing NZ) and it is due for completion in March 2009. It will be the base for all New Zealand representatives for their summer and winter preparation and will be available to other sports for short term training programmes. Cambridge Community Pool A heated covered swimming pool for Cambridge was a key inclusion in the 10‐year Plan 2006‐16, reflecting Council’s commitment to meet the expectations of the Cambridge community. A concept design for constructing a new facility on the existing Williamson Street site has been completed, with a projected cost of $15.1 million ($1.1 million of which is inflation). The design includes four separate water spaces providing the variety of water depths and temperatures required to meet a range of community needs, from toddlers through learn to swim, fitness and training to therapeutic exercise. The complex will be covered to maximise year round use whilst the design will optimise indoor outdoor flow for the warmer months. Final design work will be completed by 30 June 2009. The community fundraising efforts have commenced and this work is being managed by Compton Fundraising consultants. Infrastructural and Asset Upgrades The provision of many of Council’s core services is reliant on infrastructural assets, such as water/wastewater treatment plants and reticulation networks. Maintaining the integrity of these assets is critical to achieving levels of service. Key projects completed over the last three years include: Water Supply
▪ Renewals of trunk mains in Te Awamutu, Cambridge and Leamington ▪ District wide renewals and upgrades ▪ Kihikihi and Cambridge north reservoirs ▪ Te Tahi water treatment plant upgrade

10‐year Plan (2009‐19) 75
Wastewater
▪ Kihikihi wastewater scheme and connection to Te Awamutu ▪ Kihikihi Road rising main upgrade ▪ District wide minor and major renewals and upgrades ▪ Christie Avenue pump station upgrade ▪ New sewer rising main in Cambridge north ▪ Wastewater treatment plant minor upgrades ▪ Pump station upgrades ▪ Thornton Road sewer reticulation
Stormwater
▪ Lake Te Ko Utu stormwater diversion and gross litter trap installation ▪ Pakura Street stormwater upgrade ▪ Factory Road stormwater realignment and renewal
Transport
▪ Installation of flag lights at over 60 rural intersections ▪ Completion of 10kms of seal extensions across the District ▪ District wide road safety initiatives ▪ Completion of 10.7kms of footpath extensions
District Plan Review (Waipa 2050) The existing Waipa District Plan, which provides a framework for managing the use, development and protection of natural and physical resources, became operative in December 1997. The Resource Management Act 1991 requires Council to commence a review of the District Plan within 10 years of its operative date. This review commenced in 2007 and it will take up to four years to complete at an estimated cost of $1.7 million. This review incorporates various projects including a new Growth Strategy for the District, completing a State of Waipa District report, an Environmental Strategy and Town Concept Plans for Cambridge, Te Awamutu/Kihikihi, Pirongia and Ohaupo. Collectively this initiative is known as ‘Waipa 2050’. The first project in the review is the preparation of a District Growth Strategy, with the initial stages involving the preparation of base case information which sets the scene by documenting Waipa District today and identifying issues and opportunities that need to be addressed. Growth scenarios which describe possible futures have been developed and consulted on. These scenarios were supported by maps showing possible growth areas. As a result of initial consultation, a preferred scenario was identified from which a draft Growth Strategy was developed. Following Council approval, the draft Growth Strategy was released in March 2009 for public comment and feedback. A key phase of the Waipa 2050 project is the development of Town Concept Plans for Cambridge, Te Awamutu/Kihikihi, Pirongia and Ohaupo. Scoping for this work is currently underway, with final Concept Plans expected to be adopted by Council in mid‐2009.

76 Waipa District Council
A draft State of Waipa District report, which shows progress towards the achievement of community outcomes, has been prepared. The draft is expected to be considered by Council in February/March 2009. Scoping for the preparation of an Environmental Strategy is underway. The Strategy will provide the strategic/policy guidance for the preparation of a new District Plan. Sub‐Regional Growth Strategy (Future Proof) Waipa District Council is working in partnership with Environment Waikato, Hamilton City and Waikato District Councils to develop a growth strategy for the sub‐region. The need for an integrated approach to planning for and managing growth has been highlighted by ongoing high levels of growth in recent years. The councils want to take a strategic approach that ensures land resources are used efficiently, are integrated with transportation requirements and associated infrastructure implications are understood, planned for and appropriately funded. A scoping report was completed in 2007 and research completed in 2008. Growth scenarios were prepared and consulted on in October 2008 and work towards the development of the strategy is now underway. The strategy will establish a 50‐year land‐use/settlement plan for the sub‐region, with associated future road network and general infrastructure needs identified. A draft strategy was finalised in March 2009 and subsequently made available for public comment in conjunction with the draft Waipa District Growth Strategy and Council draft 10‐year Plan. Key information from the development of the sub‐regional growth strategy has been used to support the preparation of the draft 10‐year Plan as well as guiding the development of the draft Waipa District Growth Strategy. Footpath Development In 2002, following strong support from the Cambridge community, Council embarked on a $1 million 5‐year footpath development programme in Cambridge. A similar programme is underway in Kihikihi, following the completion of the wastewater scheme. The long term goal of the footpath programme is to ensure that every residential street in major urban areas has a footpath on at least one side of the road and significant progress has been made in terms of achieving this. Between 2006‐09, 12kms of new footpaths were constructed in Cambridge, Te Awamutu, Kihikihi and Pirongia. Maungatautari Ecological Island Project Council is responsible, by way of agreement with the Department of Conservation, for the management of the Maungatautari Scenic Reserve. The Maungatautari Ecological Island project has seen the Scenic Reserve enclosed within a mammalian pest‐proof perimeter fence, constructed by the Maungatautari Ecological Island Trust (MEIT). Council recognises the significant value of this project in terms of improving the environmental and economic wellbeing of the District and continues to work with MEIT, Environment Waikato (EW) and the Department of Conservation (DoC) to maximise the value of this initiative and ensure its sustainability.

10‐year Plan (2009‐19) 77
With the completion of the pest‐proof fence the Trust’s focus shifted to pest eradication which has now been largely achieved. The success of the pest eradication programme has enabled the Trust to focus on the reintroduction of native fauna. Council, along with EW, has provided ongoing financial support, as well as continuing with the provision of supporting infrastructure and administration. Assuring the ongoing sustainability of the project is a priority for Council. This project has also been assisted through the upgrade of Tari and Hicks Roads which provide direct access to the mountain. Progress is also being made towards completing parking and public toilet facilities at the southern entrance on Tari Road. Cambridge Museum In line with an agreement with the Cambridge Historical Society, responsibility for the management and operation of the Cambridge Museum has transferred to Council. This arrangement will ensure that residents of Cambridge (and the District) have continued access to a quality museum service in Cambridge. Ownership of the museum collection remains with the Historical Society. In 2008 upgrades to the reception area and associated facilities were undertaken. In addition, a major upgrade of the collections store has been completed. Communities for Climate Protection Programme Council is participating in the Communities for Climate Protection – New Zealand (CCP‐NZ) programme which helps councils and communities to reduce greenhouse gas emissions and the impacts of those emissions. In many cases initiatives undertaken will make good economic sense, as well as having an environmental benefit. The CCP‐NZ programme is based on a framework of Council achieving five milestones:
▪ Conduct a greenhouse gas emissions inventory, analysis and forecast; ▪ Set emissions reduction goals; ▪ Develop a local action plan to achieve these goals; ▪ Implement and quantify the benefits of policies and measures in the action plan; and ▪ Monitor progress towards achievement of the reduction goals.
Council has completed Milestone 1 for the project – completing a greenhouse gas emissions inventory, analysis and forecast. The next phase of the programme is to identify targets for the Council and community and establish an action plan to achieve those targets. Bylaws Review In 2004/2005 Council embarked on a complete review of all 23 of its existing Bylaws, a requirement of the Local Government Act 2002. The purpose of the review was to determine whether the issues for which the existing bylaws were needed were still relevant and, if so, whether new bylaws were the best way of dealing with them. The review, which was completed in 2008, resulted in Council revoking all 23 of the existing bylaws and adopting 14 new bylaws.

78 Waipa District Council
Cambridge Area Traffic Study In response to ongoing concerns about congestion and safety issues on the local and state highway road network in the Cambridge area, Council commissioned a study to:
▪ Identify the traffic impacts of the Cambridge Bypass; ▪ Identify any minor network improvements; ▪ Establish if there was a need for a full interchange on the Bypass at Hautapu; ▪ Determine whether a third bridge across the Waikato River is required; and ▪ Investigate and recommend a road network infrastructure strategy.
The traffic study confirmed that the Cambridge Bypass was critical for resolving traffic congestion within Cambridge. The commissioning of OPUS by the NZ Transport Agency has seen considerable progress on design options, with design work expected to continue into 2009/10. The work includes the design for Hautapu interchange. The report concluded that the a third bridge in Cambridge was unlikely to be needed for at least 20‐30 years on the basis that the Cambridge Bypass would significantly reduce congestion. Consideration of the location of a third bridge is part of the process of reviewing the Waipa District Plan. Council is working with the NZ Transport Agency to identify and implement action to improve the safety of all road users in and around State Highway 1 through Cambridge.
Leamington Main Street Upgrade As a result of submissions from the community in 2007/08, Council is embarking on an upgrade of the road and streetscape in the commercial area of Shakespeare Street. The design and associated consultation has been completed and the necessary land secured to accommodate the upgrade. Works are underway and are expected to be completed by September 2009.

10‐year Plan (2009‐19) 79
Community Satisfaction Survey Results
Each year Council measures community satisfaction with a number of Council provided facilities and services as well as a range of ‘quality of life’ issues in the District. The survey is undertaken by an independent research company, the National Research Bureau (NRB). NRB conducts telephone interviews with around 400 residents in proportion to the relative population of each of the District’s five Wards. The survey is conducted in June each year. 2008 Results In 2008 the top rated facilities and services within the District were:
FACILITIES AND SERVICES 2008 2007
1. Parks and Reserves 90% very/fairly satisfied 90%
2. Recycling Services 90% very/fairly satisfied N/A
3. Library Services 82% very/fairly satisfied 77%
4. Dog Control 82% very/fairly satisfied 75%
The main areas of concern about facilities and services within the District were:
FACILITIES AND SERVICES 2008 2007
1. Parking in Cambridge & Te Awamutu 28% not very satisfied 28%
2. Maintenance of Roads 24% not very satisfied 17%
3. Safety of Roads 21% not very satisfied 19%
4. Swimming Pools 20% not very satisfied 20%
5. Maintenance of Footpaths 17% not very satisfied 19%
In preparing this Plan, Council has had regard to the levels of dissatisfaction noted above and, where possible, is proposing activities and initiatives aimed at addressing the concerns raised by residents. The annual survey will continue to be used as a tool for improving services to meet community expectations, including performance targets.

80 Waipa District Council
Highlights of Council Planned Activities 2009‐2019
Heart of Te Awamutu Project Council has confirmed the concept plan and the priority order for a list of projects for the Heart of Te Awamutu project. From the outset, this initiative was acknowledged as a blueprint for the long term development of central Te Awamutu. The prioritised project list is provided below (showing three priority project groupings, with highest at the top), with the intention that work will be undertaken as funding is confirmed through this 10‐year Plan and future annual and 10‐year plans. It is expected that completion of all of the projects will take 20‐30 years. Project List and Prioritisation PROJECT NAME DESCRIPTION ESTIMATED
COST $ (2008)
Walk of Fame Build a walk of fame within Selwyn Park from St Johns towards the Events Centre. Landscape path and pou features.
$250,000
Alexandra Street upgrade Enhanced pedestrian amenity and spaces. Upgrade street feature paving areas, street furniture, landscaping and lighting.
$380,000
Cultural Centre New cultural centre and associated landscaping. Facilities could include museum, art gallery, performing arts centre, conference facilities.
$12,450,000
Events Centre / Cultural Centre Carparking
Carparking to service the Events Centre expansion and the museum.
$350,000
Te Awamutu Community precinct – landscaping and paving
Landscaping, including paving and planting, of Gorst Avenue, Selwyn Lane, Selwyn Park and the Rose Gardens.
$250,000
Transport facilities New bus stop and bus shelter down Gorst Avenue adjacent to the Information Centre.
$75,000
Arawata Street town centre gateways
Planting, signage and possible feature art at town entry point. $400,000
Sloane Street town centre gateway
Planting, signage and possible feature art at town entry point. $200,000
Market Street upgrade Upgrade of the paving, street furniture, landscaping and lighting. Relocate kerbline to increase width of footpath. Kerb extensions to improve pedestrian connections.
$900,000
Town Centre CCTV Supply and install CCTV in the town centre. $50,000
Wellness Centre New Wellness Centre to house community facilities, including Plunket.
$1,460,000
Playground Construct a challenging adventure playground close to the Rose Gardens and integrated with the local landscape, trees and riverbank.
$390,000

10‐year Plan (2009‐19) 81
Mahoe Street upgrade Upgrade of the paving, street furniture, landscaping and lighting.
Kerb extensions to improve pedestrian connections. Underground overhead powerlines.
$2,820,000
Library expansion Expand the existing library into the existing museum building. $715,000
Town centre focal points Feature art or feature structures. Possible locations include the Arawata town entrance, the Arawata/Alexandra Street roundabout and the corner of Selwyn Lane/Gorst Avenue.
$860,000
Churchill Carpark layout and connection
Upgrade the Churchill Street carpark by improving the carpark layout and signage. Improve the pedestrian linkage from Alexandra Street to Selwyn Lane. This may involve a new, wider pedestrian walkway from Alexandra Street into the carpark and extending the walkway to Selwyn Lane.
$2,500,000
Links to Albert Park (SH3 pedestrian refuges)
Construct pedestrian refuges on SH3 adjacent to Albert Park. $25,000
Pioneer Walk Complete the paving of river walkways and install signage. Complete some landscaping and vegetation control.
$95,000
Climax steam engine Create a site for the renovated Climax stream engine. $78,000
Events Centre expansion Building expansion so centre can accommodate national and greater local competition.
$4,000,000
Albert Park carparking and camper van facility
Surface the Sculpture Park carpark. Allow camper vans to park overnight. Carparking management plan for Albert Park.
$60,000
External gateways New town entrances (planting and signage) on SH3 (south and north). Underground power.
$1,500,000
Sloane Street to The Warehouse pedestrian link
Improve pedestrian linkage from Sloane Street to The Warehouse by making walkways clear and safe, pavement marking to help separate traffic and pedestrians and signage to assist with way finding.
$100,000
KEY
Highest priority Medium priority Low priority
In finalising the concept plan and priority list, Council confirmed that the Walk of Fame and an enhancement of Alexandra Street were projects to be advanced in 2008/09. The design concept for the Walk of Fame has now been approved, with work expected to be completed by 30 June 2009. In line with Council’s decision not to proceed with diverting trucks from Alexandra Street, the scope of the proposed Alexandra Street upgrade was substantially reduced and now covers:
▪ Upgrading kerb and channel drainage ▪ Install new litter bins, seating and low fencing around pedestrian crossing points ▪ Extending footpath paving from Churchill Street to the Te Awamutu Courier building ▪ Install feature paving around new seating and pedestrian crossing areas ▪ Upgrade lighting along central median
The project budget for 2008/09 is $380,000 and this 10‐year Plan includes further funding in 2009/10 to upgrade underground services in Alexandra Street, as well as an additional $645,000 to advance Heart of Te Awamutu projects. The upgrade work proposed for 2008/09 will need to be aligned with work signalled for 2009/10 to ensure minimum disruption occurs and maximum value is achieved.

82 Waipa District Council
A key project within the Heart of Te Awamutu initiative is a new Heritage and Cultural Centre which this Plan proposes will be completed in 2016 at a projected cost of $14.2 million (adjusted for inflation). It is proposed that the Centre be a facility that showcases local art and cultural activities and the District’s rich heritage. It would replace the existing Museum, but also provide facilities for performing and visual arts. Council envisages that the Centre will be of a standard that reflects the significance of local heritage, providing an outstanding interactive experience for visitors and establishes Te Awamutu as visitor destination – a facility that residents get great benefit from and be proud of. This is a preliminary proposal, which will require further work, including stakeholder and public consultation, in order to confirm the full scope and extent of any such facility before a final decision to proceed is made. It is proposed that 33% of the cost of building the facility will be funded externally from Council. Waste Management and Recycling The new Waste Minimisation Act has recently been passed into law. The Act introduces a range of new requirements aimed at achieving waste reduction in line with the Government’s waste strategy. Provisions include producer responsibilities and the introduction of waste levies. The impacts of these new provisions are being assessed, although revenue from waste levies (in the order of $130,000 per annum) is expected. This revenue is required to be directed to waste minimisation initiatives as signalled in Council’s Waste Management Plan which details a range of waste minimisation initiatives and is due for review before June 2010, within the period required by the new Act. Current economic conditions mean that prices received for some recycled materials have dropped significantly. These prices are not expected to increase significantly in 2009. Council recognises the cost pressure this places on Smart Environmental Limited (who Council contracts to provide the recycling service) and will work with the company to ensure continuation of this well‐supported service. Council will enter into an arrangement with EnviroWaste (reviewed annually) to ensure residents have continued access to the Cambridge Refuse Transfer Station which is owned and operated by EnviroWaste. The cost of this arrangement is in the order of $28,000 per annum, and is considered to be the most cost‐effective option for maintaining public access to a local refuse transfer station. Karapiro Domain Development Over the next 6 years $8.7 million is to be spent completing the development of the Karapiro Domain, with a further $2.9 million to develop a new general reserve facility south of the rowing course. This is in line with the Karapiro Strategic Plan adopted by Council and relies on extensive external funding to be completed. Undertaking these projects is contingent on the necessary funding being in place. Rowing NZ is developing and funding its own facilities at Karapiro. Council‐initiated projects have wide community value, rather than supporting any particular user group or activity. The timing of the completion of the majority of these facilities is prior to the World Rowing Championships in 2010.

10‐year Plan (2009‐19) 83
In 2009 the following projects are expected to be completed: construction of a new events and community centre; constructing two new toilet blocks; establishing a new southern entrance; alterations to the Rob Waddell Lodge; installation of grandstand seating; and replacement of the St John’s emergency facility. Cambridge Community Pool A heated covered swimming pool for Cambridge was a key inclusion in the 10‐year Plan 2006‐16, reflecting Council’s commitment to meeting the expectations of the Cambridge community. Council has confirmed that design of the Cambridge pool project proceed with a projected cost of $15.1 million (which includes $1.1 million inflation). The design will be completed on the basis that a new pool facility will be constructed within the general footprint of the existing 50 metre outdoor pool which will be demolished. The facility is to provide a 25 metre x 8 lane fitness pool, a leisure/therapy pool, a learn to swim water space and a toddler/babies area. The new facility, which will be for all year round use, will be designed to enhance the indoor‐outdoor connection that is a key advantage of the Williamson Street site. A key success factor for the proposal is the need for the community to raise a third of the funding required, of which 75% must be secured before construction can commence. This Plan signals the commencement of construction of the new facility in 2012/13, with the ongoing maintenance of the existing 50 metre pool in the interim. Infrastructural and Asset Upgrades The provision of many of Council’s core services is reliant on infrastructural assets, such as water and wastewater treatment plants and their associated reticulation networks. Maintaining the integrity of these assets is critical to maintaining levels of service. Council has taken a balanced approach having regard for both risk and affordability and is not signalling any significant reduction in the level of services. However, the level of funding available to support the maintenance and development of infrastructure is less than is desirable. The consequence of this is an increased risk that infrastructure will not be able to support the service to the standard expected. The details of this risk and how Council intends to manage it are outlined in Section 2 and Section 5. District Plan Review (Waipa 2050) The District Plan review programme anticipates the District Growth Strategy will be adopted by Council in mid‐2009. This will be preceded by an extensive consultation process which also includes the sub‐regional growth strategy (Future Proof). These strategies will set the long‐term growth plans for the District and specify the location and timing of development through to 2050. The implementation of the District Growth Strategy will be primarily through the District Plan which will be reviewed in 2009/10.

84 Waipa District Council
In addition to the District Growth Strategy, Waipa 2050 includes the development of Town Concept Plans for Cambridge, Te Awamutu/Kihikihi, Pirongia and Ohaupo. These Plans will provide a ‘blueprint’ for the long‐term development of each urban area and will be incorporated into the updated Waipa District Plan. A review of the Cambridge Greenbelt Reserve Management Plan will be coordinated with the process of developing the Cambridge Town Concept Plan. The Town Plans are expected to be confirmed by September 2009. The final element in the Waipa 2050 work programme is the development of an Environment Strategy. The purpose of the Strategy is to identify key sustainability principles and to use these to provide strategic direction for the District. The Strategy, which is scheduled to be confirmed in mid‐2009, will assist the Council and the community to move towards a more sustainable future. The process for developing the draft Strategy will be a collaborative one with the involvement of local Iwi/hapū and key stakeholder agencies and groups. Sub‐Regional Growth Strategy (Future Proof) As a result of the Future Proof project an agreed growth strategy for the sub‐region will be adopted. This Strategy will provide the broad growth management framework for the region which the District Growth Strategy will need to be aligned with. For this reason the draft District Growth Strategy was developed alongside Future Proof, with both made available for public comment at the same time as the draft 10‐year Plan (during March/April 2009). The Future Proof Strategy will be confirmed by partner Councils in June 2009. Peat Lakes Accord The purpose of the Accord is to enable the various government agencies and stakeholder groups to work cooperatively to protect and enhance the Waipa peat lakes. In 2005 Council entered into an agreement with Environment Waikato for a six‐year restorative programme focusing on Lakes Ngaroto, Serpentine, Rotomanuka, Maratoto and Mangakaware. 2009/10 is year four of the programme. The wet 2008 winter has highlighted the sustainability challenges associated with farming within the catchments of peat lakes with substantial areas of farm land flooded around the margins of these lakes. Discussions are underway with a number of landowners to acquire land adjacent to lakes Ngaroto, Serpentine and Maratoto for inclusion within the reserve areas. An intensive monitoring programme on Lake Ngaroto has commenced, including water quality sampling and water level monitoring. A water quality and climatic monitoring buoy will be positioned in the Lake in 2009. The monitoring information gathered will be considered in establishing a long‐term management programme for the Lake which will ensure its sustainable management. Waipa/Cambridge Integrated Transport Strategy Following on from the Cambridge Traffic Study, the New Zealand Transport Agency (NZTA) has agreed to fund the development of a Transport Strategy for the District with the initial focus being on the Cambridge area. The purpose of the Strategy is to integrate land‐use, growth management, infrastructure as it relates to transport planning to ensure that a sustainable transportation network and service delivery framework are achieved.

10‐year Plan (2009‐19) 85
This project is essential given the expected level of infrastructure development, population growth and the need for more sustainable approaches to transportation planning and service delivery. A draft Strategy is expected in the latter half of 2009. Maungatautari Ecological Island Project Council, along with Environment Waikato (EW) and the Department of Conservation (DoC), are working with the Maungatautari Ecological Island Trust to ensure that it is able to continue its work. All parties agree that the significance of the project is such that its continuation is vital to realising the social, cultural, environmental and economic benefits. Council’s contribution to the project will be $300,000 per annum, with further funding to support roading and other community infrastructure programmed as required.
Maungatautari fence and bush

86 Waipa District Council
Water Supply Upgrades An additional source of water is required for the Te Awamutu/Pirongia water supply scheme to ensure continuity of supply as the towns continue to grow. The resource consent for the current source (Mangauika Stream) needs to be renewed in 2011. A production well located near the existing Te Tahi Water Treatment Plant has been completed, but testing has revealed it will not meet supply needs so further options will need to be considered. Improvements to the treatment, storage and raw water collection are planned for the Te Awamutu water supply over the next 10 years. The Karapiro and Alpha Street plants, servicing Cambridge, will have work done on them to improve the quality and reliability of the water treatment process. Some additional capacity for Cambridge water supply and for treated water storage is included within the first five years of this Plan. Hicks Road treatment plant, which services the greater Cambridge area, is currently being upgraded to ensure the water meets the New Zealand Drinking Water Standards. The improvements, which are planned in a staged manner, are considered to be affordable and enable Council to work towards achieving practical improvements in the quality of drinking water in line with the New Zealand Drinking Water Standards. Waipa has a high per capita demand for water, indicating that there are opportunities for using the existing water supply more sustainably. With existing capacity challenges and the need to invest in additional water infrastructure, Council is embarking on the development of a water conservation strategy so as to ensure more efficient use of the existing water resource. Being able to demonstrate that Waipa water consumers are responsible will support Council in securing the necessary resource consents. Reticulation Renewals Council is increasing the expenditure for replacing old water pipes, ensuring that risks of supply interruption are minimised as far as available funding allows. This work is expected to continue throughout the 2009‐19 period and well into the future. Cambridge Wastewater Treatment Plant Upgrade The Cambridge wastewater treatment plant has not consistently met the required discharge standards since it was upgraded in the 1990s. This, together with the recent and expected levels of growth, means that a new plant will be required within the next five years. This 10‐year Plan signals the construction of a new plant commencing in 2012/13 at a cost of $13.3 million. Communities for Climate Protection Programme Work is underway to finalise the process for completing milestone 2 and 3 – setting emmission reduction goals and a local action plan to achieve these goals. These milestones are expected to be completed in 2009/10 and will involve community and stakeholder input.

10‐year Plan (2009‐19) 87
Seal Extensions Council administers 1,058kms of roads, of which approximately 985kms are currently sealed. Approximately 32kms of the roads currently not sealed are considered inappropriate for sealing because of the high costs (including initial capital cost and ongoing maintenance costs), leaving 41kms that can be sealed. This Plan signals a seal extension programme of $7.1 million over the 10 year period, although no funding is signalled in 2009/10. The level of funding reflects a long‐standing community expectation that Council will continue to advance seal extension across the District. The approved level of funding will allow at least a further 18kms of road to be sealed over the 10‐year period. Cambridge Community Sports Hall Council has entered into a partnership with Cambridge High School for the provision of a community sports facility, located within the school grounds and managed by the school. This arrangement is considered the most effective to provide Cambridge residents with access to indoor courts. On the basis that the facility will be available for community use, Council has agreed to provide funding of up to $1.8 million. The funding will be by way of a loan, and construction is expected to start in 2009/10 (subject to all necessary approvals being in place). District Promotion Following a review of its promotion and economic development activities, Council has established a communications, business development and promotions portfolio (Communications and Marketing). This will ensure better coordination and integration of these activities and their alignment with Council’s strategic direction. An additional $100,000 is signalled in this 10‐year Plan to enable the level of staff resourcing required to support this initiative. The level of resourcing proposed is consistent with that provided in similar districts. A key responsibility of this team through to 2011 will be to review Council’s Promotion Strategy and to lead the development of a business and economic development strategy. Both initiatives will involve working with stakeholders to ensure future actions align with Council’s strategic direction and the expectations of the community. In 2010 the District will host the World Rowing Championships at Lake Karapiro. This is a major event, which will attract thousands of participants, supporters and visitors, all of whom can be expected to help boost the economy of the District and the region. Maximising the opportunities presented by this event will require a coordinated effort for which Council is expected to play a major role. Council has set aside funding to support events and promotional activities and any funding to assist in the promotion of or support the World Rowing Championships is expected to be provided from within this budget area. Public Transport In 2008 Council conducted a review of passenger transport services for the District in conjunction with Environment Waikato (EW). The review, which was prompted by the impending re‐tendering of the Cambridge‐Hamilton service, showed that there is demand for a higher level of service than is currently provided.

88 Waipa District Council
Based on community feedback it is proposed to provide an improved service between Te Awamutu/Kihikihi and Hamilton and Cambridge and Hamilton, with these services being integrated with Hamilton City services. These will be subsidised services and Council will fund 25% of the costs remaining after fares are deducted. Council’s share of the total estimated funding requirement is $115,000 per annum. While the proposed increase in the level of service accounts for part of the cost, the minimum standard for contracted bus services has increased and this makes up the balance. The services will be funded by way of a targeted ward rate, with the Te Awamutu, Kakepuku and Pirongia wards funding the proposed Te Awamutu/Kihikihi‐Hamilton service, and the Cambridge and Maungatautari wards funding the proposed Cambridge‐Hamilton service. Kihikihi Domain Strategic Plan and Reserve Management Plan Kihikihi Domain supports a wide range of recreational and sporting activities and is well suited for hosting national and international events, particularly equine‐related. Its status as a premiere site, particularly for polo and eventing activities is growing. The Domain is a recreation reserve and a reserve management plan, to guide the day‐to‐day management of it, is required. The increasing level and nature of use of the Domain meant that the current Management Plan needed to be reviewed and this process commenced in late 2008. In undertaking the review Council saw the opportunity to also develop a strategic plan, as it is timely to consider the long‐term development and management of the Domain. Key issues and opportunities for the Domain have been identified through discussions with key stakeholders. This information is being used to support the development of the draft Strategic Plan/Reserve Management Plan, which is expected to be available for public consideration from March‐May 2009. Following the consideration of submissions, the Plan is expected to be confirmed by Council in the latter half of 2009. Development projects signalled in the Plan will be considered as part of future annual and 10‐year plan processes.
Polo match at Kihikihi Domain

10‐year Plan (2009‐19) 89
Section 5 ‐ COUNCIL’S ACTION PLAN
In this section: Council’s Response Guide to Significant Activities Governance and Strategic
Direction Environmental Services Recreation and Heritage Amenity Services Transport Management Stormwater Water Treatment and Supply Wastewater Treatment and
Disposal Support Services

90 Waipa District Council
Council’s Response
Council’s vision, mission statement and goals and strategies all serve to reflect Council’s response to the community outcomes. The strategies are implemented by the activities and programmes. The following diagram depicts the process. Waikato Regional
Community OutcomesWaipa District
Community Outcomes
Other organisations and individuals (Waipa
community
Waipa District Council VisionHome of Champions
How Council expresses its response to the community outcomes
Waipa District Council Mission & Goals
What Council wants to achieve to meet the community outcomes
Waipa District Council Action Plan
Programmes and activities that align with the strategies
Waipa District Council Strategies
How Council will contribute to achieving community outcomes and the Council Vision
10‐year Plan (2009‐19) 91
Guide to Significant Activities
Council’s services are delivered within eight significant activity areas, each containing a number of lesser activities, which have been consolidated for the purposes of presentation in this 10‐year Plan. Significant activity has the same meaning and purpose as the term ‘group of activities’ as specified in section 10 of the Local Government Act 2002. For each significant activity this 10‐year Plan sets out:
The activities included in the significant activity. The assets required to support the activities and services, any anticipated changes in demand
for the service and the implications of such changes to Council’s service provision levels. The extent of Council involvement in each activity, including any legislative requirements and
how the activity contributes to the community outcomes identified by the Waipa community (see the diagram on the previous page).
Any possible negative effects that providing the services may have on the wellbeing of the community.
The timing of key actions or projects in the period 1 July 2009 to 30 June 2019. The District’s community outcomes which the significant activity relates to (see the diagram
on the previous page). The target levels of service and the performance measures by which the actual levels of
service can be assessed (see the diagram on the previous page). The estimated expenses of achieving and maintaining the proposed levels of service for each
activity. How the expenses are to be met and expected revenue levels, including the sources of funds,
e.g. rates, fees and charges. The significant activity groups included in this section are:
Governance and Strategic Direction Environmental Services Recreation and Heritage Amenity Services Transport Management Stormwater Water Treatment and Supply Wastewater Treatment and Disposal
Some changes have been made to the groupings and titles of the significant activities from those outlined in the 2006‐16 10‐year Plan, including the following:
Governance and Strategic Direction was formerly known as “Governance”; the change in title
reflects the inclusion of strategic planning, Waipa 2050 and Future Proof and community grants.
92 Waipa District Council
Amenity services have been split into two parts – Recreation and Heritage, and Amenity
Services. Recreation and Heritage covers parks and reserves, the Maungatautari Ecological Island Trust (MEIT) agreement and reserves management plan, Karapiro Domain, the District’s libraries, pools and museums, as well as heritage. Amenity services covers cemeteries, public toilets, properties, forestry, community services supports (grants), emergency management (rural fire and civil defence) and waste management.
Transport Management now includes the passenger transport subsidy. For each significant activity a range of targets and measures have been developed to show the standard of performance Council proposes over the next 10 years and the means by which Council intends to measure its performance. The measures, when considered collectively, are intended to provide a general view of the overall performance of Council in each significant activity area and encompass the elements of quality, quantity, cost, timeliness and location (if relevant). All of Council’s activities relate to community outcomes and these outcomes are shown in each of the significant activity areas detailed in this Section. Council is required to monitor progress towards the achievement of community outcomes and the indicators and measures that Council proposes to use for each community outcome are included in Section 4 of this Plan. Support services are those activities and areas within Council that support the delivery of services within each of the significant activities. While the costs of Support Services are included within each significant activity, they are also shown separately at the end of this section; this shows the indirect costs that underpin the significant activities. The credibility of the 10‐year Plan relies upon the alignment of Council’s services with community outcomes. The table on the following page shows the linkage between community outcomes and goals and Council activities.

10‐year Plan (2009‐19) 93
The Link Between Council Activities and Community Outcome Themes
Significant Activity Area
Services contributing towards Community Outcomes
Vibrant and Creative
Economically Secure
Environmentally
Sustainable
Healthy and Active
Governance
√ √ √ √
Strategic direction and planning
√ √
Governa
nce an
d Strategic Direction
Community grants
√ √ √ √
Resource management – consents and policy
√ √ √
Building control
√ √
Environmental health
√
Environm
ental Services
Animal control – dog control, registration and education
√
Parks and reserves
√ √
Libraries
√
Museums and heritage
√
Recreation
and
Heritage
Swimming pools
√
Cemeteries
√
Public toilets
√ √
Properties – pensioner housing and district halls
√ √
Forestry
Emergency management and rural fires
√
Amen
ity Services
Waste management √

94 Waipa District Council
Significant Activity Area
Services contributing towards Community Outcomes
Vibrant and Creative
Economically Secure
Environmentally
Sustainable
Healthy and Active
Road network management – footpaths, street lights, road maintenance etc.
√ √ √
Tran
sport
Man
agem
ent
Transport network regulation – general and subdivision regulation
√ √ √ √
Stormwater
Stormwater management – systems maintenance, renewal, extension and regulation
√ √
Water Treatmen
t an
d Supp
ly
Water treatment and supply – asset management, water abstraction, treatment and supply
√ √ √
Wastewater Treatmen
t an
d Dispo
sal
Wastewater treatment and disposal – asset management, sewerage treatment and disposal
√ √
√

10‐year Plan (2009‐19) 95
Governance and Strategic Direction
The purpose of elected Council is ‘to enable democratic local decision‐making and action, by and on behalf of, communities; and to promote the social, economic, environmental, and cultural wellbeing of communities in the present and for the future’. The Governance component of this activity reflects that responsibility. Elected Council need to be aware of and take into account the interests and desires of the communities and consider the impact of any decisions they make on the achievement of community outcomes. Council must also provide leadership and effective advocacy for the residents and ratepayers of our District and accountable stewardship of assets and resources in an open and transparent manner. Strategic Direction refers to the activities undertaken in planning for the future. Activities such as planning for growth, including where it will occur and the pressures and opportunities that it will bring to the District, as well as enabling the communities to discuss and identify what they want for the District in the form of community outcomes and putting in place the plans and strategies to achieve them. Strategic planning provides information so that informed decisions which balance the needs and wants of the communities with legislative requirements, can be made. Projects such as Waipa 2050 and Future Proof, the development of a strategic framework and plan, along with other work that Council undertakes, are critical to ensuring we, as a District, remain focused on being ‘The Home of Champions’ ‐ the great place to live, work and play. Strategic planning is an important tool in achieving community outcomes. Councillors are heavily involved in setting the strategic direction and ensuring that it is anchored in the appropriate statutory documents such as the District Plan and the 10‐year Plan. Council is one of many agencies involved in working towards the achievement of community outcomes. Partnerships with other Councils, local organisations and community groups are the key to successfully achieving those outcomes. It is important that these partnerships are clearly understood; in particular the objectives and roles, to ensure the available resources are used efficiently and effectively. As well as Council having a statutory responsibility to undertake these activities, it also recognises the role this work has in achieving the District’s community outcomes. Governance and strategic direction are key elements of the role of elected Council who are required to govern Waipa District in accordance with the principles of the Local Government Act 2002. It is Council’s responsibility to ensure the role of democratic governance (of the community) is clear and understood by all. Governance Council provides leadership, on behalf of the District, on matters directly related to its role and on matters of interest and importance to the communities it represents.
96 Waipa District Council
The present and future wellbeing of the community is entrusted to Councillors to ensure there is a long term vision for the community and that day to day decisions are consistent with that vision. Two Community Boards, Cambridge and Te Awamutu, provide a link between the community and Council. Council also has obligations under the Local Government Act 2002 to encourage Māori involvement in decision making. This is achieved through Council’s committee structure which includes an Iwi consultative committee and by co‐opting Iwi representatives onto other standing committees. The Local Electoral Act 2001 outlines the electoral processes for including representatives to lead our District. Following our triennial elections, Council’s responsibility includes the preparation and release of governance statements. These statements, amongst other things, refer to the functions, responsibilities and activities of the local authority, the electoral system and the opportunities to change it. Community Boards are part of the District’s governance structure and work in partnership with Council to promote and enhance community wellbeing. Governance and Strategic Direction Assets and How They Are Managed There are no specific assets related to the governance and strategic direction significant activity. Strategic Direction Growth puts pressure on infrastructure and natural resources, so it is important Council has a clear view of the growth it is likely to face over the next 40 years and how it should be managed and planned for. Council is a partner, along with Waikato District Council, Hamilton City Council and Environment Waikato, in the Sub Regional Growth Strategy ‘Future Proof’ (for further information about Future Proof refer to Appendix 1 on page 358). This Strategy will anchor long term land use pattern for the sub region, along with the associated infrastructure requirements. The District Plan is Council’s key document that directs resource management decision‐making and is required under the Resource Management Act. A review of the District Plan is scheduled to be consulted on in 2010. To support this and to give effect to the Future Proof Council is also preparing its own growth strategy as part of the “Waipa 2050” project. The Waipa District Growth Strategy will support our vision of Waipa as the Home of Champions – creating an environment which is a great place to live, work and play. The Strategy will define the future pattern of growth for settlements in the District and supports Council’s infrastructure planning processes to maximise efficiency. The Strategy will also consider locations and land requirements for industrial and commercial uses and review Council’s approach to rural‐residential land. Waipa 2050 will also provide Town Concept Plans for Cambridge, Te Awamutu/Kihikihi and Pirongia. These plans will provide a more detailed structure and guidelines for development of these towns and direct any zoning changes required.

10‐year Plan (2009‐19) 97
The District Plan review will also be informed by an Environment Strategy. Waipa District has unique environmental characteristics which are under constant pressure because of growth and economic development. These characteristics include landscapes, internationally significant peat lakes, stands of indigenous trees, the Maungatautari Ecological Island and a range of historically significant sites. The Strategy will provide a framework that ensures Council maintains a balance between absorbing growth pressures and sustaining its key environmental features. Contribution to Achieving Community Outcomes Council’s governance responsibilities contribute towards all of the community outcomes in some way, and in particular, the outcomes listed below. Good governance and planning for the future is essential to promoting sustainability and community wellbeing. Waipa Community Outcomes:
We identify with and take part in our communities, and enjoy participating in creative, recreational and cultural activities that build vibrant community spirit, both locally and at District level.
We all have meaningful opportunities to participate in making decisions that help shape Waipa of the future.
The special character and heritage of our towns and villages is retained and promoted. Individual and group achievement is recognised and celebrated District wide. Provision of industrial and residential areas is well balanced, carefully zoned to maintain our
rural/semi‐rural nature and planned well into the future. Our towns are economically independent of Hamilton and each town maintains its own
vibrant and unique character while maintaining strong links to the District as a whole. A diversity of employment options and business opportunities is provided within the District. Our strong dairy and equine industries help support our prosperous communities and
planning practices are encouraged that protect and sustain our productive resources. The growth, wealth and uniqueness of the local Māori economy is acknowledged and
supported. Our communities recognise that Waipa District is enriched by our multi cultural make‐up and
the unique status and role of tangata whenua is respected and reflected in community processes.
Iwi, hapu and Māori work together with central government, local government and community organisations in mutually beneficial partnerships.
Community services are coordinated and delivered effectively and efficiently to maximise resources while meeting the needs of our residents.
Our communities and agencies work together so that we are safe, we feel safe, crime is reduced and there is a zero tolerance approach to anti‐social behaviour.
Māori enjoy the same quality of health, education, housing, employment and economic outcomes as non‐Māori.
Our special natural landscapes and native biodiversity, such as peat lakes, riparian areas, indigenous forest areas, are protected, maintained and enhanced, ecological corridors are developed and animal and plant pests are controlled.
We use land management practices that protect and sustain our soil and land and our District’s high quality soils are protected from increasing ‘development’ demands by concentrating growth around existing settlements rather than intruding on rural areas.

98 Waipa District Council
Assumptions That Have Been Made We expect that the new government will introduce changes to the Resource Management Act, however at the extent of these changes is currently unknown and Council’s planning is based on current legislation. Potential Significant Negative Effects
POTENTIAL NEGATIVE EFFECT HOW WE ARE ADDRESSING THIS
Some sectors of the community may be under represented.
Council engages with community in a number of ways to ensure a wide range of views are taken into account. This includes formal structures such as the Iwi Consultative Committee. An Iwi representative is also co‐opted onto a number of standing committees. Ad hoc stakeholder groups are also formed to advise Council on various issues.
It may be argued that the cost of consultation and decision making is too high.
Council endeavours to use the most cost effective means of consulting with the public to inform its decision making. This will largely be determined by the degree of significance of an issue.
Some sectors of the community may consider that their views for the future direction of the District have not been taken account of.
Council must balance the needs and wants of a diverse range of individuals and groups within our community. The Waipa 2050 process involves an extensive consultation process involving a wide variety of stakeholders. This includes formal consultation processes, community workshops, vision groups and open days.
Some may consider that Council’s long term plans stifle development in the District.
Strategies and policies will be reviewed on a regular basis to ensure that they remain relevant and continue guide the development of the District.
Managing Changes in Demand Population growth and increasing community awareness will increase pressure on Council to provide effective leadership in planning for future growth and development, to respond to external pressures such as the economic challenges and to effectively address emerging issues in the best interests of the District. In response to that, Council has begun work on several initiatives including Waipa 2050 and Future Proof. From these initiatives further work will be identified that will enable better planning for the future.
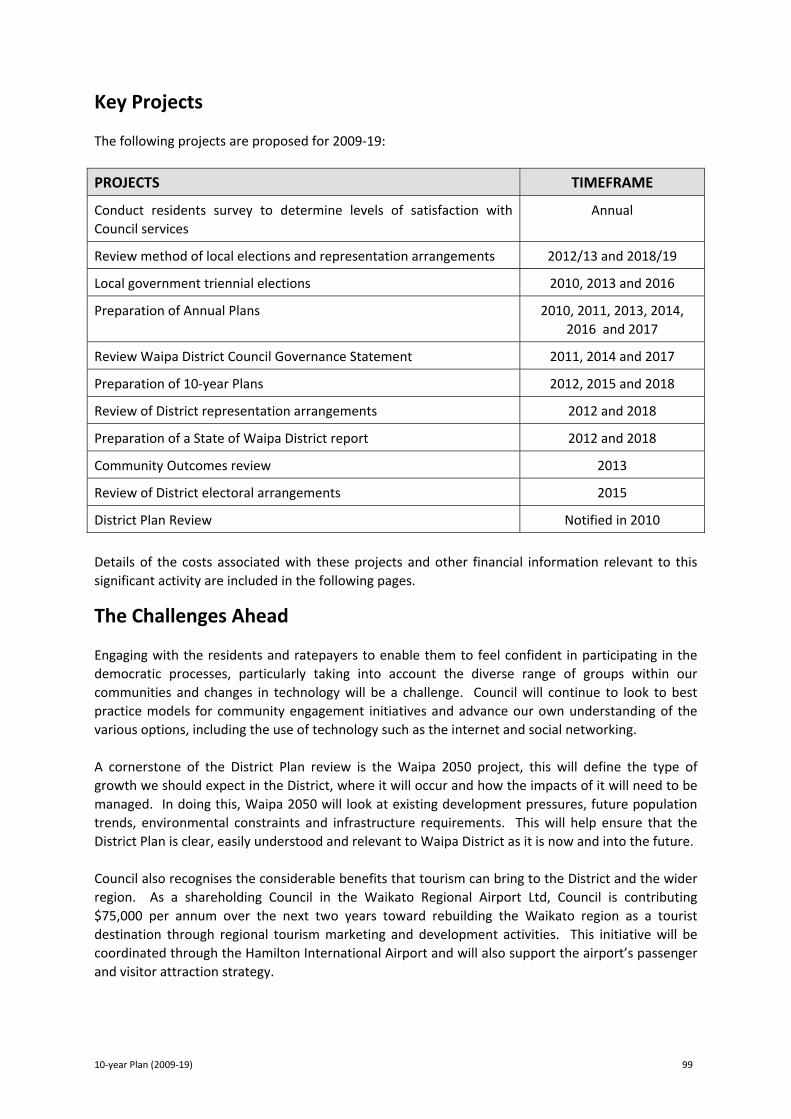
10‐year Plan (2009‐19) 99
Key Projects The following projects are proposed for 2009‐19:
PROJECTS TIMEFRAME
Conduct residents survey to determine levels of satisfaction with Council services
Annual
Review method of local elections and representation arrangements 2012/13 and 2018/19
Local government triennial elections 2010, 2013 and 2016
Preparation of Annual Plans 2010, 2011, 2013, 2014, 2016 and 2017
Review Waipa District Council Governance Statement 2011, 2014 and 2017
Preparation of 10‐year Plans 2012, 2015 and 2018
Review of District representation arrangements 2012 and 2018
Preparation of a State of Waipa District report 2012 and 2018
Community Outcomes review 2013
Review of District electoral arrangements 2015
District Plan Review Notified in 2010
Details of the costs associated with these projects and other financial information relevant to this significant activity are included in the following pages. The Challenges Ahead Engaging with the residents and ratepayers to enable them to feel confident in participating in the democratic processes, particularly taking into account the diverse range of groups within our communities and changes in technology will be a challenge. Council will continue to look to best practice models for community engagement initiatives and advance our own understanding of the various options, including the use of technology such as the internet and social networking. A cornerstone of the District Plan review is the Waipa 2050 project, this will define the type of growth we should expect in the District, where it will occur and how the impacts of it will need to be managed. In doing this, Waipa 2050 will look at existing development pressures, future population trends, environmental constraints and infrastructure requirements. This will help ensure that the District Plan is clear, easily understood and relevant to Waipa District as it is now and into the future. Council also recognises the considerable benefits that tourism can bring to the District and the wider region. As a shareholding Council in the Waikato Regional Airport Ltd, Council is contributing $75,000 per annum over the next two years toward rebuilding the Waikato region as a tourist destination through regional tourism marketing and development activities. This initiative will be coordinated through the Hamilton International Airport and will also support the airport’s passenger and visitor attraction strategy.

100
W
aipa District Council
Governance and Strategic Direction Levels of Service and Measuring Performance
Governance Level of service: Triennial local government elections (to appoint the Mayor and Councillors) are conducted
PERFORMANCE TARGET HOW THE ACTIVITY CONTRIBUTES TO COMMUNITY OUTCOMES
HOW WE MEASURE OUR PERFORMANCE 2009/10 2010/11 2011/12 2012‐19
CURRENT PERFORMANCE
Community leadership is achieved through setting a direction for the district and providing avenues to ensure community views are heard
% of electors who vote in the triennial local government elections
N/A 45% N/A 50% 31.6% of electors voted in the elections (Note: no election was required for the Mayor or Pirongia Ward members)
Level of service: The Mayor and Councillors set the direction for the activities that Council engages in (as per the Local Government Act 2002)
PERFORMANCE TARGET HOW THE ACTIVITY CONTRIBUTES TO COMMUNITY OUTCOMES
HOW WE MEASURE OUR PERFORMANCE 2009/10 2010/11 2011/12 2012‐19
CURRENT PERFORMANCE
Community leadership is achieved through setting a direction for the district and providing avenues to ensure community views are heard
% of residents (who respond to this question in the annual National Research Bureau (NRB) survey) who are satisfied with Mayor and Councillors
90% 90% 90% 90% 96%* of residents who responded to this question are satisfied with the Mayor and Councillors
* Council aims to meet the target specified and resourcing is allocated on that basis. If the target is exceeded, future targets will be assessed to determine whether or not a change can be supported by the available
resources.

10‐year Plan (2009‐19)
101
Level of service: The Community Board members represent and act as advocates for the interests of their communities
PERFORMANCE TARGET HOW THE ACTIVITY CONTRIBUTES TO COMMUNITY OUTCOMES
HOW WE MEASURE OUR PERFORMANCE 2009/10 2010/11 2011/12 2012‐19
CURRENT PERFORMANCE
Community leadership is achieved through setting a direction for the district and providing avenues to ensure community views are heard
% of residents (who respond to this question in the annual NRB survey) who are satisfied with Community Board members
90% 90% 90% 90% 96%* of residents who responded to this question are satisfied with the Community Board members
* Council aims to meet the target specified and resourcing is allocated on that basis. If the target is exceeded, future targets will be assessed to determine whether or not a change can be supported by the available
resources.
Level of service: Opportunities are provided for the community to have input to proposed activities
PERFORMANCE TARGET HOW THE ACTIVITY CONTRIBUTES TO COMMUNITY OUTCOMES
HOW WE MEASURE OUR PERFORMANCE 2009/10 2010/11 2011/12 2012‐19
CURRENT PERFORMANCE
Community leadership is achieved through setting a direction for the district and providing avenues to ensure community views are heard
% of residents (who respond to this question in the annual NRB survey) who are satisfied with the way Council involves the public in the decisions it makes
60% 65% 70% 80% New (target is based on exceeding the NRB peer group average)
Strategic Direction Level of service: The District Plan is current and reflects a strong vision for the District
PERFORMANCE TARGET HOW THE ACTIVITY CONTRIBUTES TO COMMUNITY OUTCOMES
HOW WE MEASURE OUR PERFORMANCE 2009/10 2010/11 2011/12 2012‐19
CURRENT PERFORMANCE
The District Plan is a key tool that enables Council to achieve a number of community outcomes across all wellbeings
District Plan is reviewed In preparation
Plan review notified
Plan review process
Plan operative
The Waipa 2050 project is currently in progress

102
W
aipa District Council
Grants to Community Organisations
Council provides grants to community organisations. Shown below are the grants provided in 2008/09 and the grants for the first three years of the 2009‐19 period. Organisations, such as Sport Waikato and the Cambridge and Te Awamutu Information Centres, who provide services on behalf of Council are to be funded by way of service contracts and the funding of these has been included in the relevant significant activity.
2008/09 2009/10 2010/11 2011/12
F unded L TC C P L TC C P L TC C P
$ $ $ $
15,000 P irongia Ward Grants 15,000 15,000 15,000
30,000 C ambridge C ommunity Board Grants 30,000 30,000 30,000
30,000 Te Awamutu C ommunity Board Grants 30,000 30,000 30,000
13,300 C itizens Advice Bureau ‐ C ambridge 13,300 13,300 13,300
24,500 C itizens Advice Bureau ‐ Te Awamutu 24,500 24,500 24,500
20,000 Nga Iwi Toopu S upport 20,000 20,000 20,000
6,200 P irongia His torical Vis itors C entre 6,200 6,200 6,200
15,000 R egional Tourism 15,000 15,000 15,000
5,000 P irongia R atepayers Association 5,000 5,000 5,000
100,000 Dis trict P romotions 100,000 100,000 100,000
14,588 C ambridge C ommunity Arts C ouncil 15,000 15,000 15,000
14,588 Waipa C ommunity Arts C ouncil 15,000 15,000 15,000
3,000 Waikato B iodivers ity F orum 3,000 3,000 3,000
50,000 P irongia Voluntary R ural F ire F orce ‐ ‐ ‐
30,000 Gracelands Group of S ervices ‐ ‐ ‐
10,000 Te Awamutu S afer C ommunity C haritable Trus t 12,500 12,500 12,500
‐ C ambridge Armistice 5,000 5,000 5,000
80,000 Overheads 42,000 43,100 45,200
461,176 TOTAL 351,500 352,600 354,700
NOTE S
The Individual grants to these organisations are specified for the firs t three years only.
A sum has been included in future years , although allocation is confirmed on an annual bas is .
The grants on behalf of C ommunity Arts C ouncil are funded externally.

10‐year Plan (2009‐19)
103
Governance and Strategic Direction Operating and Capital Costs and Funding Forecasts
2008/09 2009/10 2010/11 2011/12 2012/13 2013/14 2014/15 2015/16 2016/17 2017/18 2018/19
Budget B udget B udget B udget B udget B udget B udget B udget B udget B udget B udget
$000 $000 $000 $000 $000 $000 $000 $000 $000 $000 $000
R E VE NUE
‐ E lections ‐ 45 ‐ ‐ 48 ‐ ‐ 51 ‐ ‐
29 C ommunity Grants 30 30 30 30 30 30 30 30 30 30
29 TOTAL R E VE NUE 30 75 30 30 78 30 30 81 30 30
OPE RATING E XPE NDITURE
2,513 C ouncil & C ommittees 2,610 2,781 2,957 3,036 3,119 3,228 3,313 3,387 3,485 3,581
265 C ambridge C ommunity Board 247 263 278 286 294 304 311 319 329 338
261 Te Awamutu C ommunity Board 242 257 272 281 289 299 307 315 324 333
1 E lections 23 160 1 25 174 1 26 186 1 28
461 C ommunity Grants 352 353 355 352 353 354 354 355 356 355
870 S trategic P lanning 748 519 583 151 343 319 216 203 480 503
4,371 TOTAL E XP E NDITUR E 4,222 4,333 4,446 4,131 4,572 4,505 4,527 4,765 4,975 5,138
(4,342) OPE RATING S URPL US /(DE F IC IT) (4,192) (4,258) (4,416) (4,101) (4,494) (4,475) (4,497) (4,684) (4,945) (5,108)
F unded by:
3,472 R ates 3,642 3,896 4,205 4,101 4,494 4,475 4,497 4,684 4,945 5,108
870 Loan 550 362 211 ‐ ‐ ‐ ‐ ‐ ‐ ‐
4,341 TOTAL FUNDING 4,192 4,258 4,416 4,101 4,494 4,475 4,497 4,684 4,945 5,108
C AP ITAL E XPE NDITURE
23 Debt R epayment 104 159 196 218 218 218 218 218 216 214
23 TOTAL C AP ITAL E XP E NDITUR E 104 159 196 218 218 218 218 218 216 214
F unded by:
23 R ates 104 159 196 218 218 218 218 218 216 214
23 TOTAL FUNDING 104 159 196 218 218 218 218 218 216 214
3,495 RE QUIR E D F ROM RATE S 3,746 4,055 4,401 4,319 4,712 4,693 4,715 4,902 5,161 5,322

104
W
aipa District Council
Governance and Strategic Direction Performance Measures
2008/09 2009/10 2010/11 2011/12 2012/13 2013/14 2014/15 2015/16 2016/17 2017/18 2018/19
Budget B udget B udget B udget B udget B udget B udget B udget B udget B udget B udget
QUANTITY
19,224 R ateable P roperties 19,452 19,841 20,238 20,643 21,056 21,477 21,907 22,345 22,792 23,248
42,500 Population 45,885 46,630 47,396 48,176 48,974 49,789 50,623 51,542 52,483 53,465
42,500 Population based on C ensus Y ears 42,500 46,630 46,630 46,630 46,630 46,630 50,623 50,623 50,623 50,623
$ AVE RAGE OPE RATING C OS TS $ $ $ $ $ $ $ $ $ $
Per res ident
59 C ouncil 61 60 63 65 67 69 65 67 69 71
12 C ommunity Boards 12 11 12 12 13 13 12 13 13 13
RE S OURC E S
210 P ermanent s taff (number of) 215 221 233 240 253 256 257 258 261 262
10‐year Plan (2009‐19) 105
Environmental Services
Environmental Services encompasses the regulatory services Council provides to promote, protect and manage natural and physical resources, public health and public safety. This significant activity covers the following activities: Resource Management
Consents and policy Enforcement of statute, regulations and bylaws Land Information Memorandum (LIMs)
Building Control
Building consents Dangerous goods Fencing of swimming pools Project Information Memorandum (PIMs)
Environmental Health
Food safety Liquor licencing Noise control Public health
Animal Control
Dog registration and owner education Dog control Stock control
To achieve and maintain the community’s expectations regarding quality of life and to ensure we live together harmoniously, it is important that laws, bylaws and regulations are enforced fairly and consistently. Council administers these key pieces of legislation:
The Resource Management Act 1991 The Building Act 2004 Local Government Act 2002 Dog Control Act 1996 Health Act 1956 Sale of Liquor Act 1989 Food Act 1981 Impounding Act 1955

106 Waipa District Council
Council has a statutory responsibility to undertake these activities and it recognises the role this work has in achieving the District’s community outcomes. Generally the activities are completed as an in‐house function by three departments – Planning Services, Building Control Services and Environmental Safety Services. Some after hours work, such as noise and animal control, is undertaken by external contractors. Although Council is the primary service provider for this significant activity, it works in partnership with other agencies, such as Environment Waikato, The New Zealand Police and Waikato District Health Board. Environmental Services also provides support to the Enviroschools initiative. The programme, which integrates environmental education into the whole of school life covers the themes of zero waste, living landscapes, precious energy, healthy water and ecological buildings. There are currently 16 schools in Waipa participating in the three year programme with a further two to be included in 2009/10. Environmental Services Assets and How They Are Managed The only assets associated with this activity are dog pounds in both Te Awamutu and Cambridge. Maintenance and renewal work for the dog pounds is undertaken by staff and external contractors. Renewals are identified through the Asset Management Plans (AMPs) and the appropriate plans put in place to manage the required work. Funding of maintenance, renewal and replacement of dog pounds is by rates and charges. Activity Overview Resource Management Resource management is mainly involved in administering the planning functions of the Resource Management Act. The resource consent process is a tool to implement the District Plan and to achieve Council’s approach to sustainable development approach. This involves processing consents for subdivision and use of land and balancing the environmental effects of a proposal with the benefits it may bring. Building Control Building Control is responsible for ensuring buildings are safe and the necessary regulations and standards have been complied with. Council has been an accredited Building Consent Authority since 2008. To become accredited, Council went through a rigorous process to achieve the accreditation and it provides the community with greater surety that buildings assessed by council are safe and compliant. Other services provided by Building Control include issuing Project Information Memoranda (PIM) and the enforcement of swimming pool fencing requirements. Environmental Health Environmental health’s key roles include the regulation of activities that may affect community health and safety. This includes licencing of food outlets, liquor licencing, gambling control, and noise.

10‐year Plan (2009‐19) 107
In recent years, growth has resulted in greater demand for these services. Greater regulatory requirements in areas such as food safety have also put stress on these services. Animal Control Animal control’s key role is administering the requirements of legislation and bylaws relating to the keeping of animals. Growth and greater regulatory requirements have resulted in greater demand for these services. Contribution to Achieving Community Outcomes Council’s Environmental Services activities contribute towards the achievement of the community outcomes listed below. Waipa Community Outcomes:
Public buildings and public transport options are safe, accessible to people of all ages and abilities and signage is clear and visible.
We are aware of the links between the health of our environment and our own health. Local organisations and individuals are regularly involved in environmental care activities.
Our communities and agencies work together so that we are safe, we feel safe, crime is reduced and there is a zero tolerance approach to anti‐social behaviour.
The special character and heritage of our towns and villages is retained and promoted. Provision of industrial and residential areas is well balanced, carefully zoned to maintain our
rural/semi‐rural nature and planned well into the future. Our strong dairy and equine industries help support our prosperous communities and
planning and practices are encouraged that protect and sustain our productive resources. We use land management practices that protect and sustain our soil and land and our
District’s high quality soils are protected from increasing ‘development’ demands by concentrating growth around existing settlements rather than intruding on rural areas.
Assumptions That Have Been Made The population studies work, completed by the University of Waikato, has formed the basis of our growth assumptions, which in turn has enabled us to plan for the likely impact on Environmental Services. If actual growth is inconsistent with the projections, Council will need to review its programmes and resourcing accordingly.

108 Waipa District Council
Potential Significant Negative Effects
POTENTIAL NEGATIVE EFFECT HOW WE ARE ADDRESSING THIS
The conditions of resource consents approved may not be adhered to leading to adverse environmental effects.
Council has a programme for the regular monitoring of resource consents.
The time taken to process resource and building consent applications may be considered excessive by applicants.
Council strives to meet the time lines required by statute. Through its customer service function it regularly reviews its processes and seeks ways of improving them.
The costs of complying with regulatory requirements may be seen as excessive.
Council endeavours to minimise these costs by having effective and efficient systems and processes in place.
Managing Changes in Demand Changes in demand for environmental services are likely to occur as a result of development required to support and enable population growth, services such as building control and planning are likely to be the specific areas affected the most. These services are generally funded by fees and charges rather than by ratepayers. The capacity at the two dog pounds is monitored daily by reviewing the number of impounded animals. At this stage, no other specific additional capacity requirements have been identified for the 2009‐19 period. If the need arises for additional capacity, we expect that this work would be undertaken by external contractors, at competitive rates and be funded through any combination of fees and charges, rates and loans. Council will need to respond to any changes in legislation by central government. Key Projects The following project is proposed for 2009‐19:
PROJECTS TIMEFRAME
Building Act accreditation Ongoing
The Challenges Ahead Waipa District has unique environmental characteristics which are under constant pressure because of growth and economic development. These characteristics include outstanding landscapes, internationally significant peat lakes, stands of indigenous trees, the Maungatautari Ecological Island and historically significant sites. Council needs to ensure that it maintains a balance between absorbing growth pressures and sustaining its unique environmental features.

10‐year Plan (2009‐19)
109
Environmental Services Levels of Service and Measuring Performance
Planning Services Level of service: Council’s Resource Management and Land Information Memorandum (LIM) processes are efficient and timely
PERFORMANCE TARGET HOW THE ACTIVITY CONTRIBUTES TO COMMUNITY OUTCOMES
HOW WE MEASURE OUR PERFORMANCE 2009/10 2010/11 2011/12 2012‐19
CURRENT PERFORMANCE
% of non notified resource consents processed within RMA timeframes (20 working days)
100% 100% 100% 100% 98.8% of the non notified resource consents were processed within the RMA timeframes
% of notified resource consents processed within RMA timeframes (20 working days)
100% 100% 100% 100% 93.7% of the notified resource consents were processed within RMA timeframes
The community is assured that all Resource Management and Land Information Memorandum processes are in accordance with statutory requirements % of Land Information
Memorandum’s (LIMs) processed within the statutory timeframes (20 working days)
100% 100% 100% 100% 100% of LIMs were processed within the statutory timeframes
Level of service: Resource consents that Council issues are monitored to ensure compliance with the relevant conditions
PERFORMANCE TARGET HOW THE ACTIVITY CONTRIBUTES TO COMMUNITY OUTCOMES
HOW WE MEASURE OUR PERFORMANCE 2009/10 2010/11 2011/12 2012‐19
CURRENT PERFORMANCE
The community is assured that all resource consents will be complied with to achieve sustainable outcomes
At least 630 resource consents are monitored for compliance per annum
100% 100% 100% 100% 100% of the resource consents identified for monitoring completed

110
W
aipa District Council
Level of service: Council’s bylaws are regularly monitored for compliance
PERFORMANCE TARGET HOW THE ACTIVITY CONTRIBUTES TO COMMUNITY OUTCOMES
HOW WE MEASURE OUR PERFORMANCE 2009/10 2010/11 2011/12 2012‐19
CURRENT PERFORMANCE
The community is assured that Council bylaws are adhered to that will achieve sustainable outcomes
Complaints received and/or breaches detected are responded to within 5 working days
100% 100% 100% 100% 100% of the complaints received and/or breaches that were detected were responded to within 5 working days
Building Services Level of service: Council’s building consents processes are efficient and timely
PERFORMANCE TARGET HOW THE ACTIVITY CONTRIBUTES TO COMMUNITY OUTCOMES
HOW WE MEASURE OUR PERFORMANCE 2009/10 2010/11 2011/12 2012‐19
CURRENT PERFORMANCE
% of Project Information Memorandums (PIMs) issued within 20 working days
100% 100% 100% 100% 97% of the PIMs that were issued were done so within 20 working days
The community is assured that all certified buildings are safe
% of building consents processed within 20 working days
100% 100% 100% 100% 91.1% of the building consents were processed within 20 working days
Level of service: Council processes building consents
PERFORMANCE TARGET HOW THE ACTIVITY CONTRIBUTES TO COMMUNITY OUTCOMES
HOW WE MEASURE OUR PERFORMANCE 2009/10 2010/11 2011/12 2012‐19
CURRENT PERFORMANCE
The quality of Council’s building consent process is assured
Ensuring Council maintains its building consent authority accreditation
Council maintains its accreditation
Council maintains its accreditation
Council maintains its accreditation
Council maintains its accreditation
Council has maintained its accreditation

10‐year Plan (2009‐19)
111
Environmental Safety Level of service: A 24 hour, 7 day a week service is provided to respond to noise, hazardous substances, fire and animal control complaints
PERFORMANCE TARGET HOW THE ACTIVITY CONTRIBUTES TO COMMUNITY OUTCOMES
HOW WE MEASURE OUR PERFORMANCE 2009/10 2010/11 2011/12 2012‐19
CURRENT PERFORMANCE
The community can feel safe and enjoy the lifestyle of District and a well‐managed environment
Number of complaints regarding service (as reported monthly)
No complaints received
No complaints received
No complaints received
No complaints received
New measure
Level of service: Licensed premises, food premises, resource consent/District Plan noise rules and recreational water quality are monitored to ensure public safety is maintained and nuisance minimised
PERFORMANCE TARGET HOW THE ACTIVITY CONTRIBUTES TO COMMUNITY OUTCOMES
HOW WE MEASURE OUR PERFORMANCE 2009/10 2010/11 2011/12 2012‐19
CURRENT PERFORMANCE
The community can feel safe and enjoy the lifestyle of District and a well‐managed environment
% of regular monthly programme of monitoring for sites, premises and consents undertaken to ensure statutory compliance is completed*
100% of monthly
monitoring programmes completed
100% of monthly
monitoring programmes completed
100% of monthly
monitoring programmes completed
100% of monthly
monitoring programmes completed
New measure
* Monitoring of food premises is undertaken on an assessed risk basis. Premises assessed as high risk are monitored every four months, medium risk every six months and low risk every 12 months.
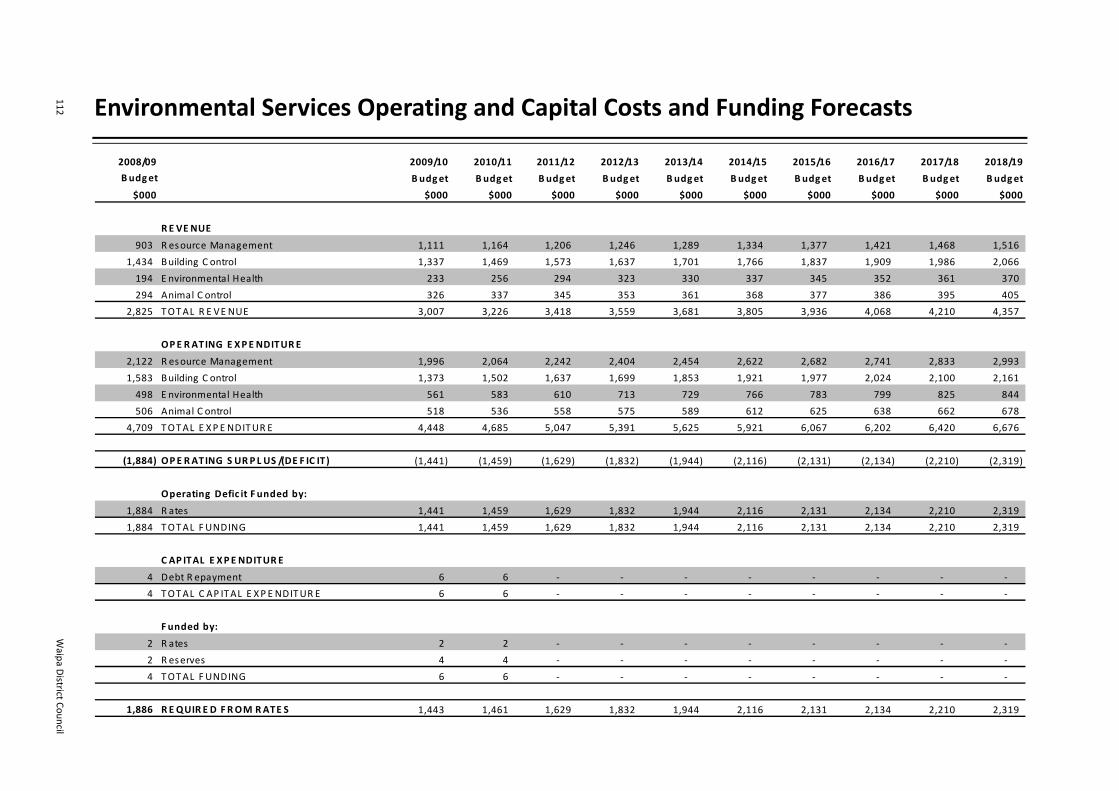
112
W
aipa District Council
Environmental Services Operating and Capital Costs and Funding Forecasts
2008/09 2009/10 2010/11 2011/12 2012/13 2013/14 2014/15 2015/16 2016/17 2017/18 2018/19
Budget B udget B udget B udget B udget B udget B udget B udget B udget B udget B udget
$000 $000 $000 $000 $000 $000 $000 $000 $000 $000 $000
R E VE NUE
903 R esource Management 1,111 1,164 1,206 1,246 1,289 1,334 1,377 1,421 1,468 1,516
1,434 Building C ontrol 1,337 1,469 1,573 1,637 1,701 1,766 1,837 1,909 1,986 2,066
194 E nvironmental Health 233 256 294 323 330 337 345 352 361 370
294 Animal C ontrol 326 337 345 353 361 368 377 386 395 405
2,825 TOTAL R E VE NUE 3,007 3,226 3,418 3,559 3,681 3,805 3,936 4,068 4,210 4,357
OPE RATING E XPE NDITURE
2,122 R esource Management 1,996 2,064 2,242 2,404 2,454 2,622 2,682 2,741 2,833 2,993
1,583 Building C ontrol 1,373 1,502 1,637 1,699 1,853 1,921 1,977 2,024 2,100 2,161
498 E nvironmental Health 561 583 610 713 729 766 783 799 825 844
506 Animal C ontrol 518 536 558 575 589 612 625 638 662 678
4,709 TOTAL E XP E NDITUR E 4,448 4,685 5,047 5,391 5,625 5,921 6,067 6,202 6,420 6,676
(1,884) OPE RATING S URPL US /(DE F IC IT) (1,441) (1,459) (1,629) (1,832) (1,944) (2,116) (2,131) (2,134) (2,210) (2,319)
Operating Defic it F unded by:
1,884 R ates 1,441 1,459 1,629 1,832 1,944 2,116 2,131 2,134 2,210 2,319
1,884 TOTAL FUNDING 1,441 1,459 1,629 1,832 1,944 2,116 2,131 2,134 2,210 2,319
C AP ITAL E XPE NDITURE
4 Debt R epayment 6 6 ‐ ‐ ‐ ‐ ‐ ‐ ‐ ‐
4 TOTAL C AP ITAL E XP E NDITUR E 6 6 ‐ ‐ ‐ ‐ ‐ ‐ ‐ ‐
F unded by:
2 R ates 2 2 ‐ ‐ ‐ ‐ ‐ ‐ ‐ ‐
2 R eserves 4 4 ‐ ‐ ‐ ‐ ‐ ‐ ‐ ‐
4 TOTAL FUNDING 6 6 ‐ ‐ ‐ ‐ ‐ ‐ ‐ ‐
1,886 R E QUIR E D F ROM RATE S 1,443 1,461 1,629 1,832 1,944 2,116 2,131 2,134 2,210 2,319

10‐year Plan (2009‐19)
113
Environmental Services Performance Measures
2008/09 2009/10 2010/11 2011/12 2012/13 2013/14 2014/15 2015/16 2016/17 2017/18 2018/19
Budget Budget B udget B udget Budget B udget B udget B udget Budget B udget B udget
$ AVE RAGE OPE RATING C OS TS $ $ $ $ $ $ $ $ $ $
Per Res ident
50 R esource Management 47 44 48 52 53 56 53 54 56 59
37 Building C ontrol 32 32 35 36 40 41 39 40 41 43
12 E nvironmental Health 13 13 13 15 16 16 15 16 16 17
12 Animal C ontrol 12 11 12 12 13 13 12 13 13 13
111 TOTAL 104 100 108 115 122 126 119 123 126 132
$ Per Rateable Property $ $ $ $ $ $ $ $ $ $
110 R esource Management 103 104 111 116 117 122 122 123 124 129
82 Building C ontrol 71 76 81 82 88 89 90 91 92 93
26 E nvironmental Health 29 29 30 35 35 36 36 36 36 36
26 Animal C ontrol 27 27 28 28 28 28 29 29 29 29
244 TOTAL 230 236 250 261 268 275 277 279 281 287

114 Waipa District Council
Recreation and Heritage
Council considers that the availability and accessibility of good quality recreational facilities for the community is important to social, cultural and environmental wellbeing. It provides facilities that give opportunities for passive and active recreation, exploration of the District’s landscapes, waterways and culturally significant sites and enable participation in organised sports and other recreational activities. Waipa District’s libraries play a key role in our cultural fulfilment, as well as the development of the community and individuals, while the museums reflect a sense of heritage that is synonymous with the District. Some of Waipa District’s facilities and natural features are nationally and internationally significant such as Lake Karapiro (venue for the 2010 Rowing World Championship) and the peat lakes, and they attract visitors to our District. The Maungatautari Ecological Reserve, provided in association with the Maungatautari Ecological Island Trust (MEIT), provides recreational and biodiversity benefits with several endangered species now located within the pest proof fence perimeter. It also provides a rich educational resource which is used by schools from across the Waikato Region.
Planting at Lake Mangakaware
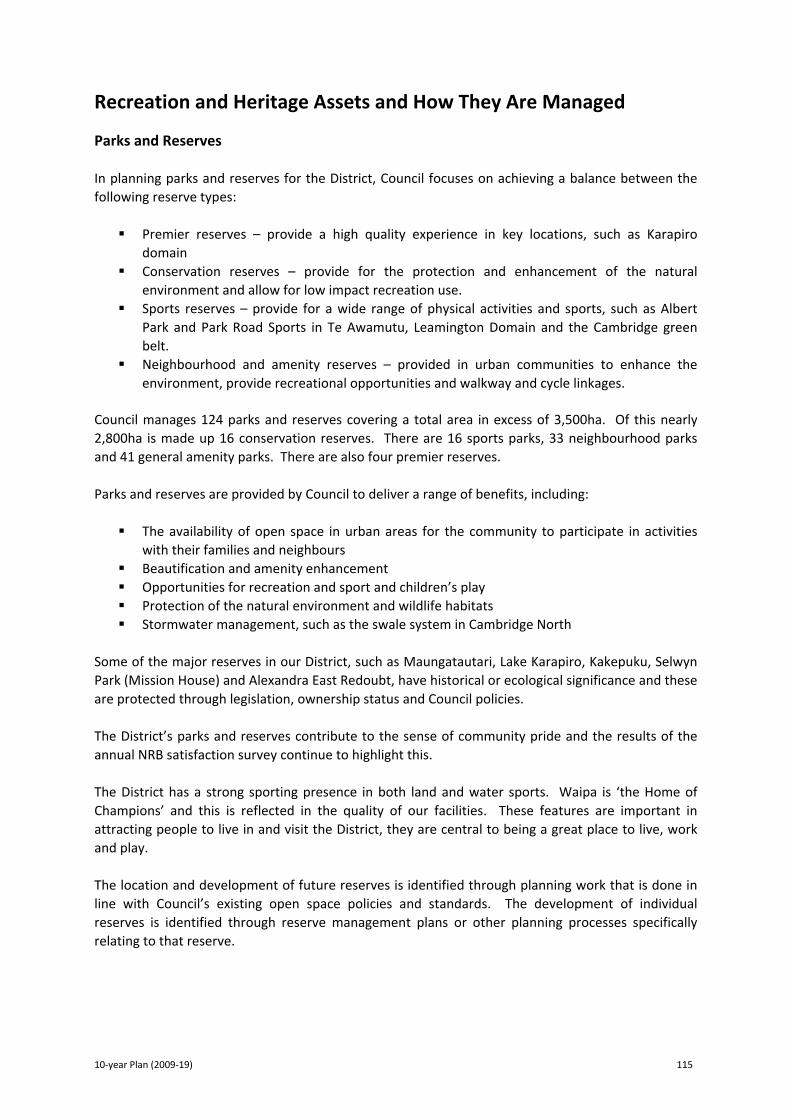
10‐year Plan (2009‐19) 115
Recreation and Heritage Assets and How They Are Managed Parks and Reserves In planning parks and reserves for the District, Council focuses on achieving a balance between the following reserve types:
Premier reserves – provide a high quality experience in key locations, such as Karapiro domain
Conservation reserves – provide for the protection and enhancement of the natural environment and allow for low impact recreation use.
Sports reserves – provide for a wide range of physical activities and sports, such as Albert Park and Park Road Sports in Te Awamutu, Leamington Domain and the Cambridge green belt.
Neighbourhood and amenity reserves – provided in urban communities to enhance the environment, provide recreational opportunities and walkway and cycle linkages.
Council manages 124 parks and reserves covering a total area in excess of 3,500ha. Of this nearly 2,800ha is made up 16 conservation reserves. There are 16 sports parks, 33 neighbourhood parks and 41 general amenity parks. There are also four premier reserves. Parks and reserves are provided by Council to deliver a range of benefits, including:
The availability of open space in urban areas for the community to participate in activities with their families and neighbours
Beautification and amenity enhancement Opportunities for recreation and sport and children’s play Protection of the natural environment and wildlife habitats Stormwater management, such as the swale system in Cambridge North
Some of the major reserves in our District, such as Maungatautari, Lake Karapiro, Kakepuku, Selwyn Park (Mission House) and Alexandra East Redoubt, have historical or ecological significance and these are protected through legislation, ownership status and Council policies. The District’s parks and reserves contribute to the sense of community pride and the results of the annual NRB satisfaction survey continue to highlight this. The District has a strong sporting presence in both land and water sports. Waipa is ‘the Home of Champions’ and this is reflected in the quality of our facilities. These features are important in attracting people to live in and visit the District, they are central to being a great place to live, work and play. The location and development of future reserves is identified through planning work that is done in line with Council’s existing open space policies and standards. The development of individual reserves is identified through reserve management plans or other planning processes specifically relating to that reserve.

116 Waipa District Council
Libraries There are two Council owned and operated libraries within the District, located in Te Awamutu and Cambridge. The two libraries hold approximately 140,000 books and 10,000 other items such as CDs and DVDs. Demand for library services can be affected by technological advances and the increased public expectations that this brings. For example, a new library system was implemented in 2007 that allows library users to renew their books via the internet, as well as using other features such as checking the library catalogue and putting books on hold. Changes in the population structure, including an increasing proportion of the population over 65, may also affect demand for services. Council will continue to monitor these trends and assess the impact of them on library services. A lack of space is a major issue for both libraries but for the Te Awamutu Library in particular. The Library and Information Association of New Zealand Aotearoa (LIANZA) has established voluntary standards, such as size and number of books based on population, for New Zealand Public Libraries. The total floor area of the Cambridge Library is 51% and the Te Awamutu Library is 26% of the suggested requirement for a population of this size6. Due to the lack of space, there are a number of consequences for the operation of the library, including:
Inadequate public seating and desk space A lack of public access computers No separate area for young adult library users Attendance at the popular children's school holiday programmes must be restricted Other library‐based programmes, events and displays are restricted Shelving is too high for many customers and staff to comfortably reach
Te Awamutu Library is particularly short of space and as a result:
Interior light is reduced because of shelf height Customers with pushchairs and wheelchairs cannot move freely around the library Staff work in an area which also doubles as storage space
It is proposed that the Te Awamutu Library be extended into the space currently occupied by the museum in year 7 of this Plan. This move is dependant on the museum being relocated to the proposed Te Awamutu Heritage and Cultural Centre.
Museums and Heritage There are two museums in the District, located in Te Awamutu and Cambridge. The museums collect material that relates to the history, society, culture and the development of Waipa District. The collections at the museums include objects, photographs, maps, taonga Māori and archival material. This includes some nationally significant items. In addition, Te Awamutu Museum is a registered archival repository. A range of services are provided including research, education for primary and secondary schools, an increasing variety of public programmes and workshops and changing displays and exhibitions.
6 The calculation of the two percentages is as at 2008 and based on a population of 44,321 with each Library serving half of the population each.
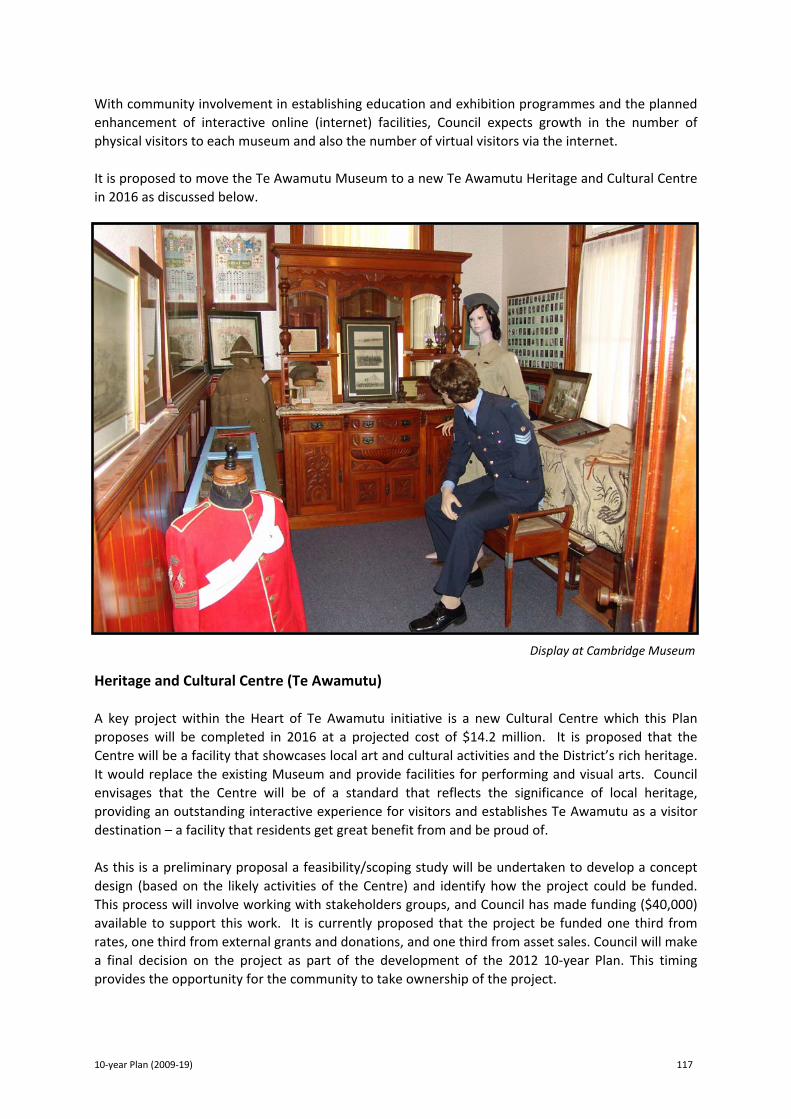
10‐year Plan (2009‐19) 117
With community involvement in establishing education and exhibition programmes and the planned enhancement of interactive online (internet) facilities, Council expects growth in the number of physical visitors to each museum and also the number of virtual visitors via the internet. It is proposed to move the Te Awamutu Museum to a new Te Awamutu Heritage and Cultural Centre in 2016 as discussed below.
Heritage and Cultural Centre (Te Awamutu) A key project within the Heart of Te Awamutu initiative is a new Cultural Centre which this Plan proposes will be completed in 2016 at a projected cost of $14.2 million. It is proposed that the Centre will be a facility that showcases local art and cultural activities and the District’s rich heritage. It would replace the existing Museum and provide facilities for performing and visual arts. Council envisages that the Centre will be of a standard that reflects the significance of local heritage, providing an outstanding interactive experience for visitors and establishes Te Awamutu as a visitor destination – a facility that residents get great benefit from and be proud of. As this is a preliminary proposal a feasibility/scoping study will be undertaken to develop a concept design (based on the likely activities of the Centre) and identify how the project could be funded. This process will involve working with stakeholders groups, and Council has made funding ($40,000) available to support this work. It is currently proposed that the project be funded one third from rates, one third from external grants and donations, and one third from asset sales. Council will make a final decision on the project as part of the development of the 2012 10‐year Plan. This timing provides the opportunity for the community to take ownership of the project.
Display at Cambridge Museum

118 Waipa District Council
Swimming Pools TE AWAMUTU EVENTS CENTRE The Trust Waikato Te Awamutu Events Centre (TAEC) opened in November 2001, houses an events hall, indoor pools, and fitness centre. The management contract for this facility is held by H20 Management Waikato Ltd, their responsibilities include managing the bookings, water quality and the day‐to‐day operations of the pool. Independently, they have a lease for the fitness centre. The management contract was let in 2001 and was renewed in 2007 for a second term which will expire in 2012. The events hall is a two‐court multi purpose venue used for sport, expos, concerts, conventions and similar events. It includes an 800 seat bleacher (raised, tiered stands) system, which can be pulled in and out as required. There are three separate swimming pools – a lane pool, multi‐use learners and therapy pool and children’s pool, as well as a hydroslide, and spa and sauna. The fitness centre, located on a mezzanine floor overlooking both the events hall and swimming pools, provides a range of equipment suitable for all levels of fitness.
Te Awamutu Events Centre

10‐year Plan (2009‐19) 119
CAMBRIDGE POOL The Cambridge community has a 50m outdoor pool which opens annually in late October through to mid to late March, if weather allows and attendance warrants it. H20 Management Waikato Ltd have managed this pool for a number of years and have over the most recent years done so on a year‐by‐year basis as Council plans for the future of the site. A heated covered swimming pool for Cambridge was a key inclusion in the 10‐year Plan 2006‐16, reflecting Council’s commitment to meeting the expectations of the Cambridge community. Council has confirmed that design of the Cambridge pool project proceed with a projected cost of $15.1 million ($1.1 million of which is inflation). The design will be completed on the basis that a new pool facility will be constructed within the general footprint of the existing 50 metre outdoor pool, which will be demolished. The facility is to provide a 25 metre x 8 lane fitness pool, a leisure/therapy pool, a learn to swim water space and a toddler/babies area. It will be designed to enhance the indoor‐outdoor connection that is a key advantage of the Williamson Street site and will be operational all year round. A key success factor for the proposal is the need for the community to raise a third of the funding required, of which 75% must be secured before construction can commence. Professional fundraisers have been engaged to lead this process on behalf of the community. Asset sales and cash from Council will provide $7.1 million and a further $3.2 million from loans. The 10‐year Plan provides for construction to commence in 2012/13 (subject to the community fundraising target being achieved), with the facility opening in 2013/14. However further consultation will be undertaken as part of the 2012‐22 10‐year Plan process before a final decision is made to proceed with the project. The proposed facility is to be located in the approximate location of the existing 50m outdoor pool. The new facility is to have a 25 metre x 8 lane pool for those who wish to train or undertake fitness based swimming. The pool will also serve as an area for teenagers and those who wish to have fun in deeper water. The other pools included in the plan are:
Leisure/therapy pool – allows for a warmer water temperature and has provision for disabled ramp access. This pool will be particularly suitable for those who need water based therapy, aquarobics and those who wish to be warm in the water but do not want to exercise.
Toddlers/children’s pool – suitable for age groups ranging from baby through to 10 years, this pool will have warm water and sloped access.
Learn to swim – this will be a separate room so noise generated from those taking part in the these classes does not disturb other pool users. This area will be bookable for other purposes such as children’s parties and at peak times, will provide an area for organised activities.
In addition, a pay to use sauna room and spa pool have been included.

120 Waipa District Council
If the existing outdoor pool, which operates for five months of the year, is retained there are three possible outcomes for its future, all of which will require further investigation. The first is to undertake basic maintenance at an additional cost of $100,000 per annum. The risk with this option is that the pool may cease to operate within the 10 years of the Plan. The second is to refurbish the water treatment plant to maintain water quality at an estimated cost of $3 million. The expected life of the facility would be up to 20 years. The third is an extensive refurbishment of the existing buildings and plant at an estimated cost of $6.8 million ($800,000 of which is inflation). The expected life of the facility would be approximately 20 years. Karapiro Domain The increased popularity and usage of Lake Karapiro, by both competitive and recreational users, means that further development of key lakeside reserves and facilities is now important. Council has responded to this need by preparing and adopting the Karapiro Domain Management Plan which sets out a major development programme for the Domain. While development at Karapiro will benefit all lake users, the venue is increasingly attracting major international events, such as the 2010 World Rowing Championships. A high standard of facilities is required for these events and the development plan for Karapiro reflects this. While Council is responsible for the overall management and development of Karapiro Domain, a number of partnerships will be developed with key user groups and other agencies so that funding is sourced from beyond Council and its ratepayers. This 10‐year Plan provides an additional $8.7 million for the completion of the Karapiro Domain facilities. The water sports complex no longer meets the needs of users, so it will be demolished in mid‐2009, and a new facility, which will be headquarters of all Domain events, will be constructed. The facility will include an open space the size of a basketball court, an indoor climbing wall, full kitchen facilities and meeting, function and cultural rooms plus storage areas. In 2010, this community centre will serve as a media facility and reception area for overseas dignitaries for the World Championships. The following projects are underway or have been substantially completed – a new entrance road, a toilet and shower block in the lower camping ground, the relocation of the maintenance shed, upgrades to water and sewerage services, and embankment improvements. In 2009, the following projects will commence – the building of the events and community centre, two additional toilet blocks, a new southern entrance, alterations to the Rob Waddell Lodge, installation of grandstand seating and the replacement of the St John’s facility. New Lake Karapiro (Geck’s) Reserve In anticipation of the Karapiro Lake Domain development, Council purchased an adjacent 40ha property in March 2001. The intended use of this land is to provide recreational facilities for passive forms of recreation to service the district’s growing population, particularly as the Karapiro domain could increasingly be used for larger organised events.

10‐year Plan (2009‐19) 121
Options for the development of the reserve are currently being considered. The initial stage is likely to include an ablution block, car parking and a boat ramp. Access to the reserve will be from Maungatautari Road. Council has provided $2.87 million for the development of the reserve over the life of the Plan. Maungatautari Ecological Island Council is responsible, by way of agreement with the Department of Conservation, for the management of the Maungatautari Scenic Reserve. The Maungatautari Ecological Island project has seen the scenic reserve and forested private land enclosed within a mammalian pest‐proof perimeter fence, constructed by the Maungatautari Ecological Island Trust (MEIT). Council recognises the significant value of this project in terms of improving the environmental and economic wellbeing of the District, and is committed to working with MEIT, Environment Waikato (EW) and the Department of Conservation (DoC) to maximise the value of this initiative. Council has not directly funded the pest‐proof fence, but has provided funds to develop tracks within the Reserve and improve access. Council proposes to continue its commitment to the project with $300,000 per year towards the maintenance of the fence and creating a pest free environment. Peat Lakes Accord The purpose of the Accord is to enable various government agencies and stakeholder groups to work cooperatively to protect and enhance the Waipa peat lakes. In 2005, Council entered into an agreement with Environment Waikato for a six‐year restorative programme focusing on Lakes Ngaroto, Serpentine, Rotomanuka, Maratoto and Mangakaware. 2009/10 is year four of the programme. The wet 2008 winter has highlighted the sustainability challenges associated with farming within the catchments of peat lakes, with substantial areas of farm land flooded around the margins of these lakes. Discussions are underway with a number of landowners to acquire land adjacent to lakes Ngaroto, Serpentine and Maratoto for inclusion within the reserve areas. An intensive monitoring programme on Lake Ngaroto has commenced, including water quality sampling and water level monitoring. A water quality and climatic monitoring buoy was positioned in the Lake in 2009. The information gathered will be considered in establishing a long‐term management programme for the Lake which will ensure its sustainable management. Contribution to Achieving Community Outcomes Council’s recreation and heritage activities contribute towards the achievement of the community outcomes listed below. Waipa Community Outcomes:
We are proud of our District’s unique identity and its rich and diverse archaeological, natural and cultural heritage.
We have a vibrant Maori community and our Maori heritage is embraced and celebrated District‐wide and showcased as an integral part of the visual amenity of our towns.

122 Waipa District Council
Our District is a tourist destination of choice and our tourism industry promotes our special local features and supports economic growth.
Heritage sites and landscapes of significance to Maori are preserved and valued and where appropriate are identified and celebrated visually.
Maungatautari, Kakepuku, Pirongia and other Maunga in the District are protected and promoted as key features of the Waipa landscape and for recreational purposes.
A good range of fun recreational spaces, playgrounds, facilities and family friendly areas are available, well planned, affordable, accessible and youth focused.
We identify with and take part in our communities and enjoy participating in creative, recreational and cultural activities that build vibrant community spirit, both locally and at District level.
Individual and group achievement is recognised and celebrated District wide. Our special natural landscapes and native biodiversity, such as peat lakes, riparian areas,
indigenous forest areas, are protected, maintained and enhanced, ecological corridors are developed and animal plant pests are controlled.
We are aware of the links between the health of our environment and our own health. Local organisations and individuals are regularly involved in environmental care activities.
Our clean, green environment is preserved, promoted and utilised for recreation and leisure and contributes to enhancing our image as a tourist destination.
Assumptions That Have Been Made For every additional 1,000 residents Council will need to invest in the purchase of additional land and continually invest in developing reserve areas. The Cambridge community is able to raise the funds required for the Cambridge Community Pool project to proceed. The Pool project will not proceed if these funds are unable to be raised. Potential Negative Significant Effects
POTENTIAL NEGATIVE EFFECT HOW WE ARE ADDRESSING THIS
There may some undesirable effects associated with the provision of parks and reserves such as vandalism, noise and litter.
Council controls these effects through the use of CPTED (Crime Prevention Through Environmental Design) principles in planning parks and reserves. Parks are also regularly maintained to clear litter.
There is a possible risk of drowning at Council Swimming Pools.
Pool staff are well trained and health and safety protocols are in place.
There are risks associated with the storage of swimming pool chemicals.
Staff are trained in chemical handling procedures and health and safety protocols are in place.
Possible temporary disruption to neighbours while facilities are under construction.
These effects are mitigated by requirements placed on contractors to minimise adverse effects.

10‐year Plan (2009‐19) 123
Managing Changes in Demand As discussed in the previous pages in this section, Council will continue to monitor and consider the appropriate response to any changes in demand. Changing demographics, such as the ageing population, will have a significant impact on the provision of amenity and recreational assets. New subdivisions have greater pedestrian links and open space is being developed with a view to who the likely users will be. Waipa 2050 will also consider the District’s need for recreational land and facilities, identifying the community’s requirements into the future to guide planning and development. From an environmental perspective, more stands of native trees are being planted to create corridors between the significant native bush stands of Maungatautari Mountain, Mt Kakepuku, Mt Pirongia and the Waikato River. Recreation and Heritage assets are managed according to the relevant Asset Management Plans (AMPs) which identify growth trends and the likely changes in demand. Key Projects The following projects are proposed for 2009‐19:
PROJECTS TIMEFRAME
Park Renewals Annual
Cambridge Community Pool 2012/13‐2013/14
Karapiro Domain works 2009/10‐2012/13, 2014/15
Gecks Reserve development 2009/10‐2016/17
Te Awamutu Heritage and Cultural Centre 2013/14‐2015/16
Te Awamutu Library Extension 2015/16
Details of the costs associated with these projects and other financial information relevant to this significant activity are included in the following pages. The Challenges Ahead Council will work with the community to understand their expectations with regard to recreation and heritage services and facilities. Those expectations will need to be balanced against providing sustainable and affordable services and facilities, while ensuring work to maintain essential infrastructure is not compromised. The demand for high cost assets, such as swimming pools and cultural centres, places pressure on Council and the community, particularly given the current economic challenges. The pressure comes not only from the initial capital cost, but the ongoing operating costs.

124 Waipa District Council
Technological advances provide potential for service improvements, in particular for the libraries and museums, and these will be considered by Council. However, such service improvements are likely to incur additional cost and this will need to be considered against other priorities.

10‐year Plan (2009‐19)
125
Recreation and Heritage Levels of Service and Measuring Performance
District Pools Level of service: Safe, reliable and accessible swimming pools are available for the community
PERFORMANCE TARGET HOW THE ACTIVITY CONTRIBUTES TO COMMUNITY OUTCOMES
HOW WE MEASURE OUR PERFORMANCE 2009/10 2010/11 2011/12 2012‐19
CURRENT PERFORMANCE
Pools are operated in accordance with NZ Standards for pool water quality
100% compliance
100% compliance
100% compliance
100% compliance
100% compliance with NZ Standards for daily operation of pools
All weather pools available in Cambridge and Te Awamutu, annual review
All weather pool in Te Awamutu
and summer season pool in Cambridge
All weather pool in Te Awamutu
and summer season pool in Cambridge
All weather pool in Te Awamutu
and summer season pool in Cambridge
All weather pool in Te Awamutu and new all weather pool in Cambridge
All weather pool in Te Awamutu and summer season pool in Cambridge
Creating a healthier community through encouraging and supporting increased levels of active recreation
% of residents (who respond to this question in the annual NRB survey) who are satisfied with the swimming pools
80% 80% 85% 90% 76% of the residents who responded to this question are satisfied with the swimming pools

126
W
aipa District Council
District Libraries Level of service: Full and accessible library services are provided in Cambridge and Te Awamutu
PERFORMANCE TARGET HOW THE ACTIVITY CONTRIBUTES TO COMMUNITY OUTCOMES
HOW WE MEASURE OUR PERFORMANCE 2009/10 2010/11 2011/12 2012‐19
CURRENT PERFORMANCE
Full library service is available in Cambridge and Te Awamutu (Full Service means items can be issued at
any time the Library is open)
Full library service in Cambridge and Te
Awamutu
Full library service in Cambridge and Te
Awamutu
Full library service in Cambridge and Te
Awamutu
Full library service in Cambridge and Te
Awamutu
Full library service in Cambridge and Te Awamutu
By providing our communities with free and equitable access to a range of library resources and services By providing fun recreational facilities and family friendly areas which are affordable and accessible
% of residents (who respond to this question in the annual NRB survey) who are satisfied with the library service
90% 90% 90% 90% 96%* of the residents who responded to this question were satisfied with the library service
* Council aims to meet the target specified and resourcing is allocated on that basis. If the target is exceeded, future targets will be assessed to determine whether or not a change can be supported by the available
resources.
Level of service: There is a wide range of library stock, including up‐to‐date material
PERFORMANCE TARGET HOW THE ACTIVITY CONTRIBUTES TO COMMUNITY OUTCOMES
HOW WE MEASURE OUR PERFORMANCE 2009/10 2010/11 2011/12 2012‐19
CURRENT PERFORMANCE
By providing our communities with free and equitable access to a range of library resources and services
% of district library collection that meets the Library and Information Association of New Zealand Aotearoa (LIANZA) standard of 3.5 items per resident (reviewed quarterly)
100% 100% 100% 100% 100% compliance with the 3.5 items per resident standard
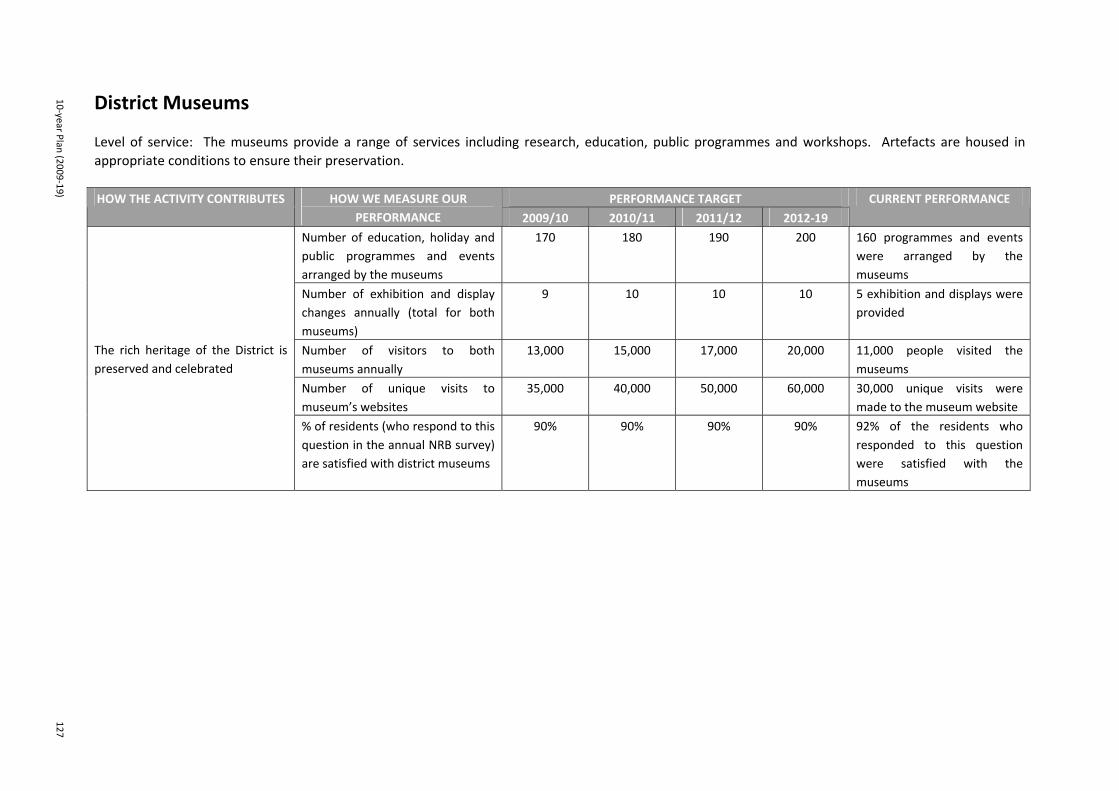
10‐year Plan (2009‐19)
127
District Museums Level of service: The museums provide a range of services including research, education, public programmes and workshops. Artefacts are housed in appropriate conditions to ensure their preservation.
PERFORMANCE TARGET HOW THE ACTIVITY CONTRIBUTES HOW WE MEASURE OUR PERFORMANCE 2009/10 2010/11 2011/12 2012‐19
CURRENT PERFORMANCE
Number of education, holiday and public programmes and events arranged by the museums
170 180 190 200 160 programmes and events were arranged by the museums
Number of exhibition and display changes annually (total for both museums)
9 10 10 10 5 exhibition and displays were provided
Number of visitors to both museums annually
13,000 15,000 17,000 20,000 11,000 people visited the museums
Number of unique visits to museum’s websites
35,000 40,000 50,000 60,000 30,000 unique visits were made to the museum website
The rich heritage of the District is preserved and celebrated
% of residents (who respond to this question in the annual NRB survey) are satisfied with district museums
90% 90% 90% 90% 92% of the residents who responded to this question were satisfied with the museums

128
W
aipa District Council
Parks and Reserves Level of service: Provision of appropriate, safe and accessible recreational spaces, playgrounds, facilities and family friendly areas
PERFORMANCE TARGET HOW THE ACTIVITY CONTRIBUTES TO COMMUNITY OUTCOMES
HOW WE MEASURE OUR PERFORMANCE 2009/10 2010/11 2011/12 2012‐19
CURRENT PERFORMANCE
Parks space available for leisure within urban areas, annual assessment
Actively maintained reserve land of 7.2ha per
1,000 residents
Actively maintained reserve land of 7.2ha per
1,000 residents
Actively maintained reserve land of 7.2ha per
1,000 residents
Actively maintained reserve land of 7.2ha per
1,000 residents
Actively maintained reserve land of 7.2ha per 1,000 residents
Compliance with NZ Standards for playgrounds equipment (audited quarterly)
100% 100% 100% 100% 100% compliance with the appropriate standards
By providing a range of fun recreational spaces, playgrounds, facilities and family friendly areas which are affordable, accessible and youth focussed
% of residents (who respond to this question in the annual NRB survey) are satisfied with parks and reserves
90% 90% 90% 90% 94%* of the residents who responded to this question were satisfied with parks and reserves
* Council aims to meet the target specified and resourcing is allocated on that basis. If the target is exceeded, future targets will be assessed to determine whether or not a change can be supported by the available
resources. Level of service: Service requests and system failures are responded to in a timely manner HOW THE ACTIVITY CONTRIBUTES
TO COMMUNITY OUTCOMES HOW WE MEASURE OUR
PERFORMANCE PERFORMANCE TARGET CURRENT PERFORMANCE
By being managed effectively and efficiently to maximise resources while meeting the needs of our residents
Response time within agreed number of days: Enquiry response within 3
working days
100% 100% 100% 100% 100% of requests and system failures responded to within agreed timeframes

10‐year Plan (2009‐19)
129
Recreation and Heritage Operating and Capital Costs and Funding Forecasts
2008/09 2009/10 2010/11 2011/12 2012/13 2013/14 2014/15 2015/16 2016/17 2017/18 2018/19
Budget B udget B udget B udget B udget B udget B udget B udget B udget B udget B udget
$000 $000 $000 $000 $000 $000 $000 $000 $000 $000 $000
R E VE NUE
292 K arapiro Domain 355 367 375 395 404 413 422 432 442 453
78 Dis trict Museums 96 111 114 116 132 142 147 153 160 163
176 Dis trict L ibraries 183 193 200 210 217 226 226 245 251 260
320 Dis trict Pool Te Awamutu 420 537 550 563 575 700 716 733 750 769
‐ Dis trict Pool C ambridge ‐ ‐ ‐ ‐ 374 508 520 650 666 682
866 TOTAL R E VE NUE 1,054 1,208 1,239 1,284 1,702 1,989 2,031 2,213 2,269 2,327
OPE RATING E XPE NDITURE
2,724 P arks and R eserves 3,517 3,804 3,959 4,213 4,187 4,522 4,549 4,785 5,068 5,341
844 K arapiro Domain 976 1,158 1,400 1,504 1,420 1,487 1,498 1,654 1,642 1,755
725 Dis trict Museums 794 749 801 828 849 986 1,147 1,968 1,995 2,013
1,437 Dis trict L ibraries 1,318 1,384 1,498 1,622 1,669 1,737 1,791 1,895 1,950 1,997
1,946 Dis trict Pool Te Awamutu 1,891 2,062 2,029 2,056 2,070 2,124 2,104 2,376 2,339 2,381
152 Dis trict Pool C ambridge 285 291 303 116 1,668 2,204 2,260 2,294 2,352 2,384
332 Heritage 250 379 1,182 531 497 535 512 530 604 617
8,160 TOTAL E XP E NDITUR E 9,031 9,827 11,172 10,870 12,360 13,595 13,861 15,502 15,950 16,488
(7,294) OPE RATING S URPL US /(DE F IC IT) (7,977) (8,619) (9,933) (9,586) (10,658) (11,606) (11,830) (13,289) (13,681) (14,161)
Operating Defic it F unded by:
6,938 R ates 7,418 7,851 8,807 8,774 9,866 10,691 10,898 12,347 12,696 13,131
132 R eserves 309 430 455 513 478 495 505 517 529 542
224 Non F unded 240 255 268 277 286 392 409 413 444 475
‐ S ponsorship/Donations 10 83 403 22 28 28 18 12 12 13
7,294 TOTAL FUNDING 7,977 8,619 9,933 9,586 10,658 11,606 11,830 13,289 13,681 14,161

130
W
aipa District Council
2008/09 2009/10 2010/11 2011/12 2012/13 2013/14 2014/15 2015/16 2016/17 2017/18 2018/19
Budget B udget B udget B udget B udget B udget B udget B udget B udget B udget B udget
$000 $000 $000 $000 $000 $000 $000 $000 $000 $000 $000
C AP ITAL E XPE NDITURE
16,752 C apital E xpenditure 6,211 4,555 3,448 13,720 4,712 8,563 9,447 1,693 1,693 1,731
144 Debt R epayment 246 365 372 379 531 568 702 869 855 855
16,896 TOTAL C AP ITAL E XP E NDITUR E 6,457 4,920 3,820 14,099 5,243 9,131 10,149 2,562 2,548 2,586
F unded by:
‐ R ates 33 132 56 45 29 54 187 115 111 106
6,038 Loan 2,411 137 132 3,200 726 2,687 3,596 ‐ ‐ ‐
3,751 R eserves 694 2,408 678 4,158 3,059 1,263 1,231 1,259 1,221 1,234
1,123 Development C ontributions 1,254 1,060 1,089 1,980 1,429 1,717 1,762 1,188 1,216 1,246
5,984 S ponsorship/Donations 2,065 1,183 1,865 4,716 ‐ 3,410 3,373 ‐ ‐ ‐
16,896 TOTAL FUNDING 6,457 4,920 3,820 14,099 5,243 9,131 10,149 2,562 2,548 2,586
6,938 R E QUIR E D F ROM RATE S 7,451 7,983 8,863 8,819 9,895 10,745 11,085 12,462 12,807 13,237

10‐year Plan (2009‐19)
131
Recreation and Heritage Capital Expenditure Programme
2009/10 2010/11 2011/12 2012/13 2013/14 2014/15 2015/16 2016/17 2017/18 2018/19
Budget B udget Budget Budget B udget Budget Budget B udget Budget Budget
$000 $000 $000 $000 $000 $000 $000 $000 $000 $000
Analys is of C apital P rojec ts
Growth 1,254 1,060 1,089 1,980 1,429 1,717 1,762 1,188 1,216 1,246
Levels of S ervice/R enewal 4,957 3,495 2,359 11,740 3,283 6,846 7,685 505 477 485Total Rec reation and Heritage 6,211 4,555 3,448 13,720 4,712 8,563 9,447 1,693 1,693 1,731
P rojec ts
R eserve Developments 760 1,031 1,063 1,113 1,111 1,135 1,161 1,188 1,216 1,246
P arks R enewals 140 145 148 151 155 158 161 165 169 173
L ibrary Books 191 204 214 238 239 253 267 281 308 312
C ambridge L ibrary ‐ S ecurity Gates ‐ 19 ‐ ‐ ‐ ‐ ‐ ‐ ‐ ‐
Te Awamutu L ibrary E xpans ion ‐ ‐ ‐ ‐ ‐ ‐ 825 ‐ ‐ ‐
Te Awamutu Heritage and C ultural C entre ‐ ‐ ‐ ‐ 883 6,538 6,745 ‐ ‐ ‐
K arapiro Domain Development 4,970 1,348 2,023 216 ‐ 141 ‐ ‐ ‐ ‐
Gecks R ecreational Development 150 1,808 ‐ 108 110 338 288 59 ‐ ‐
C ambridge C ommunity P ool ‐ ‐ ‐ 11,894 2,214 ‐ ‐ ‐ ‐ ‐
Total Rec reation and Heritage 6,211 4,555 3,448 13,720 4,712 8,563 9,447 1,693 1,693 1,731

132
W
aipa District Council
Recreation and Heritage Performance Measures
2008/09 2009/10 2010/11 2011/12 2012/13 2013/14 2014/15 2015/16 2016/17 2017/18 2018/19
Budget Budget B udget B udget Budget B udget B udget B udget Budget B udget B udget
$ AVE RAGE OPE RATING C OS TS $ $ $ $ $ $ $ $ $ $
Per Res ident
84 P arks , R eserves , K arapiro Domain 106 106 115 123 120 129 119 127 133 140
46 Dis trict P ool Te Awamutu 44 44 44 44 44 46 42 47 46 47
4 Dis trict P ool C ambridge 7 6 6 2 36 47 45 45 46 47
17 Dis trict Museums 19 16 17 18 18 21 23 39 39 40
34 Dis trict L ibraries 31 30 32 35 36 37 35 37 39 39
7 Heritage 6 8 25 11 11 11 10 10 12 12
192 TOTAL 213 210 239 233 265 291 274 305 315 325
Dis tric t L ibraries
2.92 $ per book is sued 2.68 2.76 2.93 3.11 3.14 3.20 3.24 3.36 3.39 3.40

10‐year Plan (2009‐19) 133
Amenity Services
The Amenity Services activity area covers the non‐recreational property management functions of Council, including district halls, public toilets and pensioner housing. District halls provide a focal point for rural communities and cater for a wide range of uses. Council has also made a commitment to provide a basic housing service to pensioners. Both of these services contribute to the social wellbeing of the District. The community has expectations that public toilets will be available and well maintained, this is particularly important to the Home of Champions image that the District wants to convey to visitors. Also included in this significant activity are Councils cemetery, waste management and emergency management functions. Each is an essential undertaking for Council, driven by legislative requirements and community expectations. Council also operates a production forestry plantation which is primarily an investment and it may be of value in relation to any revised carbon trading initiatives the government establishes. Amenity Services Assets and How They Are Managed Cemeteries There are 10 cemeteries within the District operated by Council, with the majority being located near small rural settlements. Larger cemeteries are situated at Hautapu and Leamington servicing the Cambridge urban area, and Piquet Hill servicing Te Awamutu. There are no identified performance issues with any Waipa District cemetery at present. An assessment, carried out in 2004/05, did identify a future capacity issue with the Te Awamutu Cemetery and, in response, land is being acquired to provide for future expansion of this cemetery. Waipa District cemeteries provide for around 200 burials each year, with 90 percent of these being at the three larger cemeteries. Public Toilets Council owns 35 public toilets which are located in reserves and CBD areas where public gather for recreational, tourism or cultural events. An assessment of public toilets, carried out in early 2008, showed that the overall provision of toilets in the District is adequate to meet the estimated demand for the 10 year period of this Plan. The assessment considered a number of criteria including safety and security, hygiene and convenience. Most facilities scored well against these criteria, those that did not score so well are located in remote locations and meet the needs of users as a basic structure and facility. A program of upgrades to improve public toilets is in place.

134 Waipa District Council
While the number and distribution of public toilet facilities is currently adequate to meet both current and future demands, there are others drivers for demand than just the growth of resident and visitor population, such as the development of a new park, civic centre, shopping centre or changing use patterns at an existing destination. Therefore, there may still be a need to provide additional facilities to meet demands at a particular destination. Properties PENSIONER HOUSING Council owns 125 pensioner houses in eight complexes in the urban centres of Te Awamutu, Cambridge and Kihikihi. The purpose of pensioner housing is to provide affordable and safe accommodation for elderly people with limited incomes and people with additional physical or mental needs on limited incomes. Council does not intend to provide additional pensioner housing, but will continue to manage and maintain the existing houses that it owns. There is usually a permanent waiting list of tenants with an average waiting time of 18 months. The pensioner units are subject to a 10 year refurbishment program and on the basis of regular inspections have been assessed as being in a good overall state. Those that will be refurbished in the next few years are dated but still provide a good level of accommodation (as assessed during the annual valuation by an independent valuer). DISTRICT HALLS Council owns or is responsible for 32 district halls and the Cambridge, Kihikihi and Pirongia town halls. The halls provide a venue for a variety of social, cultural and recreational uses and reflect a strong sense of community ownership. With the exception of two older halls, the majority of halls have been assessed as being in average condition. A special rating area has been defined for 15 of the halls to assist funding maintenance and operating costs. Council does not anticipate any further demand for the provision of hall services for the life of the 10‐year Plan.
Cambridge Town Hall

10‐year Plan (2009‐19) 135
Forestry Council has an investment in forestry, a 250ha forestry plantation on the slopes of Mt Pirongia from which income is generated through logging sales. The trees are primarily radiata pine, ranging in age from 5 to 28 years. All blocks have been subject to silvicultural operations since 1990. The blocks have been consolidated into groupings of approximately 20ha to facilitate harvesting operations at about five‐yearly intervals and over the next ten years it is expected to operate with an overall cash surplus. Council will also investigate whether the plantation is likely to be of value in relation to any revised carbon trading initiatives the government may establish. Emergency Management and Rural Fires Council promotes community preparedness for emergencies and the implementation of emergency management plans. Staff work cooperatively with other authorities to plan for and respond to hazards, risks and emergencies and is a member of the Waikato Emergency Management Group. Council also has responsibility for rural fires and maintains a rural fire plan. This responsibility is managed with the support of the New Zealand Fire Service. Waste Management Council adopted a Waste Management Plan in 2005. The plan includes targets and actions regarding zero waste to landfill, reducing business and industry waste, trade wastes, management of land fills including diverting construction and demolition materials from them. The plan also sets targets for waste management in Council’s own facilities and for kerbside collection of recycling and refuse. A full summary of the Waste Management Plan is provided in Section 7 on page 329. A number of the targets have been achieved. However, the plan needs to be revised to take account of the requirements of the Waste Minimisation Act 2008; this review is currently planned for 2010. The Act introduces a range of new requirements aimed at achieving waste reduction in line with the Government’s waste strategy. Provisions include producer responsibilities and the introduction of waste levies. The impacts of these new provisions are being assessed and revenue from waste levies (in the order of $130,000 per annum) is expected. This revenue is required to be directed to waste minimisation initiatives as signalled in Council’s Waste Management Plan. The Plan details a range of waste minimisation initiatives. It is due for review before June 2010, within the period required by the new Act. Current economic conditions have meant that prices received for some recycled materials have dropped significantly and they are not expected to increase in 2009. Council recognises the cost pressure this places on Smart Environmental Limited (who Council contracts to provide the recycling service), and will work with the company to ensure continuation of this well‐supported service. Retaining the same level of service (frequency and materials collected) is likely to result in an increase in cost, although the amount is not yet known. Any increase could be funded by raising the level of the recycling rate and/or offset by increases using revenue from the waste levy.

136 Waipa District Council
Cambridge Refuse Transfer Station Council has entered into a short‐term arrangement with EnviroWaste to ensure residents have continued access to the Cambridge Refuse Transfer Station. The Transfer Station is owned and operated by EnviroWaste and the cost of this arrangement to Council is $28,000 per annum. Council considers that continuing the arrangement with EnviroWaste is the most cost effective option to provide access to a local refuse transfer station for residents of the Cambridge and Maungatautari wards. This arrangement will be funded from rates in the Cambridge and Maungatautari wards. Contribution to Community Outcomes Council’s amenity services activities contribute towards the achievement of the community outcomes listed below. Waipa Community Outcomes:
We acknowledge the need to pursue a ‘zero waste’ philosophy, including reducing our waste and using resources more efficiently.
Community services are coordinated and delivered effectively and efficiently to maximise resources while meeting the needs of our residents.
Public buildings and public transport options are safe, accessible to people of all ages and abilities and signage is clear and visible.
We reduce our reliance on non‐renewable energy. Good quality housing is available and affordable.
Assumptions That Have Been Made Emergency Management Any emergency work required in response to a natural disaster will be funded at that time. Cemeteries Based on recent burial trends, Council expects the number of burials to remain reasonably static over the period of this Plan. However, beyond this timeframe changes in the population structure may result in increased demand for burial plots. Pensioner Housing There will be no change to Council’s policy regarding adding additional houses to the pensioner housing stock, despite the projected increase in the number of residents over the age of 65.

10‐year Plan (2009‐19) 137
District Halls Current usage levels of district halls are expected to remain at the same level despite the projected growth. Waste Management The level of waste levy income expected is based on projections that include an allowance for a reduction in the current level of waste disposal to landfill. Potential Negative Significant Effects
POTENTIAL NEGATIVE EFFECT HOW WE ARE ADDRESSING THIS
There may be some objections to public toilets in the vicinity of homes or businesses as there is the possibility of vandalism, graffiti and inappropriate behaviour associated with the toilets.
Compliance with New Zealand standards in regards to public toilets will minimise negative effects. Council also follows CPTED principles in the construction of amenities.
As no additions to the pensioner housing stock are anticipated, the number of people on the waiting list and waiting time could increase in line with the projected increase in population over the age of 65.
Council maintain contact with other housing providers, such as Housing New Zealand, to ensure maximum use of rental accommodation.
Damage to the environment could occur during Forestry harvesting operations as a result of the heavy machinery required for this work.
Management of the plantation is contracted to a forestry specialist to ensure proper management actions are undertaken. Consents necessary for harvesting will be obtained and conditions complied with.
Equipment required in emergencies may create negative noise and visual effects; even though this could be disruptive it is necessary in an emergency.
In emergency situations preservation of lives and property is paramount and this will always be given highest priority. Council’s aim, however, would be to restore the community to normal as soon as possible.
Managing Changes in Demand As discussed in the previous pages in this Section, Council will continue to monitor and consider the appropriate response to any changes in demand.

138 Waipa District Council
Key Projects The following projects are proposed for 2009‐19:
PROJECTS TIMEFRAME
Reserve development – including land purchases Annual
Purchasing of library books Annual
Kerbside Recycling service Ongoing
The Challenge Ahead Council will work with the community to understand their expectations with regard to services and facilities in this significant activity. Those expectations will need to be balanced against providing sustainable and affordable services and facilities while ensuring work to maintain essential infrastructure is not comprised.

10‐year Plan (2009‐19)
139
Amenity Services Levels of Service and Measuring Performance
Cemeteries Level of service: Plots and berms are available
PERFORMANCE TARGET HOW THE ACTIVITY CONTRIBUTES TO COMMUNITY OUTCOMES
HOW WE MEASURE OUR PERFORMANCE 2009/10 2010/11 2011/12 2012‐19
CURRENT PERFORMANCE
By providing a well maintained and culturally appropriate place of remembrance that meets the needs of the community.
% of time plots and berms are available on demand for burials and cremations.
100% 100% 100% 100% New level of service
Level of service: Cemeteries are maintained to a tranquil and pleasing appearance
PERFORMANCE TARGET HOW THE ACTIVITY CONTRIBUTES TO COMMUNITY OUTCOMES
HOW WE MEASURE OUR PERFORMANCE 2009/10 2010/11 2011/12 2012‐19
CURRENT PERFORMANCE
By providing a well maintained and culturally appropriate place of remembrance that meets the needs of the community.
Number of complaints received regarding the appearance of the cemetery
Less than 3 Less than 3 Less than 3 Less than 3 New level of service
Level of service: Cemeteries provide for the needs of a wide‐range of ethnicities and religious groups
PERFORMANCE TARGET HOW THE ACTIVITY CONTRIBUTES TO COMMUNITY OUTCOMES
HOW WE MEASURE OUR PERFORMANCE 2009/10 2010/11 2011/12 2012‐19
CURRENT PERFORMANCE
By providing a well maintained and culturally appropriate place of remembrance that meets the needs of the community.
Number of complaints received regarding cultural or religious insensitivity
Less than 3 Less than 3 Less than 3 Less than 3 New level of service

140
W
aipa District Council
Pensioner Housing and District Halls Level of service: Timely response to service requests and system failures raised by occupiers of Council’s facilities
PERFORMANCE TARGET HOW THE ACTIVITY CONTRIBUTES TO COMMUNITY OUTCOMES
HOW WE MEASURE OUR PERFORMANCE 2009/10 2010/11 2011/12 2012‐19
CURRENT PERFORMANCE
By being managed effectively and efficiently to maximise resources while meeting the needs of our residents
Service requests and system failures will be responded to within the agreed timeframes: Emergencies responded to
within 2 hours Minor works responded to
within 2 working days General enquiries responded
to within 5 working days
100% 100% 100% 100% 100% of requests and failures were responded to within the agreed timeframes
Public Toilets
Level of service: Public toilets are designed appropriately and are well maintained
PERFORMANCE TARGET HOW THE ACTIVITY CONTRIBUTES HOW WE MEASURE OUR PERFORMANCE 2009/10 2010/11 2011/12 2012‐19
CURRENT PERFORMANCE
Service requests will be responded to within the agreed timeframes: Emergencies/cleanliness
responded to within 2 hours Minor works responded to
within 5 working days
100% 100% 100% 100% New level of service
By ensuring the public toilets are accessible, clearly signed and managed effectively and efficiently to meet the needs of residents and visitors
% of residents (who respond to this question in the annual NRB survey) who are satisfied with public toilets
90% 90% 90% 90% 86% of residents who responded to this question were satisfied with the public toilets

10‐year Plan (2009‐19)
141
Waste Management
Level of service: All residents have access to a kerbside recycling service
PERFORMANCE TARGET HOW THE ACTIVITY CONTRIBUTES TO COMMUNITY OUTCOMES
HOW WE MEASURE OUR PERFORMANCE 2009/10 2010/11 2011/12 2012‐19
CURRENT PERFORMANCE
% of households using the kerbside recycling service (as determined in the annual NRB survey)
90% 90% 90% 90% 95%* of residents who responded to this question stated they used this service
By helping to reduce our waste and use resources more efficiently
% of urban residents (who respond to this question in the annual NRB survey) who are satisfied with recycling service
90% 90% 90% 90% 90% of residents who responded to this question were satisfied with the recycling service
Note: The review of Council’s Waste Management Plan in 2010/11 is expected to establish waste reduction targets for the District. These targets will be incorporated into the 2012 10‐year Plan.
*Council aims to meet the target specified and resourcing is allocated on that basis. If the target is exceeded, future targets will be assessed to determine whether or not a change can be supported by the available
resources.

142
W
aipa District Council
Amenity Services Operating and Capital Costs and Funding Forecasts
2008/09 2009/10 2010/11 2011/12 2012/13 2013/14 2014/15 2015/16 2016/17 2017/18 2018/19
Budget Budget B udget B udget Budget B udget B udget B udget Budget B udget B udget
$000 $000 $000 $000 $000 $000 $000 $000 $000 $000 $000
R E VE NUE
196 C emeteries 161 168 203 208 212 217 222 227 232 238
15 P ublic Toilets 30 31 32 33 33 34 35 36 36 37
997 P roperties 1,218 1,272 1,265 1,295 1,212 1,238 1,267 1,295 1,327 1,359
‐ F ores try ‐ ‐ ‐ 835 169 258 ‐ 271 ‐ ‐
6 R ural F ire/C ivil Defence 6 6 7 7 7 7 7 7 7 8
1,214 TOTAL R E VE NUE 1,415 1,477 1,507 2,378 1,633 1,754 1,531 1,836 1,602 1,642
OPE RATING E XPE NDITURE
262 C emeteries 272 281 295 312 315 326 331 340 353 362
409 P ublic Toilets 493 476 520 534 556 625 635 700 720 735
2,383 P roperties 5,134 3,510 3,000 3,206 3,026 3,157 3,135 3,246 3,530 3,518
16 F ores try 101 108 104 105 73 65 63 50 60 40
300 R ural F ire/C ivil Defence 316 334 345 356 362 371 378 386 396 405
1,398 Waste Management 1,266 1,359 1,449 1,555 1,577 1,663 1,774 1,872 1,961 2,073
4,768 TOTAL E XP E NDITUR E 7,582 6,068 5,713 6,068 5,909 6,207 6,316 6,594 7,020 7,133
(3,554) OPE RATING S URPL US /(DE F IC IT) (6,167) (4,591) (4,206) (3,690) (4,276) (4,453) (4,785) (4,758) (5,418) (5,491)
Operating Defic it F unded by:
3,448 R ates 3,723 4,011 3,962 4,312 4,261 4,529 4,601 4,855 5,230 5,319
‐ Loan 1,800 ‐ ‐ ‐ ‐ ‐ ‐ ‐ ‐ ‐
‐ R eserves 276 206 174 (695) (61) (156) 101 (183) 99 80
106 Non F unded 368 374 70 73 76 80 83 86 89 92
3,554 TOTAL FUNDING 6,167 4,591 4,206 3,690 4,276 4,453 4,785 4,758 5,418 5,491
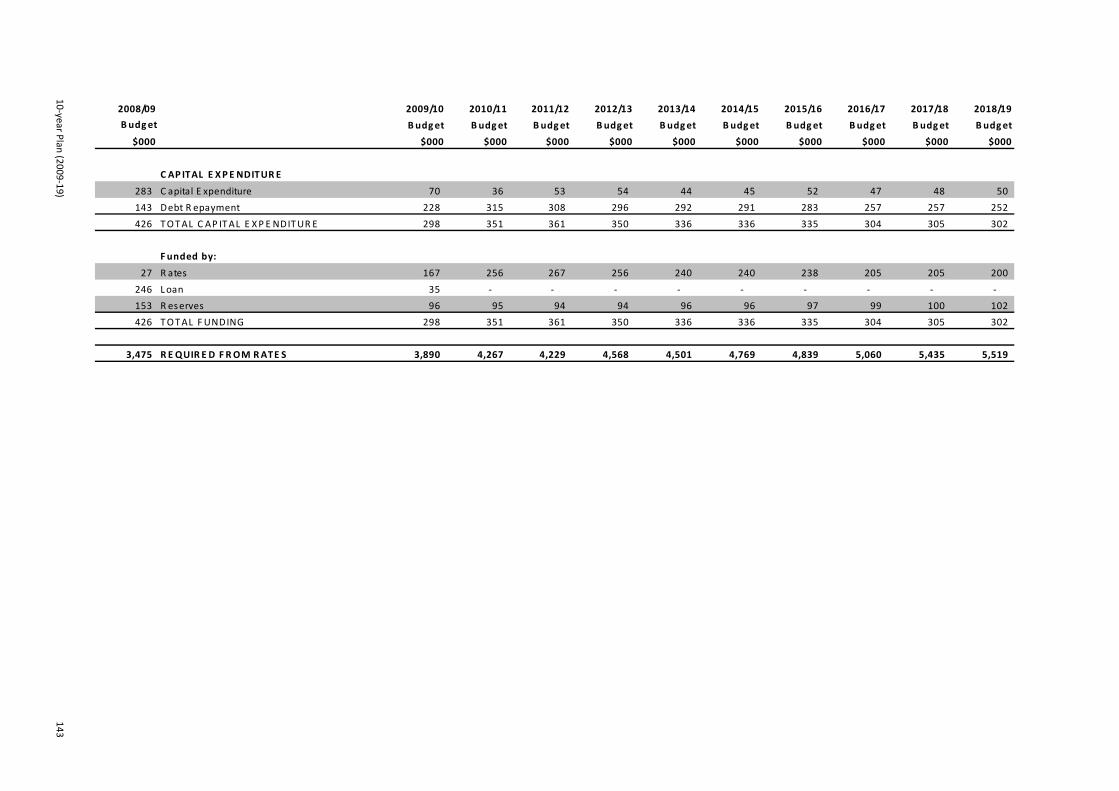
10‐year Plan (2009‐19)
143
2008/09 2009/10 2010/11 2011/12 2012/13 2013/14 2014/15 2015/16 2016/17 2017/18 2018/19
Budget Budget B udget B udget Budget B udget B udget B udget Budget B udget B udget
$000 $000 $000 $000 $000 $000 $000 $000 $000 $000 $000
C AP ITAL E XPE NDITURE
283 C apital E xpenditure 70 36 53 54 44 45 52 47 48 50
143 Debt R epayment 228 315 308 296 292 291 283 257 257 252
426 TOTAL C AP ITAL E XP E NDITUR E 298 351 361 350 336 336 335 304 305 302
F unded by:
27 R ates 167 256 267 256 240 240 238 205 205 200
246 Loan 35 ‐ ‐ ‐ ‐ ‐ ‐ ‐ ‐ ‐
153 R eserves 96 95 94 94 96 96 97 99 100 102
426 TOTAL FUNDING 298 351 361 350 336 336 335 304 305 302
3,475 R E QUIR E D F ROM RATE S 3,890 4,267 4,229 4,568 4,501 4,769 4,839 5,060 5,435 5,519

144
W
aipa District Council
Amenity Services Capital Expenditure Programme
2009/10 2010/11 2011/12 2012/13 2013/14 2014/15 2015/16 2016/17 2017/18 2018/19
Budget Budget Budget Budget Budget Budget B udget B udget B udget B udget
$000 $000 $000 $000 $000 $000 $000 $000 $000 $000
Analys is of C apital P rojec ts
Levels of S ervice/R enewal 70 36 53 54 44 45 52 47 48 50Total Amenity S ervic es 70 36 53 54 44 45 52 47 48 50
P rojec ts
P ublic C onveniences 70 36 53 43 44 45 46 47 48 50
C ivil Defence R adio ‐ ‐ ‐ 11 ‐ ‐ 6 ‐ ‐ ‐ Total Amenity S ervic es 70 36 53 54 44 45 52 47 48 50

10‐year Plan (2009‐19)
145
Amenity Services Performance Measures
2008/09 2009/10 2010/11 2011/12 2012/13 2013/14 2014/15 2015/16 2016/17 2017/18 2018/19
Budget Budget B udget B udget Budget B udget B udget B udget Budget B udget B udget
$ AVE RAGE OPE RATING C OS TS $ $ $ $ $ $ $ $ $ $
Per Res ident
6 C emeteries 6 6 6 7 7 7 7 7 7 7
10 P ublic Toilets 12 10 11 11 12 13 13 14 14 15
7 P ublic S afety (R ural F ire/C ivil Defence) 7 7 7 8 8 8 7 8 8 8
33 Waste Management 30 29 31 33 34 36 35 37 39 41
Pens ioner Hous ing
12.7 $ inves ted in millions 12.7 13.0 13.3 13.7 14.1 14.5 14.9 15.3 15.7 16.0
0.43% R eturn on inves tment 0.54% 0.49% 0.46% 0.36% 0.32% 0.30% 0.24% 0.07% 0.06% 0.03%

146 Waipa District Council
Transport Management
A safe, reliable and efficient transport network is essential to the way our communities function. The network enables us to interact both socially and for economic purposes, we also rely on it to ensure emergency services are able to assist us as quickly as possible when we need them. Transportation within Waipa District is dominated by travel by road, but society and government guidelines are demanding more sustainable options such as public transport, cycling and walking. Waipa is critically positioned at the crossroads to the Bay of Plenty, Taranaki and northwards to Hamilton and Auckland and our roads are increasingly used by heavy vehicles to move between these areas. The economic growth our District and the greater Hamilton area has also generated a significant increase in local freight volumes being transported within the District. Being one of the most productive dairy farming areas in the country, good quality local roads are important to ensuring farms can be serviced safely and efficiently and that rural communities are well connected to our towns. This significant activity specifically includes:
Road maintenance and renewal Roading improvements (widening, straightening etc.) Community safety programmes Seal extensions Bridging and culverts Traffic safety (minor safety improvements, street lighting, road marking and signage) Kerbing and drainage (sump shoulder clearing and water tabling) Street sweeping and leaf pick up Regulation management and control of the roading network (control of access, speed limits,
high exception use and other controls/legislative requirements) Street lighting Car parks Footpaths Public transport provision (in association with Environment Waikato) Planning for future developments
Council is the primary service provider for the construction, maintenance and repair of the local transport network within the District as per the requirements of the Local Government Acts 1974 and 2002. New Zealand Transport Agency (NZTA) is responsible for the state highway network. Council coordinates and contracts the physical works in this activity area to external organisations. This work is part funded by subsidies received from the NZTA. The Transport Management activity expenditure is 28% of Council’s total expenditure and the assets value is 45% of our total asset base.

10‐year Plan (2009‐19) 147
Transport Management Assets and How They Are Managed The District’s key transport management assets include 1,058 kms of roads (93% sealed), 189 bridges, 2,546 culverts, 169 kms of footpaths, 2,265 street lights, 76 stock underpasses and other related structures, all sitting on 2,167.2ha of land. Council has prepared an Asset Management Plan (AMP) covering the key transport management assets including the services that these assets help to deliver. These Plans are subject to ongoing review, particularly in relation to changes in service delivery standards and expectations, budget constraints and changes in the demand for and use of services. By monitoring community service delivery requirements, Council will be better able to develop and manage its assets and ensure community demand and service levels are met in the most effective and timely manner. Contribution to Community Outcomes This activity contributes towards the achievement of the following community outcomes: Waipa Community Outcomes:
We have reliable, efficient and well planned transport infrastructure systems that provide easy access to and through our towns.
Public buildings and public transport options are safe, accessible to people of all ages and abilities and signage is clear and visible.
The special character and heritage of our towns and villages is retained and promoted. Provision of industrial and residential areas is well balanced, carefully zoned to maintain our
rural/semi‐rural nature and planned well into the future. We reduce our reliance on non‐renewable energy. Our communities and agencies work together so that we are safe, we feel safe, crime is
reduced and there is a zero tolerance approach to anti‐social behaviour.
Assumptions That Have Been Made Climate change and changing weather patterns will have no significant impact or effect during the 10 year period. When there is an impact, it is likely to be as a result of increases in intensity and duration of rainfall which could alter land use and therefore road usage. Rainfall could also effect the drainage requirements and the water proofing of the roads. Further work is required to assess the long term effects of climate change on the roading network and to develop policies to manage this. Current levels of maintenance and capital renewal will more closely match the required level of renewal as identified in the AMP. No significant upgrades to the roading network in terms of capacity, alignment or connectivity are planned during the life of this plan.

148 Waipa District Council
The proposed Hautapu interchange with the Waikato Expressway Cambridge bypass at Victoria Road has been included in this Plan on the basis that NZTA will provide funding of $4.802 million over the years 2012/13 to 2014/15. The remaining $2.058 million is assumed to be funded by development contributions. Council’s view is that ratepayers should not be required to contribute to state highway infrastructure and the proposed interchange funding reflects that. However, this view has been disputed by NZTA. As a consequence, Council and NZTA have agreed to enter into a strategic evaluation to assess the relative benefits of the interchange to users of the state highway and local road networks to determine a final funding allocation. If there is a change from the funding allocation incorporated into this plan it will be included in either a future Annual Plan, an amendment to the 10‐year Plan or in the 2012‐22 10‐year Plan. No legislative or operational changes affecting the state highway network, rail freight or the number and/or size of heavy commercial vehicles using the local roading network will be made. The Cambridge Traffic Study completed in May 2007, identified that approximately 30% of the capacity of an interchange at Hautapu would benefit future growth. The completion of the State Highway 1 bypass defers any requirement for a third bridge for the foreseeable future and with minor traffic improvements the two existing bridges will provide a high level of service beyond 2026. Potential Negative Significant Effects
POTENTIAL NEGATIVE EFFECT HOW WE ARE ADDRESSING THIS
Poor planning of land use and transport networks can result in busy, congested roads that affect our lifestyle in a number of ways including noise and visual disturbance.
Council is preparing a transport strategy to ensure that transport infrastructure and land use planning are tightly integrated.
Congestion is a significant factor in the concentration of pollutants in the air. An increase in the number of vehicles using our transport network could result in increased air pollution for the residents of our District.
Through the integrated transport strategy Council will seek to minimise congestion in the district. Council will make use of the Waikato Regional Transportation Model to assist in optimising the efficiency of the network.
Increasing use of the network may result in more traffic accidents.
Council has a road safety programme which includes improvements to the roading network, such as widening, straightening and renewal.
Road construction can have a negative impact on the environment, particularly during earthworks. The impact could include such things as erosion, damage to flora and fauna, construction noise, air pollution, and possible impacts on places of cultural, historical and archaeological importance.
Potential risks are managed through adhering to industry best practice and by ensuring contractors who undertake the work are suitably qualified.
Run off from road surfaces may contain pollutants such as oil which have harmful environmental effects.
This is managed in sensitive urban environments through the design and operation of Council’s stormwater system.

10‐year Plan (2009‐19) 149
Managing Changes in Demand A combination of population projections, urban growth and development plans, and traffic data, are used to determine future requirements. As population and road usage increases in particular areas, upgrades and new roads are provided for in the annual budgeting process. These are forecast through the regional transport models. The projects identified in this Plan enable and support growth that is associated with development, by providing additional capacity. Assumptions regarding the levels of development have been used, these assumptions will need to be reviewed annually to confirm they are still valid and therefore confirm whether or not the identified projects are still required. Included in this 10‐year Plan are projects that Council believes will be necessary to provide additional capacity for the expected growth. Projects such as the intersection improvements of Benson Road and State Highway 3, safety works like seal widening and general pavement improvements. The expectations of rural‐residential and urban fringe residents are continuing to increase in regard to the provision of services and infrastructure allowing for active transport modes, such as walking, cycling and horse riding. The challenge for Council and the community is to manage the gap between expectations and affordability. A total of $27.5 million has been signalled in this 10‐year Plan for growth‐related projects. Growth‐related work will mainly be funded from development contributions with Council maximising the use of external subsidies where possible. Other works will be funded from NZTA subsidies and rates. Refer to Council’s Revenue and Financing Policy in Section 7 for further details of the funding. Strategic Considerations Government Policy Changes
The Government Policy Statement (GPS) Land Transport Funding 2009/10 – 2018/19 was introduced in August 2008, and details the Government’s desired outcomes and funding priorities for the land transport sector.
Targets have been developed in the following areas:
Reducing greenhouse gas emissions Freight mode shift Travel times and reliability on critical routes Road safety Public transport use Walking and cycling use

150 Waipa District Council
Regional Land Transport Programme The Waikato Regional Transport Committee has prepared a Regional Land Transport Programme (RLTP) for the Waikato region 2009/10‐2011/12 for consultation and public submission. This document is important to Waipa District Council as it establishes the regional priority for many of the transport activities in the District, including all state highway activities, local road improvements, walking and cycling, and community road safety activities (as outlined in Council’s 10‐year Plan). It also discusses regional funding allocations for transportation projects to be allocated through the National Land Transport Fund. Waikato Regional Land Transport Strategy The Waikato Regional Land Transport Strategy (RLTS) 2006‐16 became operative on 29 November 2006. The RLTS is the overriding plan for all land transport matters and provides a framework for developing, maintaining and protecting the land transport system in the Waikato Region for the next 10 to 20 years. The RLTS set a direction to move the Region away from a traditional road based transport system to a multi‐modal integrated transport system based upon a set of priorities, decision‐making and focussed investment on strategic goals. There are two key foundations to the strategy:
Focusing development on strategic corridors Managing travel demand and encouraging alternative modes of transport
The strategy will guide the future investments of road, rail, walking and cycling and passenger transport services to ensure an integrated, safe, responsive and sustainable land transport system. Implementation of the strategy will change the nature of the Region’s land transport system to one that better:
promotes and supports economic development, both locally and nationally manages and prioritises funding for land transport projects for the next decade recognises the critical role that alternative modes such as passenger transport, walking and
cycling and rail freight play in achieving community outcomes provides access and mobility for all people in the Region manages demand for private vehicle use and provides real alternatives encourages freight haulage to shift from road to rail
For Waipa District, the RLTS will result in some specific actions that Council will be responsible for. Activities and projects proposed by Council must be consistent with the strategy and incorporated into the Regional Land Transport Programme for national funding subsidies. The Land Transport Management Amendment Act (LTMA) 2008 has introduced changes relating to the requirements and preparation of regional land transport strategies. This includes moving the requirements to prepare and review a RLTS from a 3‐yearly to a 6‐yearly cycle. The Amendment also requires the strategy to cover a period of 30 years, recognising the long‐term nature of transport investment. Environment Waikato (EW) is planning for the review of the RLTS to begin this year (2009/10) and to be completed in 2010/11. Waipa District Council will work closely with EW and other regional transport partners in this process.

10‐year Plan (2009‐19) 151
Passenger Transport In 2008, Council conducted a joint review of Passenger transport services in the Waipa District with Environment Waikato. The review showed that there is a demand for a higher level of service than is currently provided. Current bus services connecting Cambridge and Te Awamutu/Kihikihi with Hamilton are a mix of private and contracted operations and are not integrated with services in Hamilton. Some of the services are no longer commercially viable. In conjunction with Environment Waikato (EW), Council plans to provide an improved service between Te Awamutu/Kihikihi and Hamilton, and Cambridge and Hamilton. These services will be integrated with Hamilton city service timetables wherever possible. The service will see eight return trips between Te Awamutu and Hamilton on weekdays and two return trips on weekends and public holidays. Between Cambridge and Hamilton, there will be seven return trips on weekdays and two return trips on weekends and public holidays. These will be subsidised services and Council will fund 25% of the costs remaining after fares are deducted. NZ Transport Agency will fund 50% of the remaining costs and EW Council 25%. The new services are expected to commence towards the end of 2009. Waipa Integrated Transport Strategy The Waipa Integrated Transport Strategy will bring together existing strategies, major investigations, and infrastructure and service proposals relevant to Waipa District. It will confirm the relevance and suitability of the local strategic framework for effective and sustainable transportation planning and network management in the context of the New Zealand Transport Strategy (NZTS), the Government Policy Statement on Transport, the Land Transport Management Act (LTMA) and the Regional Land Transport Strategy (RLTS). The strategy will develop an Integrated Transport Plan for Cambridge to address issues such as the proposed Hautapu interchange, rail and the Cambridge bypass, and consider the need for and location of a third bridge over the Waikato River. It will also identify the key relevant local transport and land use policies and strategies, focusing on transportation planning, land use and infrastructure planning. The strategy will feed into Council’s review of the District Plan which is expected to be completed by June 2010. Waikato Regional Transport Model Council has contributed to the development of the Waikato Regional Transportation model which is expected to be completed by mid‐2009. The model will enable all transport interested parties and planners to purchase reports from a single data set. Once completed, the model will be managed by the Local Authority Shared Services of which Council is a member.
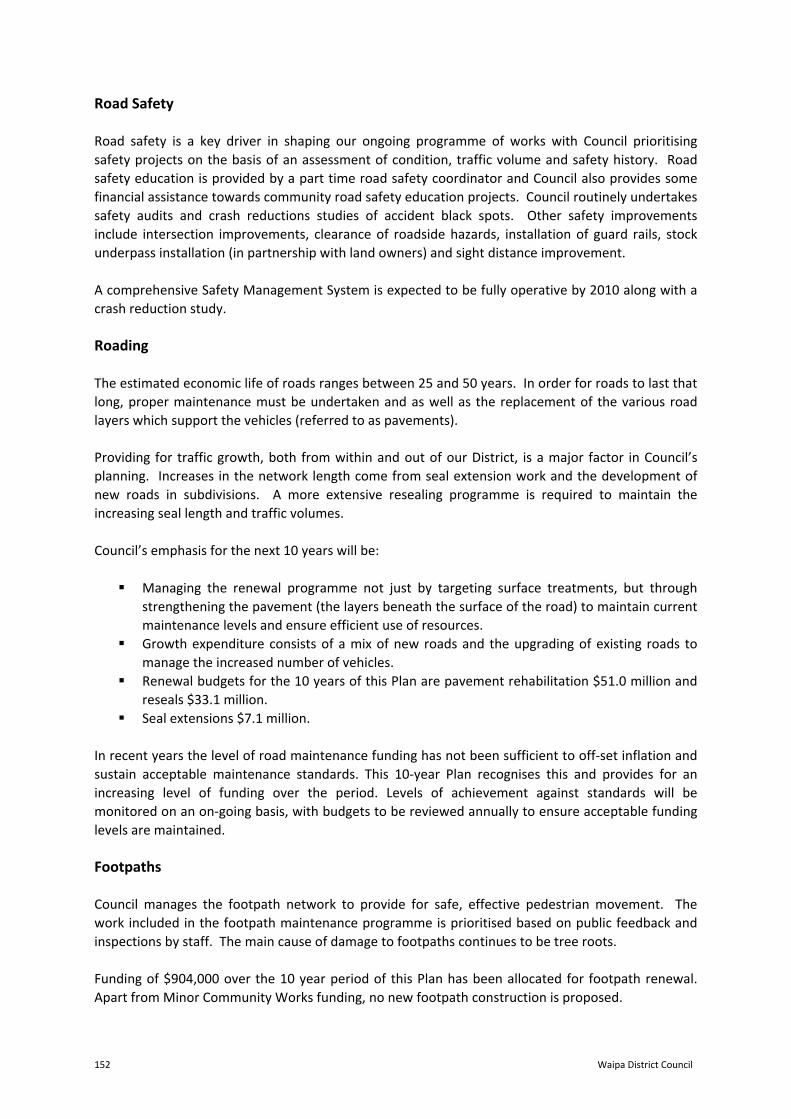
152 Waipa District Council
Road Safety Road safety is a key driver in shaping our ongoing programme of works with Council prioritising safety projects on the basis of an assessment of condition, traffic volume and safety history. Road safety education is provided by a part time road safety coordinator and Council also provides some financial assistance towards community road safety education projects. Council routinely undertakes safety audits and crash reductions studies of accident black spots. Other safety improvements include intersection improvements, clearance of roadside hazards, installation of guard rails, stock underpass installation (in partnership with land owners) and sight distance improvement. A comprehensive Safety Management System is expected to be fully operative by 2010 along with a crash reduction study. Roading The estimated economic life of roads ranges between 25 and 50 years. In order for roads to last that long, proper maintenance must be undertaken and as well as the replacement of the various road layers which support the vehicles (referred to as pavements). Providing for traffic growth, both from within and out of our District, is a major factor in Council’s planning. Increases in the network length come from seal extension work and the development of new roads in subdivisions. A more extensive resealing programme is required to maintain the increasing seal length and traffic volumes. Council’s emphasis for the next 10 years will be:
Managing the renewal programme not just by targeting surface treatments, but through strengthening the pavement (the layers beneath the surface of the road) to maintain current maintenance levels and ensure efficient use of resources.
Growth expenditure consists of a mix of new roads and the upgrading of existing roads to manage the increased number of vehicles.
Renewal budgets for the 10 years of this Plan are pavement rehabilitation $51.0 million and reseals $33.1 million.
Seal extensions $7.1 million. In recent years the level of road maintenance funding has not been sufficient to off‐set inflation and sustain acceptable maintenance standards. This 10‐year Plan recognises this and provides for an increasing level of funding over the period. Levels of achievement against standards will be monitored on an on‐going basis, with budgets to be reviewed annually to ensure acceptable funding levels are maintained. Footpaths Council manages the footpath network to provide for safe, effective pedestrian movement. The work included in the footpath maintenance programme is prioritised based on public feedback and inspections by staff. The main cause of damage to footpaths continues to be tree roots. Funding of $904,000 over the 10 year period of this Plan has been allocated for footpath renewal. Apart from Minor Community Works funding, no new footpath construction is proposed.

10‐year Plan (2009‐19) 153
Street Lights Street lights are provided in all urban areas of the District and there are flag lights at the intersections of major rural roads for easy identification and safety reasons. Lighting is also provided at amenity areas like carparks, reserves and under verandah lighting in the central business districts. There is a wide variety of light types in use, with the majority of street lights now containing efficient 70w high‐pressure sodium lamps. Council has made no allowance within this Plan to carry out upgrade works to street lights or amenity lighting. Cycling and Walking Strategy Council has adopted a Cycling and Walking Strategy as a means of promoting greater use of cycling and walking as active modes of transport. The Strategy sets out a range of initiatives which are to be advanced as funding becomes available. Due to funding constraints Council has not been able to provide funding within this Plan to advance capital projects specified in the proposed Strategy. Non‐construction related initiatives can be progressed through other programmes, such as Road Safety. Key Projects The following projects are proposed for 2009‐19:
PROJECTS TIMEFRAME
Renewals – including reseals and pavement rehabilitation Annual
Safety improvements Annual
Ngaroto Bridge Replacement 2009/10
Heart of Te Awamutu Projects 2009/10
Milicich Street Carpark 2009/10 – 2010/11
Cambridge North Deferred Residential 2009/10 – 2018/19
Seal Extensions 2010/11 – 2018/19
Bond Road Plan Change 2010/11, 2014/15 and 2018/19
Cambridge Bypass and Interchange 2012/13 –2015/16
Hautapu Industrial Growth Cell 2013/14
Details of the costs associated with these projects and other financial information relevant to this significant activity are included in the following pages.

154 Waipa District Council
The Challenges Ahead The expected growth, both within and outside of the District, will put pressure on the roading network and as such there will be increased demand for road widening, sealing, safety features and upgrades. If new roads are required, more land will be needed on which to build them. The added challenge of growth from traffic from outside of our District is that it is not something that Council can control or plan for. The status of major through roads (not currently State Highways) is a matter for discussion with the NZ Transport Agency. Council needs to consider changes to the nature of transport options and infrastructure that is required, for example the increasing number of urban based elderly residents that want options such as shuttle buses and consideration must also be given to those who are mobility impaired and users of mobility scooters.7 We have received feedback from the community, indicating a desire for an even higher level of service across the District’s roads, despite the fact that all current technical performance targets are met or exceeded. This includes wider shoulders, improved alignments, more permanent surfacing, smoother surfacing, more kerbing, streetscaping and high levels of road safety intervention. Council’s challenge will be to manage expectations. While budgeted inflation averaged 3% per annum, actual cost increases to the services in this activity increased between 26% and 48% per annum over the last three years. This has resulted in a significant gap between expectation and affordability and it will need to be reduced through either managing expectations or significant increases in budgets. This Plan reflects increased levels of funding over the period, however, a lower than desirable level of funding for road maintenance/renewals in the short‐term may see lower levels of resident satisfaction. Achievement against targets and standards will be reported annually, with the results informing the process of finalising future budgets. A challenge when planning for the future is the lack of certainty associated with the state highway improvements such as the Cambridge Bypass and Southern Links. We also need to take into account cross‐boundary issues, such as development on the fringes of Hamilton. Planning also needs to reflect the growing community desire for sustainable transport options, such as walking, cycling and buses. The state highway network is both an opportunity and constraint. In Waipa we are almost entirely reliant on that network to move people and goods and for operating our urban centres. The main capacity and efficiency issues have already been identified and generally projects have been developed to address them, however, there is no certainty regarding the implementation of these projects because they must go through national prioritisation for funding.
7 Information taken from the Transportation Profile Statement prepared by Waipa District Council in conjunction with Beca
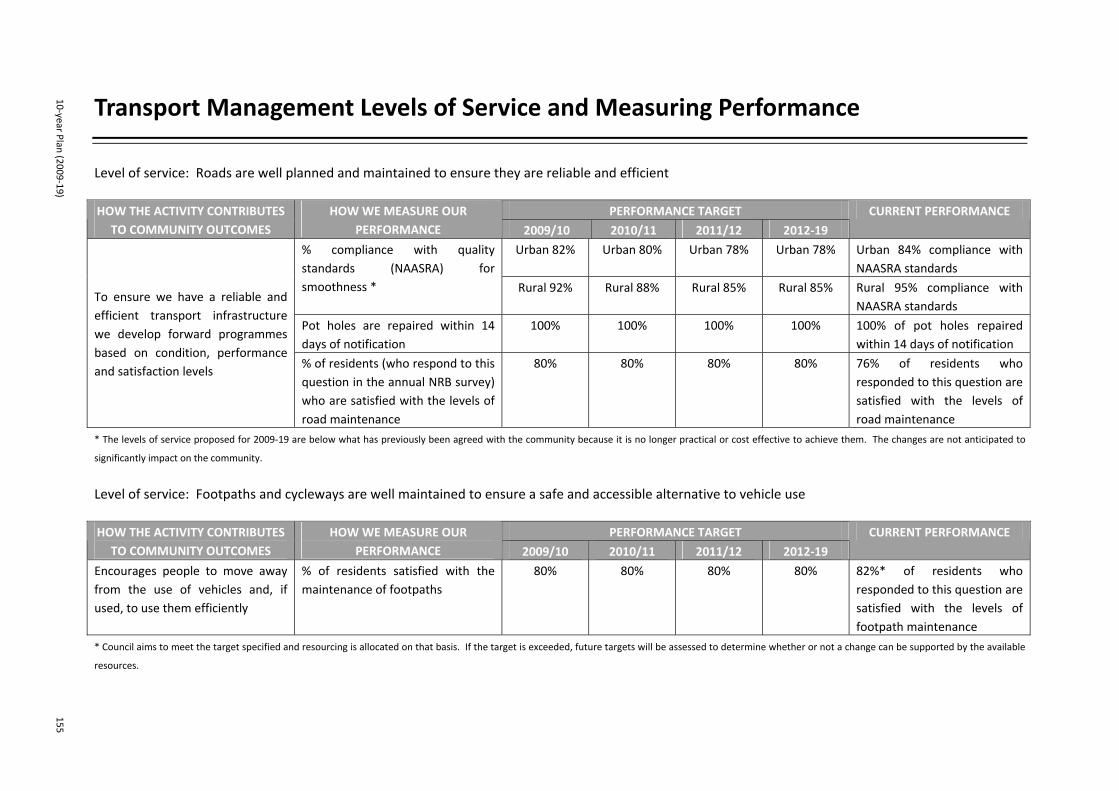
10‐year Plan (2009‐19)
155
Transport Management Levels of Service and Measuring Performance
Level of service: Roads are well planned and maintained to ensure they are reliable and efficient
PERFORMANCE TARGET HOW THE ACTIVITY CONTRIBUTES TO COMMUNITY OUTCOMES
HOW WE MEASURE OUR PERFORMANCE 2009/10 2010/11 2011/12 2012‐19
CURRENT PERFORMANCE
Urban 82% Urban 80% Urban 78% Urban 78% Urban 84% compliance with NAASRA standards
% compliance with quality standards (NAASRA) for smoothness *
Rural 92% Rural 88% Rural 85% Rural 85% Rural 95% compliance with NAASRA standards
Pot holes are repaired within 14 days of notification
100% 100% 100% 100% 100% of pot holes repaired within 14 days of notification
To ensure we have a reliable and efficient transport infrastructure we develop forward programmes based on condition, performance and satisfaction levels
% of residents (who respond to this question in the annual NRB survey) who are satisfied with the levels of road maintenance
80% 80% 80% 80% 76% of residents who responded to this question are satisfied with the levels of road maintenance
* The levels of service proposed for 2009‐19 are below what has previously been agreed with the community because it is no longer practical or cost effective to achieve them. The changes are not anticipated to
significantly impact on the community.
Level of service: Footpaths and cycleways are well maintained to ensure a safe and accessible alternative to vehicle use
PERFORMANCE TARGET HOW THE ACTIVITY CONTRIBUTES TO COMMUNITY OUTCOMES
HOW WE MEASURE OUR PERFORMANCE 2009/10 2010/11 2011/12 2012‐19
CURRENT PERFORMANCE
Encourages people to move away from the use of vehicles and, if used, to use them efficiently
% of residents satisfied with the maintenance of footpaths
80% 80% 80% 80% 82%* of residents who responded to this question are satisfied with the levels of footpath maintenance
* Council aims to meet the target specified and resourcing is allocated on that basis. If the target is exceeded, future targets will be assessed to determine whether or not a change can be supported by the available
resources.

156
W
aipa District Council
Level of service: The design and maintenance of the District’s roads supports community safety through reducing the injury crash trends
PERFORMANCE TARGET HOW THE ACTIVITY CONTRIBUTES TO COMMUNITY OUTCOMES
HOW WE MEASURE OUR PERFORMANCE 2009/10 2010/11 2011/12 2012‐19
CURRENT PERFORMANCE
Number of fatal accidents due to road factors
0 0 0 0 0 fatal accidents have been due to road factors We continually monitor the safety
of our community in our roading corridor and implement strategies to improve safety
% of residents (who respond to this question in the annual NRB survey) who are satisfied with the safety of the roads
80% 80% 80% 80% 79% of residents who responded to this question are satisfied with the safety of the roads
Level of service: Urban street lights are well lit at night
PERFORMANCE TARGET HOW THE ACTIVITY CONTRIBUTES TO COMMUNITY OUTCOMES
HOW WE MEASURE OUR PERFORMANCE 2009/10 2010/11 2011/12 2012‐19
CURRENT PERFORMANCE
We continually monitor the safety of our community in our roading corridor and implement strategies to improve safety
Lights are repaired within 14 days of notification of fault
100% 100% 100% 100% 100%

10‐year Plan (2009‐19)
157
Transport Management Operating and Capital Costs and Funding Forecasts
2008/09 2009/10 2010/11 2011/12 2012/13 2013/14 2014/15 2015/16 2016/17 2017/18 2018/19
Budget Budget Budget Budget Budget Budget Budget Budget Budget Budget Budget
$000 $000 $000 $000 $000 $000 $000 $000 $000 $000 $000
REVENUE
5,690 NZTA Subsidies 7,677 6,769 7,239 8,434 8,612 10,744 10,748 10,448 11,131 12,151
‐ Activity Revenue 180 191 201 206 211 215 220 226 231 236
5,690 TOTAL REVENUE 7,857 6,960 7,440 8,640 8,823 10,959 10,968 10,674 11,362 12,387
OPERATING EXPENDITURE
5,392 Depreciation & Amortisation 6,223 6,348 6,512 7,474 7,629 7,860 8,708 8,912 9,106 10,090
5,863 Activity Expenses 7,293 7,456 7,874 9,175 9,263 10,689 12,057 11,437 12,506 13,672
1,424 Overhead Allocation 2,648 2,759 2,846 3,286 3,189 3,513 3,698 3,682 3,981 4,251
949 Finance Costs 591 669 948 1,109 992 1,380 1,599 1,884 1,948 2,211
13,628 TOTAL EXPENDITURE 16,755 17,232 18,180 21,044 21,073 23,442 26,062 25,915 27,541 30,224
(7,938) OPERATING SURPLUS/(DEFICIT) (8,898) (10,272) (10,740) (12,404) (12,250) (12,483) (15,094) (15,241) (16,179) (17,837)
Operating Deficit Funded by:
6,888 Rates 8,198 8,805 9,258 10,881 10,743 10,898 13,261 13,526 14,369 15,936
‐ Reserves (803) ‐ ‐ ‐ ‐ ‐ ‐ ‐ ‐ ‐
250 Loan ‐ ‐ ‐ ‐ ‐ ‐ ‐ ‐ ‐ ‐
Development Contributions 703 667 682 723 707 785 1,033 915 1,010 1,101
800 Non Funded 800 800 800 800 800 800 800 800 800 800
7,938 TOTAL FUNDING 8,898 10,272 10,740 12,404 12,250 12,483 15,094 15,241 16,179 17,837
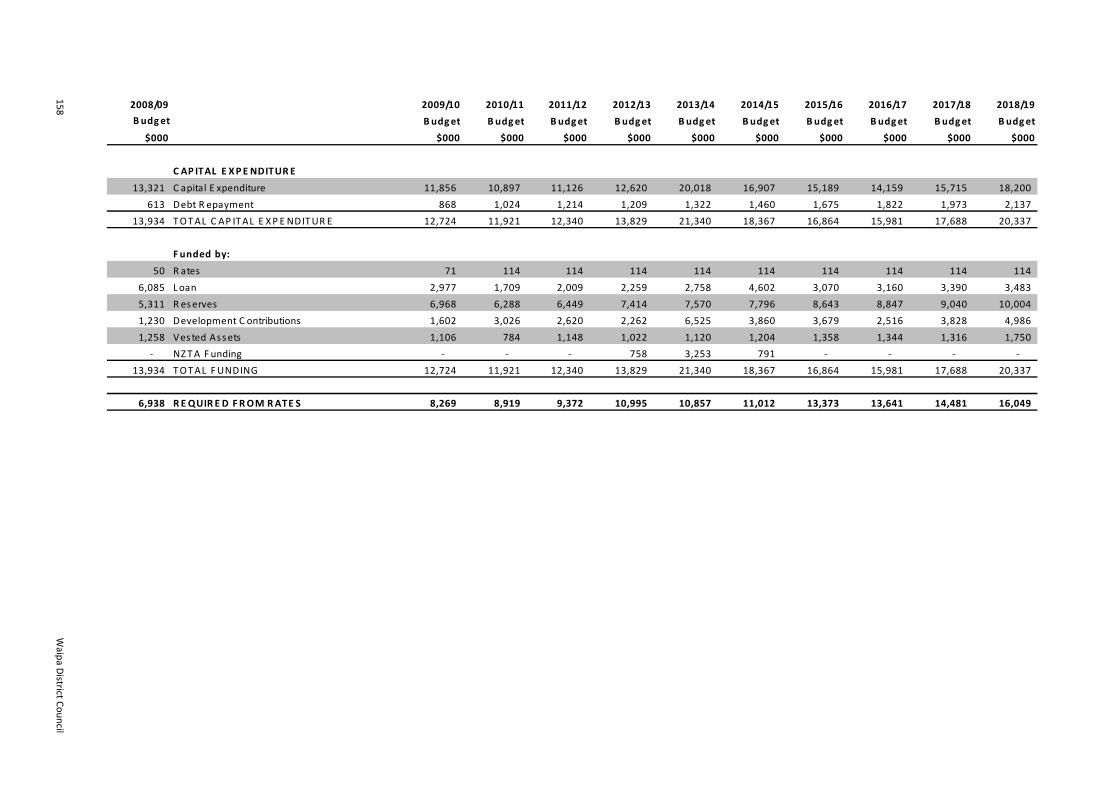
158
W
aipa District Council
2008/09 2009/10 2010/11 2011/12 2012/13 2013/14 2014/15 2015/16 2016/17 2017/18 2018/19
Budget B udget B udget B udget B udget B udget B udget B udget B udget B udget B udget
$000 $000 $000 $000 $000 $000 $000 $000 $000 $000 $000
C AP ITAL E XPE NDITURE
13,321 C apital E xpenditure 11,856 10,897 11,126 12,620 20,018 16,907 15,189 14,159 15,715 18,200
613 Debt R epayment 868 1,024 1,214 1,209 1,322 1,460 1,675 1,822 1,973 2,137
13,934 TOTAL C AP ITAL E XP E NDITUR E 12,724 11,921 12,340 13,829 21,340 18,367 16,864 15,981 17,688 20,337
F unded by:
50 R ates 71 114 114 114 114 114 114 114 114 114
6,085 Loan 2,977 1,709 2,009 2,259 2,758 4,602 3,070 3,160 3,390 3,483
5,311 R eserves 6,968 6,288 6,449 7,414 7,570 7,796 8,643 8,847 9,040 10,004
1,230 Development C ontributions 1,602 3,026 2,620 2,262 6,525 3,860 3,679 2,516 3,828 4,986
1,258 Vested Assets 1,106 784 1,148 1,022 1,120 1,204 1,358 1,344 1,316 1,750
‐ NZTA F unding ‐ ‐ ‐ 758 3,253 791 ‐ ‐ ‐ ‐
13,934 TOTAL FUNDING 12,724 11,921 12,340 13,829 21,340 18,367 16,864 15,981 17,688 20,337
6,938 R E QUIR E D F ROM RATE S 8,269 8,919 9,372 10,995 10,857 11,012 13,373 13,641 14,481 16,049
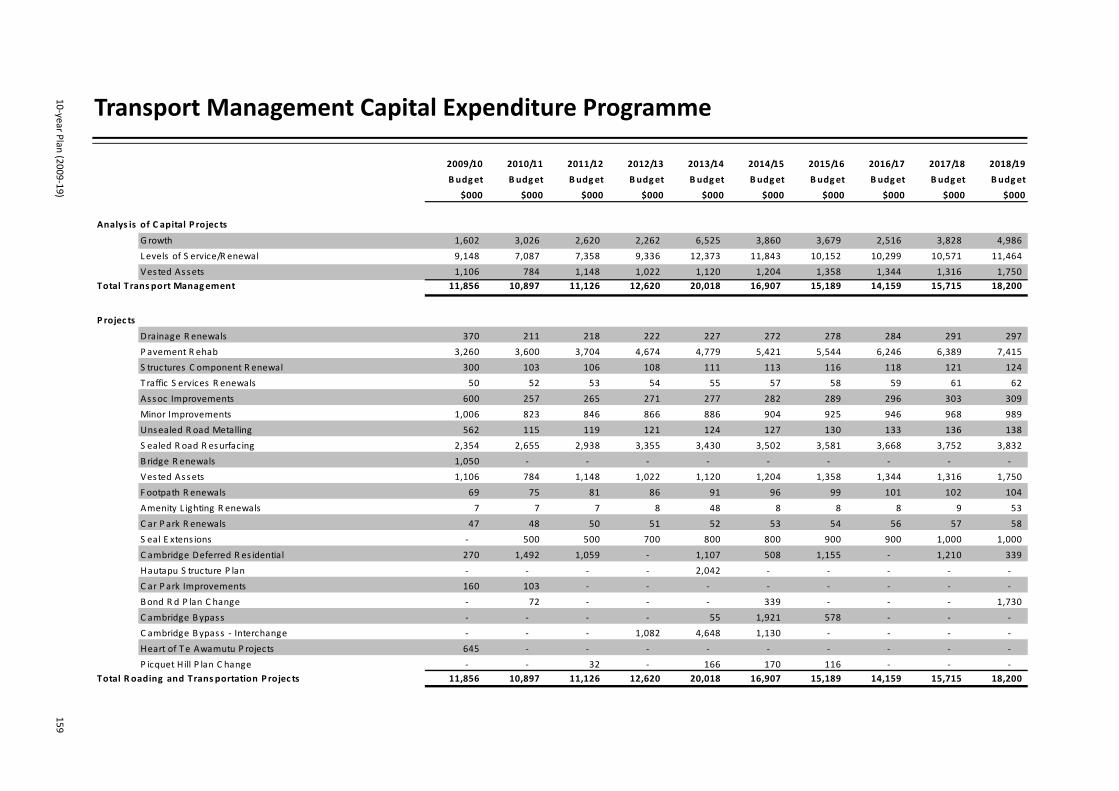
10‐year Plan (2009‐19)
159
Transport Management Capital Expenditure Programme
2009/10 2010/11 2011/12 2012/13 2013/14 2014/15 2015/16 2016/17 2017/18 2018/19
Budget B udget Budget Budget B udget Budget Budget B udget Budget Budget
$000 $000 $000 $000 $000 $000 $000 $000 $000 $000
Analys is of C apital P rojec ts
Growth 1,602 3,026 2,620 2,262 6,525 3,860 3,679 2,516 3,828 4,986
Levels of S ervice/R enewal 9,148 7,087 7,358 9,336 12,373 11,843 10,152 10,299 10,571 11,464
Vested Assets 1,106 784 1,148 1,022 1,120 1,204 1,358 1,344 1,316 1,750Total Trans port Management 11,856 10,897 11,126 12,620 20,018 16,907 15,189 14,159 15,715 18,200
P rojec ts
Drainage R enewals 370 211 218 222 227 272 278 284 291 297
P avement R ehab 3,260 3,600 3,704 4,674 4,779 5,421 5,544 6,246 6,389 7,415
S tructures C omponent R enewal 300 103 106 108 111 113 116 118 121 124
T raffic S ervices R enewals 50 52 53 54 55 57 58 59 61 62
Assoc Improvements 600 257 265 271 277 282 289 296 303 309
Minor Improvements 1,006 823 846 866 886 904 925 946 968 989
Unsealed R oad Metalling 562 115 119 121 124 127 130 133 136 138
S ealed R oad R esurfacing 2,354 2,655 2,938 3,355 3,430 3,502 3,581 3,668 3,752 3,832
B ridge R enewals 1,050 ‐ ‐ ‐ ‐ ‐ ‐ ‐ ‐ ‐
Vested Assets 1,106 784 1,148 1,022 1,120 1,204 1,358 1,344 1,316 1,750
F ootpath R enewals 69 75 81 86 91 96 99 101 102 104
Amenity L ighting R enewals 7 7 7 8 48 8 8 8 9 53
C ar P ark R enewals 47 48 50 51 52 53 54 56 57 58
S eal E xtens ions ‐ 500 500 700 800 800 900 900 1,000 1,000
C ambridge Deferred R es idential 270 1,492 1,059 ‐ 1,107 508 1,155 ‐ 1,210 339
Hautapu S tructure P lan ‐ ‐ ‐ ‐ 2,042 ‐ ‐ ‐ ‐ ‐
C ar P ark Improvements 160 103 ‐ ‐ ‐ ‐ ‐ ‐ ‐ ‐
Bond R d P lan C hange ‐ 72 ‐ ‐ ‐ 339 ‐ ‐ ‐ 1,730
C ambridge Bypass ‐ ‐ ‐ ‐ 55 1,921 578 ‐ ‐ ‐
C ambridge Bypass ‐ Interchange ‐ ‐ ‐ 1,082 4,648 1,130 ‐ ‐ ‐ ‐
Heart of Te Awamutu P rojects 645 ‐ ‐ ‐ ‐ ‐ ‐ ‐ ‐ ‐
P icquet Hill P lan C hange ‐ ‐ 32 ‐ 166 170 116 ‐ ‐ ‐Total Roading and Trans portation P rojec ts 11,856 10,897 11,126 12,620 20,018 16,907 15,189 14,159 15,715 18,200

160
W
aipa District Council
Transport Management Performance Measures
2008/09 2009/10 2010/11 2011/12 2012/13 2013/14 2014/15 2015/16 2016/17 2017/18 2018/19
Budget Budget B udget B udget Budget B udget B udget B udget Budget B udget B udget
E XPE NDITURE
1,881 $ P er lane kilometre on maintenance (1) 2,370 2,439 2,658 3,175 3,202 3,841 3,941 3,984 4,403 4,848
3,055 $ P er lane kilometre on renewals (2) 3,788 3,509 3,658 4,325 4,423 4,791 5,447 5,285 5,407 5,942
8.5 Total length of road reconstructed 12 14 14 17 17 19 19 21 21 24
70 Total length of road resurfaced 75 85 90 100 100 100 100 100 100 100
(1) NZTA work category. Includes sealed and unsealed pavement, drainage, bridge, environmental, traffic services maintenance and network management.
(2) NZTA work category. Includes unsealed metalling, reseals , drainage renewal, pavement rehabilitation, bridge s tructural replacement, traffic services renewal and
associated improvements .
Note:$ per lane km based on 1,058km x 2 lanes = 2,116 lane kiometres

10‐year Plan (2009‐19) 161
Stormwater
This significant activity covers the management, maintenance and development of stormwater collection systems in urban and particular rural areas of the District in order to protect the health and safety of people, land and property. Typically stormwater is described as being rainfall that runs off roofs, roads and other surfaces, and then, into gutters and stormwater collection systems such as pipes, culverts, open drains/swales and detention structures. Stormwater is a concern for two main reasons: the volume and timing of the run off water can result in flooding, and there is the potential contaminants may be in the water. Stormwater flows untreated directly into waterways, so if there are pollutants, these will go into the waterways and the health and safety of people, land and property could be affected. Both of these reasons can have an impact on the environment and therefore environmental protection and/or enhancement is required. Stormwater reticulation systems are necessary for the effective and safe removal of rainfall to appropriate open drains, streams, rivers and lakes. Cambridge, Te Awamutu, Ohaupo, Karapiro, Pirongia and Kihikihi typically have kerb and channel systems which discharge into stormwater pipes and open channels. Increases in the density of housing and a greater use of impermeable surfaces like asphalt have the potential to increase the volumes of stormwater that Council has to deal with. The effects of climate change may also exacerbate these volumes. In an effort to reduce the impact of pollutants entering the stormwater systems, Council is committed to dealing with this issue by developing and implementing effective stormwater practices. There is a statutory responsibility for Council to undertake these activities, as per the Local Government Acts 1974 and 2002 which empower Council to provide, repair and maintain all drainage works necessary for the efficient drainage of the District. We also recognise the important role this work has in achieving the District’s community outcomes. Waikato Regional Council requires local authorities to hold and maintain Resource Consents for the collection and discharge of stormwater from urban areas. Council is the primary service provider for managing stormwater in urban areas. Whilst the Council also manages a drainage system in most rural areas, other areas are jointly monitored by Council and/or the Waikato Regional Council. Stormwater Assets and How They Are Managed The stormwater systems in the District consist of 123 kms of pipes, 2,212 manholes and other related structures such as open drains, streams, swales, soak systems and retention structures.

162 Waipa District Council
There are stormwater assets ranging from new to 80 years of age, with the majority of the reticulation schemes in Cambridge and Te Awamutu being constructed of reinforced concrete in the 1970 – 1980 period. Based on pipe age, material and some field inspections, most of the pipes in our network are in “fair condition” with some pipes in “poor to very poor condition”. A renewal programme to maintain the condition of the stormwater assets is included in this 10‐year Plan. The renewal program is driven by the Asset Management Plan (AMP) that Council has prepared for stormwater. The Plan covers key assets, including the services those assets help to deliver, and it is subject to ongoing review, particularly in relation to changing service delivery standards and expectations, and changes in the demand for and use of services. By monitoring community service delivery requirements, Council will be better able to develop and manage its assets and ensure community demand and service levels are met in the most effective and timely manner. The AMP will be further developed in preparation for the development of the 10‐year Plan 2012‐22. Maintenance is generally completed under an operating contract and major renewal and replacement works will generally be contracted by public tender as per Council procedures. Council has a policy to fully fund depreciation from rates, while the cost to maintain and renew a scheme is funded by the ratepayers connected to those schemes. Renewals are funded from depreciation reserves and loans. Strategic Considerations Stormwater is discharged into stream tributaries across the District through overland flow and the reticulation network. It is important that these discharges do not have an adverse effect on the environment. Environment Waikato requires Council to demonstrate that stormwater entering the waterways does not contain any contaminants and that it is not affecting the quality of the environment where it ends up. Floodplain areas within our District, some of which are identified in the District Plan, need to be protected to ensure the area is not reduced in volume and to map other areas that could flood under extreme events. Growth is tending to occur at the extremities of the reticulation networks and there is a need to provide alternative methods for stormwater disposal. It is also necessary for developments to not increase stormwater discharge so that it becomes greater than the available run‐off and to retain any increase of stormwater on‐site, by using best practice engineering solutions. Contribution to Achieving Community Outcomes The collection, management and disposal of stormwater is essential for community and environmental wellbeing and contribute towards the achievement of the community outcomes listed on the following page.

10‐year Plan (2009‐19) 163
Waipa Community Outcomes:
We have reliable, efficient and well planned water, wastewater and stormwater infrastructure that supports development and growth while continuing to meet the needs of residents.
Water quality in our rivers and lakes is maintained and improved and water is used efficiently.
We are aware of the links between the health of our environment and our own health. Local organisations and individuals are regularly involved in environmental care activities.
Assumptions That Have Been Made Council has assumed that climate change issues are currently unlikely to be of significance within the 2009‐19 10 year financial forecasts. Stormwater discharge standards and conditions associated with the Environment Waikato consents will not significantly change in the 10 year life of this Plan. New developments will continue to carry out ‘best practice engineering’ ensuring that the development does not increase the discharge volumes and if it does, that the additional volume is retained on‐site. Potential Negative Significant Effects
POTENTIAL NEGATIVE EFFECT HOW WE ARE ADDRESSING THIS
The collection and disposal of stormwater can adversely affect the quality of receiving waters.
Compliance with resource consent conditions should mitigate any negative effects. Council also plans to develop new guidelines and rules to ensure new subdivision stormwater systems meet the required environmental outcomes.
There is potential for contaminants to enter streams, rivers and lakes after accidental spillages which could result in degradation of the natural environment and possible illness.
Council will work with other agencies, such as Environment Waikato and the NZ Fire Service, to ensure the impacts are minimised.
Failure to adopt effective management of the stormwater infrastructure could result in surface flooding.
Council carries out planned maintenance to the network and aims to respond to requests for minor works within one working day.

164 Waipa District Council
Managing Changes in Demand Based on the University of Waikato Population Studies Centre projection, it is anticipated that there will be an additional 3,276 households in Cambridge, 1,382 in Te Awamutu and 460 in the rest of the District by the year 2021. The majority of these dwellings will be located in new or recently approved subdivisions and appropriate stormwater infrastructure is a requirement of consent for these and is funded principally through development contributions. In addition, to meet increased demand for stormwater capacity Council will:
Carry out modelling of the reticulation network and assess what additional stormwater capacity is required in order to reduce flooding problems and ensure development can proceed. Future catchment modelling is also expected to be required in the future.
Adopt and enforce appropriate regulations to protect property and subdivision development from flood damage, including regulations to set minimum floor levels for buildings, and standards to ensure adequate overland flow paths and detention (holding) areas.
Develop new guidelines and rules to ensure new subdivision stormwater systems meet the environmental outcomes required by Council’s sustainable development approach, including the development of integrated catchment management planning to manage the town growth effects.
Carry out additional work to determine the long term effects of climate change on the stormwater assets within the District and develop the appropriate policies. We have assumed that climate change issues are currently unlikely to be of significance within the 2009‐19 10 year financial forecasts.
Key Projects The following projects are proposed for 2009‐19:
PROJECTS TIMEFRAME
District Stormwater renewals and upgrades Annual
Cambridge North Deferred Residential Annual
Lake Te Ko Utu Outfall Pipe Renewal 2009/10
Byron Street Outlet and Renewals/Upgrades 2009/10
Bond Road Plan Change 2011/12‐2012/13
Hautapu Industrial Growth Cell 2013/14‐2015/16
Details of the costs associated with these projects and other financial information relevant to this significant activity are included in the following pages. The Challenges Ahead Cost of service will continue to be a challenge for Council, in particular, the historical construction price increase, new treatment technologies, and possible increases in costs associated with environmental compliance. The work outlined in Managing Changes in Demand will be important in guiding Council in tackling this challenge.

10‐year Plan (2009‐19) 165
Over recent years regulatory compliance has resulted in the installation of a large number of high maintenance infrastructure elements. These include retention swales, litter traps and detention ponds. The maintenance cost of these types of structures is expected to add significantly to the ongoing cost of providing this service. The intensity and frequency of high rainfall events is increasing, therefore, Council will need to investigate the possible effects from this and/or climate change. There is expected to be growing demand from our communities and regulatory authorities to improve the quality of stormwater discharges to the surrounding environs.
Laying a replacement stormwater culvert
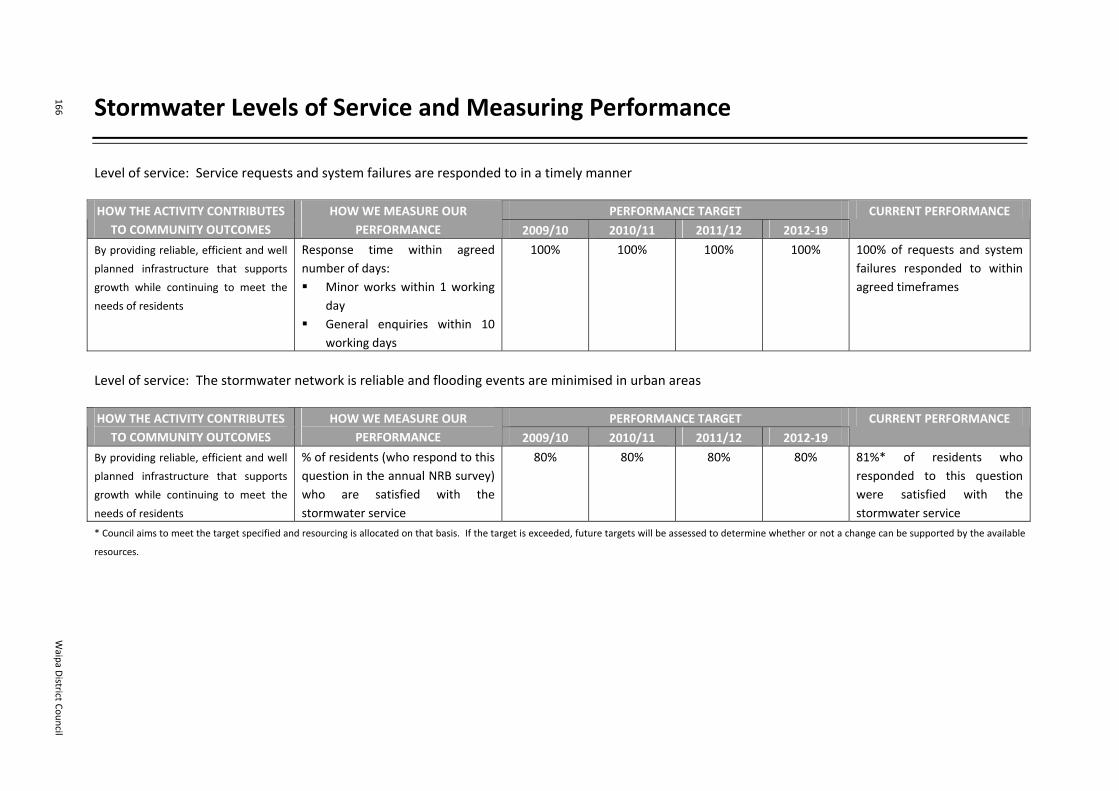
166
W
aipa District Council
Stormwater Levels of Service and Measuring Performance
Level of service: Service requests and system failures are responded to in a timely manner
PERFORMANCE TARGET HOW THE ACTIVITY CONTRIBUTES TO COMMUNITY OUTCOMES
HOW WE MEASURE OUR PERFORMANCE 2009/10 2010/11 2011/12 2012‐19
CURRENT PERFORMANCE
By providing reliable, efficient and well
planned infrastructure that supports
growth while continuing to meet the
needs of residents
Response time within agreed number of days: Minor works within 1 working
day General enquiries within 10
working days
100% 100% 100% 100% 100% of requests and system failures responded to within agreed timeframes
Level of service: The stormwater network is reliable and flooding events are minimised in urban areas
PERFORMANCE TARGET HOW THE ACTIVITY CONTRIBUTES TO COMMUNITY OUTCOMES
HOW WE MEASURE OUR PERFORMANCE 2009/10 2010/11 2011/12 2012‐19
CURRENT PERFORMANCE
By providing reliable, efficient and well
planned infrastructure that supports
growth while continuing to meet the
needs of residents
% of residents (who respond to this question in the annual NRB survey) who are satisfied with the stormwater service
80% 80% 80% 80% 81%* of residents who responded to this question were satisfied with the stormwater service
* Council aims to meet the target specified and resourcing is allocated on that basis. If the target is exceeded, future targets will be assessed to determine whether or not a change can be supported by the available
resources.

10‐year Plan (2009‐19)
167
Level of service: The quality of stormwater discharged from Council infrastructure is monitored and managed
PERFORMANCE TARGET HOW THE ACTIVITY CONTRIBUTES TO COMMUNITY OUTCOMES
HOW WE MEASURE OUR PERFORMANCE 2009/10 2010/11 2011/12 2012‐19
CURRENT PERFORMANCE
Water quality in rivers and lakes is managed through appropriate stormwater practices
Compliance with resource consent conditions (monitored in accordance with resource consent requirements)
100% 100% 100% 100% High level of compliance achieved and no abatement notices were issued by EW
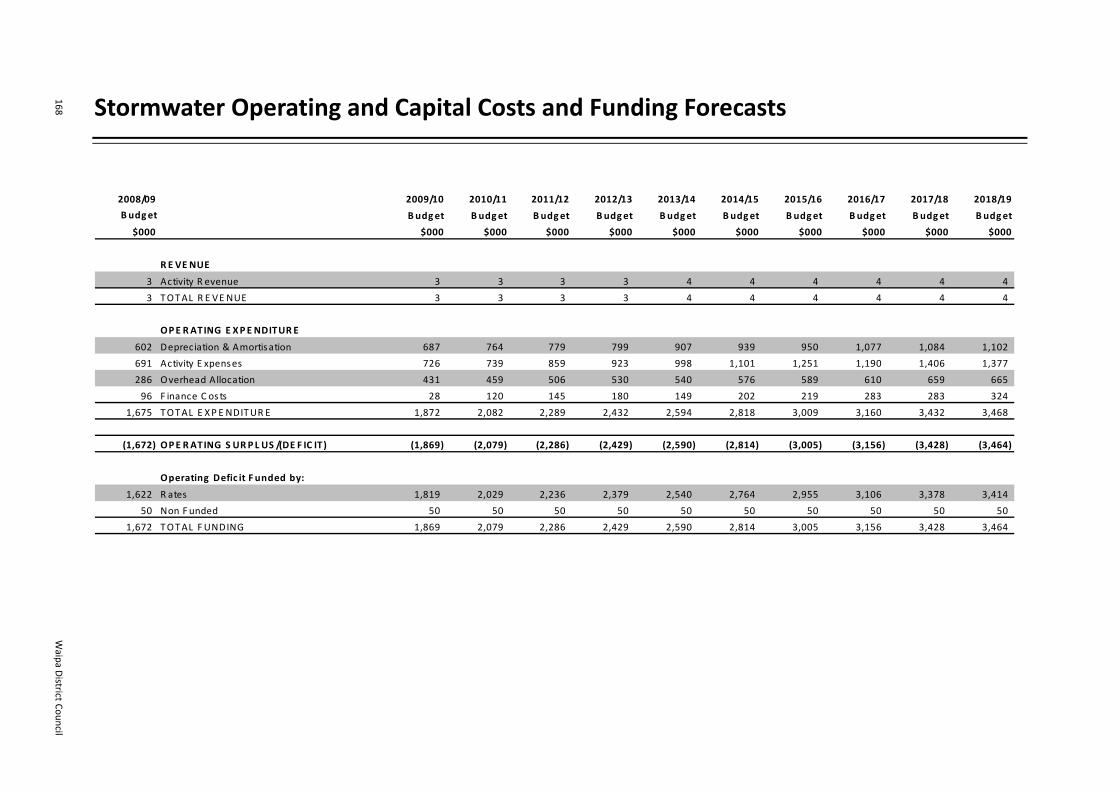
168
W
aipa District Council
Stormwater Operating and Capital Costs and Funding Forecasts
2008/09 2009/10 2010/11 2011/12 2012/13 2013/14 2014/15 2015/16 2016/17 2017/18 2018/19
Budget Budget B udget B udget Budget B udget B udget B udget Budget B udget B udget
$000 $000 $000 $000 $000 $000 $000 $000 $000 $000 $000
R E VE NUE
3 Activity R evenue 3 3 3 3 4 4 4 4 4 4
3 TOTAL R E VE NUE 3 3 3 3 4 4 4 4 4 4
OPE RATING E XPE NDITURE
602 Depreciation & Amortisation 687 764 779 799 907 939 950 1,077 1,084 1,102
691 Activity E xpenses 726 739 859 923 998 1,101 1,251 1,190 1,406 1,377
286 Overhead Allocation 431 459 506 530 540 576 589 610 659 665
96 F inance C osts 28 120 145 180 149 202 219 283 283 324
1,675 TOTAL E XP E NDITUR E 1,872 2,082 2,289 2,432 2,594 2,818 3,009 3,160 3,432 3,468
(1,672) OPE RATING S URPL US /(DE F IC IT) (1,869) (2,079) (2,286) (2,429) (2,590) (2,814) (3,005) (3,156) (3,428) (3,464)
Operating Defic it F unded by:
1,622 R ates 1,819 2,029 2,236 2,379 2,540 2,764 2,955 3,106 3,378 3,414
50 Non F unded 50 50 50 50 50 50 50 50 50 50
1,672 TOTAL FUNDING 1,869 2,079 2,286 2,429 2,590 2,814 3,005 3,156 3,428 3,464

10‐year Plan (2009‐19)
169
2008/09 2009/10 2010/11 2011/12 2012/13 2013/14 2014/15 2015/16 2016/17 2017/18 2018/19
Budget Budget Budget Budget Budget Budget B udget B udget B udget Budget Budget
$000 $000 $000 $000 $000 $000 $000 $000 $000 $000 $000
C AP ITAL E XPE NDITURE
1,456 C apital E xpenditure 3,346 1,584 2,397 2,017 3,494 2,376 3,287 2,217 2,901 2,920
39 Debt R epayment ‐ 348 75 27 36 45 57 50 61 79
1,495 TOTAL C AP ITAL E XPE NDITUR E 3,346 1,932 2,472 2,044 3,530 2,421 3,344 2,267 2,962 2,999
F unded by:
483 Loan 534 ‐ ‐ 177 161 230 324 306 362 409
593 R eserves 687 764 780 799 907 940 950 1,077 1,084 1,102
319 Development C ontributions 1,596 793 1,143 579 1,926 675 1,420 241 886 650
100 Vested Assets 529 375 549 489 536 576 650 643 630 838
1,495 TOTAL FUNDING 3,346 1,932 2,472 2,044 3,530 2,421 3,344 2,267 2,962 2,999
1,622 RE QUIR E D F ROM RATE S 1,819 2,029 2,236 2,379 2,540 2,764 2,955 3,106 3,378 3,414

170
W
aipa District Council
Stormwater Capital Expenditure Programme
2009/10 2010/11 2011/12 2012/13 2013/14 2014/15 2015/16 2016/17 2017/18 2018/19
Budget B udget Budget Budget B udget Budget Budget B udget Budget Budget
$000 $000 $000 $000 $000 $000 $000 $000 $000 $000
Analys is of C apital P rojec ts
Growth 1,596 793 1,143 579 1,926 675 1,420 241 886 650
Levels of S ervice/R enewal 1,221 416 705 949 1,032 1,125 1,217 1,333 1,385 1,432
Vested Assets 529 375 549 489 536 576 650 643 630 838Total S tormwater 3,346 1,584 2,397 2,017 3,494 2,376 3,287 2,217 2,901 2,920
P rojec ts
Vested Assets 529 375 549 489 536 576 650 643 630 838
R enewals 433 308 625 892 978 1,077 1,174 1,297 1,349 1,395
R eticulation 984 231 237 244 252 259 269 277 285 295
Bond R d P lan C hange ‐ ‐ 32 392 ‐ ‐ ‐ ‐ ‐ ‐
C ambridge Deferred R es idential 1,250 515 795 ‐ 563 290 600 ‐ 637 392
C ambridge Deferred R es idential S wale Land Acquis ition 150 155 159 ‐ 169 174 180 ‐ ‐ ‐
Hautputu S tructure P lan ‐ ‐ ‐ ‐ 996 ‐ 414 ‐ ‐ ‐Total S tormwater P rojec ts 3,346 1,584 2,397 2,017 3,494 2,376 3,287 2,217 2,901 2,920

10‐year Plan (2009‐19)
171
Stormwater Performance Measures
2008/09 2009/10 2010/11 2011/12 2012/13 2013/14 2014/15 2015/16 2016/17 2017/18 2018/19
Budget B udget B udget B udget B udget B udget B udget B udget B udget B udget B udget
QUANTITY
232 Open drains managed 232 232 232 232 232 232 232 232 232 232
122.4 P iped reticulation maintained 123 125 127 129 131 133 135 137 139 141
AVE RAGE OPE RATING C OS TS
1,230 R ural land drainage (per km of drain) 1,456 1,535 1,897 1,976 2,068 2,389 2,731 2,540 3,268 3,046
11,252 Urban s tormwater (per km of drain) 11,963 13,302 14,045 14,792 15,632 16,515 17,088 18,256 18,721 19,079
172 Waipa District Council
Water Treatment and Supply
Clean drinking water is recognised as a fundamental requirement for good community health. Council has responsibilities under both the Health Act and the Local Government Act for the supply and quality of potable water (water fit for consumption by humans and animals) across the community. Urban residents expect a continuous supply of high quality water delivered at an appropriate flow and pressure. Industrial and commercial organisations require a highly reliable supply of clean water. It is also expected that reticulated water will be available for fire fighting purposes in urban areas. Council supports some rural water supply schemes which supply potable water for both domestic and stock consumption. Water is becoming an increasingly scarce resource and Environment Waikato is limiting the volume that can be taken. Council is responsible for ensuring water resources are used in a sustainable way and therefore undertakes a guardianship role in managing the demand for water which needs to be actively supported by the community. Water Treatment and Supply Assets and How They Are Managed Over the last 10 years the Ministry of Health has signalled a need for improvements nationwide to drinking water quality and a reduction in the public health risks associated with drinking water supplies. Council is required to monitor drinking water and take all practicable steps to comply with the National Drinking Water Standards 2008 and implement risk management plans. These regulations have implications for the District’s drinking water supplies including upgrades to treatment plants, delivery pipes and water storage. Operating costs are expected to increase due to the higher standards and increased monitoring and reporting that will be required. There are approximately 12,550 consumers connected to the Council’s water supplies in the townships and surrounding areas of Pirongia, Te Awamutu, Te Rore, Ohaupo, Pukerimu, Kihikihi, Karapiro and Cambridge. Council’s major water supply assets include 7 treatment plants, 10 booster stations, 13 Reservoirs, 2 bores, 4 pipe bridges and 502 km of reticulation. Cambridge/Karapiro The Cambridge/Karapiro Water supply has three sources of water and treatment plants including Lake Karapiro, springs on Maungatautari and the Waikato River. Water abstracted (taken) from Lake Karapiro is treated at the Lake Karapiro Water Treatment Plant and pumped to the Karapiro Reservoirs. From the two springs on Maungatautari, water is gravity fed to the reservoirs at Karapiro. An upgrade to the treatment process is required to ensure compliance requirements can be met.
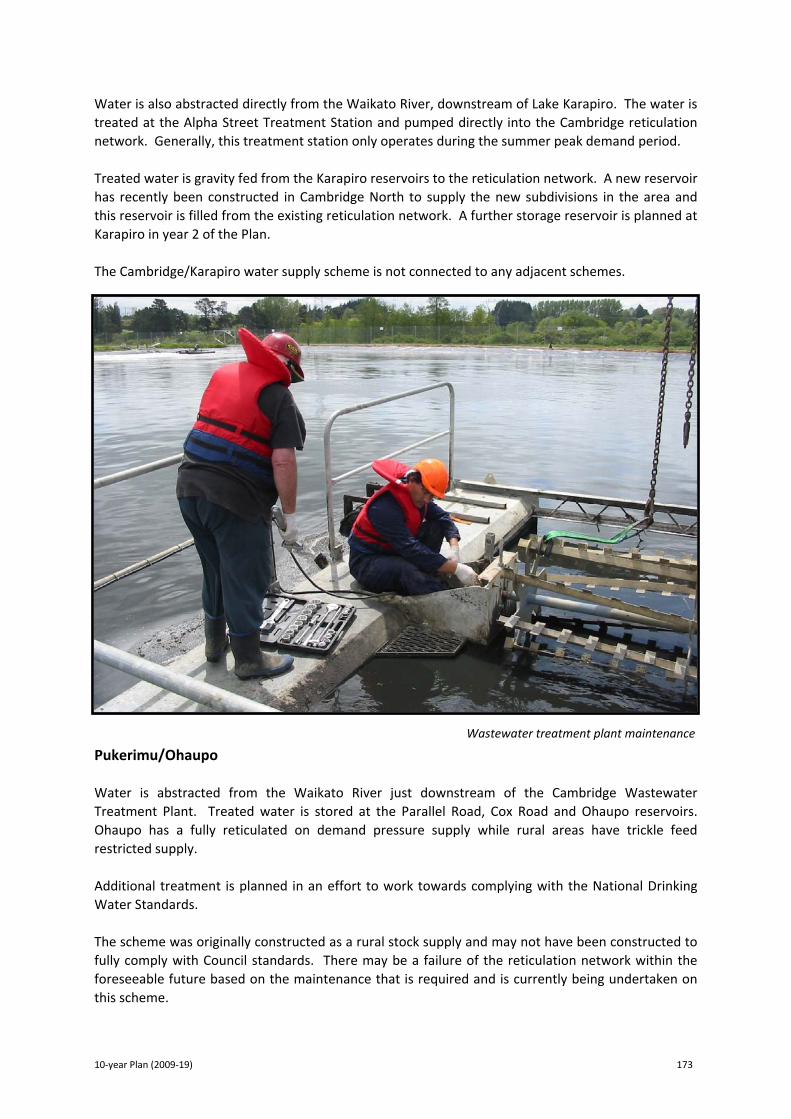
10‐year Plan (2009‐19) 173
Water is also abstracted directly from the Waikato River, downstream of Lake Karapiro. The water is treated at the Alpha Street Treatment Station and pumped directly into the Cambridge reticulation network. Generally, this treatment station only operates during the summer peak demand period. Treated water is gravity fed from the Karapiro reservoirs to the reticulation network. A new reservoir has recently been constructed in Cambridge North to supply the new subdivisions in the area and this reservoir is filled from the existing reticulation network. A further storage reservoir is planned at Karapiro in year 2 of the Plan. The Cambridge/Karapiro water supply scheme is not connected to any adjacent schemes. Pukerimu/Ohaupo Water is abstracted from the Waikato River just downstream of the Cambridge Wastewater Treatment Plant. Treated water is stored at the Parallel Road, Cox Road and Ohaupo reservoirs. Ohaupo has a fully reticulated on demand pressure supply while rural areas have trickle feed restricted supply. Additional treatment is planned in an effort to work towards complying with the National Drinking Water Standards. The scheme was originally constructed as a rural stock supply and may not have been constructed to fully comply with Council standards. There may be a failure of the reticulation network within the foreseeable future based on the maintenance that is required and is currently being undertaken on this scheme.
Wastewater treatment plant maintenance

174 Waipa District Council
No significant provision for renewal of the network is made in this 10‐year Plan. If failure does occur within the life of this Plan, the work required would be funded by loans and rated for in subsequent years. It is estimated that renewal of the whole network may cost in excess of $30 million. Demand is expected to increase within the boundaries of the water supply area. In particular, the Hamilton International Airport and Titanium Park industrial development will require additional supply, although there is potential for this supply to be drawn from other local authorities. It is possible for the Pukerimu and Cambridge schemes to be connected in the future, this would enhance the security of supply between these areas. Te Awamutu/Pirongia Water for the Te Awamutu water supply is abstracted from the Mangauika Stream and treated at the Te Tahi Water Treatment Plant. The resource consent for taking this water will be renewed in 2011. In the peak periods through summer, this water source is under a high level of stress and it is expected that Environment Waikato will impose limits on the amount of water Council can take. Council is investigating additional water sources, including groundwater and surface water options, to supplement the volumes available from the Mangauika Stream. Water is transported from the Te Tahi Water treatment Plant to the Pirongia and Te Awamutu reticulation networks via ‘trunk mains’ (large pipes), this services residents in Pirongia and Te Awamutu. These large pipes are nearing the end of their service life, and some pipe renewal work has already been carried out along Frontier Road, starting from Papesch Road and continuing towards Te Awamutu. There is currently limited capacity, in the form of reservoirs, to store treated water for the Te Awamutu and Pirongia communities. Kihikihi Kihikihi’s water supply is sourced from two groundwater bores and is treated at the Rolleston Water Treatment Plant and stored in the Rolleston Street reservoir. Additional water treatment may also be required to meet the prescribed standards. Te Rore Water for the Te Rore rural water supply is abstracted from the Maungamauka Stream. Existing treatment facilities do not meet standards and are unreliable. There are no plans for improvements before the resource consent expires in 2011. The main supply crosses the Waipa River over a pipe bridge that is in need of major repair or renewal. No provision for renewal is made within the life of the plan. If the system was to fail it is likely that Council would provide supply via a pipe from the Te Awamutu /Pirongia system. Again this would be funded by loans and rated for in subsequent years. The cost of this work is estimated to be between $1.3 and $2.5 million.

10‐year Plan (2009‐19) 175
Strategic Considerations Waipa has a high per capita demand for water and relatively high water losses when compared to figures provided by other councils. As water is becoming an increasingly scarce resource and most available water resources are at or near their allocable limit there is a need for a water conservation strategy that promotes the sustainable use of water. It is also likely that Environment Waikato will require Council to demonstrate that water is used efficiently when applying for new resource consents or renewing existing ones. Growth is tending to occur at the extremities of the reticulation networks requiring increasing reliance on high energy use to pump water to new developments. Growth needs to be carefully managed to ensure the most is made of existing infrastructure and that any new infrastructure operates efficiently. These issues are being considered as part of Council’s Growth Strategy, Waipa 2050. Contribution to Achieving Community Outcomes Council’s activities in this significant activity contribute towards the achievement of the community outcomes below. Waipa Community Outcomes:
We have reliable, efficient and well planned water, wastewater and stormwater infrastructure that supports development and growth while continuing to meet the needs of residents.
Water quality in our rivers and lakes is maintained and improved and water is used efficiently.
Community services are coordinated, and delivered effectively and efficiently to maximise resources while meeting the needs of our residents
Assumptions That Have Been Made Council will work to accommodate the new regulations and legislative requirements in an economically sustainable way. An increasing budget has been allowed for reticulation renewals, however, it is not yet at the level required to fully maintain the current levels of service. Climate change and changing weather patterns will have no significant impact or effect during the 10 year period. Council will be able to maintain the already approved current levels of water abstraction from all sources. Demand management policies and procedures will be adopted and implemented by all within our District.

176 Waipa District Council
Potential Negative Significant Effects
POTENTIAL NEGATIVE EFFECT HOW WE ARE ADDRESSING THIS
Abstracting water has the potential to generate adverse environmental impacts, such as depletion, of the supply sources. Council is subject to resource consents regarding water abstraction, and the Waikato Regional Council monitors our activities and the water source to ensure long term environmental effects are minimised. The challenge for communities with reticulated supplies is to ensure the most efficient use of water resources.
To effectively manage the available water resources, Council generally requires water meters to be installed on properties outside of the main urban areas or where the nature of the land‐use will or is likely to result in significantly higher levels of water consumption.
Council will prepare a Water Conservation/ Demand Management Strategy to ensure the most effective and efficient use of the treated water resource.
Increased public health standards have resulted in the need for significant capital investment and the subsequent ongoing operational costs in treatment facilities in future years.
While these costs will be met by users of the service, they will increase over time as Council continues to meet standards. The ability of users to sustain and fund projected levels of expenditure in order to meet increasing environmental standards will be carefully considered to minimise the impacts on community economic wellbeing.
If the of reticulated water supplies is inadequate the continued development of the District, particularly in and around urban areas could be threatened.
Council is continuing to work to ensure sufficient capacity to meet the economic development needs of the District, including the introduction of measures to control demand for water.
Managing Changes in Demand Providing for growth by keeping major capital expenditure to a minimum and maintaining operating costs at current levels will be a significant challenge moving forward. Council will endeavour to achieve full compliance with regulatory and legislative requirements. In addition, to meet increased demand for water supply and treatment capacity, Council will:
Carry out modelling and assess what additional capacity is required in existing and proposed water infrastructure and ensure development can proceed.
Adopt and enforce appropriate regulations to ensure provision of water supply that is of adequate flow and pressure, including for fire fighting requirements.
Develop new guidelines and rules to ensure new water systems meet the environmental outcomes required by Council’s sustainable development approach, including the development of integrated catchment management planning to manage the town growth effects.
Council will adopt a Demand Management Programme which will involve preparing and implementing a Water Conservation Strategy which will be actively supported by the Waipa community.

10‐year Plan (2009‐19) 177
Key Projects The following projects are proposed for 2009‐19:
PROJECTS TIMEFRAME
District wide pipe main renewals and replacements Annual
Te Tahi Bore Water Supply Establishment and Treatment 2009/10
Te Awamutu CBD Water Main Upgrade 2009/10
Bond Road Plan Change 2009/10‐2011/12
Cambridge North Deferred Residential 2009/10‐2011/12, 2013/14, 2015/16, 2017/18
Reservoir storage renewals and upgrades 2009/10‐2011/12, 2013/14 and 2017/18
Alpha Street Water Treatment Plant Treatment UV Upgrade 2010/11
Karapiro Water Treatment Plant Capacity and Treatment Upgrades 2010/11‐2011/12
Picquet Hill Plan Change 2010/11‐2014/15
Hautapu Industrial Growth Cell 2011/12, 2012/13 and 2016/17
Cambridge North Trunk Main 2012/13
Parallel Road Water Treatment Plant Treatment UV Upgrade 2013/14
Pukerimu Water Supply – Upgrade for Ohaupo and Airport 2013/14‐2016/17
The Challenges Ahead Council will need to undertake extensive long term planning for all drinking water supply schemes, this will include looking at use, type, connectivity, reliability and sustainability. This work will be undertaken in the context of asset management plan reviews and will also be informed by Council’s growth strategy. Council will work with the community to understand their expectations with regard to water supply, it will then need to balance those expectations with providing a sustainable and affordable service. Council is taking a conscious decision to work towards meeting the National Drinking Water Standards 2008, however the full implications of this are yet to be determined and there is general concern within the local government sector of the costs of meeting the guidelines compared to the benefit received. These concerns have been related to central government and Council give further consideration to the Standards when there is a government response. The challenge for Council and the community is to maintain an acceptable water supply and treatment network that is affordable and maintains the required level of infrastructure renewal. Cost of service will continue to be a challenge for Council, in particular, with regard to the historical construction price increases, new treatment technologies and possible increases in costs associated with environmental compliance.

178
W
aipa District Council
Water Treatment and Supply Levels of Service and Measuring Performance
Level of service: A reliable water supply is provided with adequate flow and pressure
PERFORMANCE TARGET HOW THE ACTIVITY CONTRIBUTES TO COMMUNITY OUTCOMES
HOW WE MEASURE OUR PERFORMANCE 2009/10 2010/11 2011/12 2012‐19
CURRENT PERFORMANCE
% of residents (who respond to this question in the annual NRB survey) who are satisfied with the water supply service
90% 90% 90% 90% 89% of the residents who responded to this question are satisfied with the water supply
A reliable and well planned infrastructure supports development and growth while continuing to meet the needs of residents
Flow and pressure requirements of the water supply bylaw are complied with
Yes Yes Yes Yes Yes bylaw requirements were complied with
Level of service: A reliable water supply is provided with adequate flow and pressure
PERFORMANCE TARGET HOW THE ACTIVITY CONTRIBUTES TO COMMUNITY OUTCOMES
HOW WE MEASURE OUR PERFORMANCE 2009/10 2010/11 2011/12 2012‐19
CURRENT PERFORMANCE
By ensuring that communities are prepared for emergencies
% of fire hydrants, tested annually*, that meet the NZ Fire Service Code of Practice
90% 90% 90% 90% New service
Note: Council will test all fire hydrants on a 5‐yearly basis, with 1/5th being tested on an annual basis.

10‐year Plan (2009‐19)
179
Level of service: Service requests and system failures are responded to within a timely manner
PERFORMANCE TARGET HOW THE ACTIVITY CONTRIBUTES TO COMMUNITY OUTCOMES
HOW WE MEASURE OUR PERFORMANCE 2009/10 2010/11 2011/12 2012‐19
CURRENT PERFORMANCE
A reliable and well planned infrastructure supports development and growth while continuing to meet the needs of residents
Response time within agreed number of days : Minor works within 2 working
days General inquiries within 10
working days
100% 100% 100% 100% 100% of requests and system failures responded to within agreed timeframes
Level of service: Conservation measures are implemented to ensure efficient water use is encouraged
PERFORMANCE TARGET HOW THE ACTIVITY CONTRIBUTES TO COMMUNITY OUTCOMES
HOW WE MEASURE OUR PERFORMANCE 2009/10 2010/11 2011/12 2012‐19
CURRENT PERFORMANCE
A reliable and well planned infrastructure supports development and growth while continuing to meet the needs of residents
The completion and implementation of a water supply management plan/water conservation strategy
Investigations undertaken
Preparation of management
plan
Management plan adoption
Implementation No water supply management plan in place
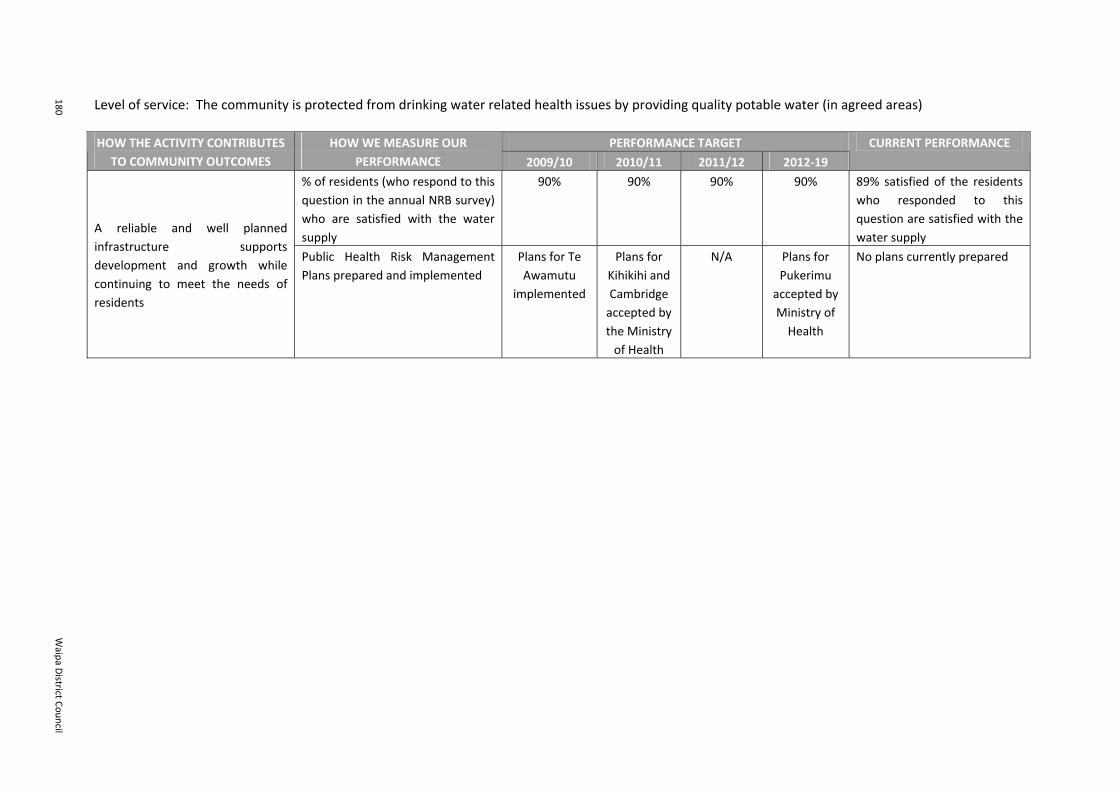
180
W
aipa District Council
Level of service: The community is protected from drinking water related health issues by providing quality potable water (in agreed areas)
PERFORMANCE TARGET HOW THE ACTIVITY CONTRIBUTES TO COMMUNITY OUTCOMES
HOW WE MEASURE OUR PERFORMANCE 2009/10 2010/11 2011/12 2012‐19
CURRENT PERFORMANCE
% of residents (who respond to this question in the annual NRB survey) who are satisfied with the water supply
90% 90% 90% 90% 89% satisfied of the residents who responded to this question are satisfied with the water supply
A reliable and well planned infrastructure supports development and growth while continuing to meet the needs of residents
Public Health Risk Management Plans prepared and implemented
Plans for Te Awamutu
implemented
Plans for Kihikihi and Cambridge accepted by the Ministry of Health
N/A Plans for Pukerimu accepted by Ministry of Health
No plans currently prepared

10‐year Plan (2009‐19)
181
Water Treatment and Supply Operating and Capital Costs and Funding Forecasts
2008/09 2009/10 2010/11 2011/12 2012/13 2013/14 2014/15 2015/16 2016/17 2017/18 2018/19
Budget B udget B udget B udget B udget B udget B udget B udget B udget B udget B udget
$000 $000 $000 $000 $000 $000 $000 $000 $000 $000 $000
2,764 Activity R evenue 3,144 3,295 3,446 3,600 3,783 3,962 4,171 4,377 4,596 4,834
2,764 TOTAL R E VE NUE 3,144 3,295 3,446 3,600 3,783 3,962 4,171 4,377 4,596 4,834
OPE RATING E XPE NDITURE
2,514 Depreciation & Amortisation 2,870 3,106 3,176 3,292 3,813 3,873 3,908 4,342 4,390 4,439
3,256 Activity E xpenses 3,432 3,681 4,111 4,347 4,361 5,097 5,416 5,832 6,170 6,714
737 Overhead Allocation 1,210 1,280 1,426 1,556 1,591 1,689 1,670 1,761 1,862 1,906
334 F inance C osts 221 323 654 832 967 756 751 626 526 443
6,841 TOTAL E XP E NDITUR E 7,733 8,390 9,367 10,027 10,732 11,415 11,745 12,561 12,948 13,502
(4,077) OPE RATING S URPL US /(DE F IC IT) (4,589) (5,095) (5,921) (6,427) (6,949) (7,453) (7,574) (8,184) (8,352) (8,668)
Operating Defic it F unded by:
3,817 R ates 4,147 4,835 5,661 6,167 6,689 7,193 7,314 7,924 8,092 8,408
R eserves 182 ‐ ‐ ‐ ‐ ‐ ‐ ‐ ‐ ‐
260 Non F unded 260 260 260 260 260 260 260 260 260 260
4,077 TOTAL FUNDING 4,589 5,095 5,921 6,427 6,949 7,453 7,574 8,184 8,352 8,668
C AP ITAL E XPE NDITURE
9,650 C apital E xpenditure 5,336 8,443 7,830 9,441 4,885 4,131 5,321 4,474 4,180 1,575
127 Debt R epayment 176 278 478 1,413 1,018 1,559 565 2,239 2,438 2,054
9,777 TOTAL C AP ITAL E XP E NDITUR E 5,512 8,721 8,308 10,854 5,903 5,690 5,886 6,713 6,618 3,629
F unded by:
5,894 Loan 2,033 3,984 2,293 ‐ ‐ ‐ 982 ‐ ‐ ‐
2,456 R eserves 2,640 2,876 2,946 3,062 3,582 3,643 3,677 4,111 4,160 3,132
1,140 Development C ontributions 565 1,667 2,785 7,539 2,044 1,749 891 2,269 2,132 64
287 Vested Assets 274 194 284 253 277 298 336 333 326 433
9,777 TOTAL FUNDING 5,512 8,721 8,308 10,854 5,903 5,690 5,886 6,713 6,618 3,629
3,817 RE QUIR E D F ROM RATE S 4,147 4,835 5,661 6,167 6,689 7,193 7,314 7,924 8,092 8,408

182
W
aipa District Council
Water Treatment and Supply Capital Expenditure Programme
2009/10 2010/11 2011/12 2012/13 2013/14 2014/15 2015/16 2016/17 2017/18 2018/19
Budget B udget Budget Budget B udget Budget Budget B udget Budget Budget
$000 $000 $000 $000 $000 $000 $000 $000 $000 $000
Analys is of C apital P rojec ts
Growth 565 1,667 2,785 7,539 2,044 1,749 891 2,269 2,132 64
Levels of S ervice/R enewal 4,497 6,582 4,761 1,649 2,564 2,084 4,094 1,872 1,722 1,078
Vested Assets 274 194 284 253 277 298 336 333 326 433Total Water Treatment & S upply 5,336 8,443 7,830 9,441 4,885 4,131 5,321 4,474 4,180 1,575
P rojec ts
Vested Assets 274 194 284 253 277 298 336 333 326 433
R enewals 2,593 3,965 1,911 1,437 1,752 2,355 3,849 1,878 1,624 975
R eticulation 1,050 1,206 390 2,304 818 552 573 589 161 167
Water Treatment P lant Upgrades 1,144 293 ‐ 109 ‐ ‐ 413 ‐ ‐ ‐
Upgrades due to Drinking Water S tandards 50 1,414 920 ‐ 614 ‐ ‐ ‐ ‐ ‐
Bond R d P lan C hange 100 773 106 ‐ ‐ ‐ ‐ ‐ ‐ ‐
K arapiro Water T reatment P lant Upgrade ‐ 412 3,505 ‐ ‐ ‐ ‐ ‐ ‐ ‐
P icquet Hill P lan C hange ‐ 134 529 675 158 926 ‐ ‐ ‐ ‐
C ambridge North Water S torage Upgrades 125 52 132 ‐ 1,266 ‐ 150 ‐ 159 ‐
Hautapu Water S torage Upgrades ‐ ‐ 53 4,663 ‐ ‐ ‐ 1,674 1,910 ‐ Total Water Treatment and S upply P rojec ts 5,336 8,443 7,830 9,441 4,885 4,131 5,321 4,474 4,180 1,575
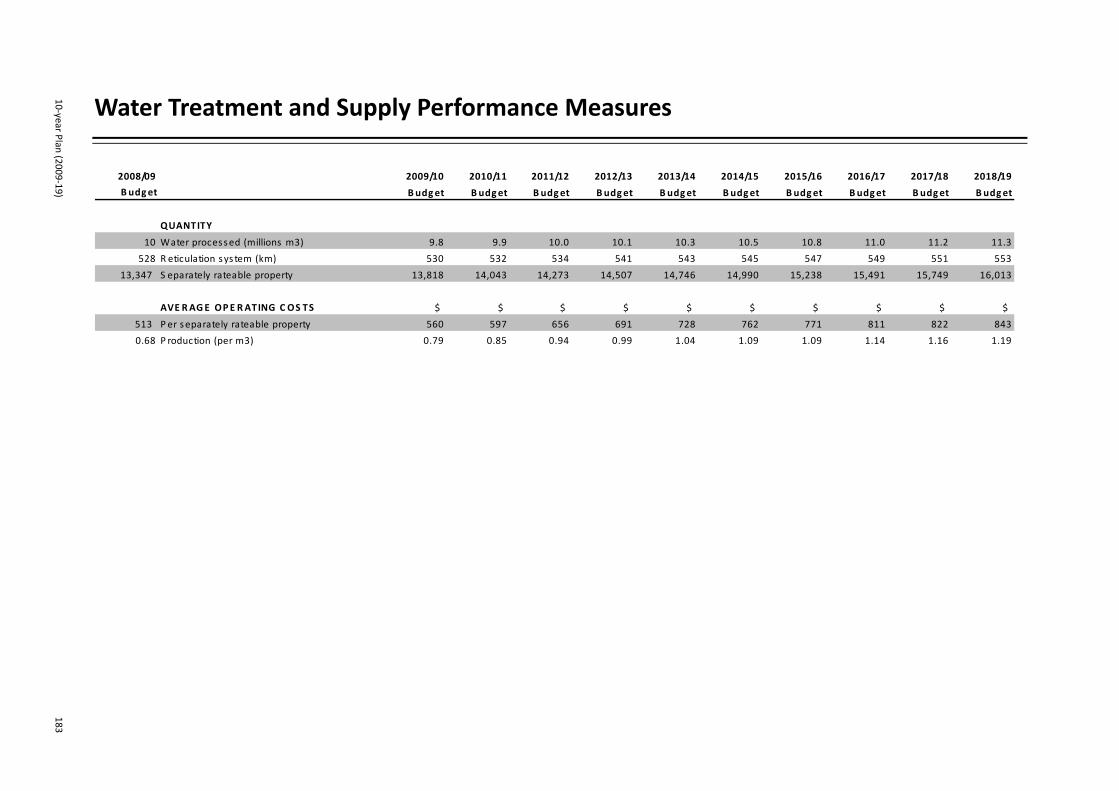
10‐year Plan (2009‐19)
183
Water Treatment and Supply Performance Measures
2008/09 2009/10 2010/11 2011/12 2012/13 2013/14 2014/15 2015/16 2016/17 2017/18 2018/19
Budget Budget B udget B udget Budget B udget B udget B udget Budget B udget B udget
QUANTITY
10 Water processed (millions m3) 9.8 9.9 10.0 10.1 10.3 10.5 10.8 11.0 11.2 11.3
528 R eticulation sys tem (km) 530 532 534 541 543 545 547 549 551 553
13,347 S eparately rateable property 13,818 14,043 14,273 14,507 14,746 14,990 15,238 15,491 15,749 16,013
AVE RAGE OPE RATING C OS TS $ $ $ $ $ $ $ $ $ $
513 P er separately rateable property 560 597 656 691 728 762 771 811 822 843
0.68 P roduction (per m3) 0.79 0.85 0.94 0.99 1.04 1.09 1.09 1.14 1.16 1.19

184 Waipa District Council
Wastewater Treatment and Disposal
A safe, effective and reliable system for managing waste water in urban areas is a basic requirement for maintaining public health and protecting land and waterways from contamination. Wastewater from toilets, laundries, kitchens, bathrooms and trade wastes is collected in Cambridge and Te Awamutu and piped to the treatment plants. The Local Government Act 2002 requires Council to continue to provide for the treatment and disposal of wastewater. The Health Act 1956 places an obligation on Council to promote and protect public health within the District. Council is also responsible for ensuring wastes are treated and disposed with in a way that minimises potential harm to the environment, consistent with the requirements of our resource consents, legislation and our sustainable development approach. Natural water is becoming scarce and Council must ensure it protects it from degradation. Wastewater Treatment and Disposal Assets and How They Are Managed Council provides a reticulated wastewater service to 10,7498 connected properties in the townships of Cambridge, Karapiro, Te Awamutu and Kihikihi. There is also a facility at the Cambridge wastewater treatment plant for the disposal of septic tanker waste. Annual maintenance programs are in place to maintain the systems and to minimise the risk of loss or reduction in service. Wastewater services are a continuous operation and, therefore, the operation and maintenance of the wastewater schemes require backup facilities, equipment, machinery and manpower to provide rapid response to a loss of service should it occur. The sewer mains have been identified as nearing the end of their operational life and renewal of these is required to reduce the risk of groundwater entering the system and causing sewer overflows in winter. Expenditure on sewer main renewals for the 10 years of this Plan is $15.2 million. The Te Awamutu wastewater treatment plant currently meets resource consent requirements and, on the whole, the plant performs well. However, small plant upgrades have been scheduled over the 10 year period to improve reliability and ensure compliance. The Cambridge treatment plant does not meet all Resource Consent requirements at present because there are non‐complying levels of inorganic nitrogen. The plant performance, as a whole, is also being reviewed and a major upgrade ($15.2 million) of the plant is scheduled for years 3 and 4 of this Plan. Approximately 30% of this upgrade can be attributed to meeting future growth requirements, including Cambridge North, St Kilda and Titanium Park. The plant will be designed to service a population equivalent to 30,000 people (this is a mix of residential, commercial and industrial).
8 The number of connected properties is as at January 2009.

10‐year Plan (2009‐19) 185
Strategic Considerations In winter collection of wastewater increases as a result of high levels of groundwater infiltration. As water quality is an increasing resource demand, Council recognises the need for a significant reduction of infiltration volume. These reductions will reduce the risk of overflows and spillages to the environment. It is also likely that Environment Waikato will require Council to demonstrate that wastewater is isolated from the environment when applying for new resource consents or renewing existing ones. Growth is tending to occur at the extremities of the reticulation networks requiring increasing reliance on high energy use to pump wastewater from new developments. Growth needs to be carefully managed to ensure the most is made of existing infrastructure and that any new infrastructure operates efficiently. These issues are being considered as part of Council’s growth strategy, Waipa 2050. Contribution to Achieving Community Outcomes Council’s activities in this significant activity area contribute towards the achievement of the community outcomes listed below. Waipa Community Outcomes:
We have reliable, efficient and well planned water, wastewater and stormwater infrastructure that supports development and growth while continuing to meet the needs of residents.
Water quality in our rivers and lakes is maintained and improved and water is used efficiently.
We are aware of the links between the health of our environment and our own health. Local organisations and individuals are regularly involved in environmental care activities.
Community services are coordinated, and delivered effectively and efficiently to maximise resources while meeting the needs of our residents
Assumptions That Have Been Made We have assumed that there will be no upgrades in the 10 year period to cater for growth in the Te Awamutu wastewater system. Council’s renewal program in Te Awamutu will reduce infiltration which may allow for the planned growth. Environmental standards for discharge and conveying wastewater will not change significantly during the life of this Plan. Climate change and changing weather patterns will have no significant impact or effect during the 10 year period. We will gain resource consent to upgrade capacity of the Waikato River Cambridge Sewer Bridge to enable growth in Cambridge to be catered for.

186 Waipa District Council
Potential Negative Significant Effects
POTENTIAL NEGATIVE EFFECT HOW WE ARE ADDRESSING THIS
The collection, treatment and disposal of sewage may result in odours and spillages.
Council responds promptly to sewage complaints of odour and sewage spillage.
Inadequate monitoring and infrastructure planning could potentially result in significant adverse environmental effects, such as damage to waterways. Public health risk, pollution and disease could also occur.
Council aims to minimise this risk by ensuring compliance with discharge consent conditions, and by ensuring compliance with appropriate New Zealand standards.
Increasing environmental standards will result in significant capital investment and ongoing operational costs in treatment facilities in future years.
While these costs will be passed onto users of the service, they will increase over time as Council continues to comply with standards. The ability of users to sustain and fund projected levels of expenditure will be carefully considered to minimise the impacts on community economic wellbeing.
Managing Changes in Demand Growth is tending to occur at the extremities of the wastewater networks requiring increasing reliance on energy. Growth needs to be carefully managed to ensure the most is made of existing infrastructure and that any new infrastructure operates efficiently. These issues are being considered as part of Council’s Growth Strategy Waipa 2050. Over the last five years, the number of Council pump stations has increased dramatically and this is expected to result in increased ongoing costs of the system. In addition, to meet increased demand for wastewater treatment and disposal capacity Council will:
Continue to carry out modelling to assess what additional wastewater capacity is required to ensure development can proceed.
Adopt and enforce appropriate regulations to protect property and subdivision development. Develop new guidelines and rules to ensure new subdivision wastewater systems meet the
environmental outcomes required by Councils sustainable development approach. Infiltration management to ensure reduction of the peak winter flow entering the
reticulation network and treatment plants.

10‐year Plan (2009‐19) 187
Key Projects The following projects are proposed for 2009‐19:
PROJECTS TIMEFRAME
District wide pipe and main renewals and upgrades Annual
Wastewater treatment plant renewals and upgrades Annual
Cambridge North Deferred Residential Annual
Te Awamutu CBD Sewer Main Upgrade 2009/10
Factory Road Sewer Trunk Main Upgrade 2009/10‐2010/11
Bond Road Plan Change 2009/10‐2011/12
Cambridge New Wastewater Treatment Plant 2012/13‐2014/15
Hautapu Industrial Growth Cell 2012/13
Picquet Hill Plan Change 2010/11‐2014/15
Cambridge Waikato River Bridge Upgrade 2011/12‐2012/13
The Challenges Ahead Cost of service will continue to be a challenge for Council, in particular, with regard to the historical construction price increases, new treatment technologies and possible increases in costs associated with environmental compliance. The public, in general, are becoming more sensitive to disruptions to supply and odours. The ageing life of our network will need to be considered and the appropriate plans put in place. Optimising performance of the treatment plants to reduce the effects of peak flows on the treatment and reticulation systems. The disposal of bio‐solids from all treatment plants remains a challenge and Council is investigating sustainable disposal methods. During the design, construction and commissioning of the new plant, Council’s challenge will be to ensure the existing plant remains operational.

188
W
aipa District Council
Wastewater Treatment and Disposal Levels of Service and Measuring Performance
Level of service: Council responds in a timely manner to service requests and system failures
PERFORMANCE TARGET HOW THE ACTIVITY CONTRIBUTES TO COMMUNITY OUTCOMES
HOW WE MEASURE OUR PERFORMANCE 2009/10 2010/11 2011/12 2012‐19
CURRENT PERFORMANCE
By providing a reliable, efficient and well planned infrastructure that supports development and growth while continuing to meet the needs of residents
Service requests and system failures will be responded to within the agreed timeframes: General enquiries responded
to within 10 working days Minor works responded to in
1 working day
100% 100% 100% 100% 100% of service requests and system failures are responded to within the agreed timeframes
Level of service: Discharges to air, water and land from the wastewater system are managed appropriately to ensure a healthy and safe infrastructure
PERFORMANCE TARGET HOW THE ACTIVITY CONTRIBUTES TO COMMUNITY OUTCOMES
HOW WE MEASURE OUR PERFORMANCE 2009/10 2010/11 2011/12 2012‐19
CURRENT PERFORMANCE
The number of customer complaints received about odour events* (audited quarterly)
Less than 30 odour
complaints per year
Less than 30 odour
complaints per year
Less than 30 odour
complaints per year
Less than 30 odour
complaints per year
31 odour complaints were received
By operating in a sustainable and environmentally friendly manner
Discharges from treatment plants meet resource consent standards set by Environment Waikato (EW)
100% 100% 100% 100% High level of compliance and no abatement notices were issued by EW
* The levels of service proposed for 2009‐19 are below what has previously been agreed with the community because it is no longer practical or cost effective to achieve them. The changes are not anticipated to
significantly impact on the community.

10‐year Plan (2009‐19)
189
Level of service: Council protects the communities from wastewater related issues by providing community reticulated systems HOW THE ACTIVITY CONTRIBUTES
TO COMMUNITY OUTCOMES HOW WE MEASURE OUR
PERFORMANCE PERFORMANCE TARGET CURRENT PERFORMANCE
By being managed effectively and efficiently to maximise resources while meeting the needs of residents
% of residents who respond to this question in the annual NRB survey) who are satisfied with the wastewater system
90% 90% 90% 90% 96%* of the residents who responded to the question are satisfied with the wastewater system
* Council aims to meet the target specified and resourcing is allocated on that basis. If the target is exceeded, future targets will be assessed to determine whether or not a change can be supported by the available
resources.
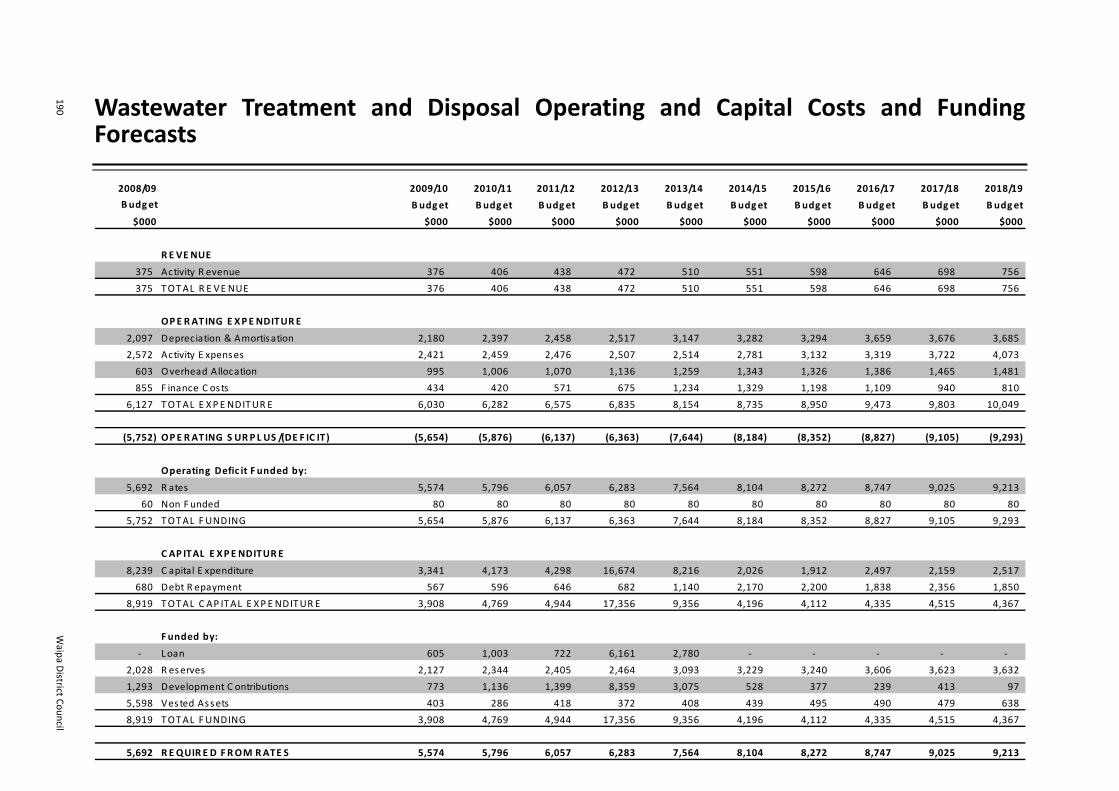
190
W
aipa District Council
Wastewater Treatment and Disposal Operating and Capital Costs and Funding Forecasts
2008/09 2009/10 2010/11 2011/12 2012/13 2013/14 2014/15 2015/16 2016/17 2017/18 2018/19
Budget B udget B udget B udget B udget B udget B udget B udget B udget B udget B udget
$000 $000 $000 $000 $000 $000 $000 $000 $000 $000 $000
R E VE NUE
375 Activity R evenue 376 406 438 472 510 551 598 646 698 756
375 TOTAL R E VE NUE 376 406 438 472 510 551 598 646 698 756
OPE RATING E XPE NDITURE
2,097 Depreciation & Amortisation 2,180 2,397 2,458 2,517 3,147 3,282 3,294 3,659 3,676 3,685
2,572 Activity E xpenses 2,421 2,459 2,476 2,507 2,514 2,781 3,132 3,319 3,722 4,073
603 Overhead Allocation 995 1,006 1,070 1,136 1,259 1,343 1,326 1,386 1,465 1,481
855 F inance C osts 434 420 571 675 1,234 1,329 1,198 1,109 940 810
6,127 TOTAL E XP E NDITUR E 6,030 6,282 6,575 6,835 8,154 8,735 8,950 9,473 9,803 10,049
(5,752) OPE RATING S URPL US /(DE F IC IT) (5,654) (5,876) (6,137) (6,363) (7,644) (8,184) (8,352) (8,827) (9,105) (9,293)
Operating Defic it F unded by:
5,692 R ates 5,574 5,796 6,057 6,283 7,564 8,104 8,272 8,747 9,025 9,213
60 Non F unded 80 80 80 80 80 80 80 80 80 80
5,752 TOTAL FUNDING 5,654 5,876 6,137 6,363 7,644 8,184 8,352 8,827 9,105 9,293
C AP ITAL E XPE NDITURE
8,239 C apital E xpenditure 3,341 4,173 4,298 16,674 8,216 2,026 1,912 2,497 2,159 2,517
680 Debt R epayment 567 596 646 682 1,140 2,170 2,200 1,838 2,356 1,850
8,919 TOTAL C AP ITAL E XP E NDITUR E 3,908 4,769 4,944 17,356 9,356 4,196 4,112 4,335 4,515 4,367
F unded by:
‐ Loan 605 1,003 722 6,161 2,780 ‐ ‐ ‐ ‐ ‐
2,028 R eserves 2,127 2,344 2,405 2,464 3,093 3,229 3,240 3,606 3,623 3,632
1,293 Development C ontributions 773 1,136 1,399 8,359 3,075 528 377 239 413 97
5,598 Vested Assets 403 286 418 372 408 439 495 490 479 638
8,919 TOTAL FUNDING 3,908 4,769 4,944 17,356 9,356 4,196 4,112 4,335 4,515 4,367
5,692 R E QUIR E D F ROM RATE S 5,574 5,796 6,057 6,283 7,564 8,104 8,272 8,747 9,025 9,213

10‐year Plan (2009‐19)
191
Wastewater Treatment and Disposal Capital Expenditure Programme
2009/10 2010/11 2011/12 2012/13 2013/14 2014/15 2015/16 2016/17 2017/18 2018/19
Budget B udget Budget Budget B udget Budget Budget B udget Budget Budget
$000 $000 $000 $000 $000 $000 $000 $000 $000 $000
Analys is of C apital P rojec ts
Growth 773 1,136 1,399 8,359 3,075 528 377 239 413 97
Levels of S ervice/R enewal 2,165 2,751 2,481 7,943 4,733 1,059 1,040 1,768 1,267 1,782
Vested Assets 403 286 418 372 408 439 495 490 479 638Total Was tewater Treatment and Dis pos al 3,341 4,173 4,298 16,674 8,216 2,026 1,912 2,497 2,159 2,517
P rojec ts
Vested Assets 403 286 418 372 408 439 495 490 479 638
R enewals 1,208 949 1,018 1,098 1,075 1,145 1,117 1,273 1,362 1,879
R eticulation 1,150 2,131 693 780 ‐ ‐ ‐ 403 ‐ ‐
Water Treatment P lant Upgrades ‐ ‐ 53 702 ‐ ‐ ‐ ‐ ‐ ‐
Bond R d P lan C hange 155 500 138 ‐ ‐ ‐ ‐ ‐ ‐ ‐
C ambridge New WW Treatment P lant 121 111 ‐ 7,266 6,069 ‐ ‐ ‐ ‐ ‐
C ambridge Upgrade P ipe Bridge 54 ‐ 1,077 408 ‐ ‐ ‐ 331 ‐ ‐
P icquet Hill P lan C hange ‐ 93 636 604 383 249 ‐ ‐ ‐ ‐
C ambridge North Deferred R es idential 250 103 265 ‐ 281 193 300 ‐ 318 ‐
Hautapu S tructure P lan ‐ ‐ ‐ 5,444 ‐ ‐ ‐ ‐ ‐ ‐Total Was tewater Treatment and Dis pos al P rojec ts 3,341 4,173 4,298 16,674 8,216 2,026 1,912 2,497 2,159 2,517

192
W
aipa District Council
Wastewater Treatment and Disposal Performance Measures
2008/09 2009/10 2010/11 2011/12 2012/13 2013/14 2014/15 2015/16 2016/17 2017/18 2018/19
Budget Budget B udget B udget Budget B udget B udget B udget Budget B udget B udget
QUANTITY
228.1 R eticulation maintained (km) 230 232 234 241 243 245 247 249 251 253
2.8 S ewerage volume treated (millions m3) 2.8 2.9 2.9 3.0 3.0 3.1 3.2 3.2 3.3 3.4
10,617 S eparately rateable property 10,777 11,057 11,343 11,634 11,931 12,234 12,543 12,858 13,180 13,508
AVE RAGE OPE RATING C OS TS
577 P er separately rateable property 560 568 580 588 683 714 714 737 744 744
2.19 P rocess ing ( per m3 treated) 2.15 2.17 2.27 2.28 2.72 2.82 2.80 2.96 2.97 2.96
10‐year Plan (2009‐19) 193
Support Services
Support services encompass the activities needed to support the work of Council and the delivery of services to customers. Support Services is not a significant activity in its own right, but it is a significant part of Council’s operating budget. Unlike the significant activities which are focused on public service delivery, these services are internally focused. The support services can be broadly categorised as general management and administrative support, policy development and monitoring, financial and human resource management, information and administrative services. These activities are an essential part of ensuring Council operates in an effective and efficient manner, meets its statutory obligations and is able to work towards the achievement of the community outcomes. The way in which Council conducts its activities and operations is, in many cases, controlled by legislation. The Local Government Act 2002, Local Government Official Information and Meetings Act and Local Government Rating Act 2002, for example, set out the administrative procedures and requirements to which Council must adhere. In addition, Council’s financial management must be conducted in accordance with generally accepted accounting practice and is subject to rigorous independent audit. Expenditure in this area relates to internal charges recovered as overheads or internal contracts from other activities. The costs of Support Services are shown as indirect costs (overheads) in each of Council’s significant activities. Support Services Assets and How They Are Managed The assets associated with this activity are the Council administration buildings (Bank Street, Te Awamutu, and Wilson Street, Cambridge) and information management and support systems. Maintenance and renewal works for the buildings and systems are identified through the Asset Management Plans (AMPs) and the appropriate plans are put in place to manage the required work. There is a renewal programme to replace and upgrade information technology equipment and software with an annual cycle and budget. Contribution to Achieving Community Outcomes Support services do not directly contribute to the community outcomes, however, they do support the significant activities where the primary responsibility for achieving the outcomes does sit. Assumptions That Have Been Made These services support the significant activities and assumptions, which have been made for each of the activities.
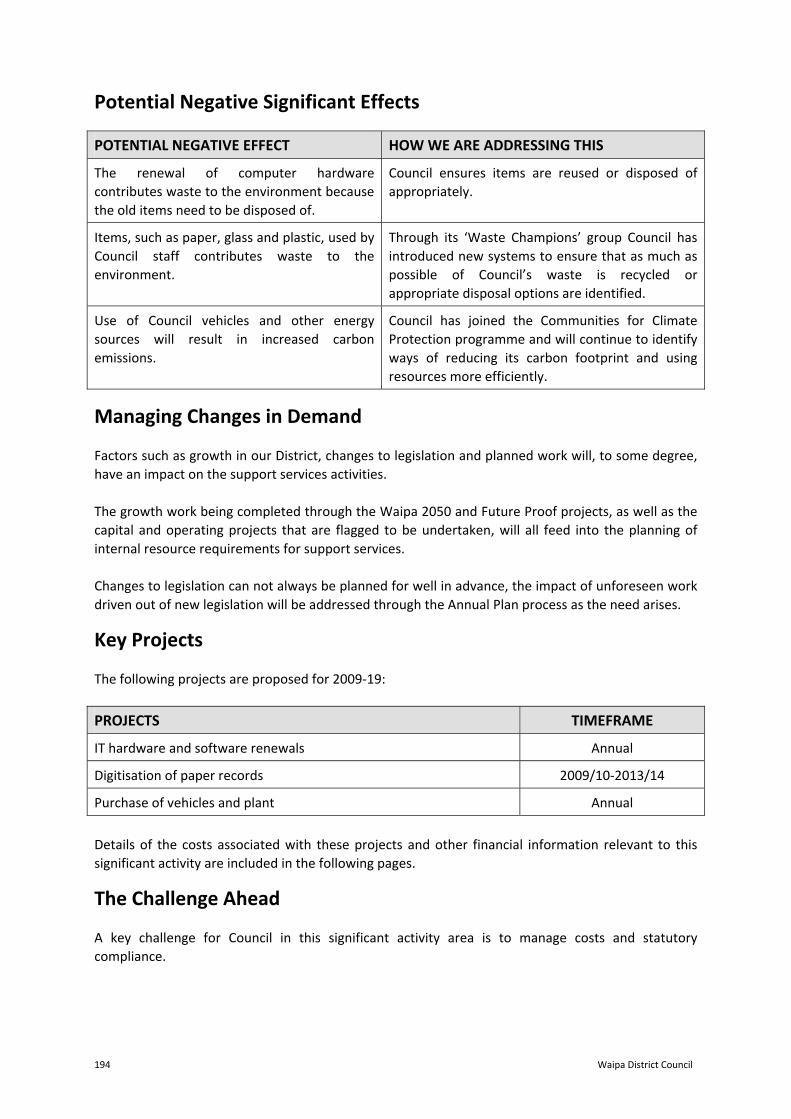
194 Waipa District Council
Potential Negative Significant Effects
POTENTIAL NEGATIVE EFFECT HOW WE ARE ADDRESSING THIS
The renewal of computer hardware contributes waste to the environment because the old items need to be disposed of.
Council ensures items are reused or disposed of appropriately.
Items, such as paper, glass and plastic, used by Council staff contributes waste to the environment.
Through its ‘Waste Champions’ group Council has introduced new systems to ensure that as much as possible of Council’s waste is recycled or appropriate disposal options are identified.
Use of Council vehicles and other energy sources will result in increased carbon emissions.
Council has joined the Communities for Climate Protection programme and will continue to identify ways of reducing its carbon footprint and using resources more efficiently.
Managing Changes in Demand Factors such as growth in our District, changes to legislation and planned work will, to some degree, have an impact on the support services activities. The growth work being completed through the Waipa 2050 and Future Proof projects, as well as the capital and operating projects that are flagged to be undertaken, will all feed into the planning of internal resource requirements for support services. Changes to legislation can not always be planned for well in advance, the impact of unforeseen work driven out of new legislation will be addressed through the Annual Plan process as the need arises. Key Projects The following projects are proposed for 2009‐19:
PROJECTS TIMEFRAME
IT hardware and software renewals Annual
Digitisation of paper records 2009/10‐2013/14
Purchase of vehicles and plant Annual
Details of the costs associated with these projects and other financial information relevant to this significant activity are included in the following pages. The Challenge Ahead A key challenge for Council in this significant activity area is to manage costs and statutory compliance.

10‐year Plan (2009‐19) 195
Support Services Levels of Service and Measuring Performance The departments that contribute to support services have their own performance management measures, including operating plans and performance targets. Further work is likely to provide a coordinated organisation‐wide approach to quality, efficiency and effectiveness of support services.

196
Waipa D
istrict Council
Support Services Operating and Capital Costs and Funding Forecasts
2008/09 2009/10 2010/11 2011/12 2012/13 2013/14 2014/15 2015/16 2016/17 2017/18 2018/19
Budget Budget B udget B udget Budget B udget B udget B udget Budget B udget B udget
$000 $000 $000 $000 $000 $000 $000 $000 $000 $000 $000
R E VE NUE
421 Activity R evenue 392 405 415 425 481 492 503 514 578 592
9,431 Internal R ecoveries 11,409 12,048 12,964 13,822 14,127 15,074 15,264 15,618 16,524 17,044
9,852 TOTAL R E VE NUE 11,801 12,453 13,379 14,247 14,608 15,566 15,767 16,132 17,102 17,636
OPE RATING E XPE NDITURE
5,212 Employee Benefit E xpenses 6,041 6,517 7,039 7,278 7,627 7,910 8,188 8,423 8,830 9,108
1,288 Depreciation & Amortisation 877 871 898 895 931 955 967 1,000 1,011 1,023
4,315 Activity E xpenses 5,484 5,914 6,312 6,850 6,845 7,525 6,630 6,726 7,277 7,520
51 F inance C osts 76 77 78 79 80 81 82 83 84 85
(1,009) Internal Interes t R ecovery ‐ ‐ ‐ ‐ ‐ ‐ ‐ ‐ ‐ ‐
9,857 TOTAL E XP E NDITUR E 12,478 13,379 14,327 15,102 15,483 16,471 15,867 16,232 17,202 17,736
(5) OPE RATING S URPL US /(DE F IC IT) (677) (926) (948) (855) (875) (905) (100) (100) (100) (100)
Operating Defic it F unded by:
Loan 577 826 848 755 775 805 ‐ ‐ ‐ ‐
5 Non F unded 100 100 100 100 100 100 100 100 100 100
5 TOTAL FUNDING 677 926 948 855 875 905 100 100 100 100
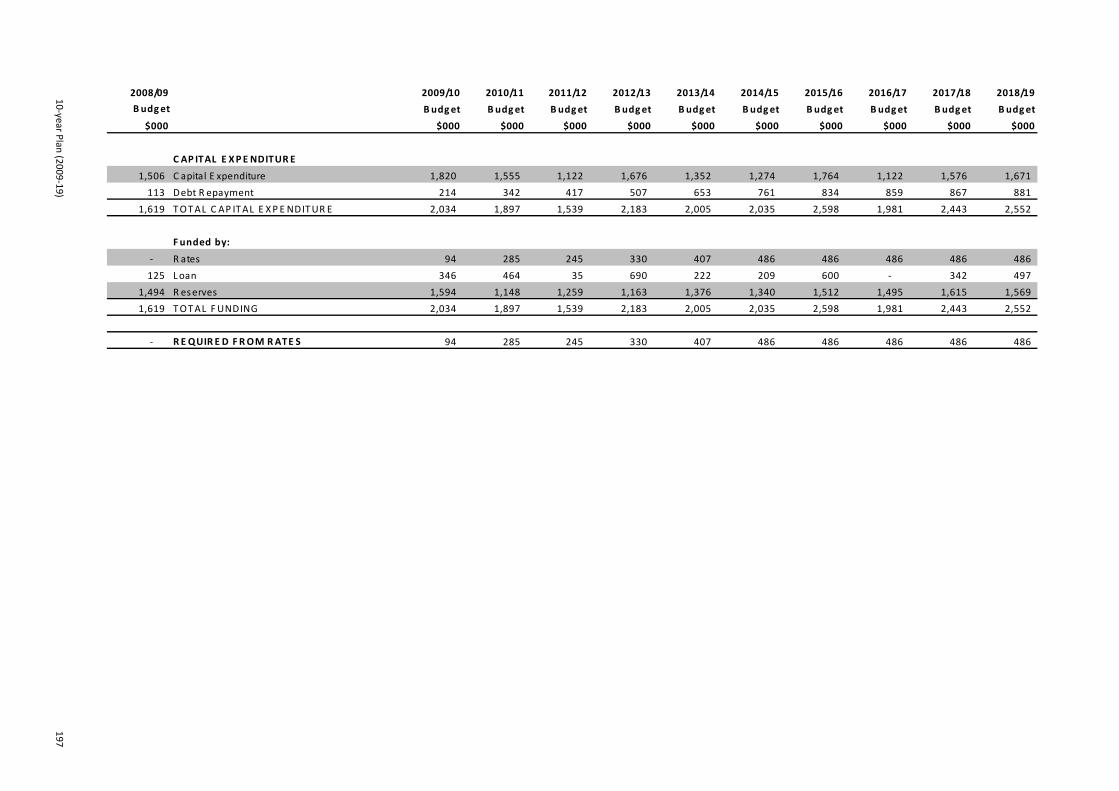
10‐year Plan (2009‐19)
197
2008/09 2009/10 2010/11 2011/12 2012/13 2013/14 2014/15 2015/16 2016/17 2017/18 2018/19
Budget B udget B udget B udget B udget B udget B udget B udget B udget B udget B udget
$000 $000 $000 $000 $000 $000 $000 $000 $000 $000 $000
C AP ITAL E XPE NDITURE
1,506 C apital E xpenditure 1,820 1,555 1,122 1,676 1,352 1,274 1,764 1,122 1,576 1,671
113 Debt R epayment 214 342 417 507 653 761 834 859 867 881
1,619 TOTAL C AP ITAL E XP E NDITUR E 2,034 1,897 1,539 2,183 2,005 2,035 2,598 1,981 2,443 2,552
F unded by:
‐ R ates 94 285 245 330 407 486 486 486 486 486
125 Loan 346 464 35 690 222 209 600 ‐ 342 497
1,494 R eserves 1,594 1,148 1,259 1,163 1,376 1,340 1,512 1,495 1,615 1,569
1,619 TOTAL FUNDING 2,034 1,897 1,539 2,183 2,005 2,035 2,598 1,981 2,443 2,552
‐ RE QUIR E D F ROM RATE S 94 285 245 330 407 486 486 486 486 486

198
Waipa D
istrict Council
Support Services Capital Expenditure Programme
2009/10 2010/11 2011/12 2012/13 2013/14 2014/15 2015/16 2016/17 2017/18 2018/19
Budget Budget Budget Budget Budget Budget B udget B udget B udget B udget
$000 $000 $000 $000 $000 $000 $000 $000 $000 $000
Analys is of C apital P rojec ts
Levels of S ervice/R enewal 1,820 1,555 1,122 1,676 1,352 1,274 1,764 1,122 1,576 1,671Total S upport S ervices 1,820 1,555 1,122 1,676 1,352 1,274 1,764 1,122 1,576 1,671
P rojec ts
Information Technology Hardware R enewal 760 538 445 724 679 473 773 496 742 644
P hotocopier R enewals 150 ‐ 32 ‐ ‐ 203 ‐ ‐ 36 ‐
Information Technology S oftware 360 470 64 443 66 68 357 71 133 445
Information Management P rojects 100 82 106 22 110 23 115 24 121 25
P lant R eplacement 450 465 475 487 497 507 519 531 544 557Total S upport S ervices P rojec ts 1,820 1,555 1,122 1,676 1,352 1,274 1,764 1,122 1,576 1,671

10‐year Plan (2009‐19) 199
Section 6 ‐ FINANCIAL PLANNING
In this section: Introduction Prospective Statement of
Financial Performance Prospective Statement of
Changes in Equity Prospective Statement of
Financial Position Prospective Statement of
Consolidated Cash Flow Statement of Cost of Services Statement of Borrowing Statement of Accounting
Policies Significant Forecasting
Assumptions Capital Expenditure
Programme Projects Considered but not
Included in this Plan

200 Waipa District Council
Introduction
Statement of Prospective Financial Information The financial information contained within this document is prospective financial information which complies with FRS42 which is the Financial Reporting Standard used to establish principals and to specify minimum disclosures for the preparation and presentation of general purpose prospective financial information. The purpose for which it has been prepared is to enable the public to participate in the decision‐making process as to the services to be provided by Council over the financial years 2009‐19, and to provide a broad accountability mechanism of Council to the Community. The financial information may not be appropriate for purposes other than those described. In relation to the standard, the financial year 2009/10 is considered to be a ‘forecast’ and based on future events, which are expected to occur. The actual results achieved for the period are likely to vary from the information presented and may vary materially depending upon the circumstances that arise during the period. The forecast financial information has been prepared in accordance with Council’s current accounting policies which comply with the New Zealand International Financial Reporting Standards. Council is responsible for the Prospective Financial Statements, including the appropriateness of the underlying assumptions and all other required disclosures, and will be authorising the issue of the Prospective Financial Statements on 30 June 2009. Council will not update the Prospective Financial Statements after that date, other than via a future year’s Annual Plan process. Funding of Operating Expenditure Section 100 of the Local Government Act 2002 requires Council to fund operating expenditure from operating revenue. In preparing the 10‐year Plan there are some instances where Council has resolved that it is financially prudent not to fully fund the operating expenses within the year in which they occur. Where operating expenses are not fully funded, this is shown in the Cost of Services Statement for each Significant Activity. The reasons for each of these are detailed below: Infrastructural Assets The value of assets written off as a result of the renewal of infrastructural assets is not funded in the current or future years. The following Significant Activities are affected:
Transport Management $ 800,000
Stormwater $ 50,000
Water Treatment and Supply $ 100,000
Wastewater Treatment and Disposal $ 80,000
10‐year Plan (2009‐19) 201
These estimates were based on trends relating to asset write‐offs over the preceding three years. Amenity and Support Services Council has resolved not to fund depreciation on buildings and improvements where future renewals would be from community sources or through raising new debt. The type of facility is primarily community occupied, has a life in excess of 50 years and renewal would only occur if future generations so decided. The amount of depreciation not funded is $298,000 with a further amount of $310,000 not funded relating to loss on sale of properties, and $100,000 not funded relating to Council occupied buildings. Water Treatment and Supply It has also been identified that $160,000 of depreciation for the Cambridge and Pukerimu water scheme does not require funding. The Pukerimu components were all constructed in the late 1980’s and are debt free, having been funded by capital contributions. Rating Issues New targeted rates have been raised to cover the Cambridge Community Sports Hall from year 1 and the Cambridge Pool from year 5. There is also a new Hall Rate to be raised in each year relating to the Pirongia Sports and Recreation Centre after a survey resulted in 75% of residents in the area supporting it. Details of these rates can be found in the Funding Impact Statement attached to the Policy Section of the 10‐year Plan. Forestry Council has an investment in Forestry and generates income from logging sales and expenditure to maintain and manage the forest. The income and expenditure do not necessarily match each year, with some years having high sales and other years there may be minimal sales. To ensure that there is no flow on impact to ratepayers this activity will be managed through a reserve account which over a number of years should show a surplus. Pensioner Housing Council has an investment in residential housing and generates income from rent and expenditure to maintain and manage the property. The income and expenditure do not necessarily match each year and to ensure that there is no flow on impact to ratepayers this activity is managed through a reserve account to ensure that any rents collected are used for the benefit of the property.
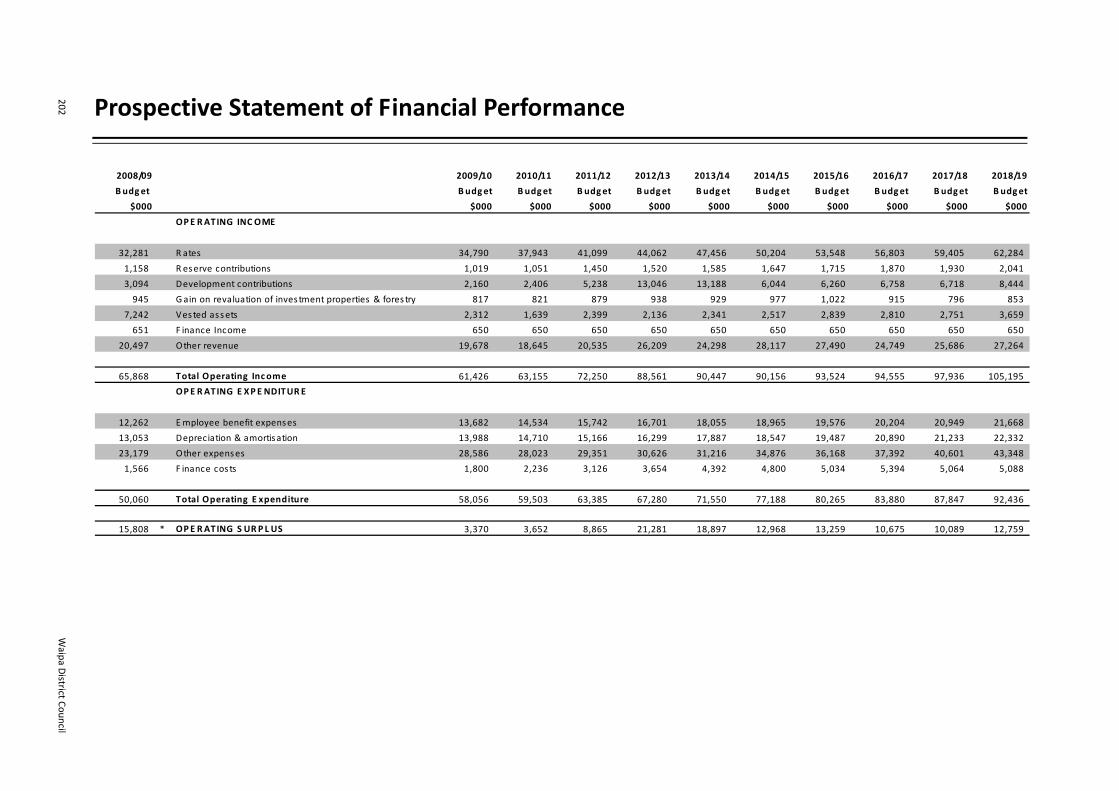
202
W
aipa District Council
Prospective Statement of Financial Performance
2008/09 2009/10 2010/11 2011/12 2012/13 2013/14 2014/15 2015/16 2016/17 2017/18 2018/19
Budget Budget Budget B udget B udget B udget B udget B udget B udget B udget B udget
$000 $000 $000 $000 $000 $000 $000 $000 $000 $000 $000
OPE RATING INC OME
32,281 R ates 34,790 37,943 41,099 44,062 47,456 50,204 53,548 56,803 59,405 62,284
1,158 R eserve contributions 1,019 1,051 1,450 1,520 1,585 1,647 1,715 1,870 1,930 2,041
3,094 Development contributions 2,160 2,406 5,238 13,046 13,188 6,044 6,260 6,758 6,718 8,444
945 Gain on revaluation of inves tment properties & fores try 817 821 879 938 929 977 1,022 915 796 853
7,242 Vested assets 2,312 1,639 2,399 2,136 2,341 2,517 2,839 2,810 2,751 3,659
651 F inance Income 650 650 650 650 650 650 650 650 650 650
20,497 Other revenue 19,678 18,645 20,535 26,209 24,298 28,117 27,490 24,749 25,686 27,264
65,868 Total Operating Income 61,426 63,155 72,250 88,561 90,447 90,156 93,524 94,555 97,936 105,195
OPE RATING E XPE NDITURE
12,262 Employee benefit expenses 13,682 14,534 15,742 16,701 18,055 18,965 19,576 20,204 20,949 21,668
13,053 Depreciation & amortisation 13,988 14,710 15,166 16,299 17,887 18,547 19,487 20,890 21,233 22,332
23,179 Other expenses 28,586 28,023 29,351 30,626 31,216 34,876 36,168 37,392 40,601 43,348
1,566 F inance costs 1,800 2,236 3,126 3,654 4,392 4,800 5,034 5,394 5,064 5,088
50,060 Total Operating E xpenditure 58,056 59,503 63,385 67,280 71,550 77,188 80,265 83,880 87,847 92,436
15,808 * OPE RATING S URPL US 3,370 3,652 8,865 21,281 18,897 12,968 13,259 10,675 10,089 12,759

10‐year Plan (2009‐19)
203
Prospective Statement of Changes in Equity
F orecas t 2009/10 2010/11 2011/12 2012/13 2013/14 2014/15 2015/16 2016/17 2017/18 2018/19
2008/09 Budget Budget B udget Budget Budget B udget Budget B udget Budget Budget
$000 $000 $000 $000 $000 $000 $000 $000 $000 $000 $000
933,213 Balance at 1 J uly 2009 1,099,036 1,134,425 1,149,886 1,237,087 1,275,889 1,308,147 1,375,490 1,405,956 1,429,772 1,495,812
P roperty P lant and E quipment
165,111 R evaluation gains/(losses ) taken to equity 31,576 11,445 78,015 17,207 13,282 54,375 17,207 13,141 55,951 17,916
(1,399) C ash flow hedges 443 364 321 314 79 ‐ ‐ ‐ ‐ ‐
163,712 Net income recognised directly to equity 32,019 11,809 78,336 17,521 13,361 54,375 17,207 13,141 55,951 17,916
2,111 * S urplus for the year 3,370 3,652 8,865 21,281 18,897 12,968 13,259 10,675 10,089 12,759
165,823 Total recognised income for the year ending 30 J une 35,389 15,461 87,201 38,802 32,258 67,343 30,466 23,816 66,040 30,675
1,099,036 1,134,425 1,149,886 1,237,087 1,275,889 1,308,147 1,375,490 1,405,956 1,429,772 1,495,812 1,526,487
* The budgeted surplus of $15.808 million has been reforecas t to a surplus of $2.111 million, with the main variations being a reduction in revenue from ves ted assets ,
reduction in external funding for the K arapiro project and the C ambridge pool and operating expenses for both projects budgeted as capital.
This forecast has been used to estimate the firs t year of the S tatement of F inancial P os ition.
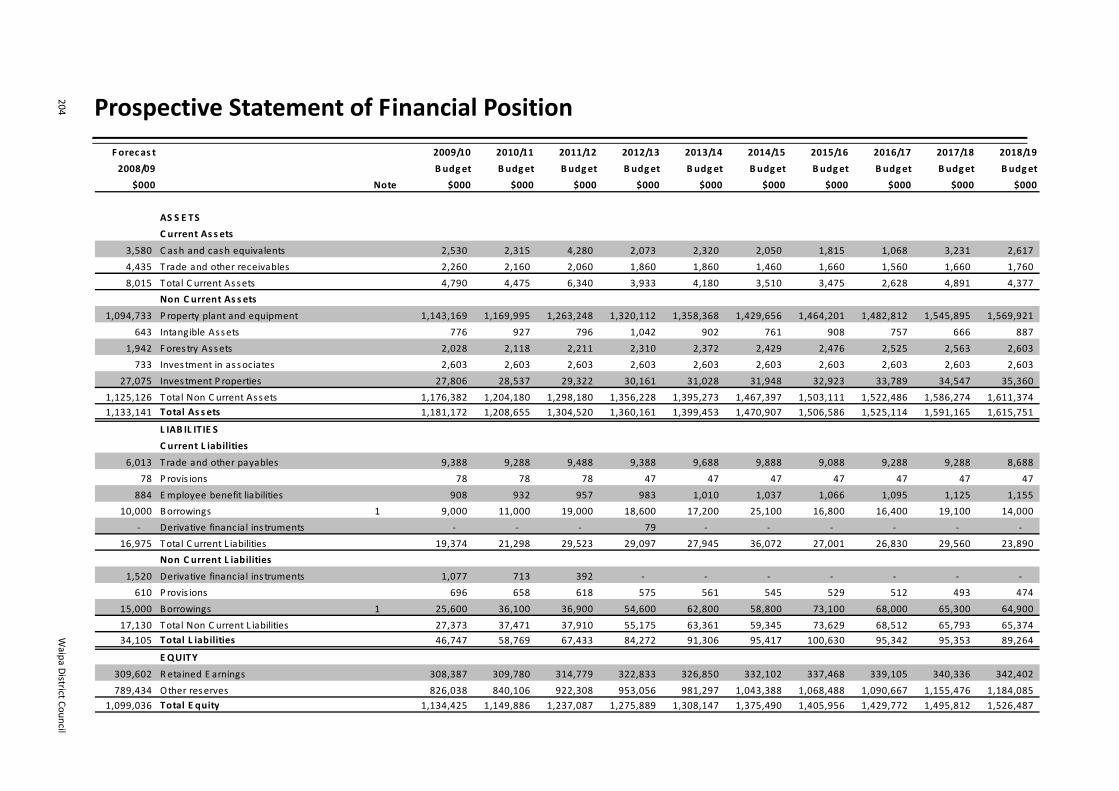
204
W
aipa District Council
Prospective Statement of Financial Position
F orecas t 2009/10 2010/11 2011/12 2012/13 2013/14 2014/15 2015/16 2016/17 2017/18 2018/19
2008/09 B udget Budget Budget B udget B udget Budget Budget Budget B udget Budget
$000 Note $000 $000 $000 $000 $000 $000 $000 $000 $000 $000
AS S E TS
C urrent As s ets
3,580 C ash and cash equivalents 2,530 2,315 4,280 2,073 2,320 2,050 1,815 1,068 3,231 2,617
4,435 Trade and other receivables 2,260 2,160 2,060 1,860 1,860 1,460 1,660 1,560 1,660 1,760
8,015 Total C urrent Assets 4,790 4,475 6,340 3,933 4,180 3,510 3,475 2,628 4,891 4,377
Non C urrent As s ets
1,094,733 P roperty plant and equipment 1,143,169 1,169,995 1,263,248 1,320,112 1,358,368 1,429,656 1,464,201 1,482,812 1,545,895 1,569,921
643 Intangible Assets 776 927 796 1,042 902 761 908 757 666 887
1,942 F ores try Assets 2,028 2,118 2,211 2,310 2,372 2,429 2,476 2,525 2,563 2,603
733 Inves tment in associates 2,603 2,603 2,603 2,603 2,603 2,603 2,603 2,603 2,603 2,603
27,075 Inves tment P roperties 27,806 28,537 29,322 30,161 31,028 31,948 32,923 33,789 34,547 35,360
1,125,126 Total Non C urrent Assets 1,176,382 1,204,180 1,298,180 1,356,228 1,395,273 1,467,397 1,503,111 1,522,486 1,586,274 1,611,374 1,133,141 Total As s ets 1,181,172 1,208,655 1,304,520 1,360,161 1,399,453 1,470,907 1,506,586 1,525,114 1,591,165 1,615,751
L IAB IL ITIE S
C urrent L iabilities
6,013 Trade and other payables 9,388 9,288 9,488 9,388 9,688 9,888 9,088 9,288 9,288 8,688
78 P rovis ions 78 78 78 47 47 47 47 47 47 47
884 Employee benefit liabilities 908 932 957 983 1,010 1,037 1,066 1,095 1,125 1,155
10,000 Borrowings 1 9,000 11,000 19,000 18,600 17,200 25,100 16,800 16,400 19,100 14,000
‐ Derivative financial ins truments ‐ ‐ ‐ 79 ‐ ‐ ‐ ‐ ‐ ‐
16,975 Total C urrent L iabilities 19,374 21,298 29,523 29,097 27,945 36,072 27,001 26,830 29,560 23,890
Non C urrent L iabilities
1,520 Derivative financial ins truments 1,077 713 392 ‐ ‐ ‐ ‐ ‐ ‐ ‐
610 P rovis ions 696 658 618 575 561 545 529 512 493 474
15,000 Borrowings 1 25,600 36,100 36,900 54,600 62,800 58,800 73,100 68,000 65,300 64,900
17,130 Total Non C urrent L iabilities 27,373 37,471 37,910 55,175 63,361 59,345 73,629 68,512 65,793 65,374
34,105 Total L iabilities 46,747 58,769 67,433 84,272 91,306 95,417 100,630 95,342 95,353 89,264
E QUITY
309,602 R etained E arnings 308,387 309,780 314,779 322,833 326,850 332,102 337,468 339,105 340,336 342,402
789,434 Other reserves 826,038 840,106 922,308 953,056 981,297 1,043,388 1,068,488 1,090,667 1,155,476 1,184,085 1,099,036 Total E quity 1,134,425 1,149,886 1,237,087 1,275,889 1,308,147 1,375,490 1,405,956 1,429,772 1,495,812 1,526,487

10‐year Plan (2009‐19)
205
Prospective Cash Flow Statement
F orecas t 2009/10 2010/11 2011/12 2012/13 2013/14 2014/15 2015/16 2016/17 2017/18 2018/19
2008/09 B udget Budget Budget B udget Budget Budget B udget B udget Budget Budget
$000 $000 $000 $000 $000 $000 $000 $000 $000 $000 $000
C as h F lows from Operating Ac tivities
32,281 R eceipts from rates revenue 34,790 37,943 41,099 44,062 47,456 50,204 53,548 56,803 59,405 62,284
826 Interes t received 650 650 650 650 650 650 650 650 650 650
21,208 R eceipts from other revenue 25,031 22,201 27,325 40,976 39,071 36,209 35,266 33,477 34,233 37,651
(42,307) P ayments to suppliers and employees (37,443) (41,330) (43,880) (46,445) (47,929) (52,599) (55,502) (56,354) (60,509) (64,593)
(894) Interes t P aid (1,800) (2,236) (3,126) (3,654) (4,392) (4,800) (5,034) (5,394) (5,064) (5,088)
11,114 Net C as h F low from Operating Ac tivities 21,228 17,228 22,068 35,589 34,856 29,664 28,928 29,182 28,715 30,904
C as h F lows from Inves ting Ac tivities
‐ P roceeds from sale of property, plant and equipment 1,000 1,000 1,000 ‐ ‐ ‐ ‐ ‐ ‐ ‐
(60) P urchase of intangible assets (320) (341) (64) (443) (66) (68) (358) (71) (133) (446)
(30,218) P urchase of property, plant and equipment (30,688) (30,602) (29,839) (54,653) (41,343) (33,766) (34,805) (24,358) (26,419) (25,572)
‐ Investment in Associates (1,870) ‐ ‐ ‐ ‐ ‐ ‐ ‐ ‐ ‐
(30,028) Net C as h F low from Inves ting Ac tivities (31,878) (29,943) (28,903) (55,096) (41,409) (33,834) (35,163) (24,429) (26,552) (26,018)
C as h F lows from F inanc ing Ac tivities
10,000 P roceeds from borrowings 19,600 21,500 19,800 36,300 25,400 21,100 31,100 11,300 16,400 13,600
(1,610) R epayment of borrowings (10,000) (9,000) (11,000) (19,000) (18,600) (17,200) (25,100) (16,800) (16,400) (19,100)
8,390 Net C as h F low from F inanc ing Ac tivities 9,600 12,500 8,800 17,300 6,800 3,900 6,000 (5,500) ‐ (5,500)
(10,524) Net (dec reas e)/inc reas e in cas h and cas h equivalents (1,050) (215) 1,965 (2,207) 247 (270) (235) (747) 2,163 (614)
14,104 C ash and cash equivalents at the beginning of the year 3,580 2,530 2,315 4,280 2,073 2,320 2,050 1,815 1,068 3,231
3,580 C as h & cas h equivalents at the end of the year 2,530 2,315 4,280 2,073 2,320 2,050 1,815 1,068 3,231 2,617

206
W
aipa District Council
Statement of Cost of Services
Budget B udget B udget B udget B udget B udget B udget B udget B udget B udget B udget
2008/09 2009/10 2010/11 2011/12 2012/13 2013/14 2014/15 2015/16 2016/17 2017/18 2018/19
$000 $000 $000 $000 $000 $000 $000 $000 $000 $000 $000
Revenue
29 Governance & S trategic Direction 30 75 30 30 78 30 30 81 30 30
2,825 E nvironmental S ervices 3,007 3,226 3,418 3,559 3,681 3,805 3,936 4,068 4,210 4,357
866 R ecreation & Heritage 1,054 1,208 1,239 1,284 1,702 1,989 2,031 2,213 2,269 2,327
1,214 Amenity S ervices 1,415 1,477 1,507 2,378 1,633 1,754 1,531 1,836 1,602 1,642
5,690 Transport Management 7,857 6,960 7,440 8,640 8,823 10,959 10,968 10,674 11,362 12,387
3 S tormwater 3 3 3 3 4 4 4 4 4 4
2,764 Water Treatment and S upply 3,144 3,295 3,446 3,600 3,783 3,962 4,171 4,377 4,596 4,834
375 Wastewater Treatment and Disposal 376 406 438 472 510 551 598 646 698 756
9,852 S upport S ervices 11,801 12,453 13,379 14,247 14,608 15,566 15,767 16,132 17,102 17,636
23,618 GROS S R E VE NUE 28,687 29,103 30,900 34,213 34,822 38,620 39,036 40,031 41,873 43,973
9,431 Less Internal C harges 11,409 12,048 12,964 13,822 14,127 15,074 15,264 15,618 16,524 17,044
14,187 NE T INC OME 17,278 17,055 17,936 20,391 20,695 23,546 23,772 24,413 25,349 26,929
E xpenditure
4,371 Governance & S trategic Direction 4,222 4,333 4,446 4,131 4,572 4,505 4,527 4,765 4,975 5,138
4,709 E nvironmental S ervices 4,448 4,685 5,047 5,391 5,625 5,921 6,067 6,202 6,420 6,676
8,160 R ecreation & Heritage 9,031 9,827 11,172 10,870 12,360 13,595 13,861 15,502 15,950 16,488
4,768 Amenity S ervices 7,582 6,068 5,713 6,068 5,909 6,207 6,316 6,594 7,020 7,133
13,628 Transport Management 16,755 17,232 18,180 21,044 21,073 23,442 26,062 25,915 27,541 30,224
1,675 S tormwater 1,872 2,082 2,289 2,432 2,594 2,818 3,009 3,160 3,432 3,468
6,841 Water Treatment and S upply 7,733 8,390 9,367 10,027 10,732 11,415 11,745 12,561 12,948 13,502
6,127 Wastewater Treatment and Disposal 6,030 6,282 6,575 6,835 8,154 8,735 8,950 9,473 9,803 10,049
9,856 S upport S ervices 12,478 13,379 14,327 15,102 15,483 16,471 15,867 16,232 17,202 17,736
60,135 GROS S E XP E NDITUR E 70,151 72,278 77,116 81,900 86,502 93,109 96,404 100,404 105,291 110,414
9,431 Less Internal C harges 11,409 12,048 12,964 13,822 14,127 15,074 15,264 15,618 16,524 17,044
645 Less rates charged to C ouncil properties 686 727 767 798 825 847 875 906 920 934
50,059 NE T E XPE NDITURE 58,056 59,503 63,385 67,280 71,550 77,188 80,265 83,880 87,847 92,436

10‐year Plan (2009‐19)
207
Statement of Borrowing
2008/09 Budget Budget Budget B udget B udget B udget Budget Budget Budget B udget
F orecas t 2009/10 2010/11 2011/12 2012/13 2013/14 2014/15 2015/16 2016/17 2017/18 2018/19
$000 $000 $000 $000 $000 $000 $000 $000 $000 $000 $000
Movements in Borrowing s
16,610 Opening Balance 25,000 34,600 47,100 55,900 73,200 80,000 83,900 89,900 84,400 84,400
8,390 Net Loans R aised/(R epaid) 9,600 12,500 8,800 17,300 6,800 3,900 6,000 (5,500) ‐ (5,500)
25,000 C los ing Balance 34,600 47,100 55,900 73,200 80,000 83,900 89,900 84,400 84,400 78,900
10,000 C urrent Portion of E xternal Debt 9,000 11,000 19,000 18,600 17,200 25,100 16,800 16,400 19,100 14,000
15,000 Term Portion of E xternal Debt 25,600 36,100 36,900 54,600 62,800 58,800 73,100 68,000 65,300 64,900
25,000 34,600 47,100 55,900 73,200 80,000 83,900 89,900 84,400 84,400 78,900
Policy C ompliance
10.2 Net operating cashflow to interes t expense > 4 11.8 7.7 7.1 9.7 7.9 6.2 5.7 5.4 5.7 6.1
3.3% Interes t expense as % of rates and fees and charges revenue 15% 3.5% 4.1% 5.3% 5.7% 6.4% 6.5% 6.5% 6.6% 6.0% 5.7%
40,778 Dollar rates and fees and charges revenue 000's 52,067 54,997 59,034 64,451 68,148 73,749 77,317 81,215 84,754 89,212
1,343 Interes t expense 000's 1,800 2,236 3,126 3,654 4,392 4,800 5,034 5,394 5,064 5,088
13,645 Net cashflow from operating activities 000's 21,228 17,228 22,068 35,589 34,856 29,664 28,928 29,182 28,715 30,904
The above represents the level of external borrowing but this could fluctuate depending on future use of reserves

208 Waipa District Council
Statement of Accounting Policies
Reporting Entity Waipa District Council is a territorial local authority governed by the Local Government Act 2002. Council has no subsidiaries and the financial statements are for the single entity of Waipa District Council, domiciled in New Zealand. The primary objective of Council is to provide goods or services for the community or social benefit rather than making a financial return. Accordingly, Council has designated itself as a public benefit entity for the purposes of New Zealand equivalents to International Financial Reporting Standards (NZ IFRS). Basis of Preparation The Financial Statements have been prepared in accordance with the requirements of the Local Government Act 2002: Part 6, Section 98 and Part 3 of Schedule 10, which includes the requirement to comply with New Zealand generally accepted accounting practice (NZ GAAP). The Financial Statements have been prepared in accordance with NZ GAAP. They comply with NZ IFRS, and other applicable Financial Reporting Standards, as appropriate for public benefit entities. The accounting policies set out below have been applied consistently to all periods presented in these financial statements. The financial statements have been prepared on a historical cost basis, modified by the revaluation of land and buildings, infrastructural assets, investment property and forestry. The financial statements are presented in New Zealand dollars and all values are rounded to the nearest thousand dollars ($’000). The functional currency of Council is New Zealand dollars. There are no standards, interpretations and amendments that have been issued, but are not yet effective, that Council has not yet applied. Revenue Revenue is measured at the fair value of consideration received. Rates Revenue Rates are set annually by a resolution from Council and relate to a financial year. All ratepayers are invoiced within the financial year to which the rates have been set. Rates revenue is recognised when payable.

10‐year Plan (2009‐19) 209
Other Revenue Water billing revenue is recognised on an actual basis. Unbilled usage, as a result of unread meters at year end, is accrued on an average usage basis. Council receives government grants from the New Zealand Transport Agency which subsidises part of Council’s costs in maintaining the local roading infrastructure. The subsidies are recognised as revenue upon entitlement as conditions pertaining to eligible expenditure have been fulfilled. Where a physical asset is acquired for nil or nominal consideration, the fair value of the asset received is recognised as income. Assets vested in Council are recognised as revenue when control over the asset is obtained. Interest income is recognised using the effective interest method. Dividends are recognised when Council’s right to receive the payment is established. Development Contributions The revenue recognition point for development and financial contributions is at the point that settlement is received, either by payment or negotiated developer agreement. Borrowing Costs Borrowing costs are recognised as an expense in the period in which they are incurred. Grant Expenditure Non discretionary grants are those grants that are awarded if the grant application meets the specified criteria, and are recognised as expenditure when an application that meets the specified criteria for the grant has been received. Discretionary grants are those grants where Council has no obligation to award on receipt of the grant application and grants are recognised as expenditure on payment. Cash and Cash Equivalents Cash and cash equivalents includes cash in hand, deposits held at call with banks, other short term highly liquid investments with original maturities of three months or less, and bank overdrafts. Bank overdrafts are shown within borrowings in current liabilities in the Statement of Financial Position. Trade and other Receivables Trade and other receivables are initially measured at fair value and subsequently measured at amortised cost using the effective interest method, less any provision for impairment. Loans are initially recognised at the present value of their expected future cash flows, discounted at the current market rate of return of a similar asset/investment. They are subsequently measured at amortised cost using the effective interest method. The difference between the face value and present value of expected future cash flows of the loan is recognised in the Statement of Financial Performance as a grant.

210 Waipa District Council
A provision between the face value and present value of expected future cash flows of the loan is recognised in the Statement of Financial Performance as a grant. A provision for impairment of receivables is established when there is objective evidence that Council will not be able to collect all amounts due according to the original terms of receivables. The amount of the provision is the difference between the asset’s carrying amount and the present value of estimated future cash flows, discounted using the effective interest method. Financial Assets Council classifies its investments in the following categories:
▪ Financial assets at fair value ▪ Loans and receivables ▪ Held‐to‐maturity investments
The classification depends on the reason behind acquiring the investment. Council decides how to classify its investments when they are acquired. Purchases and sales of investments are recorded on the value date. Financial assets are no longer recognised when the right to receive cash flows from the financial assets has expired or has been transferred. The fair values of quoted investments are based on current bid prices. If the market for a financial asset is not active, Council establishes fair value through valuation techniques. At each year end Council assesses whether there is evidence that a financial asset or group of financial assets is impaired. Any impairment is recognised in the Statement of Financial Performance. Financial Assets at Fair Value through Profit or Loss This category has two sub‐categories: financial assets held for trading, and those designated at fair value through profit or loss. A financial asset falls in this category if acquired principally to sell in the short‐term or if designated this way by Council. After initial recognition, they are measured at fair value. These financial assets are classified as current assets if they are held for trading or expected to be realised within twelve months of the year end date. Loans and Receivables Loans and receivables are non‐derivative financial assets with fixed or determinable payments not quoted in an active market. They arise when Council provides money, goods or services directly to a debtor with no intention of selling the receivable asset. After initial recognition, they are measured at amortised cost using the effective interest method. They are included in current assets, except for those with maturities greater than twelve months after the year end date, which are classified as non‐current assets. Held‐to‐Maturity Investments Held‐to‐maturity investments are non‐derivative financial assets with fixed or determinable payments and fixed maturities that Council has the intention and ability to hold to maturity. After initial recognition, they are measured at amortised cost using the effective interest method.

10‐year Plan (2009‐19) 211
Financial Assets at Fair Value through Equity Financial assets at fair value through equity are non‐derivative assets designated in this category or not classified in the other categories. After initial recognition, they are measured at fair value. They are included in non‐current assets unless Council intends to dispose of the asset within twelve months of year end. Non Current Assets Held for Sale Non current assets held for sale are classified as held for sale if their carrying amount will be recovered principally through a sale transaction, not through continuing use. Non current assets held for sale are measured at the lower of their carrying amount and fair value less costs to sell. These assets are not depreciated or amortised. Property, Plant and Equipment Property, plant and equipment consists of:
▪ Operational assets which include land, buildings, library books, plant and equipment, and motor vehicles.
▪ Infrastructural assets which are the fixed utility systems. Each asset class includes all items that are required for the network to function, for example sewer reticulation includes reticulation piping and sewer pump stations.
▪ Property, plant and equipment are shown at cost or valuation, less accumulated depreciation and impairment losses.
Additions The cost of an item of property, plant and equipment is recognised as an asset if it is probable that future economic benefits or service potential associated with the item will flow to Council and the cost of the item can be measured reliably. Additions are generally recognised at cost. Where an asset is acquired at no cost, or for a nominal cost, it is recognised at fair value at the date of acquisition. Disposals Gains and losses on disposal are determined by comparing the proceeds with the carrying amount of the asset. Gains and losses on disposals are included in the Statement of Financial Performance. When revalued assets are sold, the amounts included in asset revaluation reserves in respect of those assets are transferred to retained earnings. Subsequent Costs Costs incurred subsequent to initial acquisition are capitalised only when it is probable that future economic benefits or service potential with the item will flow to Council and the cost of the item can be measured reliably.

212 Waipa District Council
Depreciation Depreciation is provided on a straight‐line basis on all property, plant and equipment other than land, at rates that will write off the cost (or valuation) of the assets to their estimated residual values over their useful lives. The useful lives and associated depreciation rates of major classes of assets have been estimated as follows: Components YearsWater treatment – structures 50 – 100 – plant 10 – 25 – pipes 60 Water reticulation – pipes 30 – 80 – fittings 25 Sewage treatment – structures 50 – 100 – plant 10 – 25 – pipes 60 Sewerage reticulation – pipes 50 – 80 – manholes 50 Stormwater – structures 50 – pipes 50 – 100 – manholes 50
YearsFormation/carriageway and shoulder InfinitePavement structure 30 – 50Pavement surface (seal) 10 – 15Catchpits and culverts 30 – 70Bridges 20 – 80Kerb and channel 50Lighting 10Footpaths 20 – 50
YearsBuildings – not componentised 40Building – structure 50 ‐ 80Building – fit‐out 25 ‐ 80Building – services 40 ‐ 80Plant/motor vehicles 3 ‐ 10Furniture, fittings and equipment 3 ‐ 10Computer equipment 3 ‐ 10Intangibles 3 ‐ 10 The residual value and useful life of an asset is reviewed, and adjusted if applicable, at each financial year end.

10‐year Plan (2009‐19) 213
Revaluation Those asset classes that are revalued are valued on a three yearly cycle on the basis described below, with the exception of forestry assets and investment properties, which are valued annually. All other asset classes are carried at depreciated historical cost. The carrying values of revalued items are reviewed at each balance date to ensure that those values are not materially different to fair value. Operational Land and Buildings At fair value as determined from market‐based evidence by an independent valuer. The most recent valuation was performed by Quotable Value New Zealand (registered valuers) and the valuation is effective as at 1 July 2008. Infrastructural Assets At fair value determined on a depreciated replacement cost basis by an independent valuer. At balance date the carrying value of infrastructural assets is assessed to ensure that they do not differ materially from the assets’ fair values. If there is a material difference, then a revaluation is undertaken. The most recent valuation was performed by Opus International Consultations Limited (registered valuers) and the valuation is effective as at 1 July 2006. All infrastructural asset classes at valuation were valued. Land Under Roads Land under roads was valued based on fair value of adjacent land by Opus International Consultants Limited (registered valuers), effective 1 July 2006. Waipa District Council has elected to use the fair value of land under roads as at 1 July 2006 as deemed cost. Land under roads is no longer revalued. Accounting for Revaluations Revaluations of property, plant and equipment are on a class of asset basis. The results of revaluing are credited or debited to an asset revaluation reserve for that class of asset. Where this results in a debit balance in the asset revaluation reserve, this balance is expensed in the Statement of Financial Performance. Any subsequent increase in revaluation that off‐sets a previous decrease in value recognised in the Statement of Financial Performance will be recognised first in the Statement of Financial Performance up to the amount previously expensed, and then credited to the revaluation reserve for that class of asset. Intangible Assets Acquired computer software licences are capitalised on the basis of the costs incurred to acquire and bring to use the specific software. Costs associated with maintaining computer software are recognised as an expense when incurred.

214 Waipa District Council
Amortisation The carrying value of an intangible asset with a finite life is amortised on a straight‐line basis over its useful life. Amortisation begins when the asset is available for use and ceases at the date that the asset is derecognised. The amortisation charge for each period is recognised in the Statement of Financial Performance. The useful lives and associated amortisation rates of computer software have been estimated at 3‐10 years (33% ‐ 10%). Impairment Intangible assets that have an indefinite useful life, or not yet available for use, are not subject to amortisation and are tested annually for impairment. Assets that have a finite useful life are reviewed for indicators of and are tested annually for impairment at each balance date. When there is an indicator of impairment the asset’s recoverable amount is estimated. An impairment loss is recognised for the amount by which the asset’s carrying amount exceeds its recoverable amount. Forestry Forestry assets are independently revalued annually at fair value less estimated point of sale costs. Fair value is determined on the present value of expected net cash flows discounted at a current market pre‐tax rate. The calculation is based on existing sustainable felling plans and assessments regarding growth, timber prices, felling costs and silvicultural costs and takes into consideration environmental, operational and market restrictions. Gains or losses arising on initial recognition of forestry assets at fair value less estimated point of sale costs and from a change in fair value less estimated point of sale costs are recognised in the Statement of Financial Performance. The costs to maintain the forestry assets are included in the Statement of Financial Performance. Investment Properties Properties leased to third parties under operating leases are classified as investment property unless the property is held to meet service delivery objectives, rather than to earn rentals. Initially, investment properties are measured at cost including transaction costs. Subsequent to initial recognition investment properties are measured at fair value as determined annually by an independent valuer. Gains and losses on revaluation, acquisition, and disposal are recognised in the Statement of Financial Performance. Employee Benefits Employee benefits expected to be settled within twelve months of balance date are measured at nominal values based on accrued entitlements at current rates of pay. These include salaries and wages accrued up to balance date, annual leave earned to, but not yet taken at balance date, and sick leave. A liability for sick leave is recognised to the extent that absences in the coming year are expected to be greater than the sick leave entitlements earned in the coming year. The amount is calculated based on the unused sick leave entitlement that can be carried forward at balance date, to the extent that it is anticipated it will be used by staff to cover those future absences.

10‐year Plan (2009‐19) 215
Creditors and Other Payables Creditors and other payables are initially measured at fair value and subsequently measured at amortised cost using the effective interest method. Provisions Council recognises a provision for future expenditure of uncertain amount or timing when there is a present obligation (either legal or constructive) as a result of a past event, if it is probable that expenditures will be required to settle the obligation and a reliable estimate can be made of the amount of the obligation. Provisions are not recognised for future operating losses. Provisions are measured at the present value of the expenditures expected to be required to settle the obligation using a pre‐tax discount rate that reflects current market assessments of the time value of money and the risks specific to the obligation. The increase in the provision due to the passage of time is recognised as an interest expense. Derivative Financial Instruments Council uses derivative financial instruments to hedge its exposure to interest rate risks arising from financing activities. In accordance with the Treasury Management Policy, Council does not hold or issue derivative financial instruments for trading purposes. Derivatives financial instruments are recognised initially at fair value. Subsequent to initial recognition, derivative financial instruments are stated at fair value. The gain or loss on re‐measurement to fair value is recognised immediately in the Statement of Financial Performance. However, where derivatives qualify for hedge accounting, recognition of any resultant gain or loss depends on the nature of the item being hedged (see Hedging Policy). The fair value of interest rate swaps is the estimated amount that the Council would receive or pay to terminate the swap at the Statement of Financial Position date, taking into account current interest rates and the current credit worthiness of the swap counterparts. Hedging Derivatives are first recognised at fair value on the date a contract is entered into and are subsequently re‐measured to their fair value. The method of recognising the resulting gain or loss depends on whether the derivative is designated as a hedging instrument, and if so, the nature of the item being hedged. Council designates certain derivatives as either: (1) hedges of the fair value of recognised assets or liabilities or a firm commitment (fair value hedge); or (2) hedges of highly probable forecasted transactions (cash flow hedges). At the inception of the transaction Council documents the relationship between hedging instruments and hedged items, as well as its risk management objective and strategy for undertaking various hedge transactions. Council documents its assessment, both at hedge inception and on an ongoing basis, of whether the derivatives that are used in hedging transactions have been and will continue to be highly effective in offsetting changes in fair values or cash flows of hedged items.

216 Waipa District Council
Fair Value Hedge Changes in the fair value of derivatives that are designated and qualify as fair value hedges are recorded in the Statement of Financial Performance, together with any changes in the fair value of the assets or liability that are attributable to the hedges risk. Cash Flow Hedge The effective portion of changes in the fair value of derivatives that are designated and qualify as cash flow hedges is recognised in equity in the hedging reserve. The gain or loss relating to the ineffective portion is recognised immediately in the Statement of Financial Performance. Amounts accumulated in equity are recycled in the Statement of Financial Performance in the periods when the hedged item will affect profit or loss (for instance when the forecast sale that is hedged takes place). However, when the forecast transaction that is hedged results in the recognition of the non financial assets (for example inventory) or a non financial liability, the gains and losses previously deferred in equity are transferred from equity and included in the measurement of the initial cost of carrying amount of the asset or liability. When a hedging instrument expires or is sold or terminated, or when a hedge no longer meets the criteria for hedge accounting, any cumulative gain or loss existing in equity at the time remains in equity and is recognised when the forecast transaction is ultimately recognised in the Statement of Financial Performance. When a forecast transaction is no longer expected to occur, the cumulative gain or loss that was reported in equity is immediately transferred to the Statement of Financial Performance. Derivatives That Do Not Qualify For Hedge Accounting Certain derivative instruments do not qualify for hedge accounting. Changes in the fair value of any derivative instrument that do not qualify for hedge accounting are recognised immediately in the Statement of Financial Performance. Borrowings Borrowings are initially recognised at their fair value. After initial recognition, all borrowings are measured at amortised cost using the effective interest method. Equity Equity is the community’s interest in Council and is measured as the difference between total assets and total liabilities. Equity is disaggregated and classified into a number of reserves, the components of which are retained earnings, reserves and special funds, and asset revaluation reserves. Reserves and Special Funds Reserves and special funds are a component of equity representing a particular use to which various parts of equity have been assigned. Transfers from these reserves may be made only for certain specified purposes or when certain specified conditions are met.

10‐year Plan (2009‐19) 217
Goods and Services Taxation (GST) All items in the financial statements are stated exclusive of GST, except for receivables and payables which are stated on a GST inclusive basis. The net amount of GST recoverable from, or payable to, the Inland Revenue Department (IRD) is included as part of receivables or payables in the statement of financial position. The net GST paid to, or received from the IRD is classified as an operating cash flow in the statement of cash flows. Commitments and contingencies are disclosed exclusive of GST. Budget Figures The budget figures are those approved by Council at the adoption of the 10‐year Plan. The budget figures have been prepared in accordance with NZ GAAP, using accounting policies that are consistent with those adopted by Council for the preparation of these financial statements. Cost Allocation Council has derived the cost of service for each significant activity using the cost allocation system outlined below. Direct costs are those costs directly attributable and charged to a significant activity. Indirect costs are those costs which cannot be identified in an economically feasible manner with a specific significant activity. Indirect costs are charged to significant activities using appropriate cost drivers such as computer equipment used, staff numbers and floor area. Critical Accounting Estimates and Assumptions In preparing these financial statements, Council has made estimates and assumptions concerning the future. These estimates and assumptions may differ from the subsequent actual results. Estimates and assumptions are continually evaluated and are based on historical experience and other factors, including expectations or future events that are believed to be reasonable under the circumstances. Income Tax Council is tax exempt for income tax purposes.

218 Waipa District Council
Significant Forecasting Assumptions
FORECASTING ASSUMPTIONS RISK LEVEL OF UNCERTAINTY
REASON AND FINANCIAL EFFECT OF UNCERTAINTY
Useful lives of significant assets
The useful life will be in accordance with the information provided by registered valuers at each revaluation. The full list is shown in Accounting Policies above.
Actual asset lives may vary from forecast
Low Asset replacement plans are based on useful lives. As the useful lives form part of the assumptions used to value assets, it is unlikely that there will be any change over the 10 year period.
Sources of funds for future replacement of significant assets
Rates revenue includes a revenue stream to fund depreciation and this fund is available for the renewal of significant assets. Loans will be used to fund any additional replacement cost. Detailed information around funding sources is provided in the Revenue and Financing Policy under the Policy Section.
Funds will not be available to replace assets
Low
The Revenue and Financing Policy provides some flexibility in the funding mix available and any changes to replacement plans will be considered when compiling each year’s Annual Plan. Where a change is significant, it will be possible to defer or bring forward capital projects.
Projected growth change factors
Council will continue to provide services and perform functions to approximately the same standards as at present.
The growth of rateable properties in the District has been estimated to increase by 2% per annum.
Population growth has been estimated at 1.8% based on projections undertaken by the Waikato University for the Hamilton Sub‐regional Growth Strategy.
Growth is more or less than forecast
Medium The global economic situation creates uncertainty around achievement of estimated growth.
Based on recent growth rates, there is existing capacity to accommodate this level of growth for the next 3‐5 years. The majority of growth related expenditure occurs in later years of the Plan. Council will continue to monitor actual rates of growth and if there is a significant change, appropriate amendments will be made to the 10‐year Plan.

10‐year Plan (2009‐19) 219
FORECASTING ASSUMPTIONS RISK LEVEL OF UNCERTAINTY
REASON AND FINANCIAL EFFECT OF UNCERTAINTY
Cost factors
Expenditure for the 2009/10 year is based on estimated costs. For all future years of the 10‐year Plan costs and revenues have been adjusted to reflect inflation trends using financial indicators published by Business and Economic Research Limited (BERL) shown below. Staffing costs have been adjusted by 3% annually as this provides a closer reflection of Council’s remuneration strategy than the BERL rates.
Price level changes will vary from those used.
High The estimates of costs and revenue have been prepared based on price level adjustments recommended by BERL. Actual costs and revenues will change each year according to market forces, although this is not expected to have a significant impact. A 1% change from estimated to actual cost would be approximately $0.6m.
NZTA subsidy rate
NZTA subsidy rates are assumed to remain constant across the 10 years. The rates used are:
▪ Renewal and maintenance: 48%
▪ Minor improvements: 58%
▪ Road safety: 75%
▪ Level crossing warning devices: 100%
Subsidy rates vary
Low There has been little variation to the rates over recent years, hence the assumption of continuity across 10 years. A reduction in rate would be managed by either reducing the programme of work, or an increase in borrowing.

220 Waipa District Council
FORECASTING ASSUMPTIONS RISK LEVEL OF UNCERTAINTY
REASON AND FINANCIAL EFFECT OF UNCERTAINTY
Revaluation of non‐current assets
Properties in the District will be revalued on a three yearly cycle.
Infrastructural assets will be revalued on a three yearly cycle.
Investment property will be revalued annually.
The valuations for each year are based on the previous year’s values, plus additions and then increased by the appropriate BERL adjuster.
Values will vary from forecast
Medium The estimate of costs has been prepared based on price level adjustments provided by BERL. The cost of replacing or constructing assets will vary each year from the estimates according to market forces. Significant variations may require some projects to be rescheduled, either deferred or advanced.
Interest rates
Interest on term debt is calculated using the known rate for existing debt which is 8% fixed over a 5 year period, with new debt at 6%.
Interest on investments is calculated at 6%.
Interest rates will be higher or lower than forecast
Low Interest rates will vary from estimates. Council will manage this through interest rate risk management instruments authorised in the Liability Management Policy and by using internal borrowing as much as possible. A 1% change in interest rates would result in a change of $10,000 per $1 million of debt. In year 1 this would increase or decrease the interest cost by $60,000.
External funding
Assumptions have been made around the ability to raise community funding for some major community projects and also the level achievable.
Funding of major projects will not be achievable
High
Levels of community fundraising will be affected by the global economic climate and it is possible that the funding levels required may not be achieved. Significant projects which are partially funded by community funding will not commence until the community funding has been committed.
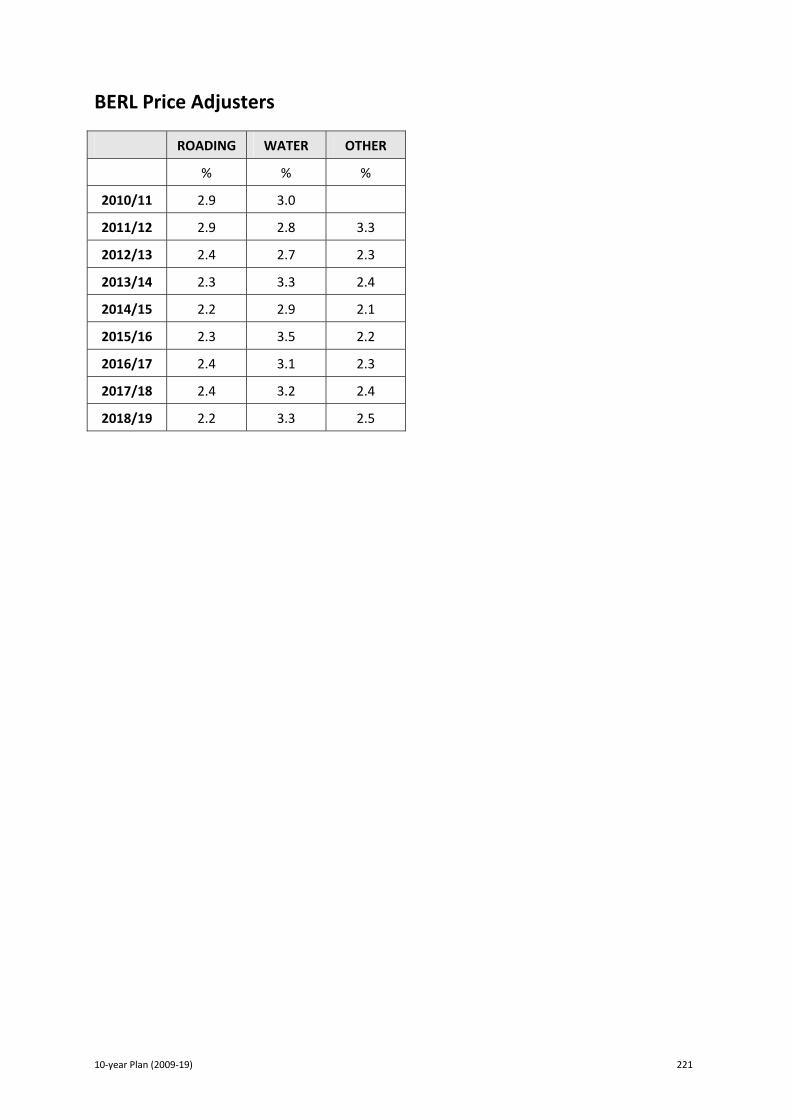
10‐year Plan (2009‐19) 221
BERL Price Adjusters
ROADING WATER OTHER
% % %
2010/11 2.9 3.0
2011/12 2.9 2.8 3.3
2012/13 2.4 2.7 2.3
2013/14 2.3 3.3 2.4
2014/15 2.2 2.9 2.1
2015/16 2.3 3.5 2.2
2016/17 2.4 3.1 2.3
2017/18 2.4 3.2 2.4
2018/19 2.2 3.3 2.5
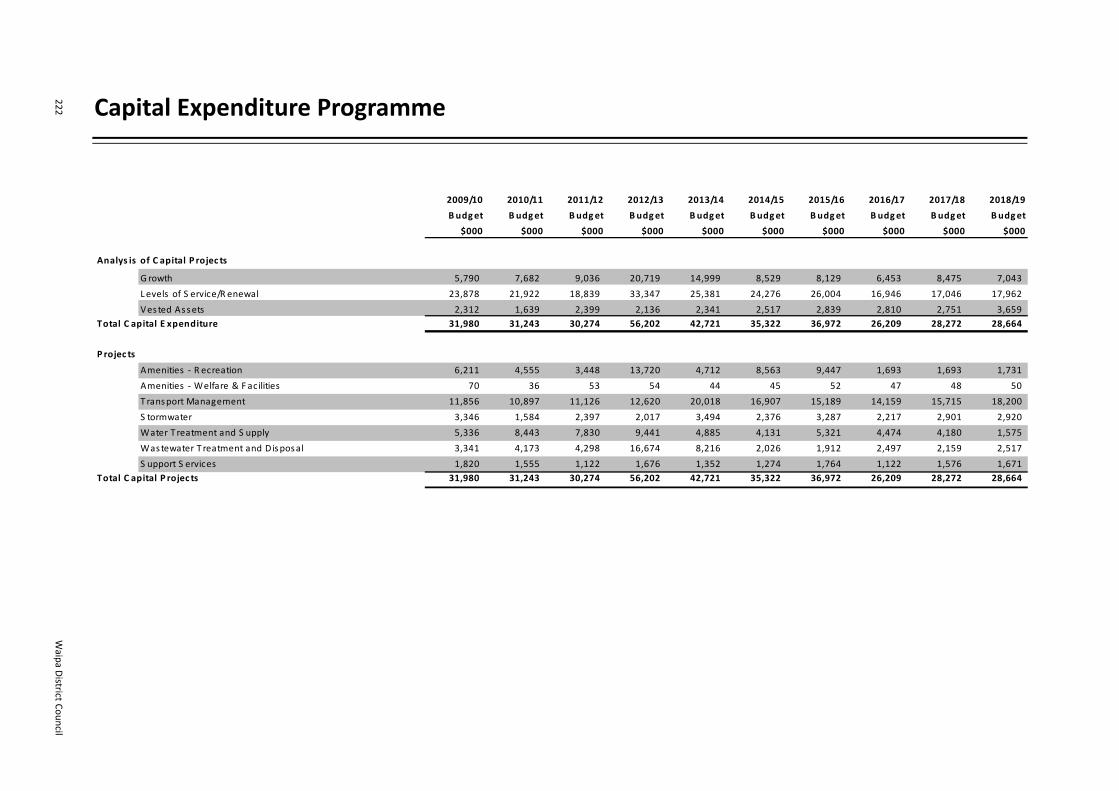
222
W
aipa District Council
Capital Expenditure Programme
2009/10 2010/11 2011/12 2012/13 2013/14 2014/15 2015/16 2016/17 2017/18 2018/19
Budget B udget Budget Budget B udget Budget Budget B udget Budget Budget
$000 $000 $000 $000 $000 $000 $000 $000 $000 $000
Analys is of C apital P rojec ts
Growth 5,790 7,682 9,036 20,719 14,999 8,529 8,129 6,453 8,475 7,043
Levels of S ervice/R enewal 23,878 21,922 18,839 33,347 25,381 24,276 26,004 16,946 17,046 17,962
Vested Assets 2,312 1,639 2,399 2,136 2,341 2,517 2,839 2,810 2,751 3,659Total C apital E xpenditure 31,980 31,243 30,274 56,202 42,721 35,322 36,972 26,209 28,272 28,664
P rojec ts
Amenities ‐ R ecreation 6,211 4,555 3,448 13,720 4,712 8,563 9,447 1,693 1,693 1,731
Amenities ‐ Welfare & F acilities 70 36 53 54 44 45 52 47 48 50
T ransport Management 11,856 10,897 11,126 12,620 20,018 16,907 15,189 14,159 15,715 18,200
S tormwater 3,346 1,584 2,397 2,017 3,494 2,376 3,287 2,217 2,901 2,920
Water Treatment and S upply 5,336 8,443 7,830 9,441 4,885 4,131 5,321 4,474 4,180 1,575
Wastewater Treatment and Disposal 3,341 4,173 4,298 16,674 8,216 2,026 1,912 2,497 2,159 2,517
S upport S ervices 1,820 1,555 1,122 1,676 1,352 1,274 1,764 1,122 1,576 1,671Total C apital P rojec ts 31,980 31,243 30,274 56,202 42,721 35,322 36,972 26,209 28,272 28,664

10‐year Plan (2009‐19) 223
Projects Considered but not Funded
PROJECT ESTIMATED 10YR COST
$000
Additional Treated Water Storage for Urban Areas $8,000
Back up Connection between Drinking Water Schemes $6,477
Cambridge 3rd Bridge (land purchase) $4,688
Cambridge Town Hall Refurbishment $1,137
Carpark Improvements $583
District Wide Water Metering (Universal) $4,005
Extra Widening of Roads for Levels of Service (incl Cycling) $7,962
Heart of Te Awamutu Projects
Adventure Playground
Churchill Street Carpark Extension
Events Centre Third Court Expansion
Mahoe Street Upgrade
SH3 External Gateways
Wellness Centre
$19,456
Leamington‐Karapiro Cycleway $850
New Museum in Cambridge $3,507
Te Rore Water Scheme $2,503
Western Arterial Land Purchases $2,896

224 Waipa District Council
10‐year Plan (2009‐19) 225
Section 7 – POLICIES AND PLANS
In this section: LGA Required Policies and
Plans Significance Policy Revenue and Financing
Policy Funding Impact Statement Rates Breakdown – Indicator
Properties Treasury Management Policy Development Contribution
Policy Policy on Private Sector
Partnerships Policy on the Remission and
Postponement of Rates Policy on the Remission and
Postponement of Rates on Māori Freehold Land
Waste Management Plan Assessment of Water and
Sanitary Services

226 Waipa District Council
LGA Required Policies and Plans
The following table provides a summary of the policies and statements that Council has adopted to ensure that its direction aligns with the community outcomes and Council’s vision. Full versions of these are included in this section.
POLICY SUMMARY
Significance Policy Sets out the Council’s approach in determining the significance of proposals and decisions in relation to issues, assets or other matters. The Policy sets out the thresholds, criteria and procedures Council will have regard to when assessing the extent to which issues, proposals and decisions are significant. The Policy lists those assets considered by Council to be strategic assets.
Revenue and Financing Policy Sets out the sources of funding Council will use to fund operating and capital expenditure. In establishing the Policy, Council has had regard to community outcomes, distribution of benefits and the timing of those benefits.
Treasury Management Policy (Incorporating the Liability Management and Investment Policies)
Sets out how Council will manage borrowings and Council’s objectives in terms of financial and equity investments, including investment mix, acquisition, management procedures and risk management.
Policy on Development and Financial Contributions
Sets out whether Council will require contributions for development by way of financial contributions (Resource Management Act 1991) or development contributions (Local Government Act 2002). Council has opted for funding development primarily by way of development contributions pursuant to the Local Government Act 2002.
Policy on Private Sector Partnerships
Sets out the circumstances whereby Council will enter into financial arrangements with private sector organisations, and the consultative process, conditions and management requirements to be adopted when pursuing any such partnership.
Policy on the Remission and Postponement of Rates
Sets out the objectives, conditions and criteria under which Council may remit or postpone rates to community organisations and individual ratepayers suffering financial hardship or wishing to covenant land for community benefit.
Policy on the Remission and Postponement of Rates on Maori Freehold Land
Sets out whether or not Council will provide for the remission or postponement of rates. Council has opted to make such provision, and the Policy sets out the objectives, conditions and criteria for providing for the remission and postponement of rates.

10‐year Plan (2009‐19) 227
Significance Policy
Significance is one of the most important concepts in the Local Government Act 2002 and is central to the purpose of local government enabling democratic local decision‐making and action. Section 90 of the Act requires that every local authority develop in consultation with their communities a policy on significance. The purpose of a “Significance” policy is to help local authorities direct the appropriate level of attention, consideration, consultation and disclosure to matters based on their relative importance to their communities. The following policy on significance is proposed by Council: General Approach In considering whether any issue, proposal, decision or other matter is of significance under this policy, Council will be guided by the following matters:
▪ The likely impact/consequence of the issue, proposal, decision or other matter, on the current and future social, economic, environmental, and cultural wellbeing of the community.
▪ The parties who are likely to be particularly affected by or interested in the issue, proposal, decision or other matter.
▪ The likely impact/consequences of the issue, proposal, decision or other matter from the perspective of those parties.
▪ The financial and non‐financial costs and implications of the issue, proposal, decision or other matter having regard to Council’s capacity to perform its role.
The more significant or material the impact or consequences of the issue, proposal, decision or other matter, the higher the standard of compliance required with Part 6 of the Local Government Act 2002, and the more likely the matter will be significant.
▪ In determining whether any issue, proposal, decision or other matter is significant, Council will consider the thresholds and apply the criteria and procedures set out below.
Thresholds When undertaking a process to determine which issue, proposal, decision or other matter is significant, Council will recognise the following thresholds:
▪ Issues, proposals, decisions, assets, or other matters for which Council will:
a) Incur operational expenditure exceeding 5% of its annual operating budget for that year; and
b) Incur capital expenditure exceeding $5.0 million, or 15% of its annual capital expenditure budget which ever is the greater, for any single project or proposal, or where spent on a strategic asset or strategic asset as a whole as defined in the Local Government Act 2002, or in the accompanying table to this policy, exceeds $5.0 million.
228 Waipa District Council
▪ Any transfer of ownership or control, or the disposal or abandonment, of a strategic asset as a whole as defined by the Local Government Act 2002.
▪ The sale of Council’s shareholding in any council‐controlled trading organisation, or council‐controlled organisation.
▪ A decision that will, directly or indirectly, severely affect the capacity (including financial capacity) of Council to carry out any activity identified in the 10‐year Plan.
▪ Entry into any partnership with the private sector to carry out a significant activity. ▪ Where any issue, proposal, decision or other matter triggers one or more of the above
thresholds, it shall be considered against the criteria set out below in determining whether it is significant.
Criteria In considering whether any issue, proposal, decision or other matter is significant the following criteria will be used:
▪ The issue, proposal, decision or other matter affects all or a large portion of the community in a way that is not inconsequential.
▪ The impact or consequences of the issue, proposal, decision or other matter on the affected persons will be substantial.
▪ The financial implications of the issue, proposal, decision or other matter on Council’s overall resources are substantial.
▪ The issue, proposal, decision or other matter has a history of wide public interest in the District or is likely to generate considerable public concern.
▪ The issue, proposal, decision or other matter is not able to utilise any other consultation procedure provided for under the Local Government Act 2002, or any other specific legislation.
Procedures In achieving this policy:
▪ Where any issue, proposal, decision or other matter triggers one or more of the thresholds the matter shall be reported to Council.
▪ Each report shall include a statement indicating that the issue, proposal, decision or other matter has been considered in regard to Council’s policy on significance. The report shall include an assessment of the degree of significance of the issue, proposal, decision or other matter based on the criteria outlined in this Policy, and make recommendation to Council.
▪ If the issue, proposal, decision or other matter is considered to be significant, the report to Council will also include a statement addressing the appropriate observance of such of sections 77, 78, 80, 81 and 82 of the Local Government Act 2002 as are applicable.
▪ Once an issue, proposal, decision or other matter is determined as significant in accordance with the application of this policy, the decision making provisions of the Local Government Act 2002, shall be applied as outlined in sections 76 to 81 of the Local Government Act 2002.
▪ Council will report annually through its Annual Report on all issues, proposals, decisions or other matters determined to be significant, and subject to the procedure outlined in sections 76, 77, 78, 80 and 81 of the Local Government Act 2002 as appropriate.

10‐year Plan (2009‐19) 229
Strategic Assets of Waipa District Council
ASSET NOTES
District Libraries (collectively) Includes books and recourse collections
Te Awamutu Events Centre Includes all land, buildings and structures
Cambridge Swimming Pool Includes all land, buildings and structures
Pensioner Housing (collectively) Includes all land, buildings and structures
Cemeteries (collectively) Includes all land, buildings and structures
Wastewater reticulation system Includes all pipes and pump stations
Stormwater reticulation system Includes all elements of the network
Amenity Parks, Sport Parks and other Recreation Facilities covered by the Reserves Act 1977
Includes all land, buildings and structures
Roading network Includes footpaths, off street parking and bridges
Reservoirs and water reticulation system Includes all land and structures
Wastewater Treatment Plants – Te Awamutu and Cambridge
Includes all land, buildings and plant
Water Treatment Plants – Hicks Road, Karapiro, Pukerimu, Alpha Street, Kihikihi, Te Tahi Road, Te Rore
Includes all land, buildings, treatment plants, tanks and other structures
Equity Securities in Waikato Regional Airport Limited
Waipa District Council administration offices – Cambridge and Te Awamutu
Includes all land and structures
Forestry assets Includes all land, trees and structures
Note: Strategic Asset, in the context of this Policy, means an asset or group of assets held by Council and which Council needs to retain in order to maintain or promote the current or future wellbeing of the community.

230 Waipa District Council
Revenue and Financing Policy
Funding of Operating Expenditure Council’s policies in relation to the funding of operating expenses are set to ensure prudent financial management and compliance with legislative requirements and generally accepted accounting practice. Council may choose to not fully fund operating expenditure in any particular year, if the deficit can be funded from operating surpluses in the immediate preceding or subsequent years. An operating deficit will only be budgeted when it would be beneficial to avoid significant fluctuations in rates, fees or charges. Council may choose to fund more than is necessary to meet the operating expenditure in any particular year. It will only budget for such an operating surplus if necessary to fund an operating deficit in the immediate preceding or following years, or to repay debt having regard to forecast future debt levels. Council has determined that operating expenditure will be funded from the following sources:
▪ General rates based on the capital value rating system ▪ Targeted Rates:
− District Wide Activities − Te Awamutu Events Centre − Cambridge Pool − Cambridge Community Sports Hall − Recycling − Capital Works − Stormwater − Rural Fire Management − Sewerage − Water Supply − Community Centre Charges − Hall Charges
▪ Fees and Charges ▪ Interest income ▪ Operating subsidies ▪ Other sources
The Local Government Act requires Council to produce a Funding Impact Statement that provides details on the funding mechanisms to be used for each year covered by the 10‐year Plan. The Funding Impact Statement shows how Council intends to implement the Revenue and Financing Policy each year. It also shows the amounts to be collected from each available source, including how various rates are to be applied.

10‐year Plan (2009‐19) 231
From time to time loans may be used to cover the cost of operating projects. These are likely to be projects which span more than one year, and/or the outcome of which is expected to last for some time (e.g. the District Plan). Any projects to be funded from loans will be identified in the annual Funding Impact Statement. Funding of Capital Expenditure As with operating expenditure, Council has set out to ensure that it takes a prudent approach to the funding of capital expenditure with an emphasis on legislative and accounting compliance. Council funds capital expenditure from a mix of the following sources:
▪ Grants and subsidies ▪ Borrowing ▪ Developer contributions ▪ Proceeds from asset sales ▪ Rates ▪ Operating surpluses
The Development Contributions Policy is a separate policy and provides full details around the rationale for, and level of, contributions. Funding Needs Section 101(3) of the Local Government Act requires Council to determine appropriate funding sources for each activity. This is a two step process involving consideration of a number of factors in respect of each activity, followed by consideration of the overall impact of the activity by activity considerations. STEP ONE The factors to be considered in respect of each activity are:
▪ The community outcomes to which the activity primarily contributes; ▪ The distribution of benefits between the community as a whole, any identifiable part of the
community, and individuals; ▪ The period in or over which those benefits are expected to occur; ▪ The extent to which the actions or inaction of particular individuals or a group contribute to
the need to undertake the activity; and ▪ The costs and benefits, including consequences for transparency and accountability, of
funding the activity distinctly from other activities.
STEP TWO Once the individual activity considerations are complete, Council is required to consider the overall impact of any allocation of liability for revenue needs on the current and future social, economic, environmental, and cultural wellbeing of the community.
232 Waipa District Council
In selecting funding mechanisms for each activity, Council seeks to fund private benefit from fees and charges, public community benefit from targeted rates, and public benefit (after any grants or subsidies have been applied) from a mixture of general rates and targeted rates for district wide activities. This mixture of general rates and targeted rates for district wide activities is referred to in this policy as “district wide funding”. District wide funding is also used to meet the shortfall where fees and charges able to be collected are less than the assessed private benefit of an activity, and where the funding of any activity or initiative through fees and charges or targeted rates is likely to result in a significant adverse impact on social, economic, environmental or cultural wellbeing of any community. Community Outcomes Council is required to identify the community outcome to which each activity primarily contributes. Each activity is assigned to one or more community outcomes with a rationale for why the activity is undertaken. Distribution of Benefits Council is required to assess the distribution of benefits between the community as a whole, any identifiable part of the community, and individuals. Council has identified three types of benefits: PUBLIC BENEFIT – DISTRICT WIDE
▪ A service or product that is available to all; ▪ From which it is not practicable to exclude and/or identify particular user(s); ▪ where use by one does not consume the service or product and it remains available for the
benefit of others; ▪ That typically does not incur significant additional costs for additional users; ▪ That may benefit the community generally through option value (availability), existence
value (quality of life), bequest value (a legacy for later generations) or prestige value (civic pride).
PUBLIC BENEFIT – COMMUNITY/GROUP
▪ A service or product (as above) but which has a proximity value or physical constraint restricting the area of benefit.
PRIVATE BENEFIT
▪ A service or product that is used only by a particular individual or groups; ▪ That once purchased or used is not available for use by another; ▪ That has a quantifiable incremental cost according to the number of users.
For a number of activities Council has established a range of values for the percentage split of public and private benefits, as these may vary from year to year depending on demand for services.

10‐year Plan (2009‐19) 233
Period of Benefits Council is required to assess the period in or over which those benefits are expected to occur which will in turn indicate the period over which the operating and capital expenditure should be funded. For all activities operating costs are directly related to providing benefits in the year of expenditure and are funded on an annual basis from annual revenue. Assets purchased via capital expenditure provide benefits for the duration of their useful lives ranging from a few years to many decades for infrastructural assets. The concept of intergenerational equity reflects the view that benefits occurring over time should be funded over time. Exacerbator Pays Council is required to consider the extent to which the action or inaction of particular individuals or a group contribute to the need to undertake the activity, for example dog control or rural fire management. Costs and Benefits Council is required to consider the costs and benefits, including consequences for transparency and accountability, of funding the activity distinctly from other activities. Overall Impact of Revenue Needs on Wellbeing When Council has completed its activity by activity analysis and allocation of funding mechanisms, it examines the overall effect of the allocation to ensure that it does not adversely impact the current or future wellbeing of the District. In order to achieve this, Council’s revenue policies have regard to the following principles:
▪ Fairness/equity ▪ Uniformity ▪ Efficiency ▪ Stability ▪ Simplicity ▪ Justifiability
Council monitors the effect of proposed funding mixes on a range of properties, including low and high value residential properties in urban areas and townships, rural properties, and high value commercial/industrial properties. Council adjusts the proportions of general rate and targeted ward rate which make up district wide funding to moderate the year to year effects of relative changes in the level of rates for the various types of properties. Funding Mechanisms In deciding how activities will be funded Council first looks to sources other than rates. These sources include fees and charges, grants, and subsidies. Rates are Council’s major source of income, although grants, fees and charges, subsidies, levies and loans provide substantial funding.
234 Waipa District Council
Council applies the following funding mechanisms:
▪ A General Rate based on capital value to meet a portion of district wide funding. ▪ Targeted Ward Rate to meet:
− The public community/group benefit element of activities; and − A portion of district wide funding.
▪ Fees and charges to recover the cost of individual benefits. ▪ Fines to control negative actions. ▪ District wide funding to meet subsidy requirements where fees and charges may not recover
all the costs of individual benefits. The proportions of district wide funding provided by general rates and the targeted ward rate are determined and detailed for each year in the Funding Impact Statement. Significant Activities Council has determined that the following activities are deemed significant activities:
▪ Governance and Strategic Direction ▪ Environmental Services ▪ Recreation and Heritage ▪ Amenity Services ▪ Transport Management ▪ Stormwater ▪ Wastewater Treatment and Disposal ▪ Water Treatment and Supply
Costs for each of these significant activities include a full allocation of Council’s support services overheads. Funding Rationale Governance and Strategic Direction Activities: Council Community Boards Elections Community Services Support (Grants) COMMUNITY OUTCOMES This significant activity contributes to the following community outcomes:
▪ Empowered people through democratic process ▪ Communication and consultation on all significant issues

10‐year Plan (2009‐19) 235
DISTRIBUTION OF BENEFITS Benefits are generated to the whole community and in the case of Community Board benefits are also generated to the particular communities each Board serves. PERIOD OF BENEFITS Benefits are considered to accrue equally over current and future time periods. CONTRIBUTION OF OTHERS There are no particular groups or individuals who impact on the need to undertake this activity. COSTS AND BENEFITS OF SEPARATING THIS ACTIVITY Council has the appropriate systems in place to separately identify the costs of the activities. FUNDING CONCLUSION Council and Elections provide a public benefit to the people of the District which should be funded by all ratepayers through district wide funding. The Community Boards provide a public benefit both to the individual communities that they serve and to the wider District and are funded partially by the Targeted Ward Rate and partially by district wide funding.
Activity Beneficiaries Funding
Council and Elections 100% Public 100% District wide Funding
Community Boards
75% Public Community 25% Public
75% Targeted Ward Rate 25% District wide funding
Community Grants 97% Public Community 3% Private
97% Targeted Ward Rate 3% Fees and Charges
Environmental Services Activities: Environmental Health Animal Control Resource Management Building Control COMMUNITY OUTCOMES The significant activity contributes to the following community outcomes:
▪ Feel safe and enjoy lifestyle of District ▪ A well‐managed environment ▪ A District in which people can take a pride ▪ Safer communities

236 Waipa District Council
In addition, the regulatory nature of these activities contributes to the following community outcome:
▪ Communication and consultation on all significant issues DISTRIBUTION OF BENEFITS Benefits are generated for the whole community identified in:
a) Health inspections; b) Maintaining animal control facilities; c) Planning controls (appeals to Environment Court, protecting heritage, landscape features, for
example); d) Maintenance of safe building standards; and e) Responding to non chargeable information requests.
These activities provide both public and private benefits. There are opportunities to identify particular individuals or groups to charge user recoveries, particularly for dog registration where the exacerbator principle can be applied and the persons are readily identifiable. PERIOD OF BENEFITS Benefits are considered to accrue equally over current and future time periods. CONTRIBUTION OF OTHERS This significant activity is largely a regulatory and policy activity and, as such, those individuals and groups required to comply with policies will have a significant impact on the activities. COST AND BENEFITS OF SEPARATING THIS ACTIVITY Council has the appropriate systems in place to separately identify the costs of the activities. FUNDING CONCLUSION User charges are levied for building services and other activities to recover the private benefit portion of services provided. The quantity of services delivered will vary according to market conditions, and accordingly Council may set a range for the allocation of benefits and funding for these activities. The balance is funded from district wide funding. Council is prevented by statutory limits from obtaining full recovery of costs relating to liquor licences and hazardous substances, leaving the balance to be funded from district wide funding.
Activity Beneficiaries Funding
Environmental Health 60% – 70% Public
30% – 40% Private
55% – 65% District wide funding
35% – 45% Fees and Charges
Animal Control 35% – 55% Public 35% – 55% District wide funding
10‐year Plan (2009‐19) 237
45% – 65% Private 45% – 65% Fees and Charges
Building Control 10% – 30% Public
70% – 90% Private
10% – 30% District wide funding
70% – 90% Fees and Charges
Resource Management 60% – 80% Public
20% – 40% Private
60% – 75% District wide funding
25% – 40% Fees and Charges
Recreation and Heritage Activities: Parks and Reserves Karapiro Domain District Libraries District Museums District Pools Heritage COMMUNITY OUTCOMES This significant activity contributes to the following community outcomes:
▪ A fit and active community ▪ Place, space and occasion to express cultures and interests ▪ Access to high quality facilities ▪ Social and cultural wellbeing ▪ A District in which people can take a pride
DISTRIBUTION OF BENEFITS Some activities are identified as generating benefits for the community generally; this can in some instances be the District as a whole (e.g. museums), or in other instances for an identifiable community within the District (e.g. the Te Awamutu Events Centre). PERIOD OF BENEFITS Benefits are considered to accrue equally over current and future time periods. CONTRIBUTION OF OTHERS The individual people and groups who use these amenity services will impact on the levels of service to be provided. COSTS AND BENEFITS OF SEPARATING THIS ACTIVITY Council has the appropriate systems in place to separately identify the costs of the activities.

238 Waipa District Council
FUNDING CONCLUSION There is an expectation of recovery from individuals or groups who are identified as benefiting from the service or facility. Council subsidises some activities via district wide funding to promote Council policies and achieve strategic outcomes through:
a) Defraying the costs to individuals of borrowing library books, to encourage recreational and educational development of District residents; and
b) Defraying the costs to individuals of entry to community facilities to encourage the development of a healthy community.
Activity Beneficiaries Funding
Parks and Reserves 100% Public 100% District wide funding
Karapiro 60% ‐ 70% Public
30% ‐ 40% Private
60% ‐ 70% District wide funding
30% ‐ 40% Fees and Charges
Libraries 22% Public Community
56% Public
22% Private
22% Targeted Ward Rate
65% District wide funding
13% Fees and Charges
Museums 100% Public 100% District wide funding
Te Awamutu Events Centre 20% Public
80% Private
72% District wide funding
8% Targeted Rate
20%Fees and Charges
Cambridge Covered Pool 20% Public
80% Private
72% District wide funding
8% Targeted Rate
20%Fees and Charges
Heritage 100% Public 100% District wide funding
CAPITAL EXPENDITURE
▪ Development contributions are used to fund increased capacity required as a result of growth.
▪ Depreciation reserves are used to fund projects relating to renewals. ▪ Separate reserves are used for endowment and property transactions. ▪ Borrowing is used to fund significant projects where there is no other funding source. ▪ General rates may be used to fund low value capital projects. ▪ Community fundraising is used to partially fund some community assets.
Amenity Services Activities: Cemeteries Public Toilets
10‐year Plan (2009‐19) 239
Properties Forestry Rural Fire/Civil Defence Waste Management (including recycling) Cambridge Community Sports Hall COMMUNITY OUTCOMES This significant activity contributes to the following community outcomes:
▪ High standards of public and environmental health ▪ Minimal waste and effective waste management ▪ Place, space and occasion to express cultures and interests ▪ Access to high quality facilities ▪ Social and cultural wellbeing ▪ A district in which people can take a pride
DISTRIBUTION OF BENEFITS Some activities are identified as generating benefits for the community generally; this can in some instances be the District as a whole (e.g. Civil Defence), in other instances for an identifiable community within the District (e.g. Rural Fire Management). Environmental management of landfill sites is considered to generate benefits for the community generally, but costs of communal rubbish collection systems are considered to be a benefit to the particular community. PERIOD OF BENEFITS Benefits are considered to accrue equally over current and future time periods. CONTRIBUTION OF OTHERS The individual people and groups who use these amenity services will impact on the levels of service to be provided. COSTS AND BENEFITS OF SEPARATING THIS ACTIVITY Council has the appropriate systems in place to separately identify the costs of the activities. FUNDING CONCLUSION There is an expectation of recovery from individuals or groups who are identified as benefiting from the service or facility. Council subsidises some activities via district wide funding to promote Council policies and achieve strategic outcomes through:
▪ Defraying the costs to individuals of entry to community facilities to encourage the development of a healthy community.

240 Waipa District Council
Activity Beneficiaries Funding
Cemeteries 40% Public
60% Private
20% – 40% District wide funding
60% – 80% Fees and Charges
Public Toilets 63% Public
37% Private
96% District wide funding
4% Fees and Charges
Community Properties 31% Public Community
37% Public
32% Private
31% Targeted Ward Rate
59% District wide funding
10% Fees and Charges
District Halls 66% Public
34% Private
55% District wide funding
45%Targeted Rate
Closed Landfills 100% Public 100% District wide funding
Pensioner Housing 100% Private 100% Fees and Charges
Commercial Properties 38% Public
62% Private
64% District wide funding
36% Fees and Charges
Forestry 100% Private 100% Fees and Charges
Rural Fire Management 100% Public 100% Targeted Rate
Civil Defence 100% Public 100% District wide funding
Litter Bins 100% Public 100% District wide funding
Waste Management (including recycling)
10% Public
90% Private
10% District wide funding
90% Targeted Rate
Cambridge Community Sports Hall
100% Public Community
100% Targeted Rate
CAPITAL EXPENDITURE
▪ Development contributions are used to fund increased capacity required as a result of growth.
▪ Depreciation reserves are used to fund projects relating to renewals. ▪ Separate reserves are used for endowment and property transactions. ▪ Borrowing is used to fund significant projects where there is no other funding source. ▪ General rates may be used to fund low value capital projects. ▪ Community funding is used to partially fund some community assets.
Transport Management Activities: Roading Car Parks

10‐year Plan (2009‐19) 241
COMMUNITY OUTCOMES This significant activity contributes to the following community outcomes:
▪ High standard of infrastructure ▪ Access to high quality facilities ▪ Safer communities ▪ Business opportunities ▪ A fit and active community
DISTRIBUTION OF BENEFITS Roading is considered to generate benefits for the community generally, although in some circumstances (e.g. seal extension) there is a higher proportion of benefit identified for a particular community. In some instances the provision of a facility is considered to benefit a particular community (e.g. footpaths) but maintenance of it generates a benefit to the District as a whole. PERIOD OF BENEFITS Roading is very much a long term asset. Council has identified the long term benefits of developing and upgrading roads and consequently funds this through loans, depreciation, financial and developmental contributions and New Zealand Transport Agency (NZTA) subsidies. Some district wide funding may be used if required. CONTRIBUTION OF OTHERS High volume users and specific industries impact on the quality of the roading network and Council endeavours to take account of this when developing the roading programme. COSTS AND BENEFITS OF SEPARATING THIS ACTIVITY Roading is a significant cost to Council and it is therefore considered appropriate to treat this as a separate activity. Council has the appropriate systems in place to separately identify the costs of the activities. FUNDING CONCLUSIONS Access to the roading system is regarded as a public good due to non‐excludability. The funding method is through district wide funding. External subsidies and contributions are available and Council seeks to maximise the level of subsidy available from external agencies and minimise district wide funding. The funding percentages are expressed as ranges, because the actual funding mix from year to year will vary in accordance with the percentage of work undertaken which is eligible for subsidy. Some of the programmes run within the activity provide a private benefit that is funded directly by a grant from an external agency. Council modifies the initial allocation for public car parks to include a subsidy, because of a policy to ensure the viability of the two towns as “vibrant, strong shopping and business centres”.
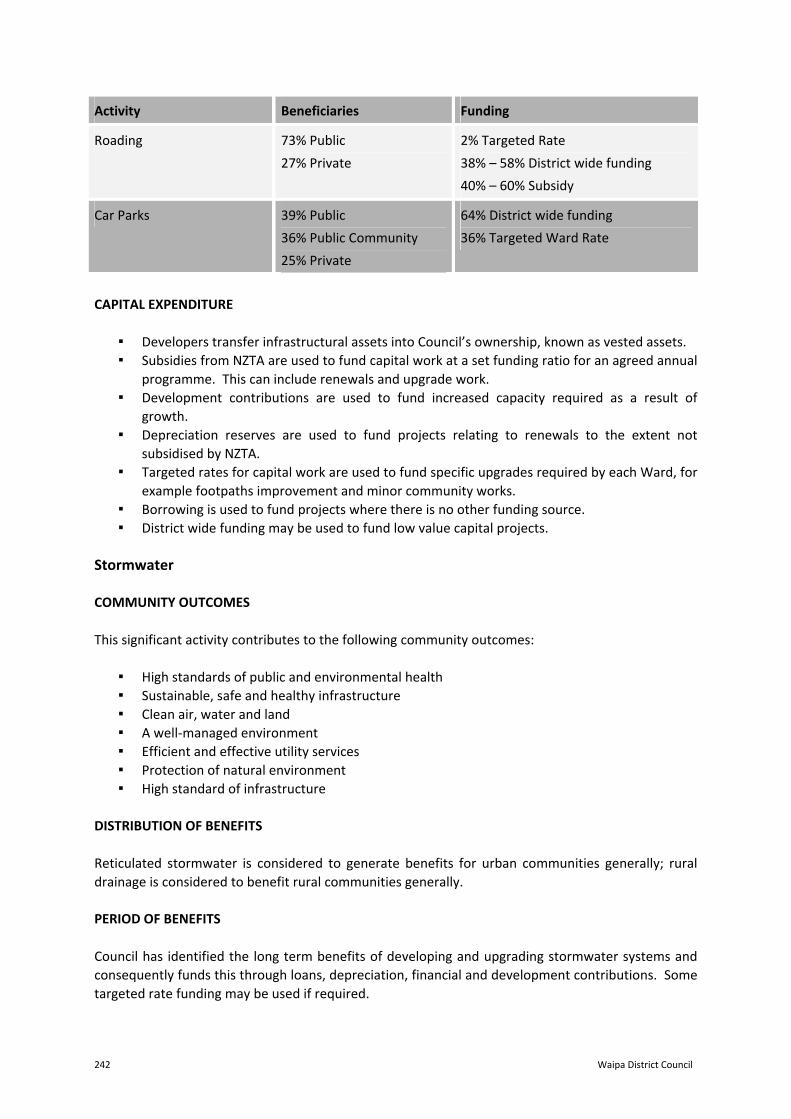
242 Waipa District Council
Activity Beneficiaries Funding
Roading 73% Public
27% Private
2% Targeted Rate
38% – 58% District wide funding
40% – 60% Subsidy
Car Parks 39% Public
36% Public Community
25% Private
64% District wide funding
36% Targeted Ward Rate
CAPITAL EXPENDITURE
▪ Developers transfer infrastructural assets into Council’s ownership, known as vested assets. ▪ Subsidies from NZTA are used to fund capital work at a set funding ratio for an agreed annual
programme. This can include renewals and upgrade work. ▪ Development contributions are used to fund increased capacity required as a result of
growth. ▪ Depreciation reserves are used to fund projects relating to renewals to the extent not
subsidised by NZTA. ▪ Targeted rates for capital work are used to fund specific upgrades required by each Ward, for
example footpaths improvement and minor community works. ▪ Borrowing is used to fund projects where there is no other funding source. ▪ District wide funding may be used to fund low value capital projects.
Stormwater COMMUNITY OUTCOMES This significant activity contributes to the following community outcomes:
▪ High standards of public and environmental health ▪ Sustainable, safe and healthy infrastructure ▪ Clean air, water and land ▪ A well‐managed environment ▪ Efficient and effective utility services ▪ Protection of natural environment ▪ High standard of infrastructure
DISTRIBUTION OF BENEFITS Reticulated stormwater is considered to generate benefits for urban communities generally; rural drainage is considered to benefit rural communities generally. PERIOD OF BENEFITS Council has identified the long term benefits of developing and upgrading stormwater systems and consequently funds this through loans, depreciation, financial and development contributions. Some targeted rate funding may be used if required.

10‐year Plan (2009‐19) 243
CONTRIBUTION OF OTHERS Users can impact on the progress of stormwater and Council seeks to identify any such circumstances. COSTS AND BENEFITS OF SEPARATING THIS ACTIVITY Stormwater is an activity that is closely monitored by Council and it is therefore considered appropriate to treat this as a separate activity. Council has the appropriate systems in place to separately identify the costs of the activities. FUNDING CONCLUSIONS Council considers that this service is a public benefit that should be recovered through a targeted rate differentiated for rural and urban service.
Activity Beneficiaries Funding
Stormwater 100% Public 100% Targeted Rate
CAPITAL EXPENDITURE
▪ Developers transfer infrastructural assets into Council’s ownership, known as vested assets. ▪ Development contributions are used to fund increased capacity required as a result of
growth. ▪ Depreciation reserves are used to fund projects relating to renewals. ▪ Separate reserves are used to fund upgrades/growth to achieve stated levels of service.
Once reserves are fully used, any remaining balance is funded by borrowing. ▪ Targeted rates may be used to fund low value capital projects.
Wastewater Treatment and Disposal COMMUNITY OUTCOMES This significant activity contributes to the following community outcomes:
▪ High standards of public and environmental health ▪ Sustainable, safe and healthy infrastructure ▪ A well‐managed environment ▪ Efficient and effective utility services ▪ High standard of infrastructure
DISTRIBUTION OF BENEFITS The provision of wastewater service is primarily a private benefit to the communities that can access the reticulation. This service also provides a public benefit via improved public health and environmental quality.

244 Waipa District Council
PERIOD OF BENEFITS Council has identified the long term benefits of developing and upgrading wastewater systems and consequently funds these through loans, depreciation, financial and development contributions. Some targeted rate funding may be used if required. CONTRIBUTION OF OTHERS Users can impact on the provision of the service and Council seeks to identify any such circumstances. COSTS AND BENEFITS OF SEPARATING THIS ACTIVITY Provision of wastewater service is an activity that is closely monitored by Council and it is therefore considered appropriate to treat this as a separate activity. Council has the appropriate systems in place to separately identify the costs of the activities. FUNDING CONCLUSIONS Council considers that this service is primarily a private benefit that should be funded through a targeted rate and through fees and charges for trade waste and recoveries. The rate will be differentiated for the service received, connected or connectable. The public benefit component will be funded through District wide funding.
Activity Beneficiaries Funding
Wastewater Treatment and Disposal
13% Public
87% Private
3% District wide funding
6% Fees and Charges
91% Targeted Rate
CAPITAL EXPENDITURE
▪ Developers transfer infrastructural assets into Council’s ownership, known as vested assets. ▪ Development contributions are used to fund increased capacity required as a result of
growth. ▪ Depreciation reserves are used to fund projects relating to renewals. ▪ Separate reserves are used to fund upgrades/growth to achieve stated levels of service.
Once reserves are fully used, any remaining balance is funded by borrowing. ▪ Targeted rates may be used to fund low value capital projects
Water Treatment and Supply COMMUNITY OUTCOMES This significant activity contributes to the following community outcomes:
▪ High standards of public and environmental health ▪ Sustainable, safe and healthy infrastructure ▪ Efficient and effective utility services

10‐year Plan (2009‐19) 245
▪ High standard of infrastructure DISTRIBUTION OF BENEFITS Direct users of the water supply clearly receive a benefit. This service also provides a public benefit in relation to the promotion of public health. PERIOD OF BENEFITS Council has identified the long term benefits of developing and upgrading water systems and consequently funds this through loans, depreciation, financial and development contributions. Some targeted rate funding may be used if required. CONTRIBUTION OF OTHERS Users can impact on the provision of the service and Council seeks to identify any such circumstances. COSTS AND BENEFITS OF SEPARATING THIS ACTIVITY Provision of water service is an activity that is closely monitored by Council and it is therefore considered appropriate to treat this as a separate activity. Council has the appropriate systems in place to separately identify the costs of the activities. FUNDING CONCLUSIONS Council considers this service to be primarily a private benefit that should be recovered through a targeted rate and through fees and charges for metered properties. The rate will be differentiated for the service received, connected or connectable. The public benefit component will be funded through district wide funding.
Activity Beneficiaries Funding
Water supply 11% Public
89% Private
3% District wide funding
35% Fees and Charges
62% Targeted Rate
CAPITAL EXPENDITURE
▪ Developers transfer infrastructural assets into Council’s ownership, known as vested assets. ▪ Development contributions are used to fund increased capacity required as a result of
growth. ▪ Depreciation reserves are used to fund projects relating to renewals. ▪ Separate reserves are used to fund upgrades/growth to achieve stated levels of service.
Once reserves are fully used, any remaining balance is funded by borrowing. ▪ Targeted rates may be used to fund low value capital projects.

246 Waipa District Council
Support Services Costs for each of the significant activities above include a full allocation of Council’s support services or overhead costs. Where operating projects carried out within Support Services will span more than one year, initial funding may be by way of loans. The interest and repayment of capital on these loans is allocated in accordance with other Support Services costs. Capital expenditure for support services may be financed from depreciation or loans. Where loans are used, the interest and repayment of capital on these loans is allocated in accordance with other Support Services costs. Overall Consideration of Impact of Revenue Needs The activity by activity analysis outlined above allocates some funding directly to sources such as fees and charges, subsidies, grants and targeted rates. The balance of funding comes from district wide funding, a mix of general rates and targeted ward rates. The exact proportions of general rates and targeted ward rates which make up district wide funding in any year will be set out in the Funding Impact Statement for that year. In arriving at the decision on the proportions, Council will bear in mind the following considerations:
▪ The effect of fixed charges (such as targeted ward rates) on the total rates burden of lower value residential properties, and households with low or fixed incomes;
▪ The effect of capital value based general rates on the total rates burden of high capital value rural properties, and very high capital value properties such as dams and dairy factories;
▪ The relative increases in rates proposed for the year for rural and urban ratepayers; ▪ Any barriers to accessibility for community services which might be created by fully funding
private benefit from fees and charges. ▪ Any advantages or disadvantages of particular community or cultural groups.
The balance between general rate and targeted ward rate components of district wide funding is struck by an iterative process, adjusting the proportions until Council is satisfied that the result best meets its funding and social objectives.

10‐year Plan (2009‐19) 247
Funding Impact Statement
Introduction This statement sets out the information required by Schedule 10 of the Local Government Act 2002, together with additional information provided to assist ratepayers in understanding the indicative impact of the 10‐year Plan. This statement should be read in conjunction with Council’s Revenue and Financing Policy that sets out Council’s policies in respect of each source of funding of operating and capital expenses. Council has reviewed the Revenue and Financing Policy and has taken into consideration:
a) the community outcomes to which each activity primarily contributes; b) the distribution of benefits between the community as a whole, any identifiable part of the
community, and individuals; c) the period in or over which those benefits are expected to occur; d) the extent to which the actions or inaction of particular individuals or a group contribute to
the need to undertake the activity; e) the costs and benefits, including consequences for transparency and accountability, of
funding the activity distinctly from other activities; and f) the overall impact of any allocation of liability for revenue needs on the current and future
social, economic, environmental, and cultural wellbeing of the community. This process of review mostly confirmed the existing policy with some refinements around the use of the general rate and the targeted ward rate. The proportions of general rate and targeted ward rate may be adjusted annually to refine the overall impact on the community as in f) above. This adjustment has removed the need for the general rate subsidy which has existed for some years. The exact proportions of general rate and targeted ward rate will be stated in the Funding Impact Statement in each year’s Annual Plan. Two new targeted rates are being introduced, the first for the Cambridge Community Sports Hall from 2009/10, and the second for the Cambridge Pool from 2012/13. At various points of this policy a level of rate or charge is specified. These are indicative figures included to give ratepayers an estimate of what their level of rates is likely to be in the coming year. The actual figures will not be known until the Council’s rating information database is finalised. The revenue and financing mechanisms to be used by Council will be applied across the ten years of the 10‐year Plan. The estimated amounts to be produced by each funding mechanism are outlined on the next page.

248
W
aipa District Council
Funding Impact Statement Overview
2009/10 2010/11 2011/12 2012/13 2013/14 2014/15 2015/16 2016/17 2017/18 2018/19
Budget B udget B udget B udget B udget B udget B udget B udget B udget B udget
$000 $000 $000 $000 $000 $000 $000 $000 $000 $000
Operating E xpenditure
Operating E xpenses 42,268 42,557 45,095 47,327 49,271 53,841 55,744 57,595 61,551 65,017
F inance C osts 1,800 2,236 3,126 3,654 4,392 4,800 5,034 5,394 5,064 5,088Total Operating E xpenditure (excluding Depreciation) 44,068 44,793 48,221 50,981 53,663 58,641 60,778 62,989 66,615 70,105
C apital E xpenditure
Growth 5,790 7,682 9,036 20,719 14,999 8,529 8,129 6,453 8,475 7,043
Levels of S ervice/R enewal 23,878 21,922 18,839 33,347 25,381 24,276 26,004 16,946 17,046 17,962
Vested Assets 2,312 1,639 2,399 2,136 2,341 2,517 2,839 2,810 2,751 3,659
Loan R epayments 2,409 3,433 3,705 4,730 5,209 7,072 6,534 8,151 9,022 8,322
Total C apital E xpenditure 34,389 34,676 33,979 60,932 47,930 42,394 43,506 34,360 37,294 36,986
Trans fers to R eserves 7 7 137 137 137 137 216 216 216 216
Total F unding Required 78,464 79,476 82,337 112,050 101,730 101,172 104,500 97,565 104,125 107,307
S ources of F unds
R ates 34,790 37,945 41,100 44,062 47,455 50,204 53,547 56,803 59,405 62,283
Development C ontributions 3,179 3,457 6,688 14,566 14,773 7,691 7,975 8,628 8,648 10,485
Interes t R evenue 650 650 650 650 650 650 650 650 650 650
S ubs idies 7,677 6,769 7,239 8,434 8,612 10,744 10,748 10,448 11,131 12,151
F ees & C harges 7,044 7,599 7,881 9,010 8,980 9,550 9,594 10,365 10,437 10,799
Water ‐ Metered R ates 2,882 3,011 3,140 3,270 3,426 3,576 3,752 3,924 4,106 4,302
Vested Assets 4,387 2,905 4,675 7,632 5,622 6,764 6,235 2,822 2,763 3,672
Loans 9,600 12,500 8,800 17,300 6,800 3,900 6,000 ‐ ‐ ‐
Trans fer from R eserves 8,255 4,640 2,164 7,126 5,412 8,093 5,999 3,925 6,985 2,965
Total F unding S ources 78,464 79,476 82,337 112,050 101,730 101,172 104,500 97,565 104,125 107,307

10‐year Plan (2009‐19)
249
Funding Impact Statement Overview ‐ continued
2009/10 2010/11 2011/12 2012/13 2013/14 2014/15 2015/16 2016/17 2017/18 2018/19
Budget B udget B udget B udget B udget B udget B udget B udget B udget B udget
$000 $000 $000 $000 $000 $000 $000 $000 $000 $000GS T E xclus ive
Rates
General Rate 11,835 12,838 13,867 14,951 15,603 16,398 17,916 19,032 19,981 21,222
Targeted Rates :
Ward R ate 11,112 12,033 12,880 13,840 14,375 15,099 16,381 17,366 18,263 19,297
Te Awamutu E vents C entre 65 66 67 61 62 64 57 58 51 52
C ambridge Pool ‐ ‐ ‐ ‐ 365 356 346 336 325 322
C ambridge C ommunity S ports Hall 82 199 195 191 178 174 169 164 158 152
C apital Works R ate 172 165 164 159 155 151 147 142 138 134
S tormwater 1,809 2,023 2,225 2,369 2,529 2,754 2,938 3,092 3,355 3,397
R ural F ire Management 70 72 73 81 74 75 84 86 88 85
S ewerage 5,433 5,638 5,902 6,113 7,350 7,872 8,050 8,508 8,779 8,976
Water 3,940 4,606 5,402 5,895 6,373 6,877 7,004 7,579 7,754 8,060
R ecycling R ate 876 950 1,011 1,120 1,135 1,151 1,249 1,266 1,352 1,439
C ommunity C entres / Dis trict Halls 73 73 73 73 73 73 73 73 73 7335,467 38,663 41,859 44,853 48,272 51,044 54,414 57,702 60,317 63,209
Less R ates C harged to C ouncil P roperties 686 727 767 798 825 847 875 906 920 934
P lus R ates P enalties & R emiss ions 9 9 8 7 8 7 8 7 8 8
Total Rates 34,790 37,945 41,100 44,062 47,455 50,204 53,547 56,803 59,405 62,283

250 Waipa District Council
Rates Information Note: The rates requirement figures quoted in the sections below include GST. General Rate Council proposes to set a general rate based on the capital value of each rating unit in the District with no differential being set. The rate for 2009/10 is 0.0995 cents in the dollar on the capital value of each rating unit. Additional activities funded District‐wide out of the general rate only include building control, swimming pools, public car parking, commercial properties, waste management, roading, and district stormwater. Amount to be raised: $13,307,508 Uniform Annual General Charge Council does not propose to set a uniform annual general charge. Targeted Rates Targeted rates will be set under Sections 16 and 19 of the Local Government (Rating) Act 2002 for the activities listed below. Utilities are not recorded in the District Valuation Roll as being located in any particular Ward and will not therefore be assessed for targeted rates. The targeted rates for water, recycling and some of the community centre halls are set for every separately used or inhabited part of a rating unit. This includes any portion of a rating unit inhabited or used by a person other than the owner, and who has the right to use or inhabit that portion by virtue of a tenancy, lease, licence or other agreement. District‐Wide Activities Council proposes to set a targeted rate on each rating unit in the District. The targeted rate will be a fixed amount per rating unit. This rate will be set on a differential basis based on location with the categories being the wards of Te Awamutu, Kakepuku, Cambridge, Maungatautari and Pirongia. The rates for the 2009/10 year are shown below:
RAISING:
Te Awamutu Ward $702 $ 4,225,338
Kakepuku Ward $649 $ 743,105
Cambridge Ward $703 $ 5,041,213
Maungatautari Ward $651 $ 820,911
Pirongia Ward $620 $ 1,670,280

10‐year Plan (2009‐19) 251
Both the general rate and the targeted District‐wide rate will be used to fund the District‐wide activities of governance, resource management, animal control, environmental health, libraries, civil defence, public toilets, cemeteries, community buildings, community grants, Te Awamutu Events Centre, District halls, water supply and sewerage. Activities funded District‐wide out of the targeted District‐wide rate include parks and reserves, community services support (grants), litter control, public safety, camping grounds, Cambridge Town hall (Cambridge ward only) and Kihikihi Memorial and Town Halls (Te Awamutu ward only). Amount to be raised: $12,500,847 Te Awamutu Events Centre Council proposes to set a targeted rate to fund the loan charges for the development of the Te Awamutu Events Centre. The targeted rate is a fixed amount per rating unit. A rate of $9 is set for each rating unit in the Te Awamutu and Kakepuku wards as well as the rating units referred to in rolls 04582, 04601, 04603 and 04605. Amount to be raised: $72,567 Cambridge Community Sports Hall Council proposes to set a targeted rate to fund the loan charges for the grant made for the development of the sports hall. In the year 2009/10 the rate will be for the second part of the year on the draw down of the loan, with future years’ rates being for the whole year. The targeted rate is a fixed amount per rating unit. A rate of $11 is set for each rating unit in the Cambridge and Maungatautari wards. Amount to be raised: $92,752 Cambridge Pool Council proposes to set a targeted rate to fund the loan charges for the development of the Cambridge Pool. The targeted rate is a fixed amount per rating unit. A rate will be set for each rating unit in the Cambridge and Maungatautari wards effective for the 2013/14 year. Capital Works Council proposes to set a targeted rate to fund capital costs in connection with improvements and extensions to footpaths, kerbing and channelling of roads and street lighting for each ward as follows. The capital works rate is based on the capital value of each rating unit in the District. The capital works rate is set on a differential basis based on location, with the categories being the wards of Te Awamutu, Kakepuku, Cambridge, Maungatautari and Pirongia. The rates in cents per dollar of capital value are shown on the following page:

252 Waipa District Council
RAISING:
Te Awamutu Ward 0.0029 $ 65,549
Kakepuku Ward 0.0001 $ 2,734
Cambridge Ward 0.0031 $ 111,703
Maungatautari Ward 0.0001 $ 2,384
Pirongia Ward 0.0004 $ 11,353
Amount to be raised: $193,723 Stormwater Council proposes to set a targeted rate to fund the operating costs and loan charges for stormwater in urban and rural areas of the District. The stormwater rate is based on the capital value of each rating unit in the District. The stormwater rate is set on a differential basis based on location, the categories being urban and rural. Urban is identified as being the urban drainage areas of Cambridge, Te Awamutu, Kihikihi, Ohaupo, Pirongia and Karapiro. Rural is identified as the remaining area of the District not identified in the urban category. The rates for 2009/10 in cents per dollar of capital value are shown in the following table:
RAISING:
Urban 0.0380 $ 1,656,885
Rural 0.0043 $ 377,891
Amount to be raised: $2,034,776 Rural Fire Management Council proposes to set a targeted rate to fund the costs of rural fire management in rural areas of the District. The rural fire management rate is based on the capital value of each rating unit in the rural category defined in the paragraph entitled “Stormwater” above. The rate for 2009/10 in cents per dollar of capital value is 0.0009. Amount to be raised: $79,098 Sewerage Charges Council proposes to set a targeted rate for sewerage disposal costs and loan charges for each rating unit in the areas of the Cambridge sewerage scheme and the Te Awamutu sewerage scheme.

10‐year Plan (2009‐19) 253
The targeted rate is set on a differential basis based on the provision of service, the categories of service being connected and serviceable. Connected means any rating unit that is connected to the Cambridge sewerage scheme or the Te Awamutu sewerage scheme. Serviceable means any rating unit situated within 30 metres of a public sewerage drain in one of the above Council sewerage scheme areas to which it is capable of being effectively connected but which is not so connected. The rates for the 2009/10 year are:
RAISING: Connected $ 472.00 Serviceable $ 236.00 $ 160,244 Rating units that are neither connected to the scheme nor serviceable are not liable for this rate. For each connected property the liability for the targeted rate will be calculated as follows:
i) A charge of $472.00 per pan for rating units with 3 or less pans connected $ 5,195,776
ii) A charge of $401.20 per pan for rating units with 4 to 10 pans connected $ 379,535
iii) A charge of $330.40 per pan for rating units with 11 to 15 pans connected $ 96,477
iv) A charge of $287.92 per pan for rating units with 16 to 20 pans connected $ 70,540
v) A charge of $259.60 per pan for rating units with 21 to 35 pans connected $ 78,140
vi) A charge of $226.56 per pan for rating units with 36 to 45 pans connected $ 55,054
vii) A charge of $212.40 per pan for rating units with 46 or more pans connected $ 76,039
A rating unit used primarily as a residence for one household will be treated as having one pan. Amount to be raised: $6,111,805 Water Charges
a) Council proposes to set a targeted rate to fund water supply costs and loan charges to non‐metered consumers in the areas of the Cambridge water supply and the Te Awamutu water supply.
The targeted rate is set on a differential basis based on the provision of service, the categories of service being connected and serviceable. Connected means every separately used or inhabited part of a rating unit that is connected to the Council water works in the Cambridge water supply area or the Te Awamutu water supply area. Serviceable means any rating unit that is within 100 metres of a supply pipe in either of the above water supply areas and is capable of being effectively connected but which is not so connected. The rates for the 2009/10 year are:
RAISING:
Connected $ 403.00 $ 4,260,113
Serviceable $ 201.50 $ 172,283

254 Waipa District Council
Rating units that are metered and are neither connected to the scheme, nor serviceable are not liable for this rate. Amount to be raised: $4,432,396
b) Council proposes to set a targeted rate for the supply of water to metered water consumers.
The targeted rate includes a flat charge and a charge based on the cubic metres of water consumed and is set on a differential basis based on the provision of service, the categories of service being potable and raw water. The rates for the 2009/10 year are:
Potable Water $ 229.00 0.6950 per cu mtr
Raw Water $ 229.00 0.1738 per cu mtr
Amount to be raised: $2,882,000
Recycling Charges Council proposes to set a targeted rate to fund the provision of a kerbside recycling service to each household in the District. The targeted rate is a fixed amount per separately used or inhabited part of a rating unit. A rate of $57 is set for every separately used or inhabited part of a rating unit. Amount to be raised: $ 985,701 Community Centre Charges Council proposes to set a targeted rate on each rating unit in the Community Centre areas. The charge is set on a differential basis based on location and will be charged to rating units within the Community Centre areas as follows: The targeted rate is a fixed amount per rating unit.
HALL CHARGE PER RATING UNIT RAISING:
Paterangi Hall $30.00 $4,710
Pukeatua Hall $25.00 $3,400
Parawera Hall $20.00 $1,680
Rukuhia Hall $25.00 $6,625
Te Miro Hall $25.00 $3,075
Maungatautari Hall $35.00 $4,620
Rangiaowhia Hall $15.00 $1,620
Monovale Hall $20.00 $2,800
Pirongia Sports and Recreation Centre $10.00 $10,000

10‐year Plan (2009‐19) 255
The targeted rate is a fixed amount per separately used or inhabited part of a rating unit.
HALL CHARGE PER SEPARATELY USED OR INHABITED PART OF A RATING UNIT
RAISING:
Kaipaki Hall $20.00 $5,060
Koromatua Hall $20.00 $4,760
Ohaupo Hall $13.00 $4,771
Ngahinapouri Hall $20.00 $5,980
Fencourt Hall $14.00 $4,102
Hautapu Hall $17.50 $7,245
The rate is to fund part of the costs of the community centre halls. Amount to be raised $70,448 Hall Charges Council proposes to set a targeted rate on each rating unit within the area of benefit. The targeted rate is based on the capital value of each rating unit listed below. The rate is set on a differential basis based on location. The rates for 2009/10 in cents per dollar of capital value are:
HALL CHARGE PER RATING UNIT RAISING:
Karapiro Hall 0.0022 $7,790
Horahora Hall 0.0017 $3,381
Piarere Hall 0.0019 $ 499
The rate is to fund part of the costs of the halls. Amount to be raised $11,670 Early Payment of Rates Sections 55 and 56 of the Local Government (Rating) Act 2002 empower Council’s to accept early payment of rates. Council proposes to accept payment in full of all rates assessed in each year on or before the due date for the first instalment of the year. Any payment of rates on this basis will be given a discount of 5%. This discount is not applicable to the targeted rate for the supply of water to metered water consumers.

256 Waipa District Council
Rates Payable by Instalments Rates are payable by four equal instalments due on the 21st day of August, November, February and May each year. Where the due date falls on a weekend or public holiday, the due date is extended until the next working day. Penalties on Rates Not Paid by the Due Date A penalty of 10% will be added to all instalments or part thereof remaining unpaid six days after the expiration of the date on which that instalment is required to be paid. Additional penalties of 10% will be added to any unpaid rates relating to a previous year or years that are still unpaid on 6 July and 6 January during the current rating year. Effect of Rates The following tables show how a representative selection of properties will be affected by the proposed 2009/10 rates outlined in this plan. A revaluation was undertaken in 2008/09 and rates for the 2009/10 year will be levied on the new values. The examples are indicative only and the effect on individual properties will be influenced by a combination of the rates movement and changes in valuation.

10‐year Plan (2009‐19)
257
Rates Breakdown – Indicator Properties
08/09 09/10 10/11 11/12 12/13 13/14 14/15 15/16 16/17 17/18 18/19C apital Value Rates C ents / $ of C V
General 0.1493 0.0995 0.1058 0.1122 0.1096 0.1123 0.1159 0.1139 0.1189 0.1228 0.1178S tormwater (Urban) 0.0439 0.038 0.0422 0.0445 0.0435 0.046 0.0486 0.0462 0.0494 0.0506 0.0476
F ixed Targeted Rates $S ewerage 487 472 480 493 501 591 621 623 646 654 656Water 373 403 461 531 569 604 640 640 680 683 697Targeted Wards 487 ‐ 559 620 ‐ 703 658 ‐ 747 697 ‐ 781 736 ‐ 824 752 ‐ 838 774 ‐ 863 829 ‐ 916 862 ‐ 952 888 ‐ 982 923 ‐ 1016C B C overed P ool 45 43 41 39 37 36C B C ommunity S ports Hall 11 26 25 24 22 21 20 19 18 17R ecycling 50 57 61 64 70 70 70 75 75 79 83
$ $ $ $ $ $ $ $ $ $ $ C ambridge $400,000
F ixed Targeted R ates 1,469 1,646 1,775 1,894 1,985 2,167 2,255 2,312 2,408 2,450 2,502 C apital Value R ates 633 563 604 638 672 694 720 762 800 823 846
2,102 2,209 2,379 2,532 2,657 2,861 2,975 3,074 3,208 3,273 3,348 $ Incr per week 3.17 2.04 3.27 2.95 2.40 3.92 2.20 1.89 2.58 1.26 1.44
Te Awamutu $370,000F ixed Targeted R ates 1,462 1,634 1,747 1,868 1,964 2,103 2,194 2,254 2,353 2,398 2,452 C apital Value R ates 622 529 567 599 630 650 675 712 747 768 789
2,084 2,163 2,314 2,467 2,594 2,753 2,869 2,966 3,100 3,166 3,241 $ Incr per week 3.29 1.52 2.91 2.94 2.45 3.07 2.22 1.87 2.58 1.27 1.44
K ihikihi $245,000F ixed Targeted R ates 1,462 1,634 1,747 1,868 1,964 2,103 2,194 2,254 2,353 2,398 2,452 C apital Value R ates 374 353 378 399 420 433 450 474 497 510 525
1,836 1,987 2,125 2,267 2,384 2,536 2,644 2,728 2,850 2,908 2,977 $ Incr per week 2.91 2.90 2.66 2.73 2.24 2.93 2.06 1.61 2.35 1.12 1.32
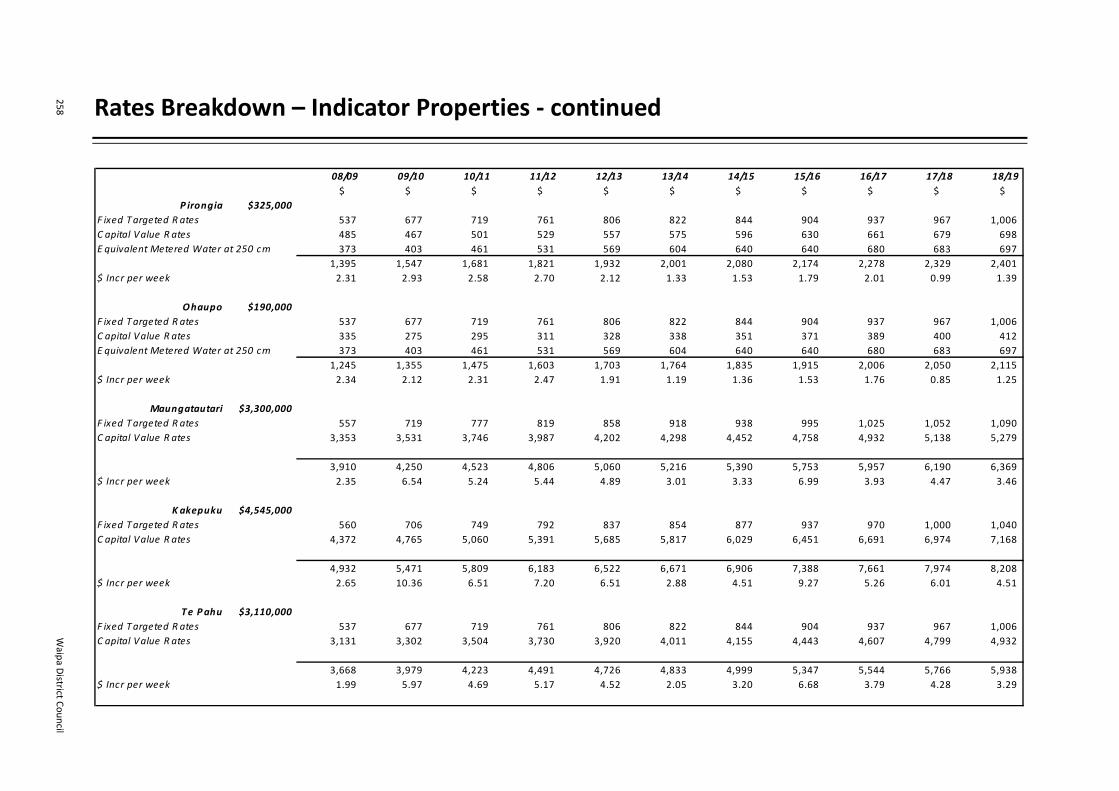
258
W
aipa District Council
Rates Breakdown – Indicator Properties ‐ continued
08/09 09/10 10/11 11/12 12/13 13/14 14/15 15/16 16/17 17/18 18/19$ $ $ $ $ $ $ $ $ $ $
P irongia $325,000F ixed Targeted R ates 537 677 719 761 806 822 844 904 937 967 1,006 C apital Value R ates 485 467 501 529 557 575 596 630 661 679 698 E quivalent Metered Water at 250 cm 373 403 461 531 569 604 640 640 680 683 697
1,395 1,547 1,681 1,821 1,932 2,001 2,080 2,174 2,278 2,329 2,401 $ Incr per week 2.31 2.93 2.58 2.70 2.12 1.33 1.53 1.79 2.01 0.99 1.39
Ohaupo $190,000F ixed Targeted R ates 537 677 719 761 806 822 844 904 937 967 1,006 C apital Value R ates 335 275 295 311 328 338 351 371 389 400 412 E quivalent Metered Water at 250 cm 373 403 461 531 569 604 640 640 680 683 697
1,245 1,355 1,475 1,603 1,703 1,764 1,835 1,915 2,006 2,050 2,115 $ Incr per week 2.34 2.12 2.31 2.47 1.91 1.19 1.36 1.53 1.76 0.85 1.25
Maungatautari $3,300,000F ixed Targeted R ates 557 719 777 819 858 918 938 995 1,025 1,052 1,090 C apital Value R ates 3,353 3,531 3,746 3,987 4,202 4,298 4,452 4,758 4,932 5,138 5,279
3,910 4,250 4,523 4,806 5,060 5,216 5,390 5,753 5,957 6,190 6,369 $ Incr per week 2.35 6.54 5.24 5.44 4.89 3.01 3.33 6.99 3.93 4.47 3.46
K akepuku $4,545,000F ixed Targeted R ates 560 706 749 792 837 854 877 937 970 1,000 1,040 C apital Value R ates 4,372 4,765 5,060 5,391 5,685 5,817 6,029 6,451 6,691 6,974 7,168
4,932 5,471 5,809 6,183 6,522 6,671 6,906 7,388 7,661 7,974 8,208 $ Incr per week 2.65 10.36 6.51 7.20 6.51 2.88 4.51 9.27 5.26 6.01 4.51
Te Pahu $3,110,000F ixed Targeted R ates 537 677 719 761 806 822 844 904 937 967 1,006 C apital Value R ates 3,131 3,302 3,504 3,730 3,920 4,011 4,155 4,443 4,607 4,799 4,932
3,668 3,979 4,223 4,491 4,726 4,833 4,999 5,347 5,544 5,766 5,938 $ Incr per week 1.99 5.97 4.69 5.17 4.52 2.05 3.20 6.68 3.79 4.28 3.29
10‐year Plan (2009‐19) 259
Treasury Management Policy
(Incorporating the Liability Management and Investment Policies) Introduction Waipa District Council (Council) undertakes liability management (borrowing), investment, cash and risk management activity (in total referred to in this document as treasury activity). Council’s borrowing and investment activities are carried out within the requirements of the Local Government Act 2002 (the Act) and its various amendments, which define the operating environment for local authorities in relation to borrowing, investment and risk management activity. This Treasury Management Policy (“the Policy”) document includes the Liability Management Policy and Investment Policy as required by Part 6, sections 104 and 105 of the Act. The policy provides the framework for all of Council’s treasury activities and defines key responsibilities and the operating parameters within which treasury activity is to be carried out. The Policy is supported by the Treasury Administrative Processes document. The scope of this policy covers treasury activity at the Council level and is formally reviewed and updated in conjunction with the review of the 10‐year Plan. Council’s borrowing activity is largely driven by its capital expenditure programme. Council manages a portfolio of investments comprising equity, forestry, property and treasury investments. Treasury Objectives and Philosophy Council’s broad objectives in relation to treasury activity are as follows:
▪ Compliance with the Act and any other relevant local authority legislation ▪ Manage Council’s investments according to its strategic and commercial objectives and
optimise returns within these objectives ▪ Avoidance of capital losses. For treasury investments this is achieved by investing on a hold
to maturity basis (unless circumstances otherwise dictate) with creditworthy counter parties ▪ Maintain funding mechanisms with an appropriate maturity profile to ensure adequate
liquidity is available at margins and costs appropriate to Council’s credit standing ▪ Manage the operational cash position and ensure that any surplus cash is used to repay debt
or is invested in approved liquid instruments ▪ Mitigate adverse interest rate related increases on ratepayer charges and maintain overall
interest costs within budgets ▪ Develop and maintain professional relationships with Council’s bankers and the financial
markets in general ▪ Provide timely and accurate reporting of treasury activity and performance
In meeting the above objectives, Council acknowledges that there are financial risks such as funding, liquidity, interest rate, credit and operational risks arising from its treasury activities. Council is a risk adverse entity and does not wish to incur additional risk from its treasury activities.

260 Waipa District Council
Accordingly, Council’s finance function in relation to its treasury activities is a risk management function focused on protecting Council’s budgeted interest costs and interest income and stabilising Council’s cash flows. Council seeks to prudently manage these risks, and activity that is unrelated to its underlying cash flows or may be construed as speculative in nature is expressly forbidden. Borrowing Policy General Policy Section 104 of the LGA 2002 provides that the Liability Management Policy required to be adopted under Section 102(4)(b) must state the local authority’s policies in respect of liability management, including:
▪ Interest rate exposure ▪ Credit exposure ▪ Liquidity ▪ Debt repayment ▪ Specific borrowing limits ▪ The giving of security
Within this policy document area policies in relation to all these items. Council’s infrastructure and community assets generally have long economic lives and long term benefits. The use of debt is seen as an appropriate and efficient mechanism for promoting intergenerational equity between current and future ratepayers in relation to Council’s assets and investments as well as assisting Council in meeting the infrastructure demands of its ratepayers on a timely basis. Council borrows as it considers appropriate within the flexible and diversified borrowing powers contained within the Local Government Act 2002. Borrowings not included in the 10‐year Plan are approved by Council resolution. Council raises debt for the following primary purposes:
▪ General debt to fund Council’s balance sheet ▪ Specific debt associated with “special one‐off” projects and capital expenditure ▪ To fund assets with intergenerational qualities
Council is able to borrow through a variety of market mechanisms including internal borrowing, the issue of local authority stock via the capital markets or direct bank borrowing. Council has a general preference to firstly use available internal reserves for its borrowing requirements and thereafter utilise external funding sources. Given the relative advantages to each funding mechanism, Council seeks to have a mix of both bank and loan stock borrowing over time. Generally, a bank term loan facility is most appropriate to provide working capital and core funding where there is uncertainty regarding timing and amount of borrowing. When there exists a degree of certainty in terms of amount and term the loan stock market may be an appropriate alternative source of funding.

10‐year Plan (2009‐19) 261
Borrowing by way of hire purchase or long term equipment lease is permissible if approved by Council resolution. Borrowing Limits In managing debt, Council will adhere to the following limits:
▪ The gross interest expense of external debt will not exceed 15% of annual rates and fees and charges revenue.
▪ Net cash flows from operating activities will exceed gross annual interest expense by four times.
Council will adhere to the borrowing limit that is reached first and provides the lowest level of debt capacity. Council reports compliance to these limits on an annual basis. Liquidity and Funding Risk Management Liquidity risk management refers to the timely availability of funds when needed without incurring penalty costs. Funding risk management centres on the ability to re‐finance or raise new debt at a future time at the same or more favourable pricing (fees and borrowing margins) and terms of existing facilities. Council’s ability to readily attract cost effective borrowing is largely driven by its ability to maintain a strong balance sheet, raise general rates and manage its relationships with investors and bankers/brokers. Where practical, Council seeks a diversified pool of external borrowing and ensures bank borrowings and incidental arrangements (risk management products) are only sought from strongly rated New Zealand registered banks. This ensures that funds are available when required and amounts owing are paid in full on the due date. Council minimises its liquidity risk by:
▪ Matching expenditure closely to its revenue streams and managing cash flow timing differences through its bank facilities and/or maintaining a liquidity buffer
▪ Maintaining its cash management investments in liquid and negotiable instruments ▪ Avoiding concentration of debt maturity dates
The matching of longer term expenditure and revenue requirements are monitored through the cash flow forecast prepared during the annual planning and 10‐year Plan process. Short term mismatches are monitored through the monthly rolling cash flow forecast report. To ensure funds are available, Council maintains:
▪ Treasury investments in liquid instruments ▪ Sufficient available operating cash flow, liquid investments and/or committed bank facilities
to meet its projected cash flow commitments over the next year and provide a $3.5 million liquidity buffer.

262 Waipa District Council
In relation to funding risk management, Council aims to minimise the risk of debt maturing or being reissued in periods of illiquidity or where credit margins are high Council’s objective, where practical, by spreading debt between bank and loan stock funding and across a range of maturities. Council manages this specifically by ensuring that:
▪ No more than 33% of total debt outstanding or $30 million (whichever is the highest) is subject to refinancing in any financial year.
Internal Borrowing Council uses its reserves and external borrowing to internally fund capital expenditure as identified in the 10‐year Plan and Annual Plan and approved by Council resolution. The finance function is responsible for administering Council’s internal loan portfolio.
▪ The primary objective in funding internally is to use reserves and external borrowing effectively, by establishing a portfolio that provides funding to internal activity centres. This creates operational efficiencies as savings are created by eliminating the margin that would be owing through Council separately investing and borrowing externally.
The following operational parameters apply in relation to the management of Council’s internal loan portfolio:
▪ The finance function uses the internal loan portfolio as an input into determining its external debt requirements. Where possible, Council’s reserves are used firstly to reduce external debt requirements, effectively reducing Council’s net interest cost
▪ All internal borrowing activities are consistent with the principles and parameters outlined throughout this policy
▪ In determining an activity centre’s internal loan amount, any prepaid depreciation reserve or other related amount is firstly allocated to that centre. Any additional funding is then provided through internal loans
▪ The term of the internal loan is the lesser of either the economic life of the asset or 20 years ▪ Due to the long term nature of internal borrowings, the objective of matching the maturity
profiles to the internal reserves and external borrowing maturity profiles is assisted through the use of available bank facilities or the liquidity buffer
▪ Council seeks to match the interest rate profile on its borrowing and investing activities to its internal borrowing activities
▪ A notional internal loan is set up for all new capital projects and allocated to the activity centre incurring the expenditure
▪ Principal amounts are repaid in instalments. Instalment amounts are agreed upon commencement of the loan and determined on a table mortgage basis
▪ Interest is set annually on all internal loans at the weighted average cost of external borrowing (including credit margin and other related costs). Interest received is allocated to the specific reserve or fund account.
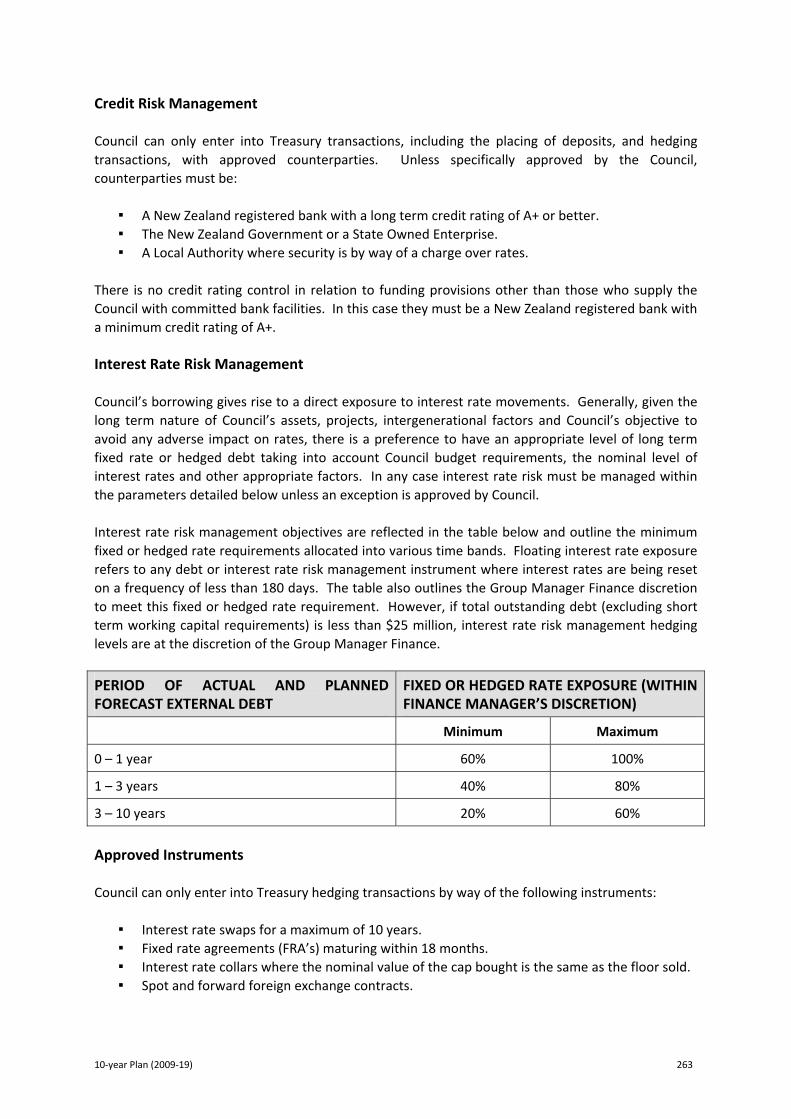
10‐year Plan (2009‐19) 263
Credit Risk Management Council can only enter into Treasury transactions, including the placing of deposits, and hedging transactions, with approved counterparties. Unless specifically approved by the Council, counterparties must be:
▪ A New Zealand registered bank with a long term credit rating of A+ or better. ▪ The New Zealand Government or a State Owned Enterprise. ▪ A Local Authority where security is by way of a charge over rates.
There is no credit rating control in relation to funding provisions other than those who supply the Council with committed bank facilities. In this case they must be a New Zealand registered bank with a minimum credit rating of A+. Interest Rate Risk Management Council’s borrowing gives rise to a direct exposure to interest rate movements. Generally, given the long term nature of Council’s assets, projects, intergenerational factors and Council’s objective to avoid any adverse impact on rates, there is a preference to have an appropriate level of long term fixed rate or hedged debt taking into account Council budget requirements, the nominal level of interest rates and other appropriate factors. In any case interest rate risk must be managed within the parameters detailed below unless an exception is approved by Council. Interest rate risk management objectives are reflected in the table below and outline the minimum fixed or hedged rate requirements allocated into various time bands. Floating interest rate exposure refers to any debt or interest rate risk management instrument where interest rates are being reset on a frequency of less than 180 days. The table also outlines the Group Manager Finance discretion to meet this fixed or hedged rate requirement. However, if total outstanding debt (excluding short term working capital requirements) is less than $25 million, interest rate risk management hedging levels are at the discretion of the Group Manager Finance.
PERIOD OF ACTUAL AND PLANNED FORECAST EXTERNAL DEBT
FIXED OR HEDGED RATE EXPOSURE (WITHIN FINANCE MANAGER’S DISCRETION)
Minimum Maximum
0 – 1 year 60% 100%
1 – 3 years 40% 80%
3 – 10 years 20% 60%
Approved Instruments Council can only enter into Treasury hedging transactions by way of the following instruments:
▪ Interest rate swaps for a maximum of 10 years. ▪ Fixed rate agreements (FRA’s) maturing within 18 months. ▪ Interest rate collars where the nominal value of the cap bought is the same as the floor sold. ▪ Spot and forward foreign exchange contracts.

264 Waipa District Council
There is no credit rating control in relation to funding providers other than those who supply the Council with committed bank facilities. In this case they must be a New Zealand registered bank with a minimum credit rating of A+. Security Council generally does not offer assets, other than a charge over rates or rates revenue, as security for any loan or performance of any obligation under an incidental arrangement. Council’s current security arrangements consist of a charge over rates by way of a debenture trust deed. Repayment The Council repays borrowings from renewal loans or general funds. Contingent Liabilities Council provides financial guarantees to community and service organisations. Management ensures that the Business Plan of the guaranteed party furthers the strategic objectives of Council and that financial statements are received on a regular basis. Should the guarantee be called up, Council takes immediate action to recover the money. Individual guarantees are limited to $1 million and total guarantees will not exceed $5 million. Granting of any guarantees is by Council resolution. Investment Policy Section 105 of the Act provides that the Investment Policy required to be adopted under Section 102(4)(c) must state the local authority’s policies in respect of investments, including:
▪ The mix of investments. ▪ The objectives in terms of which financial and equity investments are to be managed. ▪ The acquisition of new investments. ▪ An outline of the procedures by which investments are managed and reported. ▪ An outline of how risks associated with investments are assessed and managed.
Council investments are maintained to meet specific strategic and economic objectives outlined in the 10‐year Plan. The finance function monitors the investments and reports performance on a regular basis to the Chief Executive and Council. The types of investments held include:
▪ Equity Investments ▪ Loan Advances ▪ Property Investments ▪ Forestry Investments ▪ Treasury Investments

10‐year Plan (2009‐19) 265
Equity Investments Council maintains an investment in Waikato Regional Airport Limited and has a small interest in Civic Assurance Limited. Other than to achieve strategic objectives, it is not Council’s intention to undertake new equity investments. Council will periodically review investments with a view to exiting at a time when market conditions are favourable and overall strategic objectives are not compromised. Any dividend income is included as part of general revenue. Any purchase or disposition of equity investments not identified in the 10‐year Plan is by Council resolution. At time of disposal, Council determines the most appropriate use of sale proceeds. Loan Advances Council provides financial guarantees to community and service organisations but does not make loan advances. Council has existing outstanding community loans which it will manage until repayment is complete. Property Investments Council owns property to achieve its strategic objectives. As a general rule, Council will not maintain a property where it is not essential to the delivery of relevant services, and property is only retained where it relates to a primary output of Council. Council reviews property ownership through assessing the benefits of continued ownership in comparison to other arrangements that could deliver the same results. This assessment is based on the most financially viable method of achieving the delivery of Council services. The purchase or disposition of property not identified in the 10‐year Plan is approved by Council resolution. A precondition of all property purchase is the obtaining of a current registered valuation. Property holdings are sold at market values that are at least equivalent to 90% of a current registered valuation. Vendor financing may be provided to facilitate a sale. Except where Council has identified a rental subsidy appropriate to the end use for which the property is held, all properties will be leased on commercial terms at market rates. Rental subsidies, not identified in the 10‐year Plan will be by Council resolution. All income, including rentals and ground rent from property held is included as part of general revenue. Net proceeds from the sale of investment properties, unless subject to statutory constraints, will form part of the reserves of the District, to be reinvested in new assets or the betterment of existing assets for the benefit of the present and future residents of the District. A resolution of Council is required for expenditure from the asset sale account.
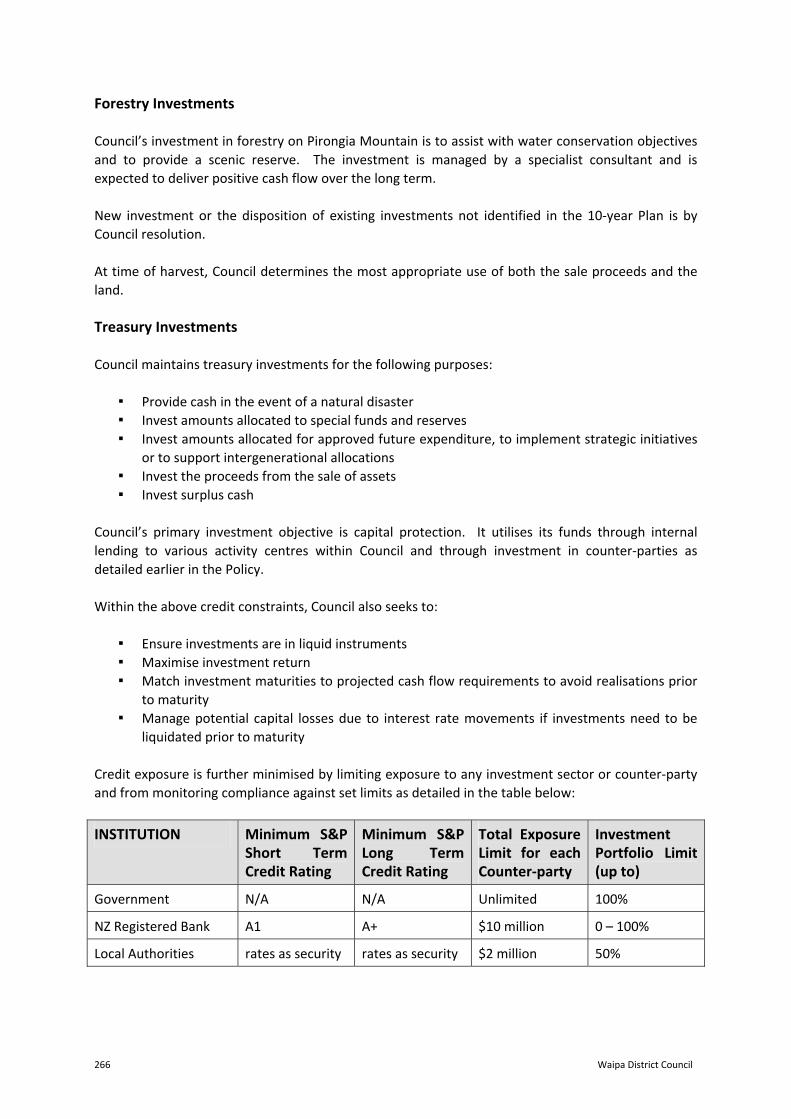
266 Waipa District Council
Forestry Investments Council’s investment in forestry on Pirongia Mountain is to assist with water conservation objectives and to provide a scenic reserve. The investment is managed by a specialist consultant and is expected to deliver positive cash flow over the long term. New investment or the disposition of existing investments not identified in the 10‐year Plan is by Council resolution. At time of harvest, Council determines the most appropriate use of both the sale proceeds and the land. Treasury Investments Council maintains treasury investments for the following purposes:
▪ Provide cash in the event of a natural disaster ▪ Invest amounts allocated to special funds and reserves ▪ Invest amounts allocated for approved future expenditure, to implement strategic initiatives
or to support intergenerational allocations ▪ Invest the proceeds from the sale of assets ▪ Invest surplus cash
Council’s primary investment objective is capital protection. It utilises its funds through internal lending to various activity centres within Council and through investment in counter‐parties as detailed earlier in the Policy. Within the above credit constraints, Council also seeks to:
▪ Ensure investments are in liquid instruments ▪ Maximise investment return ▪ Match investment maturities to projected cash flow requirements to avoid realisations prior
to maturity ▪ Manage potential capital losses due to interest rate movements if investments need to be
liquidated prior to maturity Credit exposure is further minimised by limiting exposure to any investment sector or counter‐party and from monitoring compliance against set limits as detailed in the table below:
INSTITUTION Minimum S&P Short Term Credit Rating
Minimum S&P Long Term Credit Rating
Total Exposure Limit for each Counter‐party
Investment Portfolio Limit (up to)
Government N/A N/A Unlimited 100%
NZ Registered Bank A1 A+ $10 million 0 – 100%
Local Authorities rates as security rates as security $2 million 50%

10‐year Plan (2009‐19) 267
Foreign Exchange Policy Form time to time Council may have foreign exchange exposure through the occasional purchase of foreign currency denominated plant, equipment and services. All exposures over NZD100,000 equivalent are recognised and hedged when the exact timing and amount of the exposure is known following the Group Manager Finance’s approval. Exposures are hedged using foreign exchange contracts. Exposures of less than NZD100,000 equivalent are transacted at the prevailing spot rate on the day. Council does not borrow or enter into incidental arrangements within or outside New Zealand in currency other than New Zealand currency.

268 Waipa District Council
Development Contribution Policy
1. Introduction 1.1 Legislative Requirements and Powers Council is required to have a Development Contribution Policy as a component of its Funding and Financial Policies in its Long‐Term Council Community Plan (LTCCP) under section 102 (4) (d) of the Local Government Act 2002 (LGA02). Section 198 of the LGA02 gives Council the power to require a contribution for developments. Development Contributions provide Council with the means to fund infrastructure required due to growth. The Development Contribution Policy (the Policy) has been prepared in accordance with the LGA02 and summarises and explains the capital expenditure identified in the LTCCP that Council expects to incur to meet the increased demand for community facilities resulting from growth in the District. It also sets out the development contributions payable by developers, how and when they are to be calculated and paid, and a summary of the methodology and the rationale used in calculating the level of contribution. 1.2 Background The Waipa District has experienced a high level of growth over recent years. Along with the advantages of this strong growth comes the difficulty of funding and building sufficient network and community infrastructure to service the growing community. The infrastructure required to support growth includes, but is not limited to:
▪ Parks and Reserves; ▪ Network Infrastructure (Roading and Transport, stormwater, water supply and wastewater);
and ▪ Community Infrastructure (facilities on parks and reserves, libraries, public toilets, leisure
and community centres). The principle underlying development contributions is that developers should meet the costs attributable to growth. In the interests of achieving financial equity between existing ratepayers and new developers, Council has decided that developers should pay the growth related capital expenditure costs of providing community facilities (i.e. network infrastructure, community infrastructure and parks and reserves). The background information supporting the Development Contribution Policy (the Policy) is included in the Methodology sections. The detailed calculations and other information supporting this Policy are available separately. 1.3 Adoption of the Policy The Policy was adopted on 30 June 2009 in conjunction with the 2009 – 19 LTCCP. It comes into force on the 1 July 2009, and affects applications for resource consents, building consents and authorisations for service connections that are granted on, or after, that date.
10‐year Plan (2009‐19) 269
The Policy replaces Council’s first Development Contribution Policy (the 2006 Policy), which was adopted on 13 March 2006 in conjunction with the 2006‐2016 LTCCP. 1.4 Transitional provisions The Policy sets development contributions which are, in some cases, significantly higher than the contributions set under the 2006 Policy. In recognition of the fact that many developments have been planned on the basis of the 2006 Policy contributions, and that those developers have received development contribution notices based on the 2006 Policy, Council will re‐assess those developments either on the basis of the 2006 Policy, with adjustments for inflation as described later in this Policy; or on the basis of this Policy, whichever sets the lower total contribution for the relevant catchment. Only developments in respect of which development contribution notices have been issued as at 30 June 2009 will be eligible for this scheme. 1.5 Revising the Policy in the future The Policy will be reviewed as required, but at least once every three years, when the LTCCP is reviewed. Similar transitional provisions to those outlined above will be included at each review. 1.6 When a Development Contribution is required A Development Contribution is required in relation to a development when:
▪ The effect of that development is to require new or additional assets or assets of increased capacity in terms of network infrastructure, reserves and community infrastructure; and
▪ The Council incurs capital expenditure to provide appropriately for those assets, i.e. network infrastructure, reserves and community infrastructure.
The effect of a development in terms of impact on these assets includes the cumulative effect that a development may have in combination with other development. The Policy also enables Council to require a development contribution that is used to pay, in full or in part, for capital expenditure already incurred by the Council in anticipation of development. 1.7 Relationship to Resource Management Act 1991 Development contributions under the LGA02 are separate from Financial Contributions under the Resource Management Act 1991 (RMA). While Council generally considers development contributions under this Development Contribution Policy as its main funding tool for infrastructure, it may also require Financial Contributions under the RMA. Council may require a Financial Contribution, as a condition of consent, in accordance with any relevant rule in the District Plan under the RMA. Financial Contributions must not be applied as a condition on a consent where a Development Contribution has been required for the same purpose on the same development. For the avoidance of doubt, the catchments/financial contributions/levies listed below will continue to be considered under the relevant rules pursuant to the operative Waipa District Plan 1997 (including any subsequent financial contributions made operative via the RMA plan change process after 1 January 2009).
▪ Cash in lieu of carparking ▪ Pukerimu

270 Waipa District Council
▪ Ohaupo ▪ Hautapu
The Council still has the power to require services or works for subdivisions or developments to avoid, remedy and mitigate the environmental effects through resource consent conditions. 2. Local Government Act Requirements Section 201(1) of the LGA02 requires the Policy to include, in summary form, an explanation of and justification for the way each development contribution in the Schedule to the policy is calculated. In summary, each contribution has been calculated in accordance with the methodology set out in schedule 13 of the LGA02, by using the following seven‐step process.
Step Explanation LGA Reference
One Define catchments. A catchment is the area served by a particular infrastructure,
e.g., reservoirs, pumping stations and pipes. Catchments are defined with reference to characteristics of the
service, the common benefits received across the geographical area supplied and judgement involving a balance between administrative efficiency and the extent of common benefits.
LGA Schedule 13(1)(a)
Two Identify ten‐year capital expenditure resulting from growth. Historic capital expenditure in anticipation of growth. The proportion of total planned costs of capital expenditure for
network and community infrastructure and parks and reserves from the LTCCP resulting from growth.
Growth costs (capacity increase to cater for new entrants) can be funded in full or in part by using development contributions. This is one of three components of the total ten‐year capital costs budgeted in the LTCCP, the other two components being level of service improvements and renewals. These two costs must be met from funding sources other than development contributions.
Justification for the level of growth capital expenditure should be supported by Financial Management funding considerations and show significant assumptions and impacts of uncertainty.
LGA 199(2) LGA 106(2)(a) and Schedule 13(1)(a) LGA 106(2)(a) LGA 101(3)(a) LGA 201(1)(b)
Three Identify the percentage of growth related ten year capital expenditure to be funded by development contributions. 100% of the growth related capital expenditure will be funded by development contributions because: It directly relates to the planned capital expenditure set out in
the LTCCP and detailed in the Council’s Asset Management Plans; and
The capital expenditure identified for growth can be reasonably identified.
LGA 106(2)(b)
Four Identify the appropriate units of demand. The selected unit of demand is the Housing Equivalent Unit (HEU)
LGA Schedule 13(1)(b)

10‐year Plan (2009‐19) 271
Step Explanation LGA Reference
calculated as follows: For green‐field residential development, fees per HEU will be
applied uniformly for each lot regardless of size for reasons of administrative simplicity and because lot size is not considered to have a material impact on demand.
For an infill residential development, a residential dwelling as defined in the District Plan.
Expected minimum non‐residential fees, along with the HEU relationship for various land‐use types, are listed for each network infrastructure type in sections 6 to 11. In some cases however, a case‐by‐case assessment is likely to be required.
A square metre of land (m2) is also used as a unit of demand where the definition of an HEU cannot be easily applied.
Five Identify the designed capacity (in units of demand) provided for growth. The designed capacity may vary between different types of
infrastructure. In some cases it may be considered economically prudent to provide spare growth capacity considerably beyond current ten‐year expectations of growth.
Costs are recovered across the full designed number of HEUs. Projected growth in HEUs over the ten‐year period of the LTCCP will be relevant to the Council’s budgeting of revenue but not to the calculation of the development contribution per HEU.
LGA Schedule 13(1)(b) and (2)
Six Allocate the costs to each unit of demand for growth. The development contribution charge per HEU is calculated by
dividing the total capital expenditure resulting from growth (step two) by the designed units of demand for growth (step five).
LGA Schedule 13(1)(b)
Seven Prepare schedule of fees. A detailed schedule must be prepared as part of the policy that
enables the development contributions to be calculated by infrastructure type and catchment.
The policy will be supported by the significant assumptions made to determine the development contributions payable and their impacts, contribution and conditions and criteria for remission, postponement or refund, the valuation basis for assessment of maximum reserves and catchment maps.
LGA 201(2) LGA 201(1)(a) LGA 201(1)(b),(c) and (d)
3. Significant Assumptions Growth 3.1 Section 201(b) of the LGA02 requires Development Contribution Policies to state the
significant assumptions underlying calculations. Key assumptions include expectations of both residential growth and non residential growth.

272 Waipa District Council
Residential growth assumption 3.2 Population and residential HEU projections for the Policy are taken from a report written by
the University of Waikato Population Studies Centre titled “Population Projections until 2061 for Future Proof – the Hamilton Sub‐Regional Growth Strategy”. The report uses a dwellings‐based methodology to produce small area (Census Area Unit) projections; and explicitly takes into account the development capacity of land in the district.
3.3 Council is using a scenario of medium district growth (taking into account economic
development activities) to underpin the LTCCP. Council considers this a prudent and realistic basis for decision‐making affected by growth.
Table 1: Population and residential HEU growth predictions
Population HEUs
Total Increase % Total Increase %
2009 45,166 ‐ ‐ 16,707 ‐ ‐
2019 53,465 8,299 15.5% 20,305 3,598 17.7%
2024 58,035 12,869 22.2% 22,240 5,533 24.9%
2031 62,414 17,428 28% 24,285 7,578 31%
3.4 A catchment approach is noted in the Policy where relevant to assets. Water and
wastewater catchment percentage increase in demand and growth HEUs have been based on the population and demand growth assumptions used by Council’s engineers in developing the asset management plans (AMPs). These assumptions are based on population growth in the fifteen year period between 2007 and 2021.
The forecast population growth in the AMPs is not inconsistent with the data in the Population Studies Centre report, but not in exact alignment. However, it is preferred as a basis for calculating development contributions as it forms the actual basis for asset planning. As a population basis has been used, HEU conversions have been made using an assumed average of 2.66 persons per household. This average household occupancy rate for the district has been estimated (based on PSC estimates of population and household growth over the 2009‐19 period). With a projected average of 2.70 persons per household in 2009 and 2.63 in 2019, an average over the period of 2.66 is assumed.
Population and HEU projections for 2031 are used to calculate community infrastructure development contributions.
3.5 HEUs for cost recovery for other small or easily definable catchments including Cambridge
North, Ohaupo and Maungakawa are based on estimates of development capacity under the current District Plan zoning.
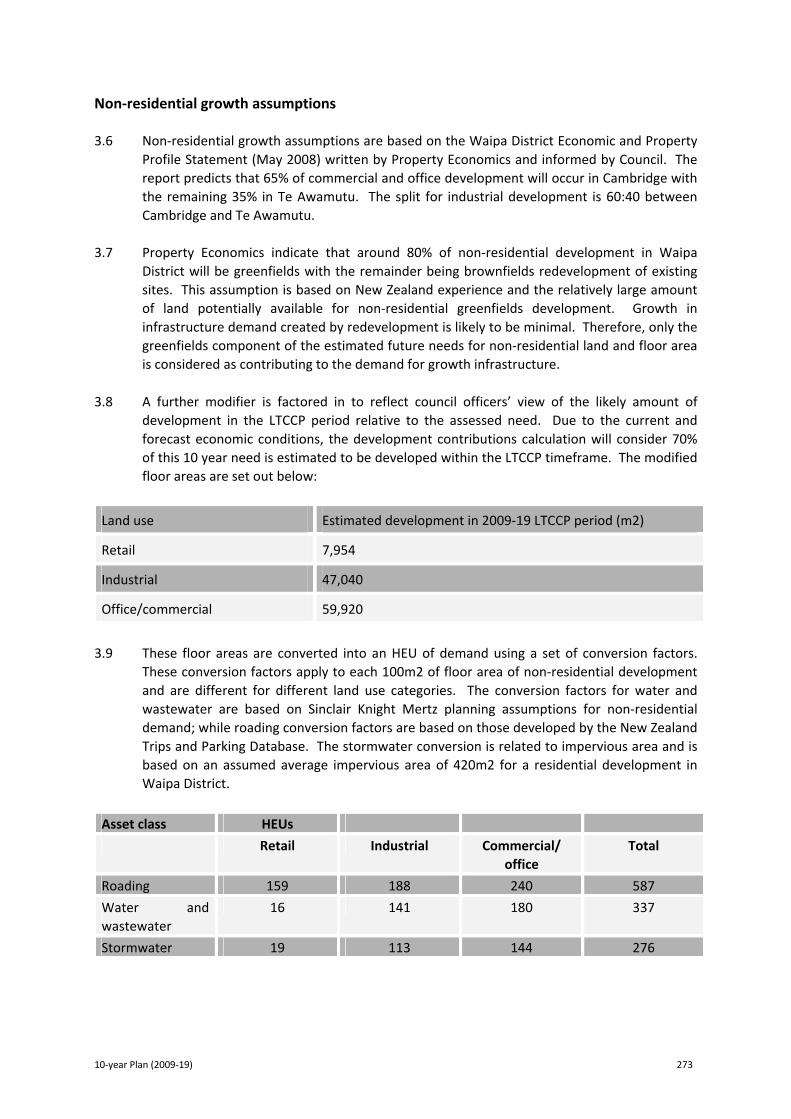
10‐year Plan (2009‐19) 273
Non‐residential growth assumptions 3.6 Non‐residential growth assumptions are based on the Waipa District Economic and Property
Profile Statement (May 2008) written by Property Economics and informed by Council. The report predicts that 65% of commercial and office development will occur in Cambridge with the remaining 35% in Te Awamutu. The split for industrial development is 60:40 between Cambridge and Te Awamutu.
3.7 Property Economics indicate that around 80% of non‐residential development in Waipa
District will be greenfields with the remainder being brownfields redevelopment of existing sites. This assumption is based on New Zealand experience and the relatively large amount of land potentially available for non‐residential greenfields development. Growth in infrastructure demand created by redevelopment is likely to be minimal. Therefore, only the greenfields component of the estimated future needs for non‐residential land and floor area is considered as contributing to the demand for growth infrastructure.
3.8 A further modifier is factored in to reflect council officers’ view of the likely amount of
development in the LTCCP period relative to the assessed need. Due to the current and forecast economic conditions, the development contributions calculation will consider 70% of this 10 year need is estimated to be developed within the LTCCP timeframe. The modified floor areas are set out below:
Land use Estimated development in 2009‐19 LTCCP period (m2)
Retail 7,954
Industrial 47,040
Office/commercial 59,920
3.9 These floor areas are converted into an HEU of demand using a set of conversion factors.
These conversion factors apply to each 100m2 of floor area of non‐residential development and are different for different land use categories. The conversion factors for water and wastewater are based on Sinclair Knight Mertz planning assumptions for non‐residential demand; while roading conversion factors are based on those developed by the New Zealand Trips and Parking Database. The stormwater conversion is related to impervious area and is based on an assumed average impervious area of 420m2 for a residential development in Waipa District.
Asset class HEUs
Retail Industrial Commercial/ office
Total
Roading 159 188 240 587
Water and wastewater
16 141 180 337
Stormwater 19 113 144 276
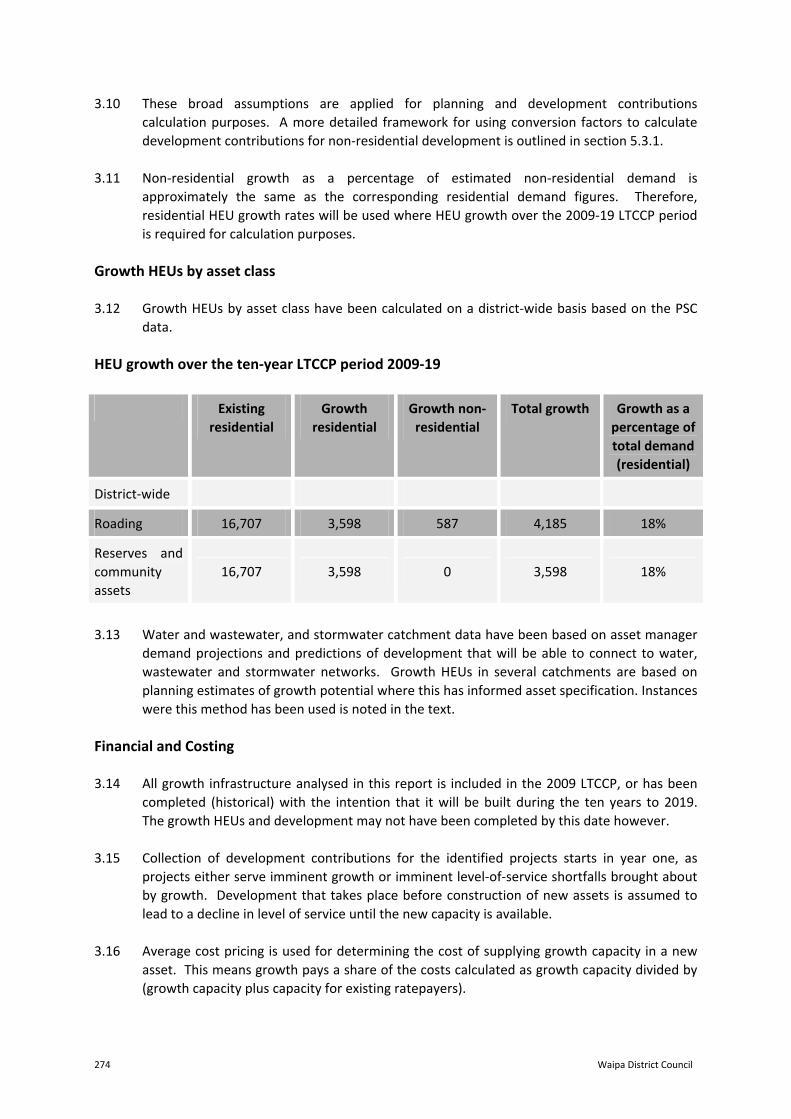
274 Waipa District Council
3.10 These broad assumptions are applied for planning and development contributions calculation purposes. A more detailed framework for using conversion factors to calculate development contributions for non‐residential development is outlined in section 5.3.1.
3.11 Non‐residential growth as a percentage of estimated non‐residential demand is
approximately the same as the corresponding residential demand figures. Therefore, residential HEU growth rates will be used where HEU growth over the 2009‐19 LTCCP period is required for calculation purposes.
Growth HEUs by asset class 3.12 Growth HEUs by asset class have been calculated on a district‐wide basis based on the PSC
data. HEU growth over the ten‐year LTCCP period 2009‐19
Existing residential
Growth residential
Growth non‐residential
Total growth Growth as a percentage of total demand (residential)
District‐wide
Roading 16,707 3,598 587 4,185 18%
Reserves and community assets
16,707 3,598 0 3,598 18%
3.13 Water and wastewater, and stormwater catchment data have been based on asset manager
demand projections and predictions of development that will be able to connect to water, wastewater and stormwater networks. Growth HEUs in several catchments are based on planning estimates of growth potential where this has informed asset specification. Instances were this method has been used is noted in the text.
Financial and Costing 3.14 All growth infrastructure analysed in this report is included in the 2009 LTCCP, or has been
completed (historical) with the intention that it will be built during the ten years to 2019. The growth HEUs and development may not have been completed by this date however.
3.15 Collection of development contributions for the identified projects starts in year one, as
projects either serve imminent growth or imminent level‐of‐service shortfalls brought about by growth. Development that takes place before construction of new assets is assumed to lead to a decline in level of service until the new capacity is available.
3.16 Average cost pricing is used for determining the cost of supplying growth capacity in a new
asset. This means growth pays a share of the costs calculated as growth capacity divided by (growth capacity plus capacity for existing ratepayers).

10‐year Plan (2009‐19) 275
3.17 Growth assumptions have been explicitly considered by asset managers when specifying and costing all new assets.
3.18 In some cases, it is financially prudent and a fair balance between developers and the wider
community interests for council to recover growth related costs over the number of growth units predicted in the ten year planning period. This approach helps manage the significant financial risks faced by Council in creating infrastructure in anticipation of growth.
3.19 Capital expenditure solely for the Hautapu industrial area has been noted in the LTCCP year
4. This expenditure has been identified as having a significant growth component. While cost recovery is expected, it will not be the subject of development contributions. As development is not expected until a plan change makes the land available, there is no risk of missed collection opportunities. At the time of any plan change, council and the developers will negotiate a financial contributions arrangement or development agreement to ensure fair and full recovery of growth costs solely associated with Hautapu industrial area. Growth capital expenditure with a wider catchment of benefit that includes Hautapu is included in this development contributions policy (and will be included in any future policies as additional growth infrastructure is identified) and any development agreement or other charging regime will require payment of relevant development contributions for these assets.
Historic capital expenditure 3.20 Historic capital expenditure has been recognised where there was an explicit assumption in
the previous 2006‐16 LTCCP that growth costs would be recovered from developers for works completed prior to 2006 or works completed 2006/09.
3.21 Historic capital expenditure includes expenditure that has been made prior to the 2009
LTCCP where the project provides capacity to meet the demand created by growth. 3.22 Historic capital expenditure does not include ongoing programmes such as replacement and
improvement programmes where capital expenditure is going forward at similar levels and providing similar benefits.
3.23 Development contributions will be taken against the forward‐looking ten‐year period only to
reflect the ongoing nature of these programmes and to simplify administration and understanding of the development contributions policy.
3.24 New information regarding the growth in the district has meant changes since the 2006‐16
LTCCP in the calculation approach to cost recovery for historic assets. Recovery of growth costs predicted in the LTCCP period will be retained. However, growth HEU predictions have been reviewed to reflect the most up‐to‐date growth assumptions. Recalculated fees will apply to the remainder of the development for which fees against this asset will be taken.
3.25 The costs and benefits of any such adjustment to Council, historic or future developers will
lie where they fall on the basis that Council has used the best available information at the time to inform its development contributions methodology.

276 Waipa District Council
Inflation and GST 3.26 All costs from projects in the ten‐year plan used in the Development Contributions Policy are
based on current estimates of infrastructure construction prices in 2008 dollar terms with inflation of all capital costs over the period using cost inflation factors supplied by BERL. Fees set in 2009 do not change over the period of the LTCCP to reflect inflation. It is assumed that interest received on fees collected in anticipation of construction later in the period will make a partial contribution to offsetting construction cost inflation. No cost of capital, including interest and compensation of Council for taking the risk of building infrastructure in advance of demand, is included in growth cost calculations.
3.27 An alternative methodology would be to calculate the inflation adjusted fee necessary to
deliver the inflation adjusted capital expenditure at the time of construction. This approach would ensure developers pay the same fee in real terms, but Council would still not be fully compensated for its interest costs and investment risks.
3.28 All capital expenditure and development contributions are exclusive of GST (except where
shown to be inclusive). 3.29 Income generated from rates will be sufficient to meet the operating costs of growth related
capital expenditure into the future. 3.30 All New Zealand Transport Agency subsidies will continue at present levels and that eligibility
criteria will remain unchanged. 3.31 The methods of service delivery will remain substantially unchanged. 4. Summary of Charges 4.1 The development contributions payable for each unit of demand on granting a resource
consent (either a landuse consent or a subdivision consent), a building consent or an authorisation for a service connection are set out in the tables below.
All catchments (except Bond Road Industrial) 4.2 The unit of demand used for each activity is the Household Equivalent Unit (HEU). An HEU
represents one household unit. 4.3 Residential developments will be assessed on the number of additional household units (or
allotments) created by the development. 4.4 A minor household unit shall be assessed at 0.5 of an HEU per additional household created
by the development. 4.5 Non‐residential developments will be assessed on the basis of additional HEUs created, and
will not pay a development contribution for community infrastructure or parks and reserves. 4.6 Development contributions will not be payable for normal residential extensions or
alterations to existing dwellings, unless these create an additional household unit; or alter a feature that was used to claim an earlier reduction.

10‐year Plan (2009‐19) 277
Fee summary per HEU by catchment* (GST inclusive)
Catchment Roading and
Transport
Water Supply
Wastewater Stormwater Community Infrastructure
Parks and Reserves
Total
incl GST
Te Awamutu
$10,118 $3,156 $2,855 $1,243 $3,158 $2,670 $23,200
Kihikihi $10,118 $1,054 $6,648 $1,243 $3,158 $2,670 $24,891
Picquet Hill
$11,052 $8,372 $6,609 $1,243 $3,158 $2,670 $33,104
Pirongia $10,118 $3,156 ‐ $1,243 $3,158 $2,670 $20,345
Cambridge/
Karapiro
$10,118 $7,579 $2,323 $1,402 $3,158 $2,670 $27,250
Cambridge North
$18,579
$8,373
$5,740
$7,786
$3,158
$2,670
$46,306
Rural $10,118 ‐ ‐ ‐ $3,158 $2,670 $15,946
*Maps showing the catchments are contained in Section 12 of the DCP. Note: Roading & Transport, Community Infrastructure, and Parks &
Reserves are not shown specifically on the catchment maps, however the relevant catchment area applies.
Bond Road Industrial Catchment Fee summary per m² by catchment (GST inclusive)
Catchment Roading
and
Transport
Water
Supply
Wastewater Stormwater Community
Infrastructure
Parks and
Reserves
Total
incl GST
Bond Road $12.07 $5.74 $4.97 $2.87 ‐ ‐ $25.65
4.7 The development contribution for the Bond Road Industrial catchment will be calculated
based on the square metre (m²) site area on granting a resource consent (either a subdivision or a landuse consent), a building consent, or an authorisation for a service connection.
4.8 For the purposes of the Bond Road Industrial catchment, the site area is considered to be the
certificate of title area. Should a developer propose to develop only a portion of the certificate of title area; the developer will be required to provide to Council a detailed plan showing how many m² is required to service the development.

278 Waipa District Council
The plan must also show how the entire certificate of title area will be fully developed in accordance with the appropriate subdivision and zone standards of the operative Waipa District Plan 1997. The purpose of this is to ensure that a contribution is collected for every m² of the certificate of title area, to enable the costs involved in servicing the area to be evenly distributed over the total area.
4.9 All land in the Bond Road Industrial catchment, regardless of its purpose is subject to the m²
development contribution requirement. 5. Substantive Policy 5.1 Definitions Activity means a good or service provided by the Council (as per section 5 of the Local Government Act 2002), and for which development contributions are normally collected. Allotment means an allotment as defined by section 218 of the Resource Management Act 1991. Authorised Officer means an officer authorised in accordance with the delegations register to carry out functions under this Policy. Catchment means an area of the District that is subject to development contributions as identified in this Policy; and includes any future development which extends such catchment areas. Any area in the Waipa District which is not specifically shown to be within a catchment (i.e. Te Awamutu or Cambridge) shall be deemed to be in the rural catchment (unless the property has any connection (i.e. water) to another catchment; then it shall be deemed to be within that catchment). Commercial means a non‐residential development using land or buildings for the provision of services in the course of a trade or business. Community Facilities means parks and reserves, network infrastructure, or community infrastructure for which development contributions may be required. Community Infrastructure means:
a) land, or development assets on land, owned or controlled by Council to provide public amenities; and
b) includes land that Council will acquire for that purpose. Development means:
a) any subdivision or other development that generates a demand for parks and reserves, network infrastructure, or community infrastructure; but
b) does not include the pipes or lines of a network utility operator. Development Agreement means any private agreement signed between a developer and Waipa District Council. District Plan means the Operative Waipa District Plan including any proposed plan or variation. GFA means Gross Floor Area.

10‐year Plan (2009‐19) 279
Gross Floor Area in terms of buildings means the total area of all the floors of all buildings on a site, excluding mechanical service equipment areas, and external stairways and balconies. GFA for the purpose of impervious area calculations for non‐residential developments means all impermeable surfaces of the site. Health and Community Services – means medical services (e.g. doctors, optometrists, hospitals, emergency services), veterinary services, dental services, childcare services, community care services (excludes accommodation) and education services. Household unit means a building or part of a building capable of being used as an independent residence and includes dwelling apartments, semi‐detached or detached houses, units, town houses, granny flats (or similar), and caravans (where used as a place of residence or occupied for a period of time exceeding six months in a calendar year). For the avoidance of doubt the following shall also apply:
▪ Any dwelling which has two separate kitchen facilities of any nature, shall be deemed to be two household units regardless of the configuration of the dwelling;
▪ A sleepout is considered to be one room and a toilet only, anything in addition to this will considered to be a household unit.
HEU means “Household Equivalent Unit”, which is a unit of demand representing one average household unit. Industrial means a non‐residential development using land or buildings where people use material and physical effort in the course of a trade or business to:
▪ extract or convert natural resources ▪ produce good or energy from natural or converted resources ▪ repair goods
Impermeable Surface means a surface which is not capable of being entirely permeated by rainwater at a rate that avoids ponding or runoff; and includes pavious, gobi‐blocks, grasscrete, gravel or metalled driveways or hard surfaced materials and other similar materials. LGA and LGA02 means the Local Government Act 2002. Minor Household Unit means a household unit not exceeding 70m² in Gross Floor Area, provided that garaging and open deck areas are not included in the 70m² GFA calculation. Network Infrastructure means the provision of roads and other transport, water, wastewater and stormwater collection and management. Non‐residential development means any development that is not for residential purposes. Residential development means a use of land and buildings by people for the purpose of permanent living accommodation in a household unit where the majority of occupiers intend to live at the site for a period of one month or more of continuous occupation per annum and will generally refer to the site as their home and permanent address. It includes accessory buildings and leisure activities associated with needs generated principally from living on the site.
280 Waipa District Council
Residential Services means residential care facilities e.g. aged care homes, retirement homes. Retail means a non‐residential development which uses land, a building, or parts of a building for the display and/or sale of goods, or the offer of goods for hire. It also includes a wholesale development. Rural in relation to ‘catchment’ means any area in Waipa District which is not specifically shown to be in any of the other defined catchments. Vehicle Movements for the purposes of calculating non residential demand means that one vehicle visiting equals two vehicle movements. Visitor Accommodation means land or buildings which are offered for temporary accommodation of persons and includes bed and breakfast establishments, backpackers' accommodation, home stay facilities, motels, hotels, tourist lodges, holiday flats, tourist cabins, motor inns and ancillary workrooms, reception areas and accessory buildings or ancillary activities on the site. This definition does not include activities defined in this Policy as dwellings or residential activities. Warehousing means storage of goods/property. 5.2 Requirement for Development Contributions 5.2.1 Development contributions shall be required for the following activities:
Roading and Transport Water supply Wastewater Stormwater Community Infrastructure Parks and reserves
5.2.2 Development contributions shall be required in money unless, at the sole discretion of an
authorised officer, a piece of land is offered by the developer that would adequately suit the purposes for which the contribution is sought.
5.2.3 Where Council accepts, at its sole discretion, a developer's offer to provide network
infrastructure or community infrastructure in lieu of paying a development contribution, the parties will need to enter into a development agreement in accordance with paragraph 5.7.2.
5.3 Assessment of Development Contributions Non Residential Development 5.3.1 Where the level of demand is known for a non‐residential development, the number of HEUs
generated by the development will be determined by reference to the following table (which sets out the average level of demand per HEU).

10‐year Plan (2009‐19) 281
Activity Units of Demand – Residential
Units of Demand – Non‐Residential HEUs
Roading and Transport
10 vehicle movements per day.
Note: 1 vehicle visiting = 2 vehicle movements
Retail – 2.0 HEU / 100m2 GFA
Warehousing – 0.13 HEU / 100m2 GFA
Commercial/Industrial/Health and community services
GFA – 0.41 HEU / 100m2 GFA
Visitor accommodation and residential services – 0.29 HEU / 100m2 GFA
Water Supply 1.9418 m3 per day Retail – 0.2 HEU / 100m2 GFA
Commercial / industrial / warehousing / health and community service – 0.3 HEU / 100m2 GFA
Visitor accommodation – 0.5 HEU / 100m2 GFA
Residential services – 0.7 HEU / 100m2 GFA
Wastewater 1.359 m3 per day Retail – 0.2 HEU / 100m2 GFA
Commercial / industrial / warehousing / health and community service – 0.3 HEU / 100m2 GFA
Visitor accommodation – 0.5 HEU / 100m2 GFA
Residential services – 0.7 HEU / 100m2 GFA
Stormwater 60% impervious area (assumes 420m2 of impervious area from an average 700m2 residential allotment)
0.24 HEU / 100m2 impervious surface area.
5.3.2 Where the level of demand is unknown, of relatively large scale, or where a case‐by‐case
assessment is required, Council may require the developer to provide a special assessment of the units of demand in accordance with Section 5.7 of this Policy. Developers may also elect, at their own cost, to provide a special assessment.
5.3.3 Any water connection from the main into the development greater than 20mm will trigger a
special assessment of water and wastewater demand.

282 Waipa District Council
5.3.4 In calculating development contributions for non‐residential development, a minimum of 1 HEU for each relevant activity will be charged for all development that is not an extension of an existing building. In the case of extensions, development contributions calculated at less than 1 HEU may be charged. In the case of developments at Bond Road Industrial, charging is based on site area and no minimum is applied.
5.3.5 Non‐residential development will not pay a development contribution for Community
Infrastructure or Parks and reserves. 5.3.6 The Bond Road Industrial catchment will be assessed on the per m² rate as per section 4.7‐
4.9 of this Policy. Residential Development Note: Refer also to sections 4, 5.4 , 5.5, and 5.7. 5.3.7 Residential developments will be assessed on the number of additional household units (or
allotments) created by the development. 5.3.8 A minor household unit shall be assessed at 0.5 of an HEU per additional household created
by the development. 5.3.9 In relation to development at Cambridge North and Picquet Hill, Council may undertake a
special assessment of the units of demand in accordance with Section 5.7 of this Policy. The special assessment is to ensure that development in these two areas proceeds in line with the demand assumptions on which the design capacity of the infrastructure is based, or that, if not; Council is reimbursed for capital expenditure incurred on the basis of those demand assumptions. The demand assumptions are based on a yield of 10 lots per hectare of gross land area. Developers may also elect, at their own cost, to provide a special assessment.
Cross Boundary Issues 5.3.10 In some cases, developments may fall within one or more catchments or District Council
boundaries. The total units of demand will be assessed separately for each catchment. The development contribution will then be calculated using the appropriate development contribution per unit of demand for each development contribution area. The total development contribution is the sum of the development contribution for each area.
Where the development crosses District Council boundaries, the Council will only assess the development for that part of the development which is within the Waipa District.
5.4 Timing of Assessments, Payment and Enforcement 5.4.1 The Council has the power to require a development contribution to be made under Section
198 LGA02 when:
A resource consent is granted under the Resource Management Act 1991; A building consent is uplifted under the Building Act 2004; An authorisation for a service connection is granted.

10‐year Plan (2009‐19) 283
Assessment 5.4.2 Development contributions will be required and will be subject to an initial assessment on all
applications for building consent, landuse (resource) consent, subdivision (resource) consent and service connection.
5.4.3 The assessment will be made against the first consent application lodged for the
development, and will be made on every subsequent consent application. The reassessment will take account of the number of units of demand previously assessed and determine whether the development still generates the same number of units of demand. This will ensure that the final development is neither over‐charged or under‐charged.
5.4.4 A reassessment may be made on each and every event described above in sections 5.4.1 and 5.3.2.
5.4.5 Where development contribution notices have been issued in respect of developments prior
to 1 July 2009, these contributions will continue to be assessed on the basis of the 2006 Policy. The contributions set in the 2006 Policy have been adjusted by the Producer Price Index for Construction (PPI) with a base of 1305 at 31 March 2006. At 31 March 2009 the PPI was at 1489, an increase of 14.1%.
5.4.6 The contributions will continue to be adjusted at each reassessment in line with the change
in the PPI from 31 March 2006 to the most recent March quarter at the time of the reassessment.
Payment and Enforcement Powers 5.4.7 Subject to paragraph 5.4.9 an applicant may pay the development contribution within 12
months of the date of each assessment. 5.4.8 If payment is not received in accordance with paragraph 5.4.9 the Council may, at its
discretion, review its assessment. 5.4.9 The development contribution must be paid as follows:
Subdivision consent Prior to the issue of Section 224(c) certificate; Landuse consent Prior to the commencement of the consent; Building consent Prior to the uplifting of the Building Consent; Service connection Prior to connection.
5.4.10 If payment of development contribution is not received Council will exercise its powers
outlined in Section 208 LGA02. Those provisions state that until a development contribution required in relation to a development has been paid or made under section 198, Council may:
5.4.10.1 In the case of a subdivision consent, withhold the section 224(c) certificate.
284 Waipa District Council
5.4.10.2 In the case of any other resource consent, prevent the commencement of the resource consent.
5.4.10.3 In the case of a building consent, withhold the code compliance certificate. 5.4.10.4 In the case of a service connection, withhold the service connection. 5.4.10.5 In each case, register the outstanding development contribution as a charge on the
subject land under the Statutory Charges Registration Act 1928. 5.5 Credits 5.5.1 Where development contributions for an activity on a property have previously been paid,
credit to that amount will be given for the particular activity. For the calculation of these credits there is no historical time limit and all previous credits will be taken into account.
5.5.2 Credits towards the development contribution assessment include both 'historical credits'
and 'actual credits'. Credits are expressed in units of demand and may be used to reduce the number of units of demand created by a development.
5.5.3 Credits can only be used for developments on the same site and for the same activity; except
by a development agreement under paragraph 5.7.2, and cannot be used to reduce the number of units of demand to less than zero.
Historical Credits 5.5.4 Historical credits are used where the current development of the site does not result in an
increase in the units of demand having regard to the prior use of the site.
Historical credits will generally apply in the following circumstances:
Where a Household unit was removed less than five years before the new consent application was lodged.
Non‐residential historical credits shall be granted on the basis of the gross floor area of the existing development and/or specific use (i.e. m³ of water);
For existing non‐residential buildings that are extended or demolished and re‐built to the same or higher intensity; the assessment of credits will be based only on the existing development prior to rebuilding.
Credits will not be granted for any infrastructure and/or services provided in excess of that required as a condition of any consents issued by Council.
5.5.5 The prior use of the site must have been lawfully established. It is the responsibility of the
applicant to provide sufficient proof to Council to establish this, such as a certificate of existing use (pursuant to the Resource Management Act 1991).
5.5.6 Existing vacant allotments as at 1 January 2006 are deemed to have an historical credit of
one HEU. Actual Credits 5.5.7 Actual credits are used where development contributions or financial contributions for a
particular property have previously been paid or assessed at any time in relation to the same site and for the same activity.

10‐year Plan (2009‐19) 285
5.6 Remissions, Refunds, Postponements Remissions 5.6.1 At the request of an applicant, the development contributions required on a development
may be considered for remission at Council's discretion on a case by case basis. 5.6.2 Any such request shall be made in writing by the applicant 15 working days after Council has
advised the applicant in writing of the amount of development contribution required on the development. The application must be made before any development contribution is paid, as the Council will not consider a retrospective application for remission.
5.6.3 In undertaking the review the Council shall as soon as reasonably practicable consider the
request. The Council may determine whether to hold a meeting for the purposes of the review, and if so, give the applicant at least five working days notice of the date, time and place of that hearing.
5.6.4 Council may, at its discretion, uphold, reduce or cancel the original amount of development
contribution required on the development. The Council may delegate this decision to an authorised officer.
5.6.5 Where Council decides to consider such a request the following matters shall be taken into
account:
a) The Development Contribution Policy. b) Council's financial modelling. c) Council's funding and financial policy. d) The extent to which the value and nature of the works proposed by the applicant
reduces the need for works proposed by Council in its capital works programme. e) The level of existing development on the site. f) Whether Council determines that the development contributions are manifestly
excessive in relation to:
the scale of the development; the value of the development; the viability of the development; the impact of the development on infrastructure; whether the development supports Council's wider objectives; and any other matter Council considers to be relevant.
5.6.6 An application for remission will need to be justified by the applicant. 5.6.7 For the avoidance of doubt, Council will not generally grant remissions due to the following
circumstances:
Additional dwellings that are located near the boundaries of other Territorial Authorities;
Dwellings which are able to be relocated more readily than others; Developments only on the basis that the applicant is a not‐for‐profit, or community
group/organisation. The appropriate mechanism in this case is to apply for Council

286 Waipa District Council
Grants (if applicable), or make submissions to Council as part of the Annual Plan process.
5.6.8 As a matter of Council Policy, all decisions delegated to staff by Council are able to be
objected to and heard by Council’s elected representatives (the Regulatory Committee). Refunds 5.6.9 Sections 209 and 210 of the LGA02 apply to refunds of development contributions paid to
Council, where:
Resource consents lapse or are surrendered; or Building consents lapse; or The development or building does not proceed; or The Council does not spend the money on the purpose for which the development
contribution was required; or Previous overpayment has been made (for whatever reason).
5.6.10 The development contribution will be refunded to the registered proprietors of the subject
allotment as at the date of the refund assessment (less a fair and reasonable administration fee).
Postponements 5.6.11 Council will not consider any request to postpone a development contribution. 5.7 Special Assessments and Development Agreements 5.7.1 In relation to section 5.3.2, or where a proposed development clearly has a significantly
greater impact than is envisaged in the averaging implicit in Council’s development contributions model, Council reserves its discretion to undertake, or require a developer to provide a 'special assessment'. The applicant will be required to provide supporting information and detailed calculations of their development’s units of demand on various activities.
5.7.2 In relation to section 5.3.8 where proposed development in Cambridge North or Picquet Hill
is proceeding in a manner such that the demand assumptions on which the design capacity of the infrastructure is based are not valid (in particular in relation to the average number of lots developed per hectare of gross land area); Council reserves its discretion to undertake a ‘special assessment’. For the avoidance of doubt such a special assessment could result in a change in the way in which the units of demand are calculated from the actual number of HEU’s to a theoretical number of HEU’s based on the gross land area of the development. This is to ensure that the development undertaken in Cambridge North and Picquet Hill funds the cost of the growth infrastructure, regardless of the density of development.
5.7.3 Where it is in the best interests of all parties, Council may enter into a development
agreement with the developer. The development agreement must clearly state the departure from the standard processes and calculations, and the reasons for these differences where such differences exist.

10‐year Plan (2009‐19) 287
5.7.4 In respect to St Kilda Waterways Residential Zone, development contributions will be agreed as part of the Development Agreement required to be agreed between Council and the developer prior to the issue of any subdivision consent or landuse development.
5.8 Valuations 5.8.1 Where land is required to be valued, the assessment of land value will be carried out by a
registered valuer based on the market value of the land being developed:
In its 'developed' state (which includes the proposed development and any other development authorised by resource or building consents);
As assessed not more than 12 months before the contribution is paid; and Including GST.
5.9 Guarantees 5.9.1 An applicant may request that Council accept a guarantee for development contributions in
excess of $50,000. This request will be considered at the discretion of an authorised officer. 5.9.2 Guarantees:
5.9.2.1 Will only be accepted from a registered trading bank. 5.9.2.2 Shall be for a maximum period of 24 months, subject to later extensions as
may be agreed by an authorised officer. 5.9.2.3 Will have an interest component added, at an interest rate of 2% per annum
above the Reserve Bank official cash rate on the day the guarantee document is prepared. The guaranteed sum will include interest, calculated on the basis of the maximum term set out in the guarantee document.
5.9.2.4 Shall be based on the GST inclusive amount of the contribution. 5.9.3 At the end of the term of the guarantee, the development contribution (together with
interest) is payable immediately to Council. 5.9.4 If Council accepts the guarantee, all costs for the preparation of the guarantee documents
will be met by the applicant. 5.10 Goods and Services Tax 5.10.1 All assessments are inclusive of GST and do not constitute an invoice for the purposes of the
Goods and Services Tax Act 1985. 5.10.2 The time of supply shall be the earlier of:
a) Council issuing an invoice to the developer; or b) the payment of the development contribution in accordance with this policy
(including the execution of a guarantee in accordance with this policy). 5.10.3 GST will be added to the invoice at the time of supply as required by the Goods and Services
Tax Act 1985.
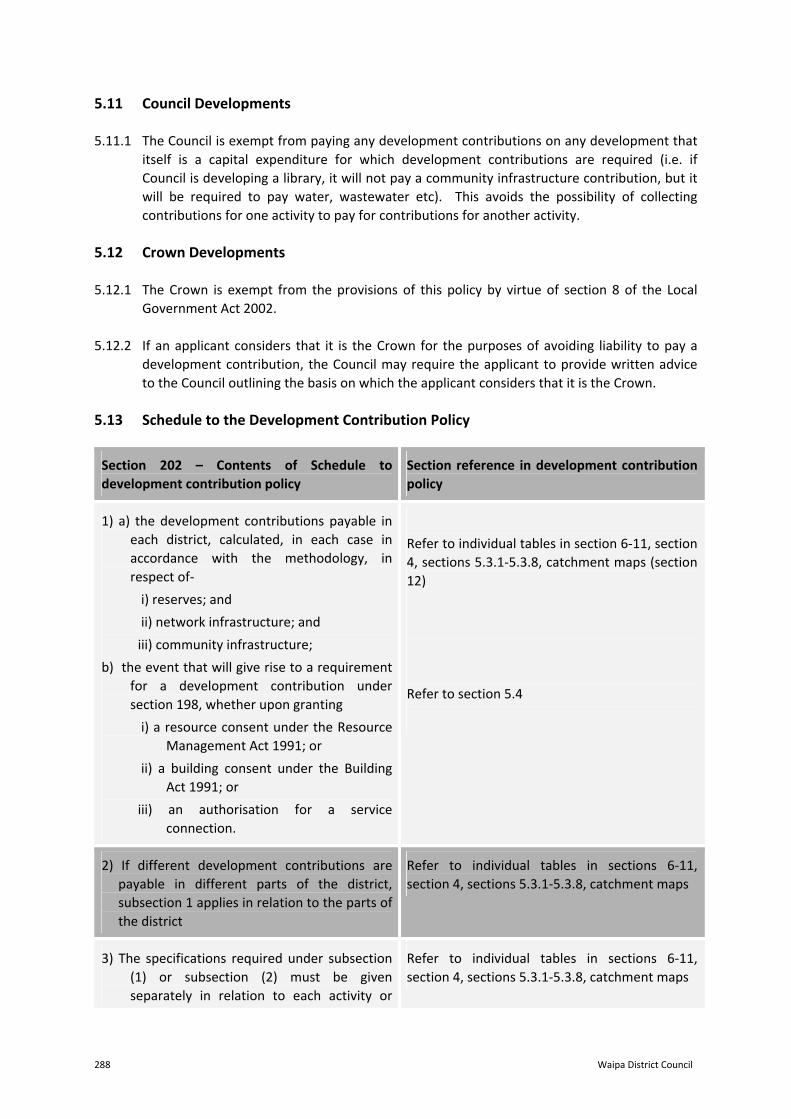
288 Waipa District Council
5.11 Council Developments 5.11.1 The Council is exempt from paying any development contributions on any development that
itself is a capital expenditure for which development contributions are required (i.e. if Council is developing a library, it will not pay a community infrastructure contribution, but it will be required to pay water, wastewater etc). This avoids the possibility of collecting contributions for one activity to pay for contributions for another activity.
5.12 Crown Developments 5.12.1 The Crown is exempt from the provisions of this policy by virtue of section 8 of the Local
Government Act 2002. 5.12.2 If an applicant considers that it is the Crown for the purposes of avoiding liability to pay a
development contribution, the Council may require the applicant to provide written advice to the Council outlining the basis on which the applicant considers that it is the Crown.
5.13 Schedule to the Development Contribution Policy
Section 202 – Contents of Schedule to development contribution policy
Section reference in development contribution policy
1) a) the development contributions payable in each district, calculated, in each case in accordance with the methodology, in respect of‐
i) reserves; and
ii) network infrastructure; and
iii) community infrastructure;
b) the event that will give rise to a requirement for a development contribution under section 198, whether upon granting
i) a resource consent under the Resource Management Act 1991; or
ii) a building consent under the Building Act 1991; or
iii) an authorisation for a service connection.
Refer to individual tables in section 6‐11, section 4, sections 5.3.1‐5.3.8, catchment maps (section 12)
Refer to section 5.4
2) If different development contributions are payable in different parts of the district, subsection 1 applies in relation to the parts of the district
Refer to individual tables in sections 6‐11, section 4, sections 5.3.1‐5.3.8, catchment maps
3) The specifications required under subsection (1) or subsection (2) must be given separately in relation to each activity or
Refer to individual tables in sections 6‐11, section 4, sections 5.3.1‐5.3.8, catchment maps

10‐year Plan (2009‐19) 289
group of activities for which separate development contributions are required.
6. Methodology – Roading and Transport
The development contributions calculation methodology is set out in detail in the development contributions methodology and calculation paper. This paper is available from the Council by request. Roading and transport catchment definition and asset management assumptions
6.1 Roading and transport capital expenditure is considered to largely provide a network benefit
across the district. A single district‐wide catchment is used for determination of district‐wide development contributions with three sub‐catchments (Cambridge North, Picquet Hill and Bond Road) used to determine development contributions where benefit accrues solely to a specific area. It is expected that roading and transport expenditure particularly benefiting specific development areas to be developed by single developers will be subject to case‐by‐case negotiations between Council and developer(s) using Council’s financial contributions policy under the Resource Management Act.
Total roading and transport capital expenditure resulting from growth
6.2 Council asset manager’s review of asset management plans indicates that of the
$167,319,452 total historic and future capital expenditure (net of New Zealand Transport Agency subsidies), $52,224,358 is estimated to provide additional design capacity for future growth as discussed below.
Roading and transport capital expenditure already incurred in anticipation of growth
6.3 Historic capital expenditure resulting in assets designed with additional capacity for future
growth includes the Cambridge CBD upgrade circa 2002 providing design capacity for approximately 15‐years growth (2,994 additional HEUs), other growth expenditure on the roading network, and ongoing roading works in Cambridge North. The Cambridge CBD upgrade growth costs will continue to be recovered district‐wide from the 2,994 roading growth HEUs identified in the 2006 Policy for reasons of financial prudence. The remainder of the roading network growth expenditure will be recovered from the roading growth HEUs identified in the 2009 Policy. The remainder of the Cambridge North growth expenditure will be recovered from growth in Cambridge North.
6.4 Roading capital expenditure has also been provided for three small specific catchments in
Ohaupo, recovered using financial contributions.

290 Waipa District Council
Development contribution fee area
Total historic capital
expenditure
Growth capital expenditure component
Design capacity (in HEUs) provided in
growth capital expenditure
Fee per HEU (ex GST)
District Wide (Cambridge CBD upgrade)
$4,800,177 $864,032 2,994 $289
District Wide (other roading network)
$659,580 $191,046 4,185 $46
Cambridge North $2,583,175 $2,583,175 1,351 $1,912
Total District‐wide $8,042,932 $3,638,253 ‐ ‐
Total roading and transport capital expenditure in 10‐year Plan and portion resulting from growth
6.5 Council 10 year roading capital expenditure in the 2009‐19 LTCCP totals $134,826,104 net of New Zealand Transport Agency subsidies. Asset managers assess that of the total costs net of subsidy, $45,852,211 is to service future growth.
Development contribution fee area
LTCCP total Capital
expenditure
Growth Capital expenditure component
Design capacity (in HEUs)
provided for in growth capital expenditure
Fee per HEU (ex GST)
District wide LTCCP $121,676,852 $36,217,017 4,185 $8,659
Cambridge North $10,525,152 $7,798,324 1,351 $5,772
Picquet Hill $482,800 $337,960 407 $830
Hautapu industrial area (recovered with financial contributions
‐ ‐
Bond Road $2,141,300 $1,498,910 195,000m2 $7.69/m2
Total $134,826,104 $45,852,211 ‐ ‐
Growth capital expenditure and fee amounts do not necessarily compute against the total capital expenditure as growth capital expenditure for the Hautapu Interchange is to be recovered from three distinct catchments using different calculations: district‐wide, Cambridge North and the Hautapu industrial area.

10‐year Plan (2009‐19) 291
Percentage of roading and transport growth capital expenditure to be funded by development contributions
6.6 100% of the growth related capital expenditure already incurred in anticipation of growth, or
planned in the LTCCP over the next ten years, is to be recovered from development contributions.
Identification of Roading and Transport units of demand
6.7 An HEU is assumed to represent 10 traffic movements per day. All residential lots of any size
are assumed to be equivalent to 1 HEU except where a special assessment is required as per section 5.7.2. Non‐residential development
6.8 Refer to section 5.3.1 non‐residential conversion factors based on New Zealand Trips and
Parking Database trip generation guidelines (which has been verified by comparison with trip generation data from recent non‐residential development in the District). Where a special assessment of demand is provided or required, total trip generation for the development will be divided by 10 to give a number of HEUs for the purpose of fee calculation.
Identification of the roading and transport design capacity (in units of demand) provided for growth
6.9 Council asset managers estimate the LTCCP capital expenditure will support increased
demand on roading and transport systems arising from the 4,185 expected residential and non‐residential HEU growth over the ten‐year LTCCP period 2009‐19.
Allocation of Roading and Transport costs to each unit of demand and schedule of fees
6.10 For the district wide catchment, allocation of the historic and total 10‐year growth capital
expenditure in the LTCCP creates the total fees set out in the table below. 6.11 Each separately habitable or tenantable residential unit of any size is liable to pay the sum of
the relevant roading development contributions fees.
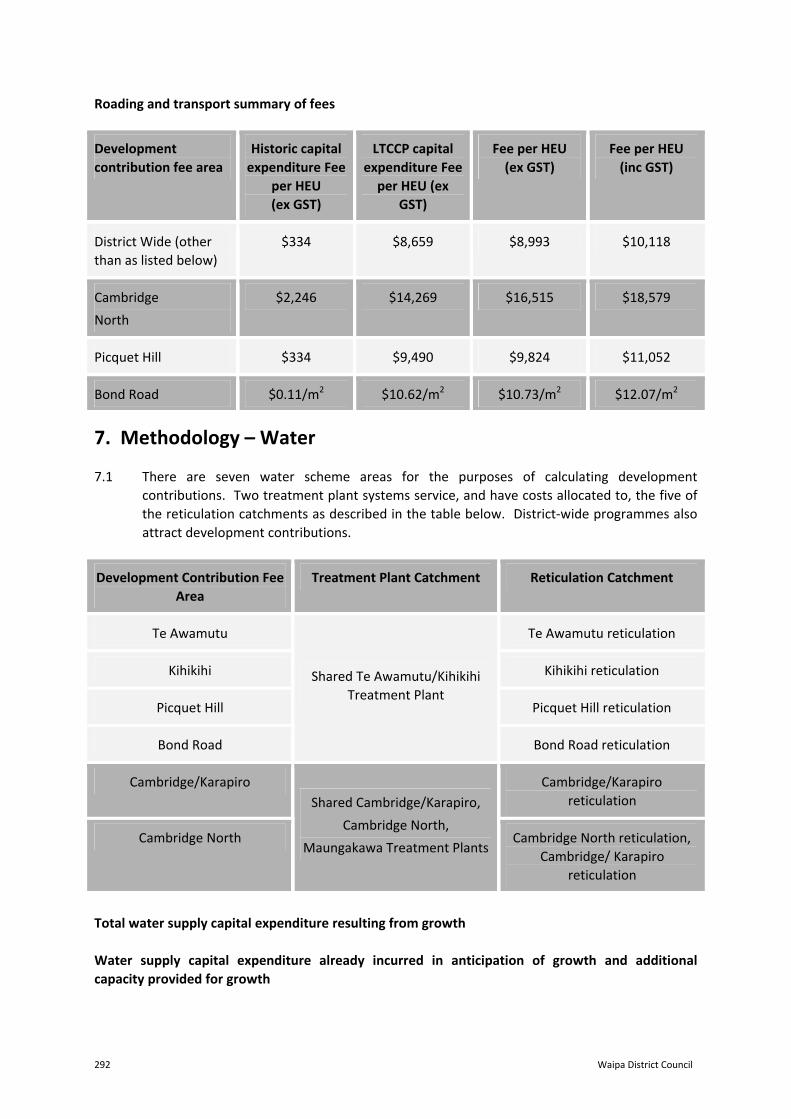
292 Waipa District Council
Roading and transport summary of fees
Development contribution fee area
Historic capital expenditure Fee
per HEU (ex GST)
LTCCP capital expenditure Fee per HEU (ex
GST)
Fee per HEU (ex GST)
Fee per HEU (inc GST)
District Wide (other than as listed below)
$334 $8,659 $8,993 $10,118
Cambridge
North
$2,246 $14,269 $16,515 $18,579
Picquet Hill $334 $9,490 $9,824 $11,052
Bond Road $0.11/m2 $10.62/m2 $10.73/m2 $12.07/m2
7. Methodology – Water 7.1 There are seven water scheme areas for the purposes of calculating development
contributions. Two treatment plant systems service, and have costs allocated to, the five of the reticulation catchments as described in the table below. District‐wide programmes also attract development contributions.
Development Contribution Fee Area
Treatment Plant Catchment Reticulation Catchment
Te Awamutu Te Awamutu reticulation
Kihikihi Kihikihi reticulation
Picquet Hill Picquet Hill reticulation
Bond Road
Shared Te Awamutu/Kihikihi Treatment Plant
Bond Road reticulation
Cambridge/Karapiro Cambridge/Karapiro reticulation
Cambridge North
Shared Cambridge/Karapiro,
Cambridge North,
Maungakawa Treatment Plants Cambridge North reticulation,
Cambridge/ Karapiro reticulation
Total water supply capital expenditure resulting from growth Water supply capital expenditure already incurred in anticipation of growth and additional capacity provided for growth

10‐year Plan (2009‐19) 293
7.2 Historic capital expenditure resulting in assets designed with additional capacity in anticipation of future growth totals $2,643,021. Of this total $2,030,021 is estimated to provide for future capacity.
Water supply treatment plants 7.3 Recent historic capital expenditure incurred in anticipation of growth for the Cambridge /
Cambridge North / Karapiro / Maungakawa Treatment Plant is now close to capacity. Development contributions for this expenditure have been ceased but development contributions will be taken for the future treatment plant upgrade and associated works identified in the 2009‐19 LTCCP.
Catchment Historic total capital
expenditure
Historic capital expenditure for
growth
HEUs Fee per HEU (ex GST)
Kihikihi reticulation $345,000 $207,000 300 $690
Cambridge North reticulation $195,021 $195,021 1,351 $144
Cambridge / Karapiro reticulation $950,000 $475,000 1,545 $307
Te Awamutu / Kihikihi source works and treatment plant $1,053,000 $1,053,000 1,112 $947
Te Awamutu reticulation $100,000 $100,000 894 $112
Ohaupo (to be recovered using financial contributions) ‐ ‐ ‐ ‐
Total $2,643,021 $2,030,021 ‐ ‐
Total water supply capital expenditure in the LTCCP and additional HEU capacity provided for growth 7.4 Ten‐year capital expenditure in the 2009‐19 LTCCP totals $26,948,100 for the district’s two
water supply treatment plant systems and seven reticulation catchments. Of this total capital expenditure, $16,088,110 is estimated to provide additional capacity in anticipation of growth as follows:

294 Waipa District Council
LTCCP total capital
expenditure
LTCCP capital expenditure for
growth
HEUs Fee per HEU (ex GST)
Treatment Plants
Te Awamutu / Kihikihi source works and treatment plant
$330,000 $330,000 1,112 $297
Cambridge, Cambridge North , Karapiro, Maungakawa Treatment Plant system
$3,917,100 $3,917,100 1,545 $2,535
Reticulation catchments
Te Awamutu reticulation
$1,511,000 $1,075,400 894 $1,203
Picquet Hill $2,422,000 $2,422,000 407 $5,951
Bond Road $978,400 $978,400 195,000m² $5.02/m²
Cambridge / Karapiro $7,318,300 $5,635,250 1,545 $3,647
Cambridge North $758,700 $758,700 1,351 $562
District wide $9,712,600 $971,260 3,935 $247
Hautapu (to be recovered using financial contributions)
‐ ‐
Pukerimu (to be recovered through connection fee/capital contribution)
‐ ‐
Total $26,948,100 $16,088,110
Percentage of water supply growth capital expenditure to be funded by development contributions 7.5 100% of the growth related water supply capital expenditure either already invested in
anticipation of growth, or expected to be invested through the 10‐year LTCCP period, is to be recovered from development contributions.

10‐year Plan (2009‐19) 295
Identification of water supply units of demand 7.6 Each HEU is assumed to consume the observed Waipa average household water
consumption of 1.9418 m3 per day. Residential HEUs of any size will pay a fee set on the basis of this average except where a special assessment is required as per section 5.7.2.
7.7 Development contributions fees for district‐wide water replacement programmes and some
Te Awamutu reticulation expenditure are recovered from the predicted growth in the catchment area over the ten year LTCCP period 2009‐19.
7.8 Development contributions for water are only charged where the development is able to
connect to a Council operated water supply network. Non‐residential development 7.9 Non‐residential developments will pay according to the factors based on land‐use per 100m²
GFA set out in section 5.3.1. Water supply input to schedule of fees 7.10 The table below shows the total water supply fee per HEU for each catchment consisting of
fees for both treatment plants and reticulation. Water supply – summary of fees
Historic fee – Treatment and reticulation (ex GST)
LTCCP fee – Treatment and reticulation (ex GST)
Fee per HEU
(ex GST)
Fee per HEU (inc GST)
Te Awamutu $1,059 $1,746 $2,805 $3,156
Kihikihi $690 $247 $937 $1054
Picquet Hill $947 $6,494 $7,441 $8,372
Pirongia $1,059 $1,746 $2,805 $3,156
Cambridge/Karapiro $307 $6,430 $6,737 $7,579
Cambridge North $452 $6,991 $7,443 $8,373
Bond Road ‐ $5.10/m2 $5.10/m2 $5.74/m2
St Kilda $55 $5,510 $5,556 $6,251

296 Waipa District Council
8. Methodology – Wastewater 8.1 There are four scheme areas for the purposes of calculating wastewater development
contributions. Reticulation costs for each area are calculated for each separate catchment. Two wastewater treatment plant systems service the four reticulation catchments as described in the table below. District‐wide programmes also attract development contributions.
Development Contribution Fee Area
Wastewater Treatment Plant Catchment Wastewater Reticulation Catchment
Te Awamutu Te Awamutu reticulation
Kihikihi Kihikihi reticulation
Picquet Hill Picquet Hill reticulation
Bond Road
Shared Te Awamutu/Kihikihi Treatment Plant
Bond Road reticulation
Cambridge/Karapiro Cambridge/Karapiro reticulation
Cambridge North
Shared Cambridge/Karapiro, Cambridge North, Treatment Plant
Cambridge North reticulation
Total wastewater capital expenditure resulting from growth Wastewater capital expenditure already incurred in anticipation of growth 8.2 Historic capital expenditure resulting in assets designed with additional capacity in
anticipation of future growth totals $14,451,943 across both wastewater treatment plants and reticulation works. $6,810,183 of this total is estimated to provide for future capacity as follows.
Catchment Historic total capital
expenditure
Historic capital expenditure for
growth
HEUs Fee per HEU (ex GST)
Treatment Plants
Te Awamutu/Kihikihi $4,901,190 $1,131,838 2,030 $558
Reticulation
Kihikihi $6,604,857 $2,770,249 570 $4,860
Te Awamutu $54,000 $16,200 894 $18

10‐year Plan (2009‐19) 297
Catchment Historic total capital
expenditure
Historic capital expenditure for
growth
HEUs Fee per HEU (ex GST)
Cambridge North $2,891,896 $2,891,896 1,351 $2,141
Total $14,451,943 $6,810,183
Total wastewater capital expenditure in the LTCCP and portion resulting from growth 8.3 Ten‐year capital expenditure in the LTCCP 2009‐19 totals $33,379,400 of which $11,537,775
is estimated to provide additional design capacity for future growth.
LTCCP total capital
expenditure
LTCCP capital expenditure for
growth
HEUs Fee per HEU (ex GST)
Wastewater Treatment Plant
Cambridge, Cambridge North, Karapiro, Treatment Plant system
$13,567,700 $4,070,310 3,383 $1,203
Wastewater Reticulation
Te Awamutu $4,381,700 $1,314,510 894 $1,470
Picquet Hill $1,963,700 $1,963,700 407 $4,825
Bond Road $792,400 $792,400 195,000m2 $4.06/m2
Cambridge / Karapiro $2,760,200 $866,035 2347 $369
Cambridge North $1,710,500 $1,710,500 1,351 $1,266
District‐wide $8,203,200 $820,320 1,667 $492
Total $33,379,400 $11,537,775
Percentage of wastewater growth capital expenditure to be funded by development contributions. 8.4 100% of the growth related wastewater capital expenditure either already invested in
anticipation of growth, or expected to be invested through the 10‐year LTCCP period, is to be recovered from development contributions.

298 Waipa District Council
Identification of wastewater units of demand 8.5 Each HEU is assumed to discharge 1.359m3 per day. Residential HEUs of any size will pay a
fee set on the basis of this average except where a special assessment is required as per section 5.7.2.
8.6 Development contributions fees for district‐wide wastewater replacement programmes are
recovered from the predicted growth in the catchment area over the ten year LTCCP period 2009‐19.
8.7 Development contributions for wastewater are only charged where the development is able
to connect to a Council operated wastewater network. Non‐residential development 8.8 Non‐residential developments will pay according to the factors based on land‐use per 100m²
GFA set out in section 5.3.1. 8.9 Identification of the Wastewater design capacity (in HEUs) provided for growth, and input to
schedule of fees. Wastewater – summary of fees
Historic fee – Treatment and reticulation (ex
GST)
LTCCP fee ‐ Treatment and reticulation (ex
GST)
Fee per HEU
(ex GST)
Fee per HEU (inc GST)
Te Awamutu Total $576 $1,962 $2,538 $2,855
Kihikihi $5,418 $492 $5,910 $6,648
Picquet Hill $558 $5,317 $5,875 $6,609
Bond Road $0.19/m2 $4.23/m2 $4.42/m2 $4.97/m2
Cambridge/Karapiro ‐ $2,064 $2,064 $2,323
Cambridge North $2,141 $2,961 $5,102 $5,740
9. Methodology – Stormwater Stormwater catchment definition and asset management assumptions 9.1 Development contribution fee catchment areas for stormwater are calculated for three
separate catchments (Cambridge / Karapiro, Cambridge North and Bond Road). District‐wide programmes also attract development contributions.
9.2 Localised effects of growth on the need for stormwater infrastructure will also continue to be mitigated as a resource consent consideration.

10‐year Plan (2009‐19) 299
Total stormwater capital expenditure resulting from growth Stormwater capital expenditure already incurred in anticipation of growth 9.3 Historic capital expenditure totalling $2,381,543 has been incurred resulting in assets with
additional capacity in anticipation of future growth.
Development contribution fee area
Total historic capital
expenditure
Growth capital expenditure component
HEUs Fee per HEU (ex GST)
District wide $120,000 $12,000 1,804 $7
Cambridge $430,000 $43,000 751 $57
Cambridge North $1,831,543 $1,831,543 1,351 $1,356
Total District‐wide $2,381,543 $1,886,543 ‐ ‐
Total stormwater capital expenditure LTCCP and portion resulting from growth 9.4 Ten‐year stormwater capital expenditure in the LTCCP 2009‐19 totals $19,180,900. Council
asset manager’s review of proposed LTCCP expenditure indicates that $8,494,060 provides additional design capacity for future growth.
LTCCP total capital
expenditure
LTCCP capital expenditure for
growth
HEUs Fee per HEU
(ex GST)
District wide $12,103,800 $1,982,160 1,804 $1,099
Cambridge $628,000 $62,800 751 $84
Cambridge North $6,025,400 $6,025,400 1,351 $4,460
Bond Road $423,700 $423,700 195,000m² $2.17/m2
Hautapu industrial area (to be recovered through financial contributions)
‐ ‐ ‐ ‐
100% renewal or Level of Service expenditure
‐ ‐ ‐ ‐
Total $19,180,900 $8,494,060 ‐ ‐

300 Waipa District Council
Percentage of stormwater growth capital expenditure to be funded by development contributions 9.5 100% of the growth related water supply capital expenditure, either already invested in
anticipation of growth, or expected investment through the LTCCP, is to be recovered from development contributions.
Identification of stormwater units of demand 9.6 Each HEU is assumed to create an impervious area of 420m2 (60% of a 700m2 average lot
size) except where a special assessment is required as per section 5.7.2. 9.7 Development contributions for stormwater are only charged where there is a stormwater
network in place. Within that catchment, all development that creates additional impervious space, regardless of whether stormwater discharges to ground within a property or within the road reserve, will be required to pay development contributions. This is due to the direct linkages between surface stormwater management and groundwater management and the finite amount of stormwater that can be discharged to land from all sources within a catchment.
Non‐residential Development 9.8 Non‐residential development will pay 0.24 HEU / 100m2 impervious surface area with a
minimum of 1 HEU, as set out in section 5.3.1. Identification of the stormwater design capacity (in units of demand) provided for growth, allocation of costs to each unit of demand and input to schedule of fees 9.9 Stormwater effects are widespread and incremental. Asset managers expect that the LTCCP
stormwater capital expenditure will support the expected residential and non‐residential growth HEUs in the identified stormwater catchments and across the district more generally in the period 2009‐19.
Stormwater – summary of fees
Historic fee –
(ex GST)
LTCCP fee ‐ Treatment and reticulation
(ex GST)
Fee per HEU
(ex GST)
Fee per HEU
(inc GST)
Te Awamutu $7 $1,099 $1,105 $1,243
Kihikihi $7 $1,099 $1,105 $1,243
Picquet Hill $7 $1,099 $1,105 $1,243
Pirongia $7 $1,099 $1,105 $1,243
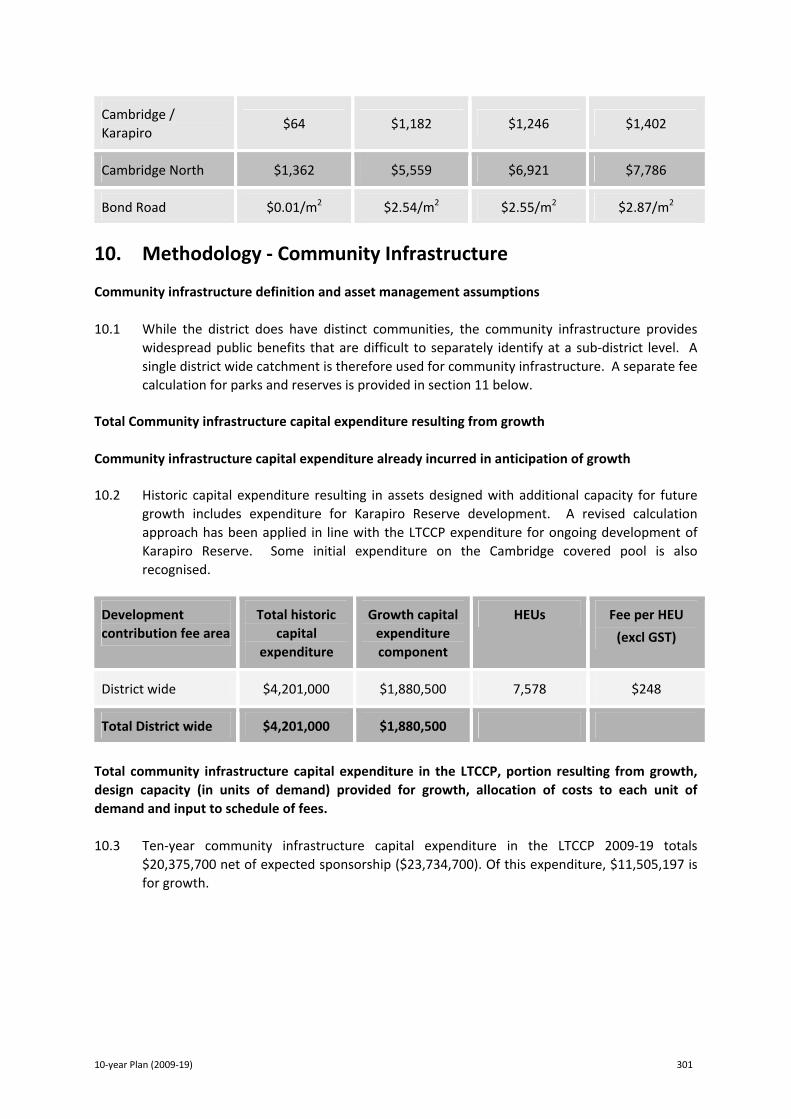
10‐year Plan (2009‐19) 301
Cambridge / Karapiro
$64 $1,182 $1,246 $1,402
Cambridge North $1,362 $5,559 $6,921 $7,786
Bond Road $0.01/m2 $2.54/m2 $2.55/m2 $2.87/m2
10. Methodology ‐ Community Infrastructure Community infrastructure definition and asset management assumptions 10.1 While the district does have distinct communities, the community infrastructure provides
widespread public benefits that are difficult to separately identify at a sub‐district level. A single district wide catchment is therefore used for community infrastructure. A separate fee calculation for parks and reserves is provided in section 11 below.
Total Community infrastructure capital expenditure resulting from growth Community infrastructure capital expenditure already incurred in anticipation of growth 10.2 Historic capital expenditure resulting in assets designed with additional capacity for future
growth includes expenditure for Karapiro Reserve development. A revised calculation approach has been applied in line with the LTCCP expenditure for ongoing development of Karapiro Reserve. Some initial expenditure on the Cambridge covered pool is also recognised.
Development contribution fee area
Total historic capital
expenditure
Growth capital expenditure component
HEUs Fee per HEU
(excl GST)
District wide $4,201,000 $1,880,500 7,578 $248
Total District wide $4,201,000 $1,880,500
Total community infrastructure capital expenditure in the LTCCP, portion resulting from growth, design capacity (in units of demand) provided for growth, allocation of costs to each unit of demand and input to schedule of fees. 10.3 Ten‐year community infrastructure capital expenditure in the LTCCP 2009‐19 totals
$20,375,700 net of expected sponsorship ($23,734,700). Of this expenditure, $11,505,197 is for growth.

302 Waipa District Council
10‐year Plan total capital expenditure
net of expected
sponsorship
10‐year Plan capital
expenditure for growth
Additional HEUs
provided for growth
Fee per HEU (Ex GST)
Fee per HEU (Inc GST)
Cambridge covered pool
$3,051,800 $843,360 7,578 $111 $125
Te Awamutu museum and library
$6,992,400 $1,932,338 7,578 $255 $287
Karapiro Reserve developments
$3,204,000 $1,602,000 7,578 $211 $238
Reserve development (excludes land acquisition)
$7,127,500 $7,127,500 3,598 $1,981 $2,229
Total $20,375,700 $11,505,197
10.4 The growth costs for community infrastructure are estimated by council officers on an asset‐
by‐asset basis. Percentage of community infrastructure growth capital expenditure to be funded by development contributions 10.5 100% of the growth related community infrastructure capital expenditure, either already
invested in anticipation of growth, or expected investment through the LTCCP, is to be recovered from development contributions.
Identification of community infrastructure units of demand 10.6 The primary demand driver for community infrastructure is residential use, with the growth
costs allocated to an average residential HEU except where a special assessment is required as per section 5.7.2.
Identification of the design capacity (in units of demand) provided for growth 10.7 LTCCP expenditure on reserves development is expected to service growth in the district
over the ten years of the current LTCCP. Development contributions will be charged to residential growth HEUs only. From 2009‐2019, this is forecast to be 3,598 HEUs.
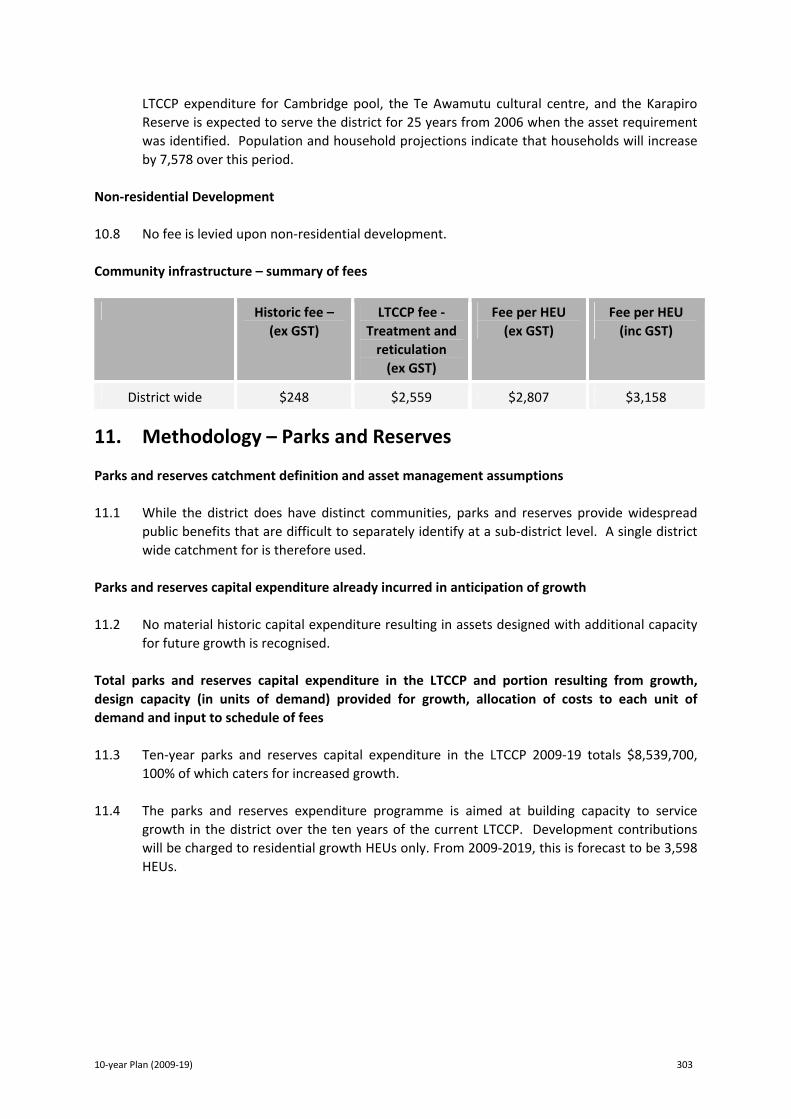
10‐year Plan (2009‐19) 303
LTCCP expenditure for Cambridge pool, the Te Awamutu cultural centre, and the Karapiro Reserve is expected to serve the district for 25 years from 2006 when the asset requirement was identified. Population and household projections indicate that households will increase by 7,578 over this period.
Non‐residential Development 10.8 No fee is levied upon non‐residential development. Community infrastructure – summary of fees
Historic fee – (ex GST)
LTCCP fee ‐ Treatment and reticulation (ex GST)
Fee per HEU (ex GST)
Fee per HEU (inc GST)
District wide $248 $2,559 $2,807 $3,158
11. Methodology – Parks and Reserves Parks and reserves catchment definition and asset management assumptions 11.1 While the district does have distinct communities, parks and reserves provide widespread
public benefits that are difficult to separately identify at a sub‐district level. A single district wide catchment for is therefore used.
Parks and reserves capital expenditure already incurred in anticipation of growth 11.2 No material historic capital expenditure resulting in assets designed with additional capacity
for future growth is recognised. Total parks and reserves capital expenditure in the LTCCP and portion resulting from growth, design capacity (in units of demand) provided for growth, allocation of costs to each unit of demand and input to schedule of fees 11.3 Ten‐year parks and reserves capital expenditure in the LTCCP 2009‐19 totals $8,539,700,
100% of which caters for increased growth. 11.4 The parks and reserves expenditure programme is aimed at building capacity to service
growth in the district over the ten years of the current LTCCP. Development contributions will be charged to residential growth HEUs only. From 2009‐2019, this is forecast to be 3,598 HEUs.

304 Waipa District Council
LTCCP total capital
expenditure net of
expected sponsorship
LTCCP capital expenditure for growth
Additional HEUs
provided for growth
Fee per HEU (Ex GST)
Fee per HEU (Inc GST)
District wide $8,539,700 $8,539,700 3,598 $2,373 $2,670
Percentage of parks and reserves growth capital expenditure to be funded by development contributions 11.5 100% of the growth related capital expenditure either already invested in anticipation of
growth, or expected investment through the LTCCP, is to be recovered from development contributions.
Identification of parks and reserves units of demand 11.6 The primary demand driver for parks and reserves is residential use, with the growth costs
allocated to an average residential HEU except where a special assessment is required as per section 5.7.2.
Non‐residential Development 11.7 No fee is levied upon non‐residential development.

10‐year Plan (2009‐19) 305
12. Development Contribution Catchment Maps Te Awamutu

306 Waipa District Council

10‐year Plan (2009‐19) 307

308 Waipa District Council

10‐year Plan (2009‐19) 309

310 Waipa District Council

10‐year Plan (2009‐19) 311

312 Waipa District Council

10‐year Plan (2009‐19) 313

314 Waipa District Council
Pirongia

10‐year Plan (2009‐19) 315
Cambridge

316 Waipa District Council

10‐year Plan (2009‐19) 317

318 Waipa District Council
Policy on Private Sector Partnerships
General Council may consider entering into a partnership with a private sector partner, where an activity has been identified in the 10‐year Plan (LTCCP) or Annual Plan as a community priority or desirable community outcome. The circumstances where a private sector partnership may be entered into shall be limited to one or more of the following:
▪ Where Council may be unwilling or unable to bear all of the risk (usually, though not always defined in terms of financial risks) of a particular project itself
▪ Where Council may believe a particular project is of significant community benefit, but Council may have legal restrictions on its power to participate fully in that project
▪ Where neither Council nor a private provider would otherwise provide the services or activity without the partnership
▪ Where there are identifiable advantages in the project or activity being undertaken as a public private sector partnership rather than by either of the parties separately
▪ Where the benefits to the community are greater than the costs of the PSP. Conditions Council will enter into a partnership only where it expects that the partnership will hep achieve the community outcomes or objectives in the 10‐year Plan, but nothing in this policy commits Council to entering into such a partnership even if it will help achieve community outcomes or objectives. Before entering into a private sector partnership, Council must be satisfied that:
▪ The partnership will help achieve the community outcomes or objectives identified in the Strategic Plan or 10‐year Plan
▪ The benefit from the partnership is greater than the costs and risks ▪ Council is satisfied that the partner has demonstrated an ability to meet the terms of any
agreement between Council and the private partner ▪ All necessary consents, licences, or other approvals have been obtained prior to any financial
commitment by the Council ▪ The partnership and its proposed business are lawful ▪ A clear exit/termination strategy is agreed ▪ Roles, responsibilities and liabilities of each partner are clearly defined.
Council will not enter into a private sector partnership where:
▪ The activity is primarily speculative in nature ▪ Insurance cover cannot be obtained that is considered adequate to meet foreseeable risks ▪ The cost or risk of the private sector partnership is judged to be greater to the community
than the benefits that would accrue from the private sector partnership.

10‐year Plan (2009‐19) 319
Where appropriate, Council reserves the right to apply competitive tendering processes, in accordance with Council policy. Other Conditions may be imposed as considered appropriate by Council. Council will consider the following methods of implementing a private sector partnership:
▪ Grants, where the assessed benefit to the community justifies, where the private sector partner is accorded priority by Council, and funds are available for the activity
▪ Loans, where the benefit to the community is significant, but it is assessed that income or other funding can in time be accessed, and/or there will also be significant benefits to the private partner and/or it is otherwise unsuitable to provide other funding
▪ Investments, where there are deemed to be significant public benefits, and the community has been consulted, either during a 10‐year Plan or Annual Plan consultation or separately using the special consultative procedure
▪ Acting as a guarantor for assets being constructed on Council‐owned land ▪ Acting as a guarantor in extraordinary circumstances may be considered by Council following
community consultation, and where there are appropriate safeguards in place to ensure budgets are not exceeded and where limitations are specified as to the total amount Council is guarantor for.
Consultation Council will undertake consultation on any revision of this “Policy on Public‐private sector partnerships” as part of a 10‐year Plan. Where Council decides to undertake a private sector partnership in accordance with the policy, further consultation will not be required to be undertaken except in specific circumstances (below). Council will consult on individual private sector partnerships where:
▪ A private sector partnership is assessed as being greatly beneficial, but falls outside the conditions or circumstances identified in the policy
▪ An investment is proposed ▪ It is proposed to act as guarantor in extraordinary circumstances ▪ The partnership would result in significant positive or negative changes in service levels, as
defined in Council’s Significance Policy ▪ The proposal would have a material impact on Council’s projected budgets, performance
measures, outcomes or other objectives ▪ Ownership or control of a significant asset (as detailed in Council’s Significance Policy), is to
be transferred to or from Council ▪ There is expected to be considerable public interest in whether or not the private sector
partnership should proceed and/or it meets the test of significance as set out in Council’s Significance Policy.
Where practicable, consultation on private sector partnerships under the above criteria will take place under the Annual Plan or 10‐year Plan process. Alternatively, a separate special consultative procedure may be undertaken.

320 Waipa District Council
Formation of a Private Sector Partnership Formation of a public private partnership that meets the conditions of this policy will be by ordinary Council resolution, unless authority to form a partnership is delegated to a committee, subcommittee, or the Principal Administrative Officer, in which case the partnership must also meet the conditions of this policy. Formation of a partnership that does not meet the conditions of this policy will be by ordinary Council resolution only after appropriate and required consultation, and due consideration of any issues raised by that consultation. Risk Management When considering a public private partnership, the potential risks to Council will be outlined and where the risks are considered significant, in terms of probability and potential effect, Council will assess the level of risks against their benefits and management strategies. Risk will be assessed by calculating the probability of an adverse outcome multiplied by the cost/impact of that adverse outcome, while taking into account mitigating strategies and associated costs. Risks which may be considered are as follows:
▪ Design and construction risk ▪ Commissioning and operating risk ▪ Service and under‐performance risk ▪ Maintenance risk ▪ Risk of change to the legal or regulatory environment ▪ Risk of legal challenge ▪ Technology obsolescence risk ▪ Planning risk ▪ Price risk ▪ Taxation risk ▪ Residual value risk ▪ Demand or valuation risk ▪ Occupation safety and health risk ▪ The relative investment of the private sector partner ▪ The level of experience / track record of the partner, particularly in that activity ▪ Risk to the reputation of Waipa District Council and Waipa District generally ▪ Insurance coverage and limitations ▪ Risk to the capacity of the Council to carry out its activities, now and in the future ▪ Risk to property ▪ Protection of any intellectual property and ▪ Any other risks identified.
Where risks exist and a partnership is to be agreed, a risk management strategy will be put in place to appropriately minimise or provide cover for that risk to the satisfaction of Council. Risk management in any or all of the above areas may be specified as being the responsibility of Council or the partner.
10‐year Plan (2009‐19) 321
Monitoring and Reporting A private sector partner will be expected to report using GAAP (generally accepted accounting principles) appropriate to their type of financial entity, and to allow auditing of financial and non‐financial records as and when reasonably requested by Council or a representative appointed by Council. Monitoring and reporting requirements will vary, depending on the level of resources Council is expending/investing/protecting, and the nature of the partnership. The following points may be considered:
▪ Proposals for private sector partnerships should state how they might contribute to
outcomes or objectives in the 10‐yeaer Plan ▪ Measurable and auditable performance standards should be included where appropriate in
partnership documents ▪ Progress on agreed outcomes and objectives should be reported on to Council’s Strategic
Planning and Policy Committee on a six‐monthly basis ▪ Quarterly or annual financial reports may be required ▪ Transparency in the conduct and reporting of private sector partnership activities should be
emphasised, acknowledging the need to protect commercial confidentiality where appropriate.
Note: A partnership with the private sector, in the context of this Policy, means an arrangement or agreement entered into between Council and any persons engaged in business. It does not include arrangements or agreements between local authorities, with Council organisations or contracts for the supply of goods or services on behalf of Council.

322 Waipa District Council
Policy on the Remission and Postponement of Rates
Remission of Rates Remission Policy This policy is prepared pursuant to Sections 109 and 110 of the Local Government Act 2002. Remissions for Community, Sporting and Other Organisations OBJECTIVE This policy is intended to facilitate the ongoing provision of non‐commercial community services and recreational opportunities for the residents of Waipa District. The purpose of granting rates remission to an organisation is to:
a) assist the organisation’s survival; and b) make membership of the organisation more accessible to the general public.
CONDITIONS AND CRITERIA This part of the policy will apply to land owned and occupied by a charitable organisation, which is used exclusively or principally for sporting, recreation, or community purposes. The policy does not apply to organisations operated for private pecuniary profit. Nor will it apply to groups or organisations who engage in recreational, sporting or community services as a secondary purpose only. Remission will be applied as follows to all rates with the exception of targeted rates for water supply and sewage disposal:
▪ A remission of the 50% residual rates will be given to those societies and associations who qualify for the 50% non rateable category under Schedule 1, Part 2 of the Local Government (Rating) Act 2002.
▪ All other community and sporting organisations fitting the criteria stated in this policy will receive a full remission of rates.
No remission will be granted on targeted rates for water supply or sewage disposal. Remission Relating to Covenanted Land OBJECTIVE To provide for relief for land where an open‐space covenant under Section 22 of the Queen Elizabeth the Second National Trust Act 1977 has been registered against the title of a property.
10‐year Plan (2009‐19) 323
To provide relief for land where a covenant or consent notice is registered on the title to the land to secure an appropriate interest in perpetuity for conservation purposes under the Resource Management Act 1991. CONDITIONS AND CRITERIA The Local Government (Rating) Act 2002 provides for land owned or used by the QE2 National Trust to be non rateable. Where the land to which the covenant relates remains in the ownership or the ratepayer, the covenanted land will be eligible for a remission of rates. Where a covenant or consent notice under the Resource Management Act 1991 as described in the objective above is registered, the covenanted land will be eligible for a remission of rates. The remission applied will be 100% of all rates other than targeted rates for water supply or sewage disposal. Remission of Penalties OBJECTIVE The objective of this part of the remission policy is to enable Council to act fairly and reasonably in its consideration of overdue rates, due to circumstances outside the ratepayer’s control. CONDITIONS AND CRITERIA Remission of penalty will be granted where payment is made within seven days of the penalty date provided the ratepayer has made no late payments for rates within the preceding three years. Remission of penalty may be granted at Council’s discretion where regular payments are being made in accordance with an agreement which is set up to clear all outstanding rates by the end of the rating year. In addition, remission of penalty will be considered where payment has been late due to significant family disruption, or is a result of matters beyond the control of the ratepayer. Each application will be considered on its merits and remission will be granted where it is considered just and equitable to do so. Decisions on remission of penalties will be delegated to officers as set out in Council’s delegations resolution. Remission of Sewerage Charges OBJECTIVE
▪ The sewerage charges levied by Council against separate rating units make provision to charge rates based on the number of toilets. The legislation to provide some relief to schools in their liability for sewerage charges has been repealed and in the absence of new legislation Council wishes to provide a partial remission to schools in line with the previous legislation.
▪ Council also wishes to provide relief to not‐for‐profit organisations that choose to install more toilets than required by the building code.
324 Waipa District Council
CONDITIONS AND CRITERIA
▪ Sewerage charges for schools will be based on the required number of toilets based on the staff/student numbers supplied by each school. The student numbers will be taken as those at the March census. The difference between the required rate and the school calculation rate will be treated as a remission.
▪ Council may partially remit the sewerage charge for not‐for‐profit organisations where the number of toilets installed exceeds the number of toilets required under the building code.
Postponement of Rates OBJECTIVE The objective of this part of the policy is to assist ratepayers experiencing extreme financial circumstances that affect their ability to pay rates. CONDITIONS AND CRITERIA
▪ Only rating units used solely for residential purposes will be eligible for consideration for rates postponement due to extreme financial circumstances.
▪ Only the person entered on Council’s rating information database as the ratepayer, or their authorised agent, may make an application for rates postponement due to extreme financial circumstances. The ratepayer must be the current owner of, and have owned for a minimum of five years, the rating unit which is the subject of the application. The ratepayer must not own any other rating units or investment properties (whether in the district or in another district).
▪ The ratepayer (or authorised agent) must make an application to Council for consideration. Council will consider on a case by case basis all applications received that meet the criteria above. When considering an application all off the ratepayer’s personal circumstances will be relevant including the following factors: age, physical or mental disability, injury, illness and family circumstances.
▪ Before approving an application, Council must be satisfied that the ratepayer is unlikely to have sufficient funds left over, after the payment of rates, for normal health care, proper provision for maintenance of his/her home and chattels at an adequate standard as well as making provision for normal day to day living expenses.
▪ Where Council decides to postpone rates the ratepayer must first make acceptable arrangements for payment of future rates, for example by setting up a system for regular payments.
▪ Any postponed rates will be postponed until: a) The death of the ratepayer; or b) Until the ratepayer ceases to be the owner of the rating unit; or c) Until the ratepayer ceases to use the property as his/her residence; or d) Until a date specified by Council – five yearly intervals as a minimum.
▪ In accordance with Section 88 of the Local Government (Rating) Act 2002 Council will charge an additional fee on postponed rates for the period between the due date and the date they are paid. This fee is designed to cover the Council’s administrative and financial costs, and will be based on the average bank borrowing rate in any one year. This fee would replace the six months penalty regime, and would require any six months penalties already charged to be remitted.

10‐year Plan (2009‐19) 325
▪ The postponed rates or any part thereof may be paid at any time. The applicant may elect to postpone the payment of a lesser sum than that which they would be entitled to have postponed pursuant to this policy.
▪ Postponed rates will be registered as a statutory land charge on the rating unit title. This means that Council will have first call on the proceeds of any revenue from the sale or lease of the rating unit.

326 Waipa District Council
Policy on the Remission and Postponement of Rates on Māori Freehold Land
General This policy is prepared pursuant to Sections 102 and 108 of the Local Government Act 2002 and Section 114 of the Local Government (Rating) Act 2002. In preparing this Policy Council has considered the matters set out in Schedule 11 of the Local Government Act 2002 Māori freehold land is defined in the Local Government (Rating) Act 2002 as land whose beneficial ownership has been determined by the Māori Land Court by freehold order. Only land that is the subject of such an order may qualify for the remission or postponement of rates under this policy. Remission This Policy aims to:
a) contribute to the fair and equitable collection of rates from all sectors of the community recognising that certain Māori lands have particular conditions, features, ownership structures, or other circumstances that make it appropriate to provide relief from rates; and
b) put in place a means of providing relief on rating for Māori land pursuant to Section 108 of the Local Government Act 2002 by way of remission or postponement of rates.
Objectives The objectives of this policy are:
a) to recognise situations where there is no person or owner gaining an economic or financial benefit from the land;
b) to set aside land that is better set aside for non‐use because of its natural features; c) to recognise matters related to the physical accessibility of the land; d) to recognise and take account of the presence of waahi tapu that may affect the use of the
land for other purposes; e) where part only of a block is occupied, to grant remission for the portion of land not
occupied; and f) to facilitate development or use of the land where Council considers rates based on actual
capital value make the actual use of the land uneconomic. Principles The principles used in establishing this Policy are:
a) that, as defined in Section 91 of the Local Government (Rating) Act 2002, Māori freehold land is liable for rates in the same manner as if it were general land;
b) that Council is required to consider whether it should have a policy which provides for remission of rates on Māori freehold land;

10‐year Plan (2009‐19) 327
c) that Council and the community benefit through the efficient collection of rates that are properly payable and the removal of rating debt that is considered non‐collectable;
d) that applications for relief meet the criteria set by Council; and e) that the policy does not provide for the permanent remission or postponement of rates on
the property concerned. Conditions and Criteria Council will maintain a register called the Māori freehold land rates relief register (the register), for the purpose of recording properties on which it has agreed to remit rates pursuant to this policy. Applications for remission should include the following information:
▪ Details of the property. ▪ The objectives that will be achieved by providing a remission. ▪ Documentation proving that the subject land is Māori freehold land.
Applications made after commencement of the rating year may be accepted at the discretion of Council. Any relief granted and the extent thereof is at the sole discretion of Council. The register will be reviewed annually (or on a more regular basis at the discretion of Council). It may at its discretion add properties to the register. It may also determine that properties no longer comply either fully or in part, and either remove them from the register or reduce the extent of the relief. Council will consider granting a remission of rates on property where any one or more of its objectives a) through to e) as set out above will be met. Where a remission is granted this will, to the extent that the objective relates to the entire property, be a 100% remission of all rates, except targeted rates for water supply, sewage disposal, stormwater drainage or waste management. Where the objective relates to only part of the property, then a proportional remission of all rates, except targeted rates for water supply, sewage disposal, stormwater drainage or waste management. Council will also consider granting a remission of rates on property where objective f) will be met. This will follow the principle that the property carries a best potential use value that is significantly in excess of the economic value arising from the actual use. The remission will be to a maximum of 50% of all rates except targeted rates for water supply, sewage disposal, stormwater drainage or waste management, and will reflect a measure of the difference between rates as assessed and the rates that would be assessed based on actual use. For the purposes of this Policy, rates are deemed to include penalties.

328 Waipa District Council
Postponement This policy aims to:
a) contribute to the fair and equitable collection of rates from all sectors of the community recognising that certain Māori lands have particular conditions, features, ownership structures, or other circumstances that make it appropriate to provide relief from rates; and
b) put in place a means of providing relief on rating for Māori land pursuant to Section 108 of the Local Government Act 2002 by way of postponement of rates.
Objectives The objectives of this policy are:
a) to encourage the economic development of the land by a new occupier, where there are rate arrears; and
b) to facilitate the development and economic use of land where it is considered that utilisation would be uneconomic if full rates are required to be paid during the period of development and establishment.
Principles The principles used in establishing this policy are:
a) that, as defined in Section 91 of the Local Government (Rating) Act 2002, Māori freehold land is liable for rates in the same manner as if were general land;
b) that Council is required to consider whether it should have a policy which provides for the postponement of rates or rates relief on Māori freehold land;
c) that applications for postponement meet the criteria set by Council; and d) that the Policy does not provide for the permanent postponement of rates on the property
concerned. Conditions and Criteria Application for postponement of rates should be made in writing prior to commencement of the next rating year. Applications made after commencement of the rating year may be accepted at the discretion of Council. Owners or trustees making application should include the following information in their applications:
▪ Details of the property ▪ The objectives that will be achieved by providing a remission ▪ Documentation proving that the subject land is Māori freehold land.
Any postponement granted and the extent thereof is at the sole discretion of Council. No postponement will be granted on targeted rates for water supply, sewage disposal, stormwater drainage or waste management.

10‐year Plan (2009‐19) 329
Waste Management Plan
Waste Management Plan 2005‐10 The Local Government Act 2002 requires every territorial authority to prepare a Waste Management Plan and that a summary of the Plan is to be included in each council’s 10‐year Plan. The Act also requires that a summary of the assessment of the refuse collection and disposal services be included in the 10‐year Plan. Councils are required to encourage effective and efficient waste management, and a waste management plan must take provision for the collection and reduction, reuse, recycling, recovery, treatment or disposal of waste. In 2004 Waipa District Council commenced a review of its 1997 Waste Management Plan because significant changes had occurred in waste management activities and service since that Plan was adopted. The review process, which involved extensive public input, resulted in a new Plan being adopted by Council on 28 June 2005. The 2005 Plan covers a five year period and will be reviewed prior to 2010, when a new Plan is expected to be adopted. Council’s 2005 Waste Management Plan is based around key solid and liquid waste aspects of the New Zealand Waste Strategy, which was adopted by the Government in 2002. As part of the review, work will be undertaken to expand the scope of Council’s Waste Management Plan to include gaseous wastes and other liquid waste components. This will then ensure alignment with the New Zealand Waste Strategy. The assessment of refuse collection and disposal services established that private sector organisations were providing almost all services, as Council no longer owned and operated any waste related facilities. The extent of Council’s role was to avoid risks to public health by ensuring residents had access to a minimum standard of service and the existing facilities were seen as being adequate to meet demand. Council’s future involvement in waste management activities is set out in the Waste Management Plan, and these primarily relate to the kerbside recycling collection. Council works closely with Environment Waikato to implement the Waste Management Plan. This approach will help ensure a greater degree of coordination across the Region and make the best use of the limited resources available to promote effective waste management. The 2005‐10 Waipa District Waste Management Plan sets out a number of goals and targets that Council is pursuing. These, and an outline of the actions proposed, are set out in table on the following page:
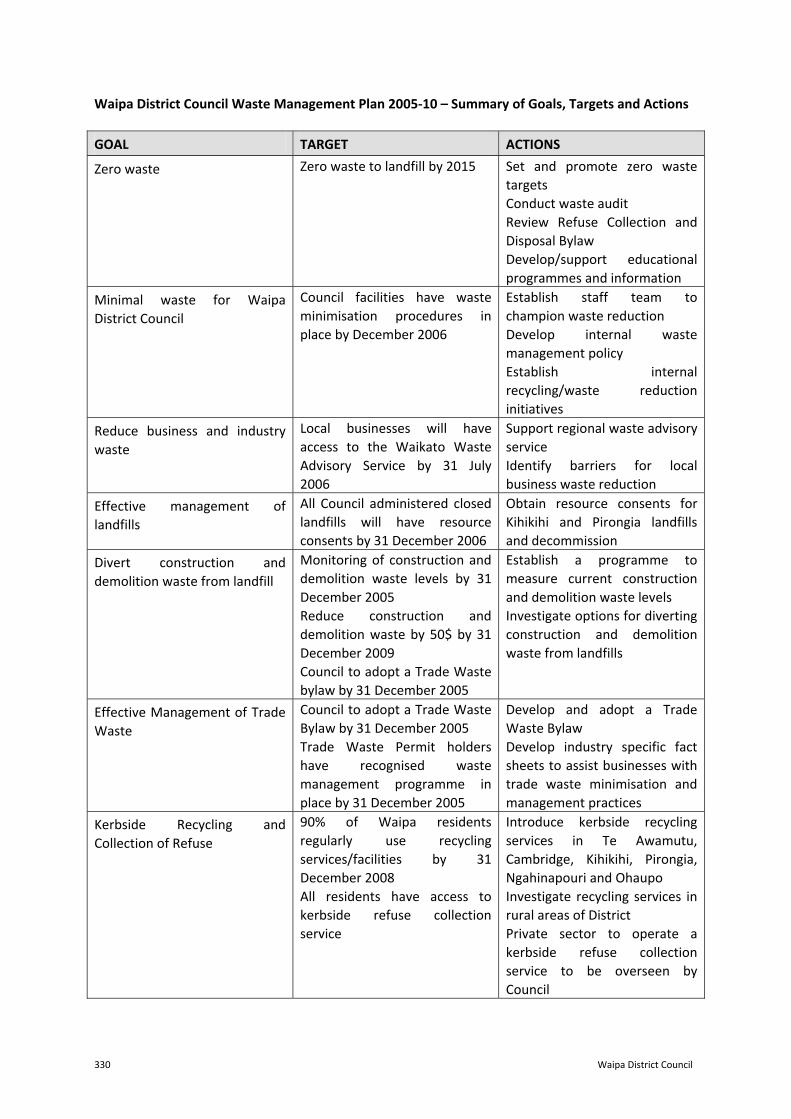
330 Waipa District Council
Waipa District Council Waste Management Plan 2005‐10 – Summary of Goals, Targets and Actions
GOAL TARGET ACTIONS
Zero waste Zero waste to landfill by 2015 Set and promote zero waste targets Conduct waste audit Review Refuse Collection and Disposal Bylaw Develop/support educational programmes and information
Minimal waste for Waipa District Council
Council facilities have waste minimisation procedures in place by December 2006
Establish staff team to champion waste reduction Develop internal waste management policy Establish internal recycling/waste reduction initiatives
Reduce business and industry waste
Local businesses will have access to the Waikato Waste Advisory Service by 31 July 2006
Support regional waste advisory service Identify barriers for local business waste reduction
Effective management of landfills
All Council administered closed landfills will have resource consents by 31 December 2006
Obtain resource consents for Kihikihi and Pirongia landfills and decommission
Divert construction and demolition waste from landfill
Monitoring of construction and demolition waste levels by 31 December 2005 Reduce construction and demolition waste by 50$ by 31 December 2009 Council to adopt a Trade Waste bylaw by 31 December 2005
Establish a programme to measure current construction and demolition waste levels Investigate options for diverting construction and demolition waste from landfills
Effective Management of Trade Waste
Council to adopt a Trade Waste Bylaw by 31 December 2005 Trade Waste Permit holders have recognised waste management programme in place by 31 December 2005
Develop and adopt a Trade Waste Bylaw Develop industry specific fact sheets to assist businesses with trade waste minimisation and management practices
Kerbside Recycling and Collection of Refuse
90% of Waipa residents regularly use recycling services/facilities by 31 December 2008 All residents have access to kerbside refuse collection service
Introduce kerbside recycling services in Te Awamutu, Cambridge, Kihikihi, Pirongia, Ngahinapouri and Ohaupo Investigate recycling services in rural areas of District Private sector to operate a kerbside refuse collection service to be overseen by Council

10‐year Plan (2009‐19) 331
The introduction of the Waste Minimisation Act in 2008 requires Council to review its Waste Management Plan by 2012. The review proposed by Council for 2010 will be undertaken to ensure compliance with the legislation.
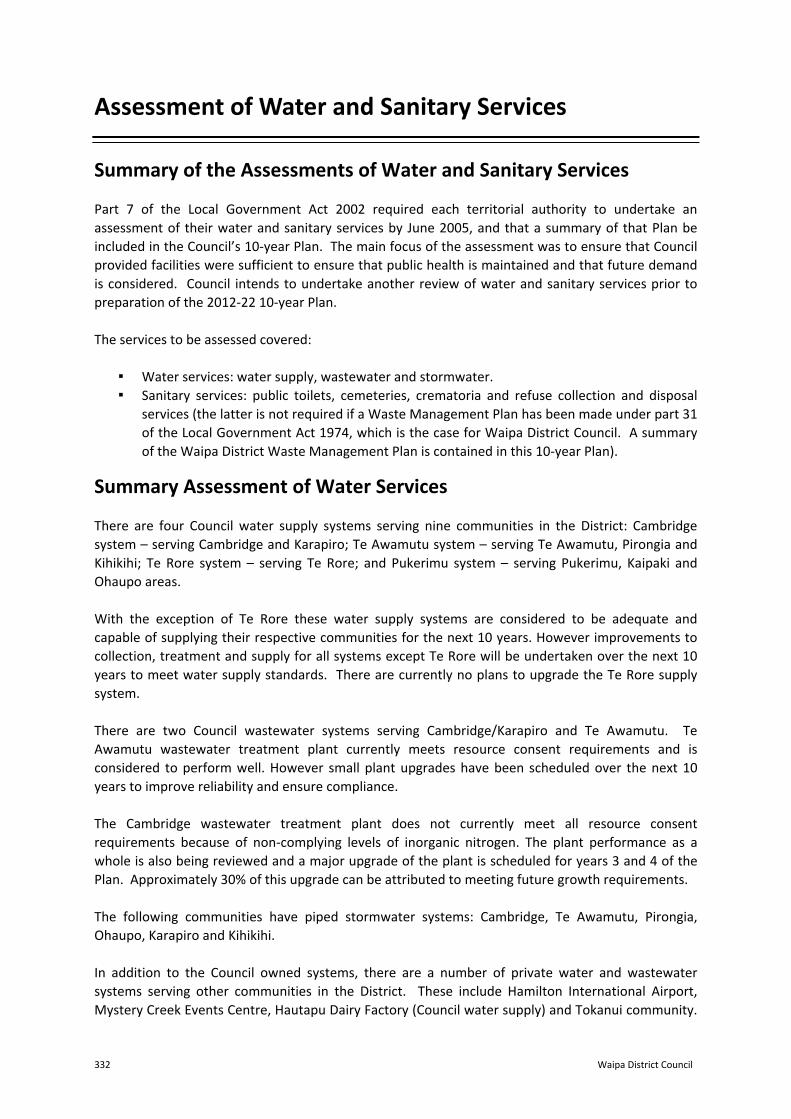
332 Waipa District Council
Assessment of Water and Sanitary Services
Summary of the Assessments of Water and Sanitary Services Part 7 of the Local Government Act 2002 required each territorial authority to undertake an assessment of their water and sanitary services by June 2005, and that a summary of that Plan be included in the Council’s 10‐year Plan. The main focus of the assessment was to ensure that Council provided facilities were sufficient to ensure that public health is maintained and that future demand is considered. Council intends to undertake another review of water and sanitary services prior to preparation of the 2012‐22 10‐year Plan. The services to be assessed covered:
▪ Water services: water supply, wastewater and stormwater. ▪ Sanitary services: public toilets, cemeteries, crematoria and refuse collection and disposal
services (the latter is not required if a Waste Management Plan has been made under part 31 of the Local Government Act 1974, which is the case for Waipa District Council. A summary of the Waipa District Waste Management Plan is contained in this 10‐year Plan).
Summary Assessment of Water Services There are four Council water supply systems serving nine communities in the District: Cambridge system – serving Cambridge and Karapiro; Te Awamutu system – serving Te Awamutu, Pirongia and Kihikihi; Te Rore system – serving Te Rore; and Pukerimu system – serving Pukerimu, Kaipaki and Ohaupo areas. With the exception of Te Rore these water supply systems are considered to be adequate and capable of supplying their respective communities for the next 10 years. However improvements to collection, treatment and supply for all systems except Te Rore will be undertaken over the next 10 years to meet water supply standards. There are currently no plans to upgrade the Te Rore supply system. There are two Council wastewater systems serving Cambridge/Karapiro and Te Awamutu. Te Awamutu wastewater treatment plant currently meets resource consent requirements and is considered to perform well. However small plant upgrades have been scheduled over the next 10 years to improve reliability and ensure compliance. The Cambridge wastewater treatment plant does not currently meet all resource consent requirements because of non‐complying levels of inorganic nitrogen. The plant performance as a whole is also being reviewed and a major upgrade of the plant is scheduled for years 3 and 4 of the Plan. Approximately 30% of this upgrade can be attributed to meeting future growth requirements. The following communities have piped stormwater systems: Cambridge, Te Awamutu, Pirongia, Ohaupo, Karapiro and Kihikihi. In addition to the Council owned systems, there are a number of private water and wastewater systems serving other communities in the District. These include Hamilton International Airport, Mystery Creek Events Centre, Hautapu Dairy Factory (Council water supply) and Tokanui community.

10‐year Plan (2009‐19) 333
Outside of the areas served by public or private reticulation systems, residents are required to make their own arrangements for water supply and sewage disposal. Council has and will continue to monitor water supply and sewage disposal across the District to ensure that all residents have access to an appropriate level of service to ensure their health and wellbeing is maintained. Key Concerns9 Apart from the ongoing need to monitor current systems and future supply issues, the following are key actions recommended to address any significant issues identified by the assessment process:
▪ Water supply (reticulated) – improve the security of the Hicks Road water supply and address Te Awamutu and Te Rore source issues.
▪ Water supply (unreticulated) – investigate a public water supply for Maungakawa. ▪ Wastewater (reticulated) – address minor failures of the reticulation in Cambridge and
upgrading of the treatment plant is required. ▪ Wastewater (unreticulated) – implement the Kihikihi wastewater reticulation project. ▪ Stormwater (reticulated) – upgrade the reticulation in Cambridge and Te Awamutu urban
areas. ▪ Stormwater (unreticulated) – for the communities with no reticulated stormwater system
there are no significant issues that need to be addressed. Summary Assessment of Sanitary Services Public Toilets/Disposal Points Council current provides 31 public toilet facilities, plus a number of toilets inside Council’s facilities, such as swimming pools and community halls. There are also a number of privately owned and operated “public” toilets in the District. There are two effluent disposal facilities for campervans and caravans, there are no stock truck effluent disposal sites. There are no known capacity problems that are causing public health or environmental issues and the only public toilet known to have capacity issues is at Lake Ngaroto. Significant predicted population growth in areas such as Cambridge means that the existing toilet facilities may not be able to meet the future demand over the next 10 years, and public health may be compromised as a result. Council undertook an assessment in early 2008 and the existing facilities were shown to be adequate for the 10 years covered by this Plan. Council will review existing plans to address pressure on existing effluent disposal facilities arising from increasing future demand over the next 10 years. Cemeteries and Crematoria There are nine public cemeteries in the District managed by Council. There are also five private cemeteries and there are many Maori cemeteries that are not recorded. There is no crematorium in the District, with closest facility being in Hamilton.
9 The Assessment of Water and Sanitary Services was adopted by Council in June 2005. Many of the key concerns identified were subject to existing works programmes or are now included in this 10‐year Plan.

334 Waipa District Council
The Council cemeteries appear to have adequate capacity for the next 10 years, except for the Te Awamutu cemetery, which is reaching capacity. In response, Council has moved to acquire additional land adjacent to the Te Awamutu cemetery. An increase in the number of people choosing cremation over burial is currently placing pressure on the Hamilton crematorium and Hamilton City Council is planning to upgrade their facility to cope with future demand. Protection of Public Health Based on the number, location and quality of the existing facilities, and provided that the proposals to meet the future predicted demand are implemented, it is considered that public health in Waipa District is, and will continue to be, adequately protected.

10‐year Plan (2009‐19) 335
Section 8 ‐ COUNCIL CONTROLLED ORGANISATIONS
In this section: Details of Council Controlled
Organisations

336 Waipa District Council
Council Controlled Organisations
The Local Government Act 2002 requires Council to include in the 10‐year Plan information on those organisations in which it is a stakeholder. In particular, Council must include:
a) its significant policies and objectives regarding ownership and control of the organisation; b) the nature and scope of the activities to be provided by the organisation; and c) the key performance targets and other measures by which performance may be judged.
Council is a shareholder in three organisations that are classified as council controlled organisations as defined by the Local Government Act. The organisations are:
1. Waikato Regional Airport Limited (Hamilton International Airport); 2. NZ Local Government Insurance Corporation (NZLGIC); and 3. Local Authority Shared Services Limited (LASS).
Waikato Regional Airport Limited (WRAL) Waikato Regional Airport Ltd (Hamilton International Airport) is jointly owned by five local authorities ‐ Hamilton City, Waikato District, Waipa District, Otorohanga District and Matamata‐Piako District Councils. Waipa District Council’s shareholding is 15.625%. Corporate Mission The mission of Waikato Regional Airport is to operate a successful commercial business providing safe, appropriate and efficient services for the transportation of people and freight in and out of Hamilton Airport. Goal The retention of the Airport as a major infrastructural facility is important to the Waikato economy. A Statement of Intent provided by the Airport Company (as required by Section 64 of the Local Government Act 2002) is available but does not form part of this Plan. Policies and Objectives Council intends to maintain its current shareholding for the foreseeable future. There are no formal policies or objectives relating to ownership and control of Waikato Regional Airport. Nature and Scope of Activities The nature and scope of the activities for the company is to:
a) Operate Hamilton International Airport efficiently on sound business principles and in accordance with the safety provisions of the Aerodrome Certification Exposition.

10‐year Plan (2009‐19) 337
b) Seek opportunities to widen its revenue base in areas consistent with its core business. c) Review the rolling five year capital works programme and associated funding strategy, with
the intent that the business as usual programme will be self‐funding. d) Work with McConnell Property Limited, Joint Venture Partner, to develop land for
commercial/industrial/retail purposes. e) Within the joint venture agreement maximise the return of surplus airport land to the
shareholders. f) Fulfil its purchase obligations associated with the Montgomerie Block farm in 2010. g) Undertake further review work on a proposed runway extension to the north. h) Undertake an annual review of the condition of the company’s paved areas. i) Undertake major capital expenditure as budgeted. j) Explore the retention and growth in domestic and international routes with existing and
potential new airlines and work to develop joint marketing strategies in support of these initiatives.
Performance Targets (Extracted from the Company’s 5 year Business Plan and subject to change)
Year Ended 30 June
2009 2010 2011
Net profit after tax to average shareholders’ funds
0.50% 0.76% 0.65%
Net profit before tax/interest to total assets
2.28% 2.37%
2.28%
Net profit after tax to total assets
0.32% 0.55% 0.48%
Net profit before tax/interest to average shareholders’ funds
3.49% 3.29% 3.13%
Percentage of Non Landing Charges Revenue Non‐landing charges revenue is defined as revenue that has not
been recovered directly from airlines.
81.42% 78.59% 78.90%
Earnings before Interest, Taxation & Depreciation (EBITDA) 2,878,199 3,018,928 3,064,081
Total Liabilities/Shareholders Funds: (Debt/Equity Ratio)
26:74 27:73
27:73
Interest Rate Cover The interest cover measures the number of times the Net Profit Before Interest, Tax and Depreciation (EBITDA) covers interest paid on debt and is used as an indicator of under‐capitalisation. The forecast interest coverage of 2.4:1 for 2008/2009 complies with the ASB Bank’s requirement that the interest rate coverage ratio does not fall below 1.5.

338 Waipa District Council
During May 2004 the shareholders of WRAL (of which Council has a 15.625% shareholding) authorised the company to issue further shares totalling $21.6 million to existing shareholders. This capital restructure was part of the WRAL Airport Development and has allowed WRAL to borrow at commercially favourable interest rates. Although at the time there were no plans to call up the capital, Council has recorded a contingent liability for $3.375 million for uncalled capital in its financial statements. With the loss of Air New Zealand as the international carrier, the resulting significant impact on operating revenues and the requirement to meet banking covenants, a portion of this uncalled capital will be called up from all five shareholders in July 2009. Council’s share of this call is $1.875 million, being 183,464 ordinary shares of $10.22 per share. The additional investment will be funded by borrowing, and the contingent liability will be reduced to $1.5 million.
Hamilton International Airport New Zealand Local Government Insurance Corporation (NZLGIC) NZLGIC is wholly owned by New Zealand city, district and regional councils. It provides a range of products and services to prevent loss and manage risk. Waipa District Council’s shareholding is 0.3%.

10‐year Plan (2009‐19) 339
Local Authority Shared Services Limited (LASS) Shareholders Local Authority Shared Services Limited (LASS) is jointly owned by 13 local authorities:
▪ Waikato Regional Council ▪ Hamilton City Council ▪ Franklin District Council ▪ Hauraki District Council ▪ Matamata‐Piako District Council ▪ Otorohanga District Council ▪ Rotorua District Council ▪ South Waikato District Council ▪ Taupo District Council ▪ Thames‐Coromandel District Council ▪ Waikato District Council ▪ Waipa District Council ▪ Waitomo District Council
Background The local authorities within the boundaries of the Waikato region have adopted shared services as a mechanism for providing back of office type services in a coordinated manner across the Region to leverage opportunities and deliver benefits. Over the period that LASS has been operating, the following positive outcomes have been achieved:
▪ Improved level and quality of service provided through the Shared Valuation Database Service;
▪ Coordinated approach to the provision of services; ▪ Reductions in the cost of services; ▪ Opportunity to develop new initiatives; ▪ Opportunity for all councils, irrespective of location or size, to benefit from joint initiatives;
and ▪ Economies of scale, resulting in cost savings, have been achieved in procurement.
There are two shared services currently operating. The Shared Valuation Database Service provides valuation data services to Councils and has been set up to ensure that valuation data is both accurate and current. The Waikato Regional Transport Model has been developed to collect information on traffic type and flows which will be used to develop a transport model for the Waikato region. New services will only be adopted where a business case shows that they provide some form of benefit to the shareholders. Council Policies and Objectives Relating to Council Controlled Organisations The Constitution of Local Authority Shared Services Limited sets out the principles and expectations around how the company will be governed and operated. While Council has no formal policies and objectives, it has become a shareholder on the basis that the company will develop products and services of significant benefit to Waipa residents and ratepayers.
340 Waipa District Council
Company Objectives The objective of the company is to provide Waikato region’s local authorities with a vehicle to procure shared services. It provides a mechanism for the development of new services which are available to any shareholder that chooses to join. It also provides those Councils that wish to develop new services with a company structure under which they can develop and promote services to other local authorities. Nature and Scope of Activities The nature and scope of the activities for the company is to:
a) Provide shared services to all local authorities within the Waikato region. b) Sell processes and systems as set up under individual agreements to local authorities outside
the Waikato region. c) Consider all opportunities to procure shared services that will benefit the community, either
through enhanced services and/or reduced cost. d) Give consideration to developing shared services that local authorities of the Region believe
are of value. The objective is to provide the most effective access to regional information that may be of value to the community using modern technology and processes.
e) Obtain a financial return from commercial users of information collected by councils. f) Explore all possible avenues to provide these services itself or contract them from other
parties, each depending on a rigorous business case and risk assessment. g) Provide opportunities for development of systems and processes that utilises intellectual
property developed by Councils and on selling data and services/systems to commercial users for a market based financial return.
Performance Targets Performance targets relate to the level of services that are current or under development and it is envisaged that these targets will change as new services are developed. The targets include:
▪ Positive cash flow will be maintained so that the equity ratio is maintained at a minimum of 40%.
▪ LASS shareholders will be surveyed annually to ensure that there is at least 90% satisfaction with the services provided.
▪ Expenditure shall not exceed that budgeted by more than 5% unless prior approval is obtained from the Directors.
▪ The Board will provide a written report on the business operations and financial position of the LASS on a six monthly basis.

10‐year Plan (2009‐19) 341
Section 9 ‐ ORGANISATIONAL SNAPSHOT
In this section: Introduction Your Councillors Elected Members Opportunities for
Community Involvement in Council Decision‐Making
Māori Involvement in Decision‐Making
Council Committees Community Boards
Management Structure

342 Waipa District Council
RESIDENTS
Pirongia Ward Consultative Committee
Maungatautari Reserve
Committee
Iwi Consultative Committee
Cambridge Community
Board
Te Awamutu Community
Board
Policy Committee
Regulatory Committee
Executive Committee
Strategic Planning &
Development Committee
Pirongia Reserves
Management Committee
District Promotions Committee
COUNCILMayor and 12 Councillors
Chief Executive
Introduction
This section provides an overview of the elected members and governance structures within the District. It also provides an overview of the Council management structure. Community input into Council decision‐making is vital, and this section shows ways that this can occur. It also outlines how Council supports and promotes Māori involvement in decision‐making. The elected Council members, consisting of the Mayor and 12 Councillors, represent the District’s five wards by providing input to Council plans and participating in decision‐making on the communities’ behalf. They also ensure that Council is working to achieve the aspirations of the District as outlined in the four wellbeing areas (social, cultural, economic and environmental). The Mayor and Councillors are appointed to various Council committees and subcommittees to consider and recommend policy to Council, and to monitor the implementation of policy and the operation of services relating to the particular function of the committee. Further details of these committees and subcommittees are included later in this section. Waipa District has two Community Boards, Cambridge and Te Awamutu. The Board members are elected by the communities they represent, with the responsibilities of the Boards being determined by the elected Council members. Further detail on the Community Boards is provided later in this section. The diagram below shows the relationships and structure described in this Introduction.
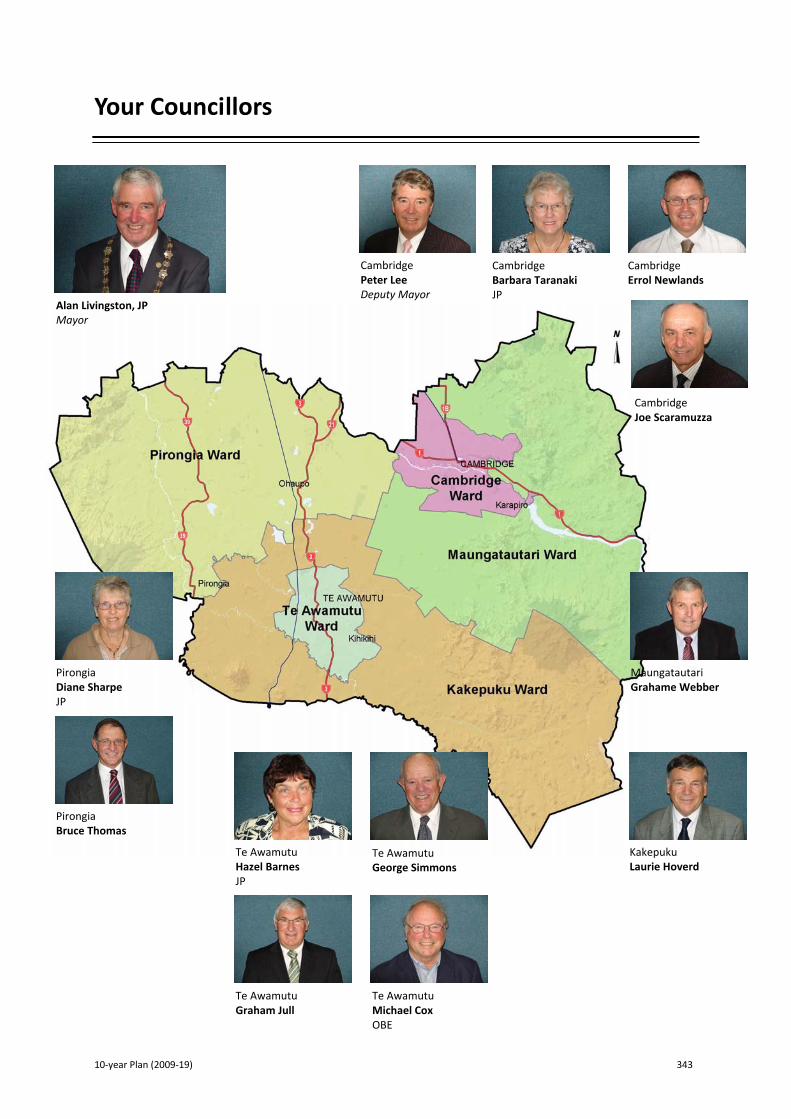
10‐year Plan (2009‐19) 343
Your Councillors
Alan Livingston, JP Mayor
Cambridge Peter Lee Deputy Mayor
Cambridge Joe Scaramuzza
Cambridge Barbara Taranaki JP
Cambridge Errol Newlands
Pirongia Diane Sharpe JP
Pirongia Bruce Thomas
Kakepuku Laurie Hoverd
Maungatautari Grahame Webber
Te Awamutu Hazel Barnes JP
Te Awamutu Graham Jull
Te Awamutu George Simmons
Te Awamutu Michael Cox OBE

344 Waipa District Council
Elected Members
Elected Council is supported by a corporate organisation, led by the Chief Executive and five Group Managers, with the Chief Executive being the only direct employee of the Council. Management and staff are responsible for managing service delivery and implementing Council’s decisions and policies. Refer to the Management Structure diagram on page 354. The elected members and Council staff work together, at different levels, to decide what activities should be undertaken to enable progress towards the achievement of Waipa’s Community Outcomes and Council’s vision for the District. This work needs to occur in consultation with the community and key stakeholders, while keeping in mind competing priorities, timeframes, resources and decisions of Council. Council’s role is to weigh up the options and ensure ratepayers’ money is spent in the most effective way. This means balancing the needs of individuals with the needs of the community, taking into account available resources, while accounting for the implications of all its decisions on future generations.

10‐year Plan (2009‐19) 345
Opportunities for Community Involvement in Council Decision‐Making
Each year Council offers a number of opportunities for the community to participate in its decision‐making processes, including formal consultation opportunities such as the 10‐year Plan and Annual Plan submission processes. Council also advises Waipa residents of other proposals that are available for public submission through the monthly local newspaper insert “Word on Waipa”, and the Council website www.waipadc.govt.nz. Elected members, key Council staff, and Community Board members can be contacted throughout the year if people want to discuss issues or have information to contribute. Council has a formal structure to enable Māori involvement in Council decision‐making, and this is outlined on the following page.

346 Waipa District Council
Māori Involvement in Decision‐Making
Council has developed a policy and structure with Māori to facilitate participation by Māori in local government decision‐making processes. The Council has a governance structure which includes the Iwi Consultative Committee. The Committee consists of the Mayor, Deputy Mayor, Chairpersons of the Regulatory and Policy Committees, and representatives of hapū within the District, the Chairperson of Ngā Iwi Toopu o Waipa, and one of three Kaumatua representatives. The Consultative Committee considers all significant matters, particularly in relation to the development of policy, and then makes appropriate recommendations for Council’s consideration. Council has a formal agreement with Ngā Iwi Toopu o Waipa for the purpose of reviewing all resource consent applications and considering other matters of significance. This arrangement recognises the mandate Ngā Iwi Toopu o Waipa has in acting on behalf of iwi within the District.

10‐year Plan (2009‐19) 347
Council Committees
Waipa District Council has nine standing committees; these committees and their membership are outlined in this section. Executive Committee The purpose of this Committee is to consider and make decisions on urgent matters that arise between Council meetings or matters referred by Council. It comprises the Mayor, Deputy Mayor and chairpersons of the Policy, Strategic Planning and Development, and Regulatory Committees.
Mayor Alan Livingston JP Chairperson
Cr Peter Lee Deputy Mayor
Cr Graham Jull Chairperson Policy Committee
Cr Grahame Webber Chairperson Strategic Planning and Development Committee
Cr Diane Sharpe JP Chairperson Regulatory Committee
Policy Committee The purpose of this Committee is to consider policy and strategy with respect to all Council’s functions, duties and responsibilities prior to a recommendation to Council for approval or adoption. It comprises the entire Council and one iwi representative.
Cr Graham Jull Chairperson
Mayor Alan Livingston JP
Cr Hazel Barnes JP
Cr Michael Cox OBE
Cr Laurie Hoverd
Cr Peter Lee
Cr Errol Newlands
Cr Joe Scaramuzza
Cr Diane Sharpe JP
Cr George Simmons
Cr Barbara Taranaki JP
Cr Bruce Thomas
Cr Grahame Webber
Valerie Ingley Iwi Representative
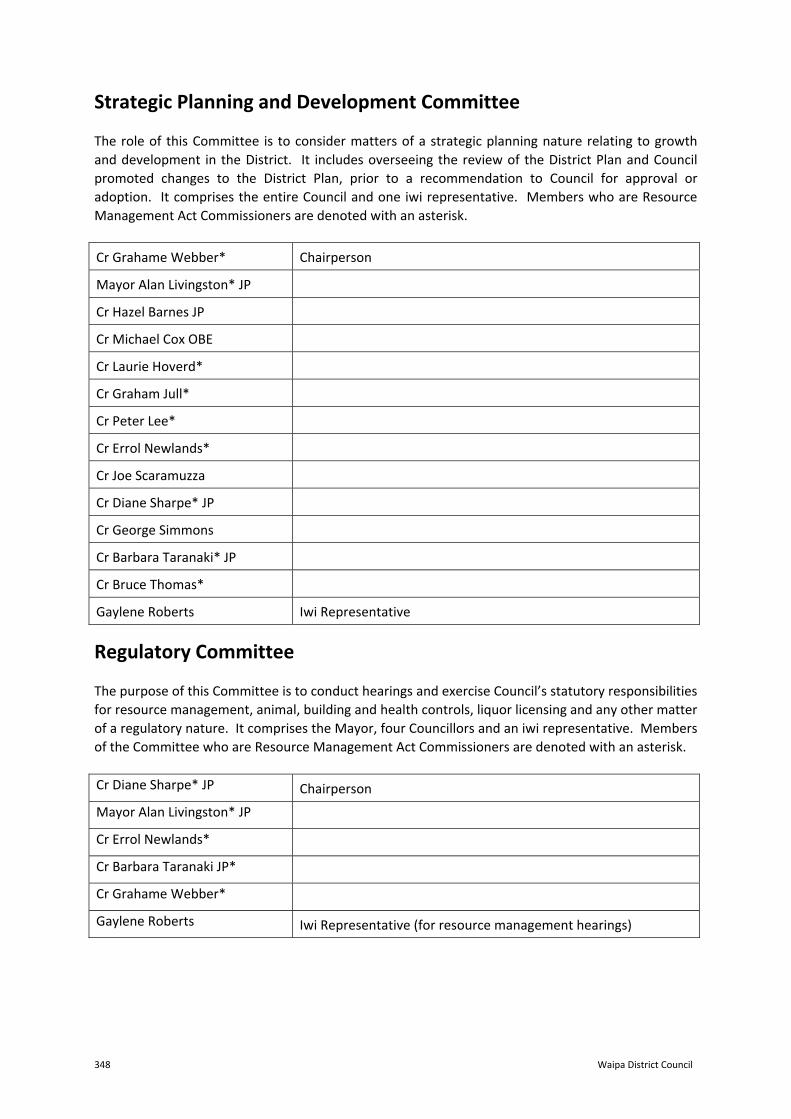
348 Waipa District Council
Strategic Planning and Development Committee The role of this Committee is to consider matters of a strategic planning nature relating to growth and development in the District. It includes overseeing the review of the District Plan and Council promoted changes to the District Plan, prior to a recommendation to Council for approval or adoption. It comprises the entire Council and one iwi representative. Members who are Resource Management Act Commissioners are denoted with an asterisk.
Cr Grahame Webber* Chairperson
Mayor Alan Livingston* JP
Cr Hazel Barnes JP
Cr Michael Cox OBE
Cr Laurie Hoverd*
Cr Graham Jull*
Cr Peter Lee*
Cr Errol Newlands*
Cr Joe Scaramuzza
Cr Diane Sharpe* JP
Cr George Simmons
Cr Barbara Taranaki* JP
Cr Bruce Thomas*
Gaylene Roberts Iwi Representative
Regulatory Committee The purpose of this Committee is to conduct hearings and exercise Council’s statutory responsibilities for resource management, animal, building and health controls, liquor licensing and any other matter of a regulatory nature. It comprises the Mayor, four Councillors and an iwi representative. Members of the Committee who are Resource Management Act Commissioners are denoted with an asterisk. Cr Diane Sharpe* JP Chairperson
Mayor Alan Livingston* JP
Cr Errol Newlands*
Cr Barbara Taranaki JP*
Cr Grahame Webber*
Gaylene Roberts Iwi Representative (for resource management hearings)

10‐year Plan (2009‐19) 349
Pirongia Ward Consultative Committee The purpose of this Committee is to allocate funds from the Pirongia Ward minor community works budget, to consider and approve applications for community grant funding; to approve projects for reserve development funding, and to consider draft Annual Plans and draft 10‐year Plans. Mayor Alan Livingston JP Chairperson
Cr Diane Sharpe JP
Cr Bruce Thomas
One representative from each of the following Ratepayer/Resident Associations:
John Turnwald Ohaupo
John Wood Pirongia
Alan Stretton Te Pahu
Maungatautari Reserve Committee The purpose of this Committee is to facilitate communication between Reserve stakeholders, advise Council on reserve management issues, oversee the activities of the Maungatautari Ecological Island Trust, and oversee the preparation of an updated Reserve Management Plan. It comprises of two Councillors, six tangata whenua representatives, two landowner representatives, and a representative from each of the Department of Conservation, Maungatautari Ecological Island Trust, and the Scientific Community.
Cr Grahame Webber Chairperson
Cr Laurie Hoverd Waipa District Councillor
Ted Tauroa Pohara Marae
Rose Smith Parawera Marae
Peter Tairi Maungatautari Marae
Willie Clarke Ngati Haua
Jim Mylchreest MEI Trust
to be confirmed Department of Conservation
Chris Smuts‐Kennedy Scientific Community
Selwyn MacKinder Landowner
Barry Townend Landowner

350 Waipa District Council
Iwi Consultative Committee The purpose of this Committee is to facilitate communications between Council and tangata whenua. The Committee will consider any matter impacting on the interests of tangata whenua and advise Council on Treaty of Waitangi implications for policies and activities of Council. It comprises the Mayor, Deputy Mayor, Chairpersons of the Regulatory and Policy Committees, Council’s Chief Executive, the Chairperson of Ngā Iwi Toopu o Waipa, members appointed through Ngā Iwi Toopu o Waipa to represent the hapū of the Waipa District, and a Kaumatua representative. Council recently resolved that iwi representatives appointed to the Policy and Regulatory Committees should also be Iwi Consultative Committee members as of right.
Mayor Alan Livingston JP Chairperson
Cr Peter Lee Deputy Mayor
Cr Diane Sharpe JP Regulatory Committee Chairperson
Cr Graham Jull Policy Committee Chairperson
John Inglis Chief Executive (notwithstanding clause 31 (4)(b) Schedule 7 LGA 2002)
Charlie Maikuku Kaumatua
Chairman, Ngā Iwi Toopu o Waipa Gaylene Roberts
Parawera Marae
Wiremu Karaka (Clarke) Ngati Haua
to be confirmed Purekireki Marae (Pirongia)
Harold Maniapoto Puniu Marae
Valerie Ingley Puniu Marae (proxy)
Doris Walters Te Kopua Marae
Rose Tuineau Maungatautari Marae
Louise Doyle Te Kopua and Ngati Ngawaero (proxy)
George Searancke Ngati Ngawaero
Pirongia Reserves Management Committee The purpose of this Committee is to oversee the management and development of three Pirongia reserves (Sections 1, 167 and 550) as authorised by the Department of Conservation. The Committee comprises the Mayor, two Pirongia Ward Councillors, two persons nominated by the Pirongia Residents and Ratepayers Association, one person nominated by Purekireki Marae, and one person nominated by Te Kauhanganui o Waikato.

10‐year Plan (2009‐19) 351
Mayor Alan Livingston JP Chairperson
Cr Diane Sharpe JP Pirongia Ward Councillor
Cr Bruce Thomas Pirongia Ward Councillor
Sabine Owen Pirongia Representative
Stuart Henderson Pirongia Representative
Sally Uerata Purekireki Marae
Haupai Puke Purekireki Marae
District Promotions Committee The purpose of this Committee is to consider and approve, in accordance with specific criteria, applications for financial assistance for the promotion and sponsorship of significant events within the Waipa District.
Mayor Alan Livingston JP Chairperson
Cr Peter Lee Deputy Mayor
Cr Graham Jull Policy Committee Chairperson
Future Proof Joint Committee The purpose of this Committee is to establish a strategy to manage growth in the Waipa and Waikato districts and Hamilton City areas and ensure integration between land use and infrastructure provision.
Doug Arcus Independent Chairperson
Mayor Alan Livingston JP Waipa District Council Mayor
Cr Diane Sharpe JP Waipa District Councillor
Mayor Bob Simcock JP Hamilton City Mayor
Cr Maria Westphal Hamilton City Councillor
Cr Allan Sanson Waikato District Councillor
Cr Clint Baddeley Waikato District Deputy Mayor
Cr Peter Buckley Environment Waikato Chairperson
Cr Paula Southgate Environment Waikato Councillor
Tukoroirangi Morgan Tainui Waka Alliance
To be confirmed Nga Karu Atua o te Waka

352 Waipa District Council
Community Boards
There are two Community Boards – Cambridge, which serves the Cambridge and Maungatautari Wards, and Te Awamutu which serves the Te Awamutu and Kakepuku Wards. The Community Boards are not Council committees, they are separate statutory authorities established under Part 4 of the Local Government Act 2002. Their purpose is to:
▪ Represent and act as an advocate for the interests of its community; ▪ Consider and report on all matters referred to it by the Council or any matter of interest or
concern to the Community Board; ▪ Overview service delivery throughout the community area; ▪ Prepare an annual submission to Council for expenditure within the community; and ▪ Perform such functions as are delegated to it by Council.
The Community Boards comprise members elected by the communities they serve and appointments made by Council. Te Awamutu Community Board
Dean Taylor Chairperson
Marcus Gower
Norris Hall
Richard Hurrell
Colin Pinkerton
Cr Hazel Barnes JP Council Appointed
Cr Laurie Hoverd Council Appointed
Cambridge Community Board Rob Feisst Chairperson
Elwyn Andree‐Wiltons
John Bishop
Brent Nielson
Richard Wright
Cr Barbara Taranaki JP Council Appointed
Cr Grahame Webber Council Appointed

10‐year Plan (2009‐19) 353
The Cambridge Community Board has the following committees: Sister Cities The purpose of this Committee is to positively promote friendly exchanges and to encourage mutually beneficial understanding in the fields of economic development, tourism, culture, education, science, technology and sport with our sister cities, Bihoro in Japan and Le Quesnoy in France.
Light Up Cambridge The purpose of this Committee is to initiate and progress Christmas and/or other lighting projects in Cambridge. Reserve Landscape The purpose of this Committee is to plan and organise, with the approval of Council and in conjunction with Council staff, the facilitation of the development and renewal of the Cambridge greenbelt reserve management plan. ANZAC The purpose of this Committee is to organise the annual ANZAC Day commemorations.

354 Waipa District Council
Management Structure
The Management team structure consists of the Chief Executive, five Group Managers and the respective department managers.
DEPUTY CHIEF EXECUTIVE &GROUP MANAGER: ENVIRONMENTAL &
COMMUNITY SERVICES
Garry Dyet
GROUP MANAGER:INFRASTRUCTURE
MANAGEMENT & PLANNING
John Mills
GROUP MANAGER: ENGINEERING SERVICE
DELIVERY
John Kerr
GROUP MANAGER: FINANCE & CORPORATE
SERVICES
Shelagh Kew
GROUP MANAGER:STRATEGIC POLICY &
PLANNING
Ross McNeil
Environmental Safety ManagerJennie McFarlane
Building Control ManagerGary Boys
Planning Services ManagerWayne Allan
Library ManagerAlison Gordon
Parks & Recreation ManagerMax Ward
Museums & Heritage ManagerJan White
Strategic Planning Manager Gary Knighton
Corporate Planning ManagerTracey Hancock
Communications & Marketing ManagerBrian Aspin
Property ManagerColin Windleborn
Development Engineering ManagerBill Mitchelmore
Strategic Infrastructure ManagerLorraine Kendrick
Utilities Service Delivery ManagerBob Shaw
Roading Service Delivery ManagerPaul Chin
Financial Accounting ManagerYvonne Simpson
Financial Planning ManagerDeborah Frederick
Customer Relations & Information ManagerBobbie Moughan
Information Technology (IT) ManagerMark Hogan
Human Resources (HR) ManagerGill Riley
Revenue ManagerMargaret Maher
CHIEF EXECUTIVEJohn Inglis
Organisational Development Manager
Rebecca Leidig

10‐year Plan (2009‐19) 355
GLOSSARY
In this section: Explanations of terms used
in the 10‐year Plan
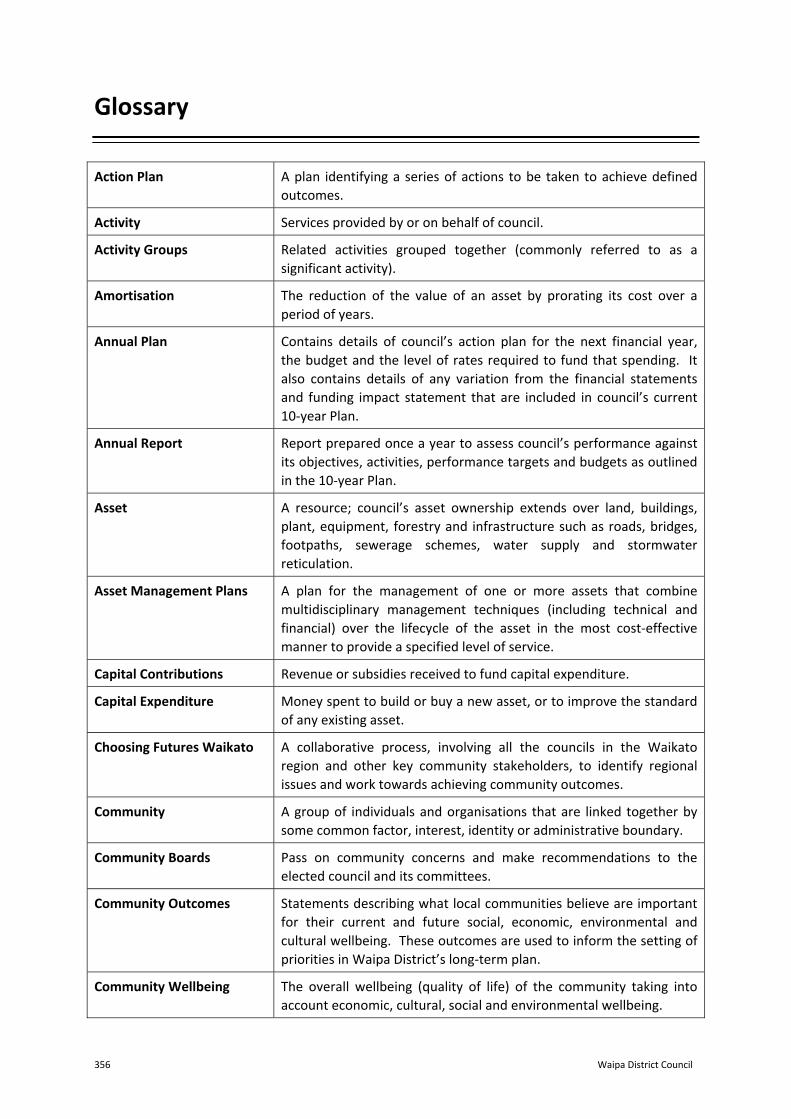
356 Waipa District Council
Glossary
Action Plan A plan identifying a series of actions to be taken to achieve defined outcomes.
Activity Services provided by or on behalf of council.
Activity Groups Related activities grouped together (commonly referred to as a significant activity).
Amortisation The reduction of the value of an asset by prorating its cost over a period of years.
Annual Plan Contains details of council’s action plan for the next financial year, the budget and the level of rates required to fund that spending. It also contains details of any variation from the financial statements and funding impact statement that are included in council’s current 10‐year Plan.
Annual Report Report prepared once a year to assess council’s performance against its objectives, activities, performance targets and budgets as outlined in the 10‐year Plan.
Asset A resource; council’s asset ownership extends over land, buildings, plant, equipment, forestry and infrastructure such as roads, bridges, footpaths, sewerage schemes, water supply and stormwater reticulation.
Asset Management Plans A plan for the management of one or more assets that combine multidisciplinary management techniques (including technical and financial) over the lifecycle of the asset in the most cost‐effective manner to provide a specified level of service.
Capital Contributions Revenue or subsidies received to fund capital expenditure.
Capital Expenditure Money spent to build or buy a new asset, or to improve the standard of any existing asset.
Choosing Futures Waikato A collaborative process, involving all the councils in the Waikato region and other key community stakeholders, to identify regional issues and work towards achieving community outcomes.
Community A group of individuals and organisations that are linked together by some common factor, interest, identity or administrative boundary.
Community Boards Pass on community concerns and make recommendations to the elected council and its committees.
Community Outcomes Statements describing what local communities believe are important for their current and future social, economic, environmental and cultural wellbeing. These outcomes are used to inform the setting of priorities in Waipa District’s long‐term plan.
Community Wellbeing The overall wellbeing (quality of life) of the community taking into account economic, cultural, social and environmental wellbeing.

10‐year Plan (2009‐19) 357
Council Controlled Organisations (CCOs)
An company or entity in which one or more local authorities has a shareholding of 50 per cent or more, voting rights of 50 per cent or more, or the right to appoint 50 per cent or more of the directors. Section 6(4) of the Local Government Act 2002 details entities which are exceptions.
Development Contributions Payment from developers to help fund new infrastructure required by growth (as set out in the Local Government Act 2002).
District Plan Required by the Resource Management Act 1991, it defines how resources and development will be managed by the District. The Plan is based on economic, cultural, social and environmental wellbeing.
Equity The market value of assets less any liabilities.
Funding Impact Statement A financial statement that discloses the revenue and financial mechanisms that council proposes to use.
Future Proof The term used to refer to the growth strategy that is being prepared for the sub‐region. Included in the sub‐region are the following territorial authorities – Waipa District Council, Waikato District Council, Environment Waikato and Hamilton City Council.
General Rate A charge calculated using the rateable value of property that is paid to council to fund its general services but not services funded by targeted rates, fees or charges.
Governance Is how council engages with the community, oversees the effective and responsible management of resources, delivers services, and sets the strategic direction for the District.
Hapū A cluster of related whanau (extended family), descended from a single ancestor that has collective decision‐making rights over its territory.
Hearing A meeting at which members of the public speak to elected representatives and/or staff about an issue.
Indicator A measure or combination of measures, either qualitative or quantitative, against which performance or progress can be assessed.
Interest Interest on bank accounts, overdrafts and debt.
Iwi Larger than the hapū – a cluster of related hapu, descended from a single ancestor, varying in size.
Land Transport New Zealand Subsidy
A subsidy provided by Land Transport New Zealand for road projects or maintenance.
Levels of Service (LOS) The extent of a service provided by council.
Local Authority A regional, district or city council.
Local Government Act 2002 The legislation that defines the powers and responsibilities of local government organisations (regional, city and district councils).
Long Term Council Community Plan (LTCCP)
Refer to 10‐year Plan
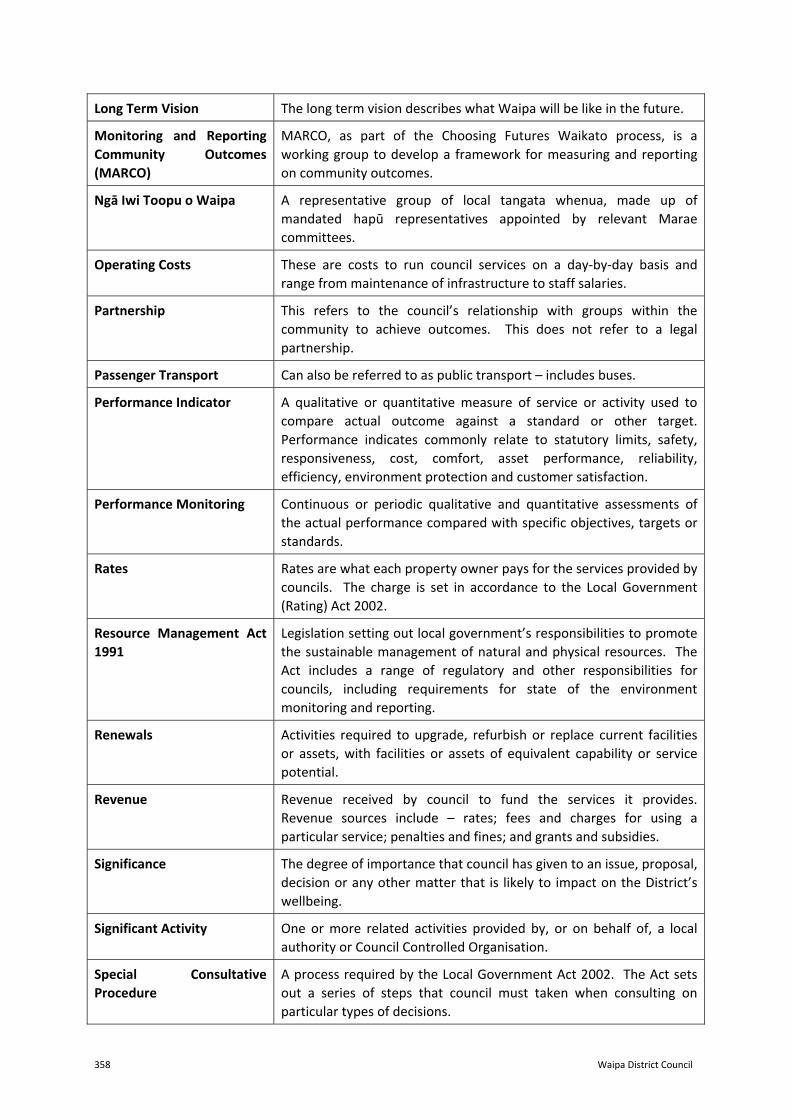
358 Waipa District Council
Long Term Vision The long term vision describes what Waipa will be like in the future.
Monitoring and Reporting Community Outcomes (MARCO)
MARCO, as part of the Choosing Futures Waikato process, is a working group to develop a framework for measuring and reporting on community outcomes.
Ngā Iwi Toopu o Waipa A representative group of local tangata whenua, made up of mandated hapū representatives appointed by relevant Marae committees.
Operating Costs These are costs to run council services on a day‐by‐day basis and range from maintenance of infrastructure to staff salaries.
Partnership This refers to the council’s relationship with groups within the community to achieve outcomes. This does not refer to a legal partnership.
Passenger Transport Can also be referred to as public transport – includes buses.
Performance Indicator A qualitative or quantitative measure of service or activity used to compare actual outcome against a standard or other target. Performance indicates commonly relate to statutory limits, safety, responsiveness, cost, comfort, asset performance, reliability, efficiency, environment protection and customer satisfaction.
Performance Monitoring Continuous or periodic qualitative and quantitative assessments of the actual performance compared with specific objectives, targets or standards.
Rates Rates are what each property owner pays for the services provided by councils. The charge is set in accordance to the Local Government (Rating) Act 2002.
Resource Management Act 1991
Legislation setting out local government’s responsibilities to promote the sustainable management of natural and physical resources. The Act includes a range of regulatory and other responsibilities for councils, including requirements for state of the environment monitoring and reporting.
Renewals Activities required to upgrade, refurbish or replace current facilities or assets, with facilities or assets of equivalent capability or service potential.
Revenue Revenue received by council to fund the services it provides. Revenue sources include – rates; fees and charges for using a particular service; penalties and fines; and grants and subsidies.
Significance The degree of importance that council has given to an issue, proposal, decision or any other matter that is likely to impact on the District’s wellbeing.
Significant Activity One or more related activities provided by, or on behalf of, a local authority or Council Controlled Organisation.
Special Consultative Procedure
A process required by the Local Government Act 2002. The Act sets out a series of steps that council must taken when consulting on particular types of decisions.

10‐year Plan (2009‐19) 359
Strategic Plan An explanation of the overall direction and emphasis that councils’ activities and programmes will take to realise the long‐term vision.
Strategy A plan of action designed to guide progress towards the long term vision.
Submission Feedback or proposal from an individual or group on an issue.
Sustainability Using our resources in such a way that we meet the needs of the present generation without compromising the ability of future generations to meet their own needs.
Tangata Whenua Māori people who belong to a particular area by ancestral connection.
Targeted Rate A rate that is levied to fund a particular service or facility.
Te Kauhanganui o Waikato Kauhanganui is made up of marae representatives from throughout the wider region of Tainui with emphasis on those who faced raupatu (land confiscation). Each marae is represented by two delegates, one Kaumatua (elder) and one rangatahi (youth), who are appointed for a set term.
Territorial Local Authority (TLA)
A city council or district council, as listed in the Local Government Act 2002.
Ward An administrative and electoral area of the District. There are five wards in our District – Cambridge; Te Awamutu; Pirongia; Maungatautari; and Kakepuku.
Waipa 2050 Waipa 2050 is a project through which a review of the Waipa District growth strategy will be reviewed. The work will focus on looking at growth in the District and how to best manage it. Also included in this work is the development of town concept plans for Cambridge, Te Awamutu/Kihikihi, Pirongia and Ohaupo.
Wellbeings The four wellbeings refer to the social, economic, environmental and cultural wellbeing of communities in the present and for the future.
Vested Assets An existing right to the immediate or future possession of property, resources, cash, stock and goodwill.
10‐year Plan A strategic plan, covering at least 10 years, that describes a local authority’s activities and the community outcomes of the authority’s district or region. A council’s 10‐year Plan is the basis for its accountability to the community.

360 Waipa District Council
10‐year Plan (2009‐19) 361
APPENDIX
In this section: FutureProof Proposed Disposal of
Endowment Land Changes Made From the
Draft 10‐year Plan List of Submitters to the
Draft 10‐year Plan Auditor’s Report

362 Waipa District Council
Future Proof
Hamilton City Council, Environment Waikato, Waipa District Council and Waikato District Council have developed a sub‐regional growth strategy, ‘Future Proof’. This strategy covers the administrative areas of the three territorial authorities and the associated area of Environment Waikato. Other key organisations and groups involved in the project include tangata whenua, New Zealand Transport Agency and Matamata‐Piako District Council. With the population of the sub region predicted to nearly double over the next 50 years, from 223,000 people to 438,000 people, collective planning and action between government, residents and businesses is critical to its long‐term viability. There are complex issues to consider including future urban and rural land use, natural and cultural resources, roads and essential infrastructure. This Strategy aims to manage growth in a collaborative manner for the benefit of the Future Proof area both from a community and physical perspective. The strategy will also provide a platform for ongoing co‐operation and implementation. The Strategy is underpinned by a number of key principles that that will take the sub‐region forward and contribute to the effective management of growth, including:
▪ Protect high quality farmland for productive use ▪ Enhance ecological areas, landscapes, cultural and heritage values ▪ Restore the health and wellbeing of the Waikato River ▪ Ensure a low energy, low carbon, sustainable environment ▪ Enable housing and lifestyle choices ▪ Reinforce Hamilton’s city heart as the commercial, l centre of the sub‐region ▪ Ensure local communities are supported by their town centres ▪ Ensure that green spaces separate settlements ▪ Protect existing and future infrastructure and transport corridors ▪ Direct development away from hazard areas and mineral locations
The Strategy provides a framework for co‐operatively managing growth and setting goals for future implementation. This will allow the costs and resources required to fund and manage infrastructure such as transport, wastewater, stormwater, recreation and cultural facilities to be identified and provided for.

10‐year Plan (2009‐19) 363
Each of the strategy partners will be responsible for the implementation of the strategy and the continued involvement of tangata whenua, other agencies, the private sector and the wider community. Community Feedback In October 2008, the sub‐regional community had an opportunity to feedback on three scenarios outlined in the document “Our Place”. The three scenarios were:
▪ Business as Usual ‐ which allowed growth to simply carry on as it does now ▪ Compact Settlement ‐ which advocated a managed increase in the number of households in
an urban area and in some cases increasing the density of housing. ▪ Concentrated Growth ‐ which suggested a major shift to intensify housing especially in
Hamilton city. Each of the scenarios was assessed against a number of criteria that reflect the vision of the sub‐region, including:
▪ Is a place where natural environments, landscapes and heritage are protected and a healthy Waikato River is at the heart of the region’s identity
▪ Has sustainable resource use ▪ Has a diverse and vibrant metropolitan centre strongly tied to distinctive, thriving towns and
rural communities ▪ Has affordable and sustainable infrastructure ▪ Has productive partnerships within its community, including tangata whenua
Many of the comments made and discussions helped the project team form the draft Strategy. The Draft Strategy It is well recognised and supported by the consultation feedback that scenario one – Business as Usual – is not sustainable. A combination of Scenarios 2 and 3 has been chosen as the preferred scenario and the draft Strategy was prepared on this basis. The draft Strategy focused on effective governance across the sub‐region that shows strong leadership and integration between the key parties. The aim being to create a place of choice for those looking for opportunities to live, work, invest and visit, with a diverse and vibrant metropolitan centre linked to thriving towns and rural communities. The Strategy will assist with the protection of natural environments, landscapes and heritage sites as well as ensuring the partners work closely with tangata whenua to help restore the health of the Waikato River. Infrastructure will be well planned for the future to ensure it is affordable, efficient and able to cope with growth as and when it occurs.

364 Waipa District Council
Submissions were sought on the draft Strategy and hearings and deliberations held. The opportunity to make submissions on the draft Strategy was a separate process from the draft 10‐year Plan submission process. If you wish to find out more about Future Proof, you can obtain further information from Waipa District Council, Hamilton City Council, Waikato District Council or Environment Waikato offices or the website www.futureproof.org.nz. The key features of this Strategy include:
▪ A focus on providing housing and lifestyle choice. ▪ Increased densities in new residential development and more intensive redevelopment of
existing urban areas that will reduce the need for dependence on cars with more people walking, cycling and using public transport.
▪ Hamilton city will be a vibrant and lively place that people want to live, work and play in and will retain its position as the centre of New Zealand’s fourth largest urban area. At its heart it will have a vibrant and diverse mix of uses.
▪ The sub‐region’s towns will retain their individual identities as distinct towns that support people living, working and playing in. They will have thriving business centres that provide local employment opportunities.
▪ Development is directed away from hazard areas. ▪ Green spaces separate settlements. ▪ Planning focuses on resilience of communities and providing for a low energy and low carbon
future. ▪ Protection of future infrastructure corridors, energy sites and mineral locations. ▪ Protection of versatile and productive farmland through limited rural lifestyle development
around towns. ▪ Maintenance and enhancement of biodiversity. ▪ Integration of transport and land use planning.
Links to other Local Growth Strategies Future Proof is not a strategy that stands alone; it is a key component of the creation of a sustainable region for the next 50 years. Future Proof will provide an overall framework for aligning other plans and strategies of local and central government agencies and other organisations that deal with growth. Other strategy documents that will be influenced by Future Proof include the Regional Transport Strategy, each of the partner council’s growth strategies, long‐term community plans (10‐year Plans), district plans and the Regional Policy Statement. The Future Proof strategy will be implemented through:
▪ The Environment Waikato Regional Policy Statement ▪ The Environment Waikato Regional Transport Programme and Regional Land Transport
Strategy ▪ Long Term Council Community Plans ▪ City and District Growth Strategies ▪ District Plans

10‐year Plan (2009‐19) 365
City and District Growth Strategies are being developed in parallel with the Future Proof project and will be aligned with Future Proof. The focus of these strategies is:
▪ Implementation within settlements ▪ Local environmental constraints and opportunities ▪ Distribution and timing of development
City and District Growth Strategies will be implemented through:
▪ Long Term Council Community Plan ▪ District Plans: Structure Plans and Zoning
Strategy Implementation The success of any strategy is reliant upon an efficient and integrated planning process. It is essential that the community has an opportunity to participate and provide input into any decision making process. Implementation is an ongoing process that will continue to be addressed as part of the partner council’s own programmes, plans and strategies. It will also be important to continue to engage and involve tangata whenua, other government and non‐government agencies, the private sector, and the wider community. Integration at this phase is critical to the success of Future Proof as it involves identification of key funding options for significant infrastructure including roading, water, wastewater, stormwater and recreation and cultural facilities. Strategy implementation requires ongoing partnerships and establishing the entities responsible for managing implementation and monitoring outcomes. Future Proof’s success will be determined by the long‐term, formal commitment to collaboration between the key agencies and authorities. information regarding the Future Proof Strategy can be found on the website www.futureproof.org.nz or at Council offices and local libraries throughout the sub‐region.

366 Waipa District Council
Proposed Disposal of Endowment Land
The properties Council intends to dispose of are listed below, as required by section 141(b) of the Local Government Act 2002. The proceeds of any sales will be reinvested, including the development of community facilities for the long term benefit of the District, such as the Cambridge Community Pool, Gecks Reserve and the Te Awamutu Cultural Centre. If the purpose a property was vested in Council for, differs from the purpose to which the proceeds of any sale will be put, Council will seek approval from the Minister of Local Government under section 140(4)(a)(ii) of the Act.
LOCATION LEGAL DESCRIPTION LAND AREA (HA)
Addison St Allotment 8, Town of Cambridge West 1.6187
Burns St Allotment 199, Town of Cambridge West 0.215
Cnr Burns St / Thompson St Lot 2, DPS 52341 1.054
899 Maungatautari Rd (ex Geck Farm)
Lot 2, DPS 89441 40.58
Cnr Taylor / Vogel / King St Part Allotment 505, Town of Cambridge East 0.4045
Cnr Taylor / Vogel / King St Part Allotment 510, Town of Cambridge East tbc *
Cnr Taylor / Vogel / King St Part Allotment 511, Town of Cambridge East tbc *
Cnr Taylor / Vogel / King St Allotment 508, Town of Cambridge East 0.4047
Bath St Allotment 601a, Town of Cambridge East 0.7765
312 Roche St Lot 9, DPS 35638 0.0513
387 Roche St Allotment 84, Village of Te Awamutu 0.1012
387 Roche St Allotment 86, Village of Te Awamutu 0.1012
387 Roche St Allotment 88, Village of Te Awamutu 0.1012
337 Roche St Allotment 90, Village of Te Awamutu 0.1012
65 Bradley Pl Part Allotment 399, Parish of Mangapiko 0.1411
65 Bradley Pl Lot 37, DPS 20180 0.0129
1244 Rewi St Part Allotment 399, Parish of Mangapiko 2.114
Kane St Section 517, Town of Pirongia East 6.0096
Baffin St Section 123, Town of Pirongia East 0.3541
* A survey of this land will be undertaken to determine the size.
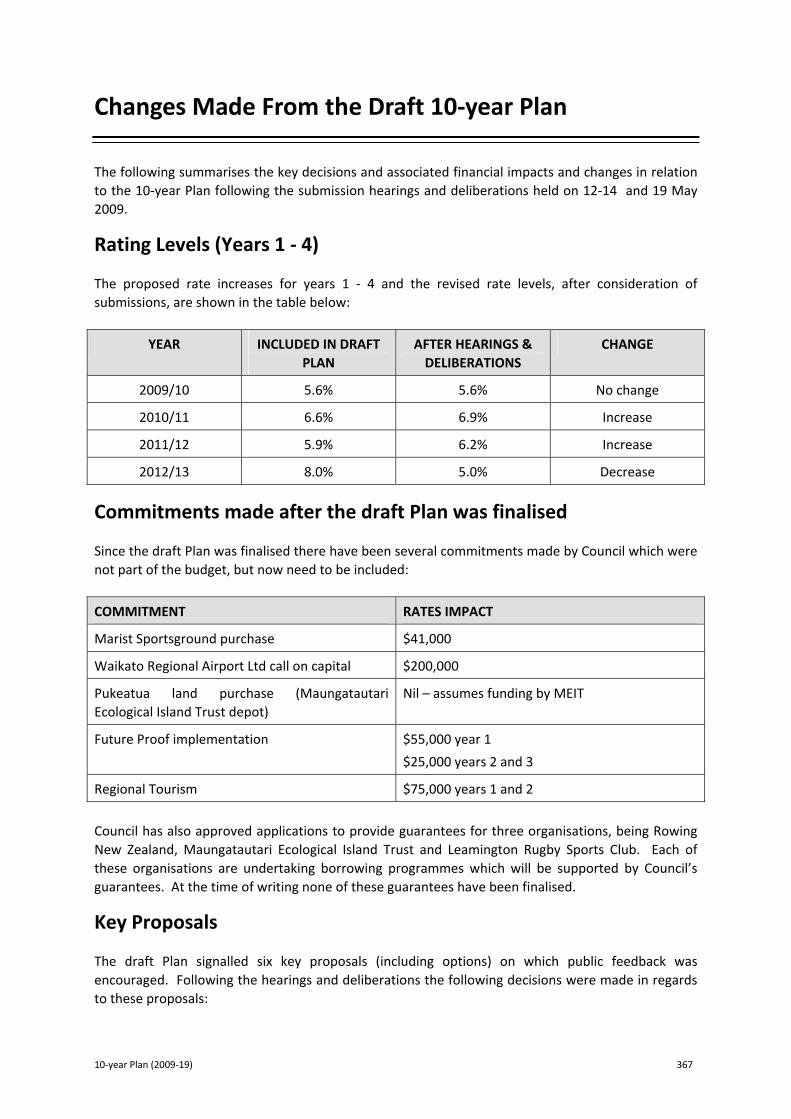
10‐year Plan (2009‐19) 367
Changes Made From the Draft 10‐year Plan
The following summarises the key decisions and associated financial impacts and changes in relation to the 10‐year Plan following the submission hearings and deliberations held on 12‐14 and 19 May 2009. Rating Levels (Years 1 ‐ 4) The proposed rate increases for years 1 ‐ 4 and the revised rate levels, after consideration of submissions, are shown in the table below:
YEAR INCLUDED IN DRAFT PLAN
AFTER HEARINGS & DELIBERATIONS
CHANGE
2009/10 5.6% 5.6% No change
2010/11 6.6% 6.9% Increase
2011/12 5.9% 6.2% Increase
2012/13 8.0% 5.0% Decrease
Commitments made after the draft Plan was finalised Since the draft Plan was finalised there have been several commitments made by Council which were not part of the budget, but now need to be included:
COMMITMENT RATES IMPACT
Marist Sportsground purchase $41,000
Waikato Regional Airport Ltd call on capital $200,000
Pukeatua land purchase (Maungatautari Ecological Island Trust depot)
Nil – assumes funding by MEIT
Future Proof implementation $55,000 year 1
$25,000 years 2 and 3
Regional Tourism $75,000 years 1 and 2
Council has also approved applications to provide guarantees for three organisations, being Rowing New Zealand, Maungatautari Ecological Island Trust and Leamington Rugby Sports Club. Each of these organisations are undertaking borrowing programmes which will be supported by Council’s guarantees. At the time of writing none of these guarantees have been finalised. Key Proposals The draft Plan signalled six key proposals (including options) on which public feedback was encouraged. Following the hearings and deliberations the following decisions were made in regards to these proposals:
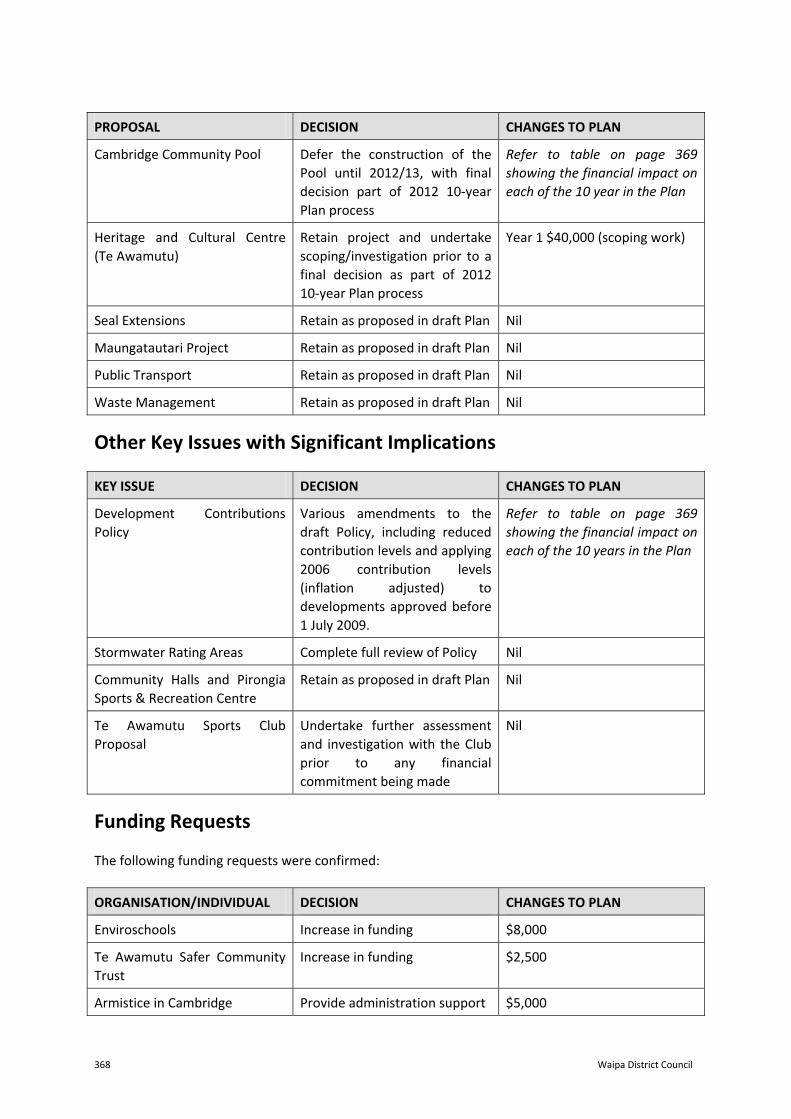
368 Waipa District Council
PROPOSAL DECISION CHANGES TO PLAN
Cambridge Community Pool Defer the construction of the Pool until 2012/13, with final decision part of 2012 10‐year Plan process
Refer to table on page 369 showing the financial impact on each of the 10 year in the Plan
Heritage and Cultural Centre (Te Awamutu)
Retain project and undertake scoping/investigation prior to a final decision as part of 2012 10‐year Plan process
Year 1 $40,000 (scoping work)
Seal Extensions Retain as proposed in draft Plan Nil
Maungatautari Project Retain as proposed in draft Plan Nil
Public Transport Retain as proposed in draft Plan Nil
Waste Management Retain as proposed in draft Plan Nil
Other Key Issues with Significant Implications
KEY ISSUE DECISION CHANGES TO PLAN
Development Contributions Policy
Various amendments to the draft Policy, including reduced contribution levels and applying 2006 contribution levels (inflation adjusted) to developments approved before 1 July 2009.
Refer to table on page 369 showing the financial impact on each of the 10 years in the Plan
Stormwater Rating Areas Complete full review of Policy Nil
Community Halls and Pirongia Sports & Recreation Centre
Retain as proposed in draft Plan Nil
Te Awamutu Sports Club Proposal
Undertake further assessment and investigation with the Club prior to any financial commitment being made
Nil
Funding Requests The following funding requests were confirmed:
ORGANISATION/INDIVIDUAL DECISION CHANGES TO PLAN
Enviroschools Increase in funding $8,000
Te Awamutu Safer Community Trust
Increase in funding $2,500
Armistice in Cambridge Provide administration support $5,000

10‐year Plan (2009‐19)
369
Summary of Significant Financial Changes Since preparing the draft 10‐year Plan 2009‐19 and the consideration of submissions, the following significant changes have been made to the financials.
2009/10 2010/11 2011/12 2012/13 2013/14 2014/15 2015/16 2016/17 2017/18 2018/19
Budget B udget B udget B udget B udget B udget B udget B udget B udget B udget
Airport C all ‐ Loan repayment & interes t 200,000 200,000 200,000 200,000 200,000 200,000 200,000 200,000 200,000 200,000
Inves tigation of R egional Tourism Organisation 70,000 70,000
F uture P roof S trategy 55,000 25,000 25,000
P roperty Purchase 41,000 41,000 41,000 41,000 41,000 41,000 41,000 41,000 41,000 41,000
Impact of Adjus tments to Development C ontribution Policy 147,000 253,000 234,000 130,000 147,000 154,000 161,000 138,000 107,000
Other borrowing cos ts 98,000 134,000 163,000 195,000 237,000 456,000 450,000 338,000 363,000 507,000
Impact of R evaluation cycle 341,000‐ 349,500‐ 643,000‐ 417,000‐ 246,000‐ 422,000‐ 247,000‐ 79,000‐ 299,000‐ 111,000‐
C ambridge Pool ‐ C onstruction moved to year 4 50,000 160,000 925,000‐ 270,000‐
Te Awamutu Heritage & C ulture C entre ‐ C oncept plans 40,000
Additional R oading projects in yr 1 loan funded 95,000 95,000 95,000 95,000 95,000 95,000 95,000 95,000 95,000
R efuse Trans fer S tation in C ambridge ‐ S ubs idy 28,000 28,000 28,000
Armis tice ‐ grant for S ectretarial resourcing 5,000 5,000 5,000
Te Awamutu S afer C ommunity C haritable Trus t 2,500 2,500 2,500 2,500 2,500 2,500 2,500 2,500 2,500 2,500
E nviro schools 8,000 8,000 8,000 8,000 8,000 8,000 8,000 8,000 8,000 8,000
TOTAL RATE S RE QUIR E D (exc lus ive of GS T) $34.8m $37.9m $41.1m $44.1m $47.5m $50.2m $53.5m $56.8m $59.4m $62.3m

370 Waipa District Council
List of Submitters to the Draft 10‐year Plan
▪ Ackerman, Glenys ▪ Ackerman, Grant ▪ Active Transport ▪ AgResearch ▪ Aircraft Engine Testing Society ▪ Allen, JP & JK ▪ Allen, Tui ▪ Alston, John ▪ Ammon, H & J ▪ Anderson, Kevin ▪ Anderson, Kim ▪ Andree‐Wiltens, AJ ▪ Aniwaniwa Bodycorp & Neighbours ▪ Armistice in Cambridge Inc ▪ Armstrong, Digby & Prue ▪ Astbury, J & BA ▪ Aston, DC & B ▪ Asurequality Ltd ▪ Atkins, Brian & Diana ▪ Baker, Julie ▪ Baldwin, Steve ▪ Barbosa, Carlos & Annabel ▪ Barnaby, RW ▪ Barnard, Nikki ▪ Baron, Steve ▪ Bartlett, Victoria ▪ Bayley, Deanna ▪ Beaumont, S ▪ Bellamy, Helen ▪ Benham, Marlene ▪ Bennett, Alec ▪ Bennison, A (Mrs) ▪ Berendsen, Hendrick ▪ Birchan, Peter ▪ Bird, KW ▪ Bland, Alan & Hilary ▪ Blue Wallace Surveyors Ltd ▪ Boulton, Shona ▪ Bowden, Cova ▪ Boxell, GR & L ▪ Brace, Christine ▪ Brace, Mike ▪ Brewster, Roger ▪ Brickland, C & D ▪ Bright, Lesley ▪ Brockelbank, Chris
▪ Brown, David ▪ Brown, IR ▪ Brown, Phil ▪ Brown, Shirley ▪ Browne, Samantha ▪ Brownsey, R & M ▪ Bruce, Sara ▪ Bryant, N ▪ Buchanan, Deborah ▪ Bullick, John ▪ Bullick, Sue ▪ Burnley, J ▪ Burrell, P ▪ Burrows, S ▪ Burton, Gary ▪ Burton, John & Ann ▪ Burtt, A (Mr) ▪ Burtt, L (Mrs) ▪ Bush, Gina ▪ Business & Professional Women (Cambridge) ▪ Butler, P & H ▪ Callaghan, DJ & GE ▪ Cambridge Amateur Swimming Club ▪ Cambridge Chamber of Commerce ▪ Cambridge Community Board ▪ Cambridge Early Learning Centre ▪ Cambridge Federated Farmers ▪ Cambridge Information Centre ▪ Cambridge Kindergarten ▪ Cambridge Master Swimming Club ▪ Cambridge Park Ltd ▪ Cambridge Reserve Landscape Committee ▪ Cambridge Tree Trust ▪ Cameron, Gary ▪ Cane, Katrina ▪ Carson, Colin ▪ Carson, F (Mrs) ▪ Carson, JW ▪ Casey, Garry & Jewel ▪ Cattley, J ▪ Cavanagh, Jeanette ▪ Cave, John ▪ CCS Disability Action Waikato ▪ Champion, S ▪ Charlton, Alan & Gabrielle ▪ Chartwell Investments Ltd

10‐year Plan (2009‐19) 371
▪ Christiansen, Bary ▪ CKL Surveying & Planning ▪ Clarke, Viv ▪ Clarkson, Kathy & Geoff ▪ Clay, SD ▪ Claypole, BK & K ▪ Clayton, Simon ▪ Cleverley‐Tuatara, Uneta ▪ Clough, Alice ▪ Cockburn, Colin ▪ Cole, Michael ▪ Coleman, Emma ▪ Colgan, HR ▪ Collins, Paul ▪ Cooper, Gavin & Karen Lee ▪ Cooper, John & Noreen ▪ Corin, Trevor ▪ Cotter, Kevin ▪ Crickett, CR ▪ Crook, Grant ▪ Crook, M ▪ Cross, Jane ▪ Crown, D / Pederson, TJ ▪ Cunningham, G ▪ Curnow, A ▪ Cycle Action Waikato ▪ Davies, Bronwyn ▪ Davies, John & Christine ▪ Davies, Tom ▪ Davison, MT & KD ▪ Davy, Suzanne & Marcus ▪ Dawkins, NG & JM ▪ de Monchy, Pim ▪ de Villiers, David ▪ de Villiers, Jennifer ▪ de Villiers, Joshua ▪ Deakins, Cornelia ▪ Dean, Bruce & Beverly ▪ Denyer, Karen ▪ Department of Conservation ▪ Diamond, Anthony ▪ Dick, Graeme ▪ Dixon, Colin ▪ Doig, Jean ▪ Dove, Cynthia ▪ Downey, TP ▪ Drake, John ▪ Drake, N (Mrs)
▪ Drummond, Faye ▪ Duckitt, Yolande ▪ Dumble, Stephanie & Joe ▪ Dyer, Bob ▪ Eady, Dale & Sue ▪ Eames, Alex ▪ Edgar, Agnes ▪ Edge, Richard ▪ Edwards, Kathleen ▪ Eframoff, Lesley ▪ Emerson, Roy ▪ Empson, HJ ▪ Englebretsen, Gail ▪ Ennis, Peter ▪ Entwistle, Pete ▪ Environment Waikato ▪ Epplett, David ▪ Etheredge, Kay & Paul ▪ Evans, Ethel Edith ▪ Evans, Jane & Paul ▪ Federated Farmers of New Zealand Inc ▪ Fegan, Pam ▪ Fencourt Community Incorporated Society ▪ Firth, David ▪ Firth, EJ ▪ Firth, Merran ▪ Fisher, Howard ▪ Fisher, P ▪ Fisher, Peter & Vera ▪ Fitzpatrick, CK ▪ Floyd, C ▪ Follows, Carol ▪ Follows, John ▪ Fonterra Co‐operative Group Ltd ▪ Forrest, Mark ▪ Fransen, Sandra & Tim ▪ Fraser, Ian & Gay ▪ Friar, Dale ▪ Friends of Sanatorium Hill ▪ Friends of the Pool ▪ Fuller, Cary ▪ Fuller, Craig ▪ Fuller, Pene ▪ Fuller, Ron ▪ Fullerton, WE & AM ▪ Gabelich, A & V ▪ Gandell, C / Laurence, C / Frith, M / Ryder, C ▪ Gardner, James & Amelia
372 Waipa District Council
▪ Gascoigne, Greg ▪ Gasnier, Jack ▪ Gasquoine, M ▪ George, Kiri ▪ George, Maureen ▪ Gerrand, Donna ▪ Gherca, Narcis ▪ Gilder, Maureen ▪ Giudea, J / Nightingale, V ▪ Glew, Karen & Ken ▪ Gomes, MP ▪ Goodwin, KA & VM ▪ Gourdie, John ▪ Graham, David ▪ Graham, Jan ▪ Graham, Rob ▪ Grantchester Farms Ltd ▪ Gray, Richard & Margaret ▪ Green, Margaret & Brian ▪ Green, Murray ▪ Griffiths, RM ▪ Grinter, R ▪ Guest, S ▪ Hagle, Benjamin ▪ Hale, Victoria ▪ Hall, SE ▪ Halliday, Karen ▪ Hamilton City Council ▪ Hancock, Kate ▪ Hannon, R ▪ Hardiman, Ron & Val ▪ Hautapu Sports & Recreation Club ▪ Hawes, Rob ▪ Hawkes, Neil (Dr) ▪ Haywood, Sue ▪ Henderson, Kaylene ▪ Herrick, George ▪ Hewald ▪ Hicks, Helen ▪ Hill, Keith ▪ Hill, MR ▪ Hill, Rosemary ▪ Hills, Ceri ▪ Hitchcock, Gaylene ▪ Hodgson, Lance ▪ Holmes, PM & SM ▪ Holroyd, Ken ▪ Hopwood, DM
▪ Horstall, J (Mrs) ▪ Hoskin‐Beehre, Angela ▪ Howarth, Bruce ▪ Howarth, Linda ▪ Howell, Carol ▪ Hoyle, Lewis ▪ Hudson, Mavis ▪ Hughes, M ▪ Hughes, N & R ▪ Hulse, EW ▪ Humphreys, Diane & Keith ▪ Hunt, Lesley ▪ Hunt, Lyn ▪ Huston, Ann ▪ Huxtable, Veronica ▪ Hyde, Brenda ▪ Ingle, Mark ▪ Irving, Robyn ▪ Jennings, John & Robyn ▪ Jewell, Susan ▪ Johansen, Debra ▪ Johnson, Heather & Mike ▪ Jolley, Mike ▪ Jolley, Noelene & Grahame ▪ Joyce, Leone ▪ Kay, Chris ▪ Kay, Sue ▪ Kemp, Cherie ▪ Kerr, Claire ▪ Kerr, Roderick ▪ Kewish, RJ & VM ▪ Kibblenhite, David ▪ Kihikihi Residents & Ratepayers ▪ Kirk, Neil ▪ Knight, Jennifer ▪ Knight, Margaret ▪ Knight, Richard ▪ Knowles, J ▪ Krutzmann, Timm ▪ Lane, M ▪ Larsen, Bridget ▪ Lawrence, Peter ▪ Laxon, C ▪ Laxon, C & I ▪ Leatham, Rachel ▪ Lee, Barbara ▪ Lee, Barry ▪ Lee, Dave

10‐year Plan (2009‐19) 373
▪ Lee, Martin & Peggy ▪ Lehan, Joe ▪ Leidig, George ▪ Leslie, L ▪ Lloyd, David ▪ Lloyd, JA ▪ Lockie, Judy ▪ Lockwood, Simon ▪ Lomey, Y ▪ Love, Freda ▪ Lunn, Nicola ▪ Lupton, M ▪ Lusk, Mike & Ros ▪ MacDonald, Bruce ▪ MacDonald, Ewan ▪ MacGibbon, Roger ▪ Mackinder, Marilyn ▪ Mackinder, Selwyn ▪ Maguire, Michael ▪ Mahuika House ▪ Marston, S / Leach, C ▪ Martin, Chris ▪ Mason, AL (Mr) ▪ Mason, JD ▪ Mason, Verna ▪ Mathers, William & Janice ▪ Mathis, Geoff ▪ Mau, Jayne ▪ Maungatautari Ecological Island Trust ▪ Mayors Taskforce for Jobs ▪ McArthur, Angela (Sister) ▪ McBeth, Nicky ▪ McCabe, B & K ▪ McCready, E ▪ McCullocugh, Alan ▪ McDowell, M ▪ McEntee, Louis & Carol ▪ McKain, L (Mr & Mrs) ▪ McLaughlin, C ▪ McPherson, Hilary ▪ McQueen, Don ▪ Meikle, James ▪ Mercer, Kathryn ▪ Metcalfe, E ▪ Metcalfe, Sandra ▪ Metz, Johan ▪ Mighty River Power ▪ Millar, Chris
▪ Millar, Rod ▪ Mills, Geoff & Diana ▪ Milne, Graeme ▪ Milne, Julie ▪ Mitchell, Gail ▪ Mitchell, Geoff ▪ Mitchell, George ▪ Mitchell, Shona ▪ Mitchem, Andrew ▪ Monavale Blueberries Ltd ▪ Moodie, John & Jane ▪ Moore, M (Mr & Mrs) ▪ Moore, Marie ▪ Morris, CA ▪ Morris, Ken & Karen ▪ Morrow, Jean ▪ Mortimer, John & Bunny ▪ Mowbray, Linda ▪ Mucalo, M ▪ Mudford, Margaret ▪ Murdoch, IM ▪ Nathoo, M Pat (Mrs) ▪ Natta, Janet ▪ Nelson, Dorne ▪ NZ Society of Genealogists (Te Awamutu) ▪ NZ Transport Agency ▪ Newton, Helen ▪ Ngati Apakura ▪ Nicklin Surveying & Resource Management ▪ Nicklin, Marion ▪ Nielsen, Brent ▪ Nisbett, John ▪ Noble, Robert ▪ Noble, Susan ▪ Nolly, K & J ▪ Nordstrom, Raewyn ▪ Norman, Russel (Green Party) ▪ O’Leary‐Nel, JP ▪ Olsen, Jan ▪ Olsson, P ▪ O’Neill, Linley ▪ Oosthoek, Margaret ▪ O’Regan, TP ▪ Ostler, Joanne ▪ Owen, Megan ▪ Owen, Sabina ▪ Ozwi Ltd ▪ Pahl, Bruce & Sheryl

374 Waipa District Council
▪ Papworth, Brian ▪ Park, G & V ▪ Parrott, Gaelyn ▪ Parrott, Jo ▪ Patete, Anthony ▪ Paul, Richard ▪ Payne, David & Karen ▪ Peach, R (Mrs) ▪ Peake, Norma ▪ Peake, Robert ▪ Pears, Bee ▪ Pearson, Bruce ▪ Peart, David ▪ Perry, Alan ▪ Philip, Barbara ▪ Philip, Jos ▪ Phillipps, David ▪ Philips, Ngaire ▪ Phyn, Claire ▪ Phyn, Claire & Derek ▪ Pinnell, Graham & Bernice ▪ Pirongia Historic Visitor Centre ▪ Pirongia Residents & Ratepayers Association ▪ Pirongia Te Aroaro o Kahu Restoration Society ▪ Poot, Huybrecht ▪ Pretorius, Frances ▪ Purchase, Brett ▪ Quin, GT & AE ▪ Quinn, Olga ▪ Rankin, Mr & Mrs ▪ Ransley, Diana ▪ Read, Ronald ▪ Read, Sharon & Tom ▪ Reardon, Tim ▪ Redmond, Olive ▪ Rees, Judie ▪ Reid, Stuart ▪ Reilly, Amanda ▪ Reynolds, Gavin ▪ Rickerby, Dave ▪ Risi, JA & MT ▪ Risi, Peter & Vickie ▪ Ritchie, T ▪ Rive, John ▪ Roberts, A (Mrs) ▪ Roberts, Megan ▪ Roberts, Peter ▪ Robinson Consultancy Ltd
▪ Robinson, Phillip ▪ Robson, A ▪ Robson, V ▪ Rode, M ▪ Roigard, Claire ▪ Rolley, Carollyn ▪ Rolley, Tony ▪ Rombouts, CPM ▪ Rombouts, JM ▪ Rose, AS & HK ▪ Rose, Mary ▪ Rose, Tina ▪ Rothwell, RPG & MG ▪ Royal Forest Bird & Auckland Botanical Society ▪ Ruffell, HK ▪ Rugg, M ▪ Rural Women ▪ Russenberger, Jurg ▪ Rye, R & E ▪ Salmon, Janice ▪ Sayer, Anthea ▪ Schenkel, Annie ▪ Scott, Elizabeth Anne ▪ Searle, Daphne & Peter ▪ Searle, Lyndsay ▪ Seddon, Betty ▪ Sharpe, Helen ▪ Shaw, GD & MC ▪ Shaw, Hayley ▪ Shaw, John ▪ Sherwin, B ▪ Silvester, Brian ▪ Silvester, PA (Mrs) ▪ Simmons, CJ ▪ Sircombe, Keith (Dr) ▪ Skinner, Noel ▪ Slade, Joan ▪ Slade, Robin ▪ Smelling, L ▪ Smith, Jenny ▪ Smits, Peter & Ria ▪ Southern Fresh Foods Ltd ▪ Sport Waikato ▪ St Peters Catholic School & Parish Hall ▪ St Peters Swimming Academy ▪ Stacey, Norman ▪ Staheli, WN ▪ Steen, Wayne & Tania

10‐year Plan (2009‐19) 375
▪ Stephenson, Gordon ▪ Stevens, Diane ▪ Stewart, Barbara ▪ Stewart, Mairi ▪ Stirling, Prue ▪ Stone, Julian ▪ Storey, Alison ▪ Straight Line Surveying ▪ Suckling, B ▪ Suckling, Barry & Rachel ▪ Sustainable Future ▪ Suter, Daniela ▪ Sutton, L / Boyle, M ▪ Swears, Dorothy ▪ Tait, Tina ▪ Tangaroa, Kay ▪ Tarbutt, L ▪ Taumanu, TW ▪ Taute, Norma ▪ Taylor, Dan ▪ Taylorlucas, R ▪ Te Awamutu Alive ▪ Te Awamutu Chamber of Commerce ▪ Te Awamutu College ▪ Te Awamutu Community Board ▪ Te Awamutu Girl Guides ▪ Te Awamutu Public Relations Organisation ▪ Te Awamutu Rugby Sports & Recreation Club ▪ Te Awamutu Safer Community Trust ▪ Templer, Michael ▪ The National Wetland Trust of NZ ▪ The Neil Group Ltd ▪ Thomas, Carole ▪ Thomas, Harold ▪ Thomason, Noel ▪ Thompson, Mark & Edith ▪ Thorn, JG & JM ▪ Tighe‐Umbers, K & E ▪ Tilyard, Janis ▪ Todd, Martyn ▪ Todd, Matthew ▪ Todd, Vicki ▪ Toomath, CR ▪ Townend, Barry ▪ Townsend, Kathleen & Nigel ▪ Transland Group ▪ Treanor, Rosalie ▪ Trower, Gillian
▪ Trower, Jason ▪ Turnwald, JA ▪ Twin Willows Developments ▪ Unsworth, John & Ann ▪ Upston, Kerry ▪ van der Heyden, Jocelyn ▪ van der Hoek, Paul ▪ Van Mierlo, A ▪ Vanner, George ▪ Verhoef, Olwyn ▪ Verschuurem, Maarten ▪ Vincent, Russell ▪ Waikato Biodiversity Forum ▪ Waikato Regional Airport ▪ Waikato River Trails Trust ▪ Waipa Biodiversity Council ▪ Waite, Barry ▪ Wallace, Juliette ▪ Wallace, Pip ▪ Wallace‐Fowler, Robert ▪ Warburton Crescent Signatories ▪ Ward, Lisbeth ▪ Ware, Gary ▪ Webb, George ▪ Webber, D ▪ Wesselink, C ▪ West, M ▪ West, Robin ▪ Westberry ▪ White, Warren & Jenny ▪ Whiteman, John ▪ Wilkins, Geoffrey ▪ Wilkinson, AJ ▪ Williams, Lavina ▪ Williams, Murray ▪ Williams, Roger ▪ Wilson, Ian ▪ Wilson, Jenny ▪ Wilson, Lorraine ▪ Wilson, ME ▪ Wilson‐Jennings, CS ▪ Wilson‐Jennings, DD ▪ Wood, L ▪ Woodall, Bryan ▪ Wright, Richard ▪ Wyatt, Lesley ▪ Wykes, Kellie ▪ Zanders, Julianne

376 Waipa District Council
Anonymous Submitters 49 submissions were received from anonymous submitters. Late Submitters Five submissions were received late and they were not summarised or reported on for the Policy Committee submissions hearing held May 12‐14. However, the submissions were tabled at the hearing in a separate document. ▪ Archer, Teri ▪ Bent, Mary & Michael ▪ Harfoot, Chris & Cynthia ▪ Smeaton, Duncan ▪ Stubbing, Linda
10‐year Plan (2009‐19) 377
Auditor’s Report
Report to the readers of Waipa District Council’s
Long-Term Council Community Plan for the ten years commencing 1 July 2009
The Auditor-General is the auditor of Waipa District Council (the District Council). The Auditor-General has appointed me, John Scott, using the staff and resources of Audit New Zealand, to report on the Long-Term Council Community Plan (LTCCP), on his behalf.
The Auditor-General is required by section 94(1) of the Local Government Act 2002 (the Act) to report on:
• the extent to which the LTCCP complies with the requirements of the Act;
• the quality of information and assumptions underlying the forecast information provided in the LTCCP; and
• the extent to which the forecast information and performance measures will provide an appropriate framework for the meaningful assessment of the actual levels of service provision.
It is not our responsibility to express an opinion on the merits of any policy content within the LTCCP.
Opinion
Overall Opinion
In our opinion the LTCCP of the District Council incorporating volume one dated 30 June 2009 provides a reasonable basis for long-term integrated decision-making by the District Council and for participation in decision-making by the public and subsequent accountability to the community about the activities of the District Council.

378 Waipa District Council
In forming our overall opinion, we considered the specific matters outlined in section 94(1) of the Act which we report on as follows.
Opinion on Specific Matters Required by the Act
In our view:
• the District Council has complied with the requirements of the Act in all material respects demonstrating good practice for a council of its size and scale within the context of its environment;
• the underlying information and assumptions used to prepare the LTCCP provide a reasonable and supportable basis for the preparation of the forecast information; and
• the extent to which the forecast information and performance measures within the LTCCP provide an appropriate framework for the meaningful assessment of the actual levels of service provision, reflects good practice for a council of its size and scale within the context of its environment.
Actual results are likely to be different from the forecast information since anticipated events frequently do not occur as expected and the variation may be material. Accordingly, we express no opinion as to whether the forecasts will be achieved.
Our report was completed on 30 June 2009, and is the date at which our opinion is expressed.
The basis of the opinion is explained below. In addition, we outline the responsibilities of the District Council and the Auditor, and explain our independence.
Basis of Opinion
We carried out the audit in accordance with the International Standard on Assurance Engagements 3000: Assurance Engagements Other Than Audits or Reviews of Historical Financial Information and the Auditor-General’s Auditing Standards, which incorporate the New Zealand Auditing Standards. We have examined the forecast financial information in accordance with the International Standard on Assurance Engagements 3400: The Examination of Prospective Financial Information.
We planned and performed our audit to obtain all the information and explanations we considered necessary to obtain reasonable assurance that the LTCCP does not

10‐year Plan (2009‐19) 379
contain material misstatements. If we had found material misstatements that were not corrected, we would have referred to them in our opinion.
Our audit procedures included assessing whether:
• the LTCCP provides the community with sufficient and balanced information about the strategic and other key issues, choices and implications it faces to provide an opportunity for participation by the public in decision-making processes;
• the District Council’s financial strategy, supported by financial policies as included in the LTCCP is financially prudent, and has been clearly communicated to the community in the LTCCP;
• the presentation of the LTCCP complies with the legislative requirements of the Act;
• the decision-making and consultation processes underlying the development of the LTCCP are compliant with the decision-making and consultation requirements of the Act;
• the information in the LTCCP is based on materially complete and reliable asset or activity management information;
• the agreed levels of service are fairly reflected throughout the LTCCP;
• the key plans and policies adopted by the District Council have been consistently applied in the development of the forecast information;
• the assumptions set out within the LTCCP are based on best information currently available to the District Council and provide a reasonable and supportable basis for the preparation of the forecast information;
• the forecast information has been properly prepared on the basis of the underlying information and the assumptions adopted and the financial information complies with generally accepted accounting practice in New Zealand;
• the rationale for the activities is clearly presented;
• the levels of service and performance measures are reasonable estimates and reflect the key aspects of the District Council’s service delivery and performance; and
380 Waipa District Council
• the relationship of the levels of service, performance measures and forecast financial information has been adequately explained within the LTCCP.
We do not guarantee complete accuracy of the information in the LTCCP. Our procedures included examining on a test basis, evidence supporting assumptions, amounts and other disclosures in the LTCCP and determining compliance with the requirements of the Act. We evaluated the overall adequacy of the presentation of information. We obtained all the information and explanations we required to support our opinion above.
Responsibilities of the Council and the Auditor
The District Council is responsible for preparing an LTCCP under the Act, by applying the District Council’s assumptions and presenting the financial information in accordance with generally accepted accounting practice in New Zealand. The District Council’s responsibilities arise from Section 93 of the Act.
We are responsible for expressing an independent opinion on the LTCCP and reporting that opinion to you. This responsibility arises from section 15 of the Public Audit Act 2001 and section 94(1) of the Act.
Independence
When reporting on the LTCCP we followed the independence requirements of the Auditor-General, which incorporate the independence requirements of the Institute of Chartered Accountants of New Zealand.
Other than this report and in conducting the audit of the Statement of Proposal for adoption of the LTCCP, the annual audit and assurance work over a contract, we have no relationship with or interests in the District Council.
John Scott Audit New Zealand On behalf of the Auditor‐General Hamilton, New Zealand