Embed Size (px)
Citation preview

14.3 Population Density And Distribution
SPONGE
Please draw a graph showing each:
PREDATION
MUTUALISM
COMMENSALISM
PARASITISM
14.3 Population Density And Distribution
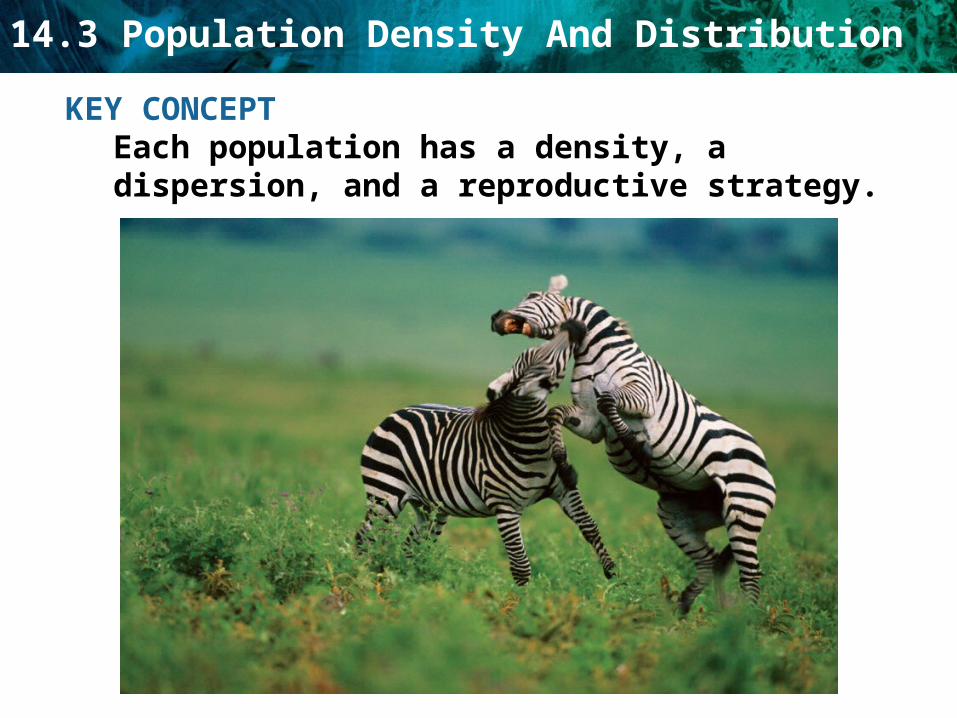
KEY CONCEPT Each population has a density, a dispersion, and a reproductive strategy.

14.3 Population Density And Distribution
• Population density is a measurement of the number of individuals living in a defined space.

14.3 Population Density And Distribution
When scientists notice changes in population densities over time, they work to determine whether the changes are the result of environmental factors or are simply due to normal variation
Global Warming caused by humans???
Death due to drought?

14.3 Population Density And Distribution
How do scientists keep track of population density?
• Scientists can calculate population density by using this formula
If there are 200 deer in a field that is 10 sq km…
200/10sq km = 20 deer per square kilometers
14.3 Population Density And Distribution
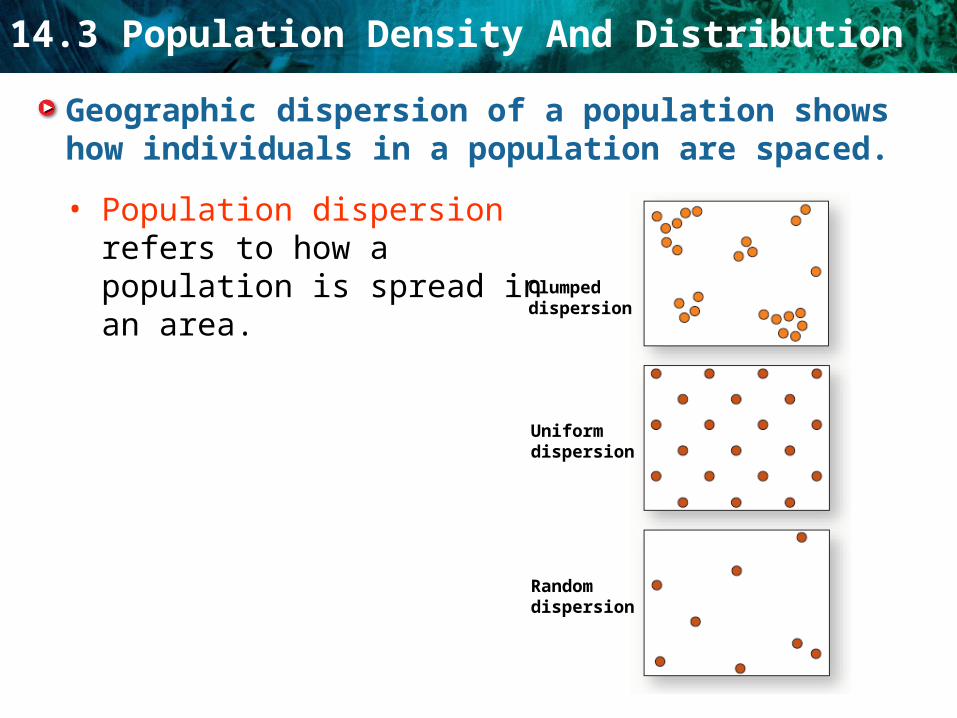
• Population dispersion refers to how a population is spread in an area.
Geographic dispersion of a population shows how individuals in a population are spaced.
Clumpeddispersion
Uniformdispersion
Randomdispersion
14.3 Population Density And Distribution
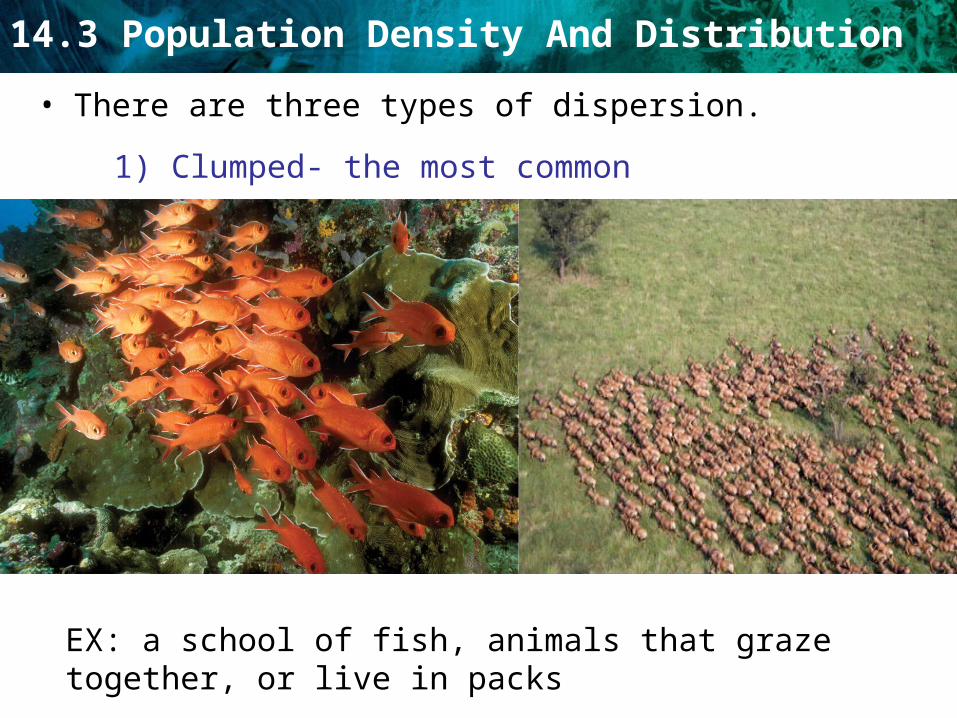
• There are three types of dispersion.
1) Clumped- the most common
EX: a school of fish, animals that graze together, or live in packs

14.3 Population Density And Distribution
2)Uniform-evenly spread out
EX: Certain birds (gannet) or plants (creosote bushes)

14.3 Population Density And Distribution
– random
EX: The three-toed sloth is a solitary animal (it likes to be by itself) or dandelions that seeds random plant themselves
14.3 Population Density And Distribution
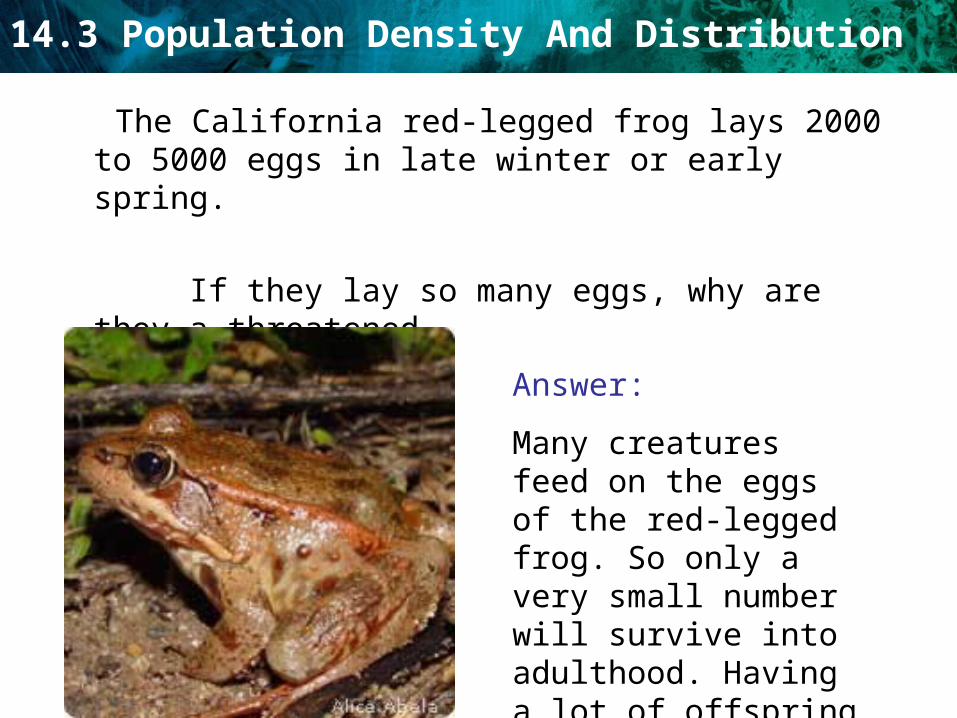
The California red-legged frog lays 2000 to 5000 eggs in late winter or early spring.
If they lay so many eggs, why are they a threatened
species?
Answer:
Many creatures feed on the eggs of the red-legged frog. So only a very small number will survive into adulthood. Having a lot of offspring allow them to survive as a species.

14.3 Population Density And Distribution
Survivorship curves help to describe the reproductive strategy of a species.
• A survivorship curve is a diagram showing the number of surviving members over time from a measured set of births.

14.3 Population Density And Distribution
By measuring the number of offspring born in a year and following those offspring until they die, survivorship curves give information about the life history of a species.
Why use a survivorship curve?????

14.3 Population Density And Distribution
• Survivorship curves can be type I, II or III.– Type I —low level of infant death and an older population
– common to large mammals and humans– Type II —survivorship rate is equal at all stages of life
– common to birds and reptiles
– Type III —very high birth rate, very high infant mortality– common to invertebrates and plants