Embed Size (px)
Citation preview

Joondalup Performing Arts and Cultural Facility – Financial and Scenarios Evaluation
42 | Page
14 OPERATING ANALYSIS – YEARS 0 TO 4
14.1 Start Up Expenses (2018-19)
It would be necessary to incur operational expenses prior to the opening of the facility. This will be necessary to ensure that the team are in place for opening and the program model has been built up. It is assumed that each Scenario would require operating costs of $872k in the year before opening for: • Staff Costs;
• Marketing; and
• Administration (legal and contractual work to establish governance model).
• Website development
These estimates are preliminary only at this stage and would require more detailed evaluation as part of subsequent financial reviews.
14.2 Year 1 to 4 Utilisation
The Operating Analysis has focused on Year 5, as it is assumed this is the basis of ‘steady state’ and used for each year thereafter. The operating assumptions for Year 1 to Year 4 have assumed that there would be a steady progression to the steady state. This is illustrated in the table below with the Primary Theatre utilisation of 188 days:
Year Utilisation Days p.a.
Comments
1 2019-20 93 50% of Steady State 2 2020-21 116 Previous year plus 23 days 3 2021-22 139 Previous year plus 23 days 4 2022-23 162 Previous year plus 23 days 5 2023-24 186 Steady State
The majority of the income and expense items are based on the same assumptions as above. In reality the facility may enjoy an initial ‘honeymoon’ period where Year 1 and Year 2 have higher use than above.
14.3 Building Maintenance
Year 1 should have a low cost as covered by defects and a minor cost of $251k is included. Likewise in Years 2 to 4 it is reasonable to assume that there should be fewer repairs than in future years, and therefore lower building maintenance costs have been assumed until steady state.
260

Joondalup Performing Arts and Cultural Facility – Financial and Scenarios Evaluation
43 | Page
14.4 Subsidy Years 0 to Year 4
The table below summarises the total operating subsidy estimated for each Scenario from the year before opening up to year 4. Also shown is the average subsidy per year. It is expected that the costs would be less than Steady State as there would be some costs (e.g. Repair, Maintenance, Cleaning, Security) would be less than Steady State).
Concept Design
Scenario1 Scenario2 Scenario3
Business Case (Dec
2015)
Worse Case
Idealistic Realistic
$000s ($3,518) ($5,203) ($2,934) ($4,146)
$000s ($704) ($1,041) ($587) ($829)Average Subsidy per year
Subsidy Years 0 to Years 4
Total Operating Subsidy(excl. interest & depreciation)
261

Joondalup Performing Arts and Cultural Facility – Financial and Scenarios Evaluation
44 | Page
TOTAL IMPACTS
15 CAPITAL RENEWAL
15.1 Basis of Assumptions
The assumptions still used for all Scenarios is the same as the previous Business Case, which are internal City estimates with reference to the City’s Building Asset Management Plan. Paxon have provided alternative information regarding replacement cycles. The Paxon information indicates that capital should be replaced much earlier than indicated in the assumptions below, and that a total of $276m should be included in the 40 year cashflows for capital replacement. At present the City has included $79m in the estimates so the Paxon estimates would increase the cash flows by $196m.
The City has chosen not to use the Paxon replacement profile because it does not agree with the earlier life cycle and there is insufficient information or examples to support the proposal. For example it was suggested that $8.5m should be planned every 7 years for fitments. It is recognised that capital replacement is important but it was deemed unlikely that the facility would require $8.5m every 7 years.
The large disparity between the estimates is a risk and a concern that requires further investigation.
15.2 Components
For the purposes of capital renewal planning, construction costs are broken down into 6 different components, this analysis was based on the Citys Building Asset Management Plan.
15.3 Renewal Life
The table below summarises the estimated renewal life of each component. The first column shows the maximum life that each component could have. An assessment is then based on whether the component would be renewed at Condition 5 (full maximum life) or whether there would be a “Condition Intervention”). The Condition Ratings (from 1 to 5) are based on standard Asset Management practice (reference International Infrastrcuture Manual). For building assets it is assumed that Fixtures & Fittings, Services-short life and Equipment would be replaced before they deteriorate to Condition 5, and before they reach their maximum useful life.
Structure 72%Roof 8%Fixtures & Fittings 3%Services(1) - Long Life 13%Services(2) - Short Life 2%Equipment 3%Total 100%
262

Joondalup Performing Arts and Cultural Facility – Financial and Scenarios Evaluation
45 | Page
15.4 Renewal Projections
Based on the split of Capital Cost of Component and the Renewal Life above, a 100 year renewal plan has been prepared. Within the financial evaluation included within this report (up to 2058-59), which includes 40 years of operation a total of $24m (excluding escalation) has been included, this is split in 4 lumps only (2034/35, 2042/43, 2050/51, 2058/59).
15.5 Sinking Fund not Recommended
Some external consultants (Paxon and AEG Ogden) have suggested that a sinking fund i.e. Reserve is used to set aside cash each year for future capital replacement, rather than have large lumps of expenditure in future years. This is not recommended because it is better from a Treasury management perspective for the City to plan for the cash as it is required rather than set aside each year. Indeed no examples could be provided to the City of other facilities who have a sinking fund.
The other argument for setting up a sinking fund is that it gives the City a better overall view of the annual financial costs of the facility by setting aside an annual cash budget for future replacement, rather than intermittent lumps. Whilst there is some merit in this, the true operating performance for the facility will be the operating results which would include Depreciation. As long as Deprecation is based on current costs and based on real consumption of the asset then the operating results will be a reliable gauge for the bottom line of the facility.
15.6 Depreciation Factors
The component lives in Section 15.2 are the lives that would be used for the basis of Depreciation charges and have been used to calculate the annual Depreciation charge of $1.5m per year. The $1.5m works out at oveall life of 67 years.
Structure 80 Condition 5 80Roof 80 Condition 5 80Fixtures & Fittings 40 Condition 3 24Services(1) - Long Life 40 Condition 5 40Services(2) - Short Life 20 Condition 4 16Equipment 20 Condition 4 16
Maximum LifeCondition that
asset maintained to
Renewal Life based on condition
263

Joondalup Performing Arts and Cultural Facility – Financial and Scenarios Evaluation
46 | Page
16 TOTAL CASH FLOWS TO 2058-59
16.1 Total Cash flows 2014-15 to 2058-59
The whole-of-life cash flows have been projected up to 2058-59. This covers the period of construction and 40 years of operation. By evaluating over such a long period ensures that the long-term impacts including capital renewals can be evaluated. The table below summarises the overall cash flow impacts, this table includes all of the cash flows in the previous sections (Capital Costs, Funding, Capital Renewals, Operating assumptions, Escalation). The rage of possibilities is influenced greatly by the different operating subsidy which may be incurred. Scenario 1 with an operating subsidy of over $1.1m per year would result in an overall Cash flow of $244.9m, whereas Scenario 2 with an operating deficit of just over $0.5m would be $184.6m. Meanwhile Scenario 3 with an operating subsidy of $863k has an overall cash flow of $217.5. Scenario 3 is $17.3m higher than the previous business case. The range of differences between the scenarios is considered to be reasonable at this stage of a $100m project.
The Net Present Cost is the sum of all the cashflows discounted back to today’s values. The difference between each of the Scenarios follows the same trend as the overall Project Cash flows.
Concept Design Scenario1 Scenario2 Scenario3
Establishment CostsCapital & Other One-Off Costs $ms ($103.0) ($105.3) ($105.3) ($105.3)Grants and Reserves $ms $55.2 $47.5 $47.5 $47.5Borrowings $ms $47.8 $57.8 $57.8 $57.8Repayments $ms ($47.8) ($57.8) ($57.8) ($57.8)Establishment Costs $ms ($47.8) ($57.8) ($57.8) ($57.8)
Operating ImpactsOperating Expenses incl. Interest $ms ($333.3) ($426.7) ($368.8) ($400.5)Operating Income $ms $260.4 $319.0 $321.5 $320.2Operating Deficit incl. Interest $ms ($72.9) ($107.7) ($47.3) ($80.3)
Asset Replacement $ms ($79.4) ($79.4) ($79.4) ($79.4)
Total Project Cash flows $ms ($200.2) ($244.9) ($184.6) ($217.5)
Ranking Rank 3 1 2Diff to Concept Design $000s $ms ($44.8) $15.6 ($17.3)
% % 22.4% -7.8% 8.6%
Net Present Cost $ms ($84.3) ($104.0) ($83.0) ($94.4)
RealisticIdealistic
Option SummaryTotal Cash Flows
up to 2058-59 including escalation
Business Case (Dec
2015)Worse Case
264

Joondalup Performing Arts and Cultural Facility – Financial and Scenarios Evaluation
47 | Page
16.2 Cumulative Cash Flows
The graph below shows the cash flows on a cumulative basis. The cash flows for the first 15 years include the cost of loan repayments and therefore the reductions are steeper than later years. The trend in costs for each Scenario is similar to the previous business case. The spikes in 2034-35, 2042-43, 2050-51 and 2058-59 are due to the capital renewal costs.
16.3 Comparison of Cashflows to Previous Business Case
The chart below summarises the changes in the revised estimates (Scenario 3) compared to the Concept Design assumptions in the previous business case. This shows that the project costs have increased by approx $18m, and this is broken down into 4 main causes: • ($3m) for Increased capital costs, including the cost of interest • ($11m) for reduced Tamala Park proceeds, including the cost of interest • $4m benefit for the reduced costs of borrowing (lower interest rate) • ($7m) due to the higher operating subsidy of $863,000 pear year
($300)
($250)
($200)
($150)
($100)
($50)
$0$ms
Cumulative Cashflow
Concept Design - Business Case (Dec 2015)
Scenario01 - Worse Case
Scenario02 - Idealistic
Scenario03 - Realistic
$200
$3
$11
-$4 $7
$218
$180
$185
$190
$195
$200
$205
$210
$215
$220
Dec 2015 Business Case
Increased Capital Cost of $2.1m plus
Interest Costs.
Tamala Park Reduced Proceeds
Reduced Borrowing Costs
Operating Subsidy increase to $863k
Option 2 July 2016 Revised WLC
40 Y
ear
Tota
l $m
Schematic Design - Estimated Changes in 40 Year Whole of Life Costs $m
265

Joondalup Performing Arts and Cultural Facility – Financial and Scenarios Evaluation
48 | Page
SCENARIO EVALUATION
17 SCENARIO EVALUATION
17.1 Value for Money Concepts
The investment costs are significant, for example they are approximately equivalent to one year’s worth of rates income. It is therefore crucial to consider whether the scope of the Arts Box and the size of the investment provide value for money. The design team have extensive experience in the interrogation of conventional construction methods, combined with new modelling technologies to deliver world-class venues with tight budgets. Recent examples include the Melbourne Theatre Company Southbank Theatre, Melbourne Recital Centre and Hamer Hall redevelopment. The JPACF has gone through value management processes to ensure that both the best design criteria and budget are met. Value management is an attitude within the design team to continually question whether emerging design solutions really represent the best value for money for the project. This process relies on both innovation (for example, consolidating unexpected areas of program) and strategy (for example, not spreading scarce budget out over large areas of the project, but concentrating it into areas where there is a real and perceived benefit). The design team are committed to the innovative use of ordinary building materials and methods – using known technologies in creative and unusual ways. The Design Team strive for maximum impact without maximum cost. The adScenario of this philosophy has benefits to the long term maintenance and life-cycle costs of the facility.
17.2 Value for Money Examples in the Design
Some examples of how value management has been employed in the concept design of the JPACF include: • Locating the car park above ground instead of in basement levels. This saves the project
approximately $6m in capital cost. The car parking levels also assist in the scaling up of the building to help in generating a critical civic mass, particularly in the context of the Lakeside Joondalup Shopping Centre. The car park is able to be naturally ventilated and the rest of the building is freed from the constraints of mechanical ventilation from a basement car park. The car park is also directly connected to the building at ground level, and the surrounding gardens, for ease of access and security.
• Combining the community and conference areas. It made sense to cluster together the studios for crafts and visual arts, with some of the lesser-utilised spaces such as ancillary rehearsal rooms and conference rooms, allowing them to be flexibly programmed for anything from dance classes to community meetings, and to share amenities.
• Providing a diverse mix of spaces which can be zoned for multiple event use, catering for
a large pool of events. This ensures the building is utilised as fully as possible, and also saves on operating costs as areas of the building are able to be used independently – for example, the car parking and community studios can be used during the day while the theatres and main foyer are closed. The building aims to be activated 12 hours a day, 7 days a week.
266
Joondalup Performing Arts and Cultural Facility – Financial and Scenarios Evaluation
49 | Page
The cost rates used are benchmark rates based on a combination of other projects, recently priced Bills of Quantities, pricing books and supplier prices where appropriate. The rates therefore reflect, as far as practically possible at this stage, the current market pricing for each component of work. The rates will evolve over time as the design and engineering develops.
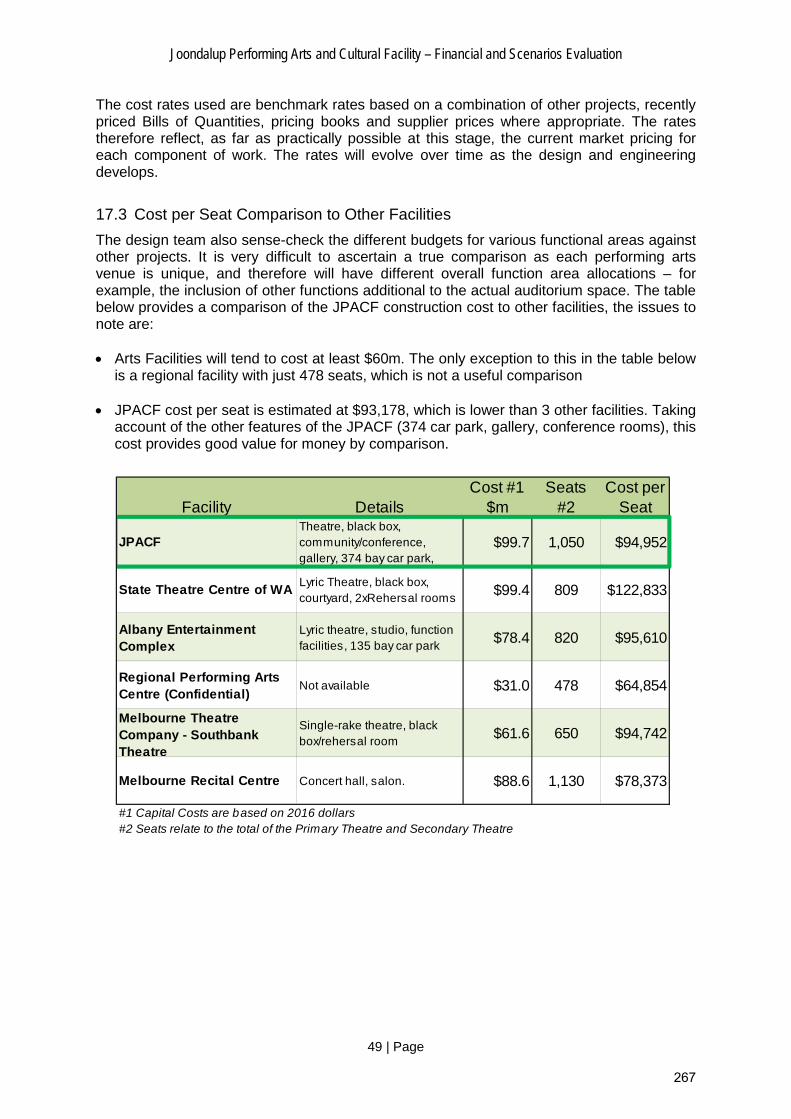
17.3 Cost per Seat Comparison to Other Facilities
The design team also sense-check the different budgets for various functional areas against other projects. It is very difficult to ascertain a true comparison as each performing arts venue is unique, and therefore will have different overall function area allocations – for example, the inclusion of other functions additional to the actual auditorium space. The table below provides a comparison of the JPACF construction cost to other facilities, the issues to note are: • Arts Facilities will tend to cost at least $60m. The only exception to this in the table below
is a regional facility with just 478 seats, which is not a useful comparison
• JPACF cost per seat is estimated at $93,178, which is lower than 3 other facilities. Taking account of the other features of the JPACF (374 car park, gallery, conference rooms), this cost provides good value for money by comparison.
Facility DetailsCost #1
$mSeats
#2Cost per
Seat
JPACFTheatre, black box, community/conference, gallery, 374 bay car park,
$99.7 1,050 $94,952
State Theatre Centre of WALyric Theatre, black box, courtyard, 2xRehersal rooms
$99.4 809 $122,833
Albany Entertainment Complex
Lyric theatre, studio, function facilities, 135 bay car park
$78.4 820 $95,610
Regional Performing Arts Centre (Confidential)
Not available $31.0 478 $64,854
Melbourne Theatre Company - Southbank Theatre
Single-rake theatre, black box/rehersal room
$61.6 650 $94,742
Melbourne Recital Centre Concert hall, salon. $88.6 1,130 $78,373
#1 Capital Costs are based on 2016 dollars#2 Seats relate to the total of the Primary Theatre and Secondary Theatre
267

Joondalup Performing Arts and Cultural Facility – Financial and Scenarios Evaluation
50 | Page
17.4 Key Indicators – Impacts per Ratepayer
The table below summarises some key indicators for the Investment and ongoing Subsidy:
• Cost per Ratepayer for the Capital cost is $1,576 for Scenario 3 • Subsidy per Ratepayer per year is $13.64 This type of information may be useful to assist with the public consultation and to help the public understand that whilst the JPACF has a high cost, and high ongoing subsidy, the impacts per household are minimal. Indeed when the benefits (social, economic) are considered many ratepayers would no doubt agree that the cost of $13.64 per year is a worthwhile cost to bear for such a facility e.g. that relates to 3 cups of coffee per year.
17.5 Non Financial Evaluation
The table below provides some comments as to how each Scenario achieves the non-financial objectives of the project.
Ref Issue Details
1 Imagination & Creativity
o Arts Box Model has a wider scope than a Traditional Performing Arts Centre and will encourage greater imagination and creativity.
o There is more attendees per year with Arts Box Model
2 Inclusive Environment
o Arts Box model has the ability to be open 7 days a week, 12 hours per day. Meanwhile a Traditional Performing Arts Centre may only be open for performances and is far less inclusive.
o Arts Box Model will have multipurpose spaces which can cater for a variety of different uses
3 Viability & Attraction o The design for Arts Box would be much more attractive than the
design for a Traditional Performing Arts Centre. It is clear that the design would be an iconic landmark within the City.
Concept Design
Scenario01 Scenario02 Scenario03
Business Case (Dec
2015)Worse Case Idealistic Realistic
Summary Data
1 Capital Costs, excl. escalation $000s ($97,631) ($99,738) ($99,738) ($99,738)
2 Ratepayers (Dwellings and Business) $000s 63,296 63,296 63,296 63,296
3 Subsidy (Year 5) excl. escalation $000s ($818) ($1,150) ($529) ($863)
4 Income (Year 5) $000s $2,535 $3,160 $3,187 $3,173
5 Attendees Qty 97,400 95,350 95,350 95,350
Key Indicators
6 Capital Cost per Ratepayer $ ($1,542) ($1,576) ($1,576) ($1,576)
7 Subsidy per Ratepayer per Year $ ($12.92) ($18.16) ($8.37) ($13.64)
8 Income per Attendee $ $26.03 $33.14 $33.42 $33.28
Key Indicators
268

Joondalup Performing Arts and Cultural Facility – Financial and Scenarios Evaluation
51 | Page
SUMMARY
18 IMPACTS FOR CITY OF JOONDALUP
18.1 Financial Summary of Scenario 3
Scenario 3 is used as the basis of the Business Case and would require the following commitment by the City: • Investment of $99.7m (excluding escalation)
- $1.9m Sunk Cost - $97.8m is a future investment
• Grant assumption of $10m from National Stronger Regions Fund • Borrowings estimated of $58m, which would result in an interest expense of $23m • Additional Depreciation of $1.5m • Operating Subsidy of ($0.9m) per year • Total impact over a 40 year period of $217.5
18.2 Cash Flow Expenditure Years 1 to 15
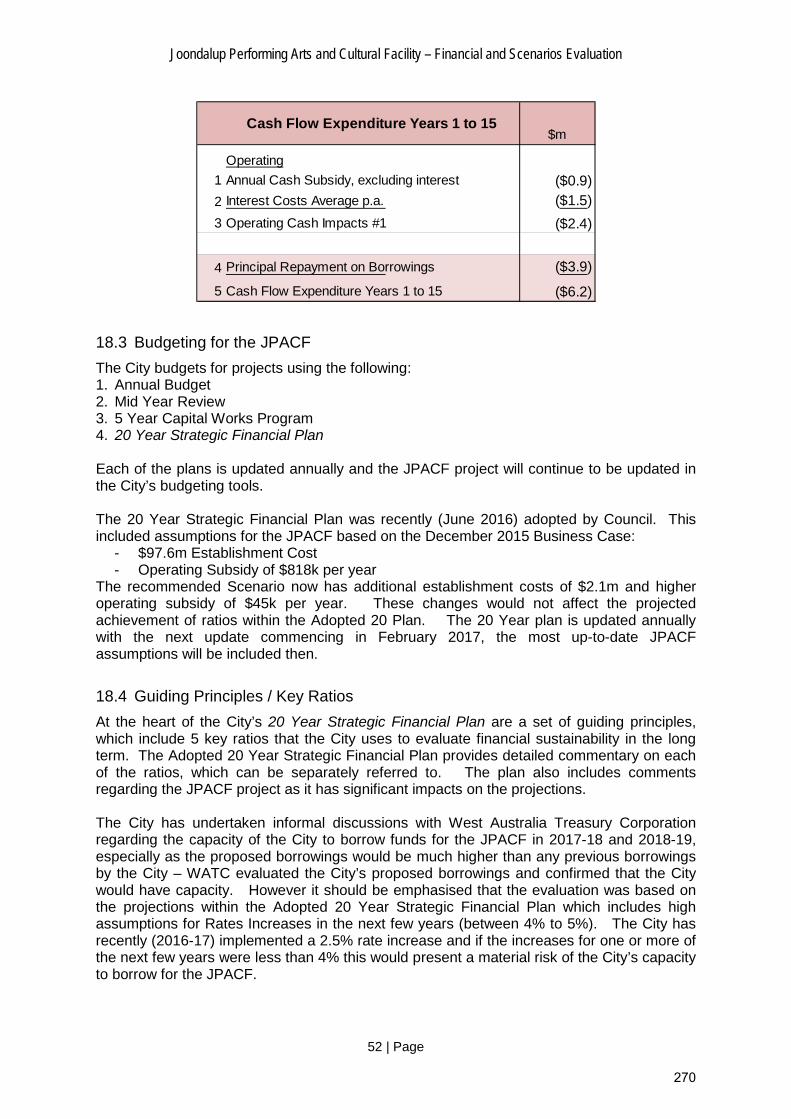
The table below summarises the total cash expenditure per year on average for the first 15 years. This table shows that there will be an average of ($2.4m) per year that impacts on Operating Cash Flow (#1 this excludes Depreciation), this comprises of the ($0.9m) Operating Subsidy and the Interest on borrowings of ($1.5m) per year. The borrowings of $57.8m will result in an average repayment over 15 years of ($3.9m) per year. Therefore the total cash outlay for the project in the first 15 years is an average of ($6.2m) per year. However it should be noted that the City expects to receive additional proceeds from sale of Tamala Park Reserve of $47m, an average of $3m per year over the same timeframe.
($250)
($200)
($150)
($100)
($50)
$0$ms
Net Cumulative Cashflows and Net Present Costs $m
Total Project Cash flows
Net Present Cost
269
Joondalup Performing Arts and Cultural Facility – Financial and Scenarios Evaluation
52 | Page
18.3 Budgeting for the JPACF
The City budgets for projects using the following: 1. Annual Budget 2. Mid Year Review 3. 5 Year Capital Works Program 4. 20 Year Strategic Financial Plan
Each of the plans is updated annually and the JPACF project will continue to be updated in the City’s budgeting tools. The 20 Year Strategic Financial Plan was recently (June 2016) adopted by Council. This included assumptions for the JPACF based on the December 2015 Business Case:
- $97.6m Establishment Cost - Operating Subsidy of $818k per year
The recommended Scenario now has additional establishment costs of $2.1m and higher operating subsidy of $45k per year. These changes would not affect the projected achievement of ratios within the Adopted 20 Plan. The 20 Year plan is updated annually with the next update commencing in February 2017, the most up-to-date JPACF assumptions will be included then.
18.4 Guiding Principles / Key Ratios
At the heart of the City’s 20 Year Strategic Financial Plan are a set of guiding principles, which include 5 key ratios that the City uses to evaluate financial sustainability in the long term. The Adopted 20 Year Strategic Financial Plan provides detailed commentary on each of the ratios, which can be separately referred to. The plan also includes comments regarding the JPACF project as it has significant impacts on the projections. The City has undertaken informal discussions with West Australia Treasury Corporation regarding the capacity of the City to borrow funds for the JPACF in 2017-18 and 2018-19, especially as the proposed borrowings would be much higher than any previous borrowings by the City – WATC evaluated the City’s proposed borrowings and confirmed that the City would have capacity. However it should be emphasised that the evaluation was based on the projections within the Adopted 20 Year Strategic Financial Plan which includes high assumptions for Rates Increases in the next few years (between 4% to 5%). The City has recently (2016-17) implemented a 2.5% rate increase and if the increases for one or more of the next few years were less than 4% this would present a material risk of the City’s capacity to borrow for the JPACF.
$m
Operating
1 Annual Cash Subsidy, excluding interest ($0.9)
2 Interest Costs Average p.a. ($1.5)
3 Operating Cash Impacts #1 ($2.4)
4 Principal Repayment on Borrowings ($3.9)
5 Cash Flow Expenditure Years 1 to 15 ($6.2)
Cash Flow Expenditure Years 1 to 15
270
Joondalup Performing Arts and Cultural Facility – Financial and Scenarios Evaluation
53 | Page
19 RISKS, OPPORTUNITIES AND SENSITIVITY ANALYSIS
19.1 Risk & Opportunities - Overview
This business case does not contend that the projections will come to pass exactly as stated above. The project will not cost $217.5m, that is only an estimate, it will either cost more or it will cost less. The business case includes assumptions which may be different for any number of reasons. It is therefore vital to evaluate the risks and opportunities with the business case, so that actions can be considered to mitigate the risk and alternative opportunities considered. There is a higher probability of the overall project costs increasing than decreasing. There is a lot more certainty that the costs will come to pass as expected, but there is a lot more uncertainty that the income or funding will come to pass as projected. The comments on specific risks and opportunities will be analysed separately for each set of cash flows:
1. Capital Costs/Funding. 2. Operating Analysis.
Financial impacts will follow the same convention as used throughout the report i.e. Risks (adverse impacts) are negative and Opportunities are positive. The risk has also been assessed using the City’s Risk Management Framework with the risk consequence, impact and level subject to comment within the analysis. The sensitivity analysis and risks are as important as the projections in the rest of the paper so that the full potential impacts can be considered.
271

Joondalup Performing Arts and Cultural Facility – Financial and Scenarios Evaluation
54 | Page
19.2 How the Project Costs have changed over time and the Confidence of the Estimates
The Establishment Costs of the project have increased a number of times during the project, but the increases have become lower as the accuracy and detail are refined. The table below summarises the movement in capital costs since 2009. At 2009 the project costs were crudely estimated at $35m and included in the 20 Year Strategic Financial Plan – there was no detailed audit trail for the $35m, the costs were merely a marker for inclusion in the 20 Year Strategic Financial Plan. Meanwhile in 2012 the costs were increased to $50.6m but again without any detailed QS Costings – the other key issue regarding the $50.6m is that it was based on a Traditional Performing Arts Centre as opposed to an Arts Box which has a much wider scope. The estimate for an Arts Box was first considered in 2013 following the Pracsys Feasibility Study and since then the estimates have become more refined. The table below also includes a scale to indicate the confidence of the assumption. This shows that the estimates in 2009 and 2012 had no or little confidence. The confidence steadily improves over the past few years, although even at this stage the estimates cannot yet be determined as being 100% accurate, these uncertainties will only be resolved after Detailed Design and tender.
Stage $m #1 Confidence of Estimate #2
1 2009 Adopted SFP $35.0 1 High Level estimate only, no detailed basis for the estimate i.e. no concept design
2 2012 Adopted SFP (Nov 2012) $50.6 1 High level estimate only of a Traditional Performing Arts Centre, as opposed to an "Art Box"
3Pracsys Feasibility Study (March 2013)
$79.5 2Council resolved to increase scope of the facility to "Art Box" rather than a traditional Arts Centre. Costings were based on Rough Order of Magnitude only and not a detailed QS
4 Concept Design (April 2014) $90.7 3Based on ARM Concept Design from the Architectural Design Competition (2013). Costings included a QS Elemental Breakdown but were Concept Design only
5 2014 Adopted SFP (Jun 2014) $94.2 3Costs were increased to include Jinan Gardens and escalation since the 2013 Design Competition
6 2015 Adopted SFP (Dec 2015) $97.6 3 Increase to take account of Traffic Treatment, External Works and escalation
7 Schematic Design (July 2016) $99.7 4 Confidence of estimates has improved, although there is still some risk in the estimated rates.
8 Detailed Design 5 Detailed Design / Tender will provide certainty on the costs
#2 Confidence of estimate is based on a scale of 1 to 5, where 1 has no confidence at all and 5 is very confident#1 Excludes escalation
272

Joondalup Performing Arts and Cultural Facility – Financial and Scenarios Evaluation
55 | Page
19.3 Establishment Costs - Capital Costs and Funding - Risk & Opportunities
The table below lists various risks and opportunities and their potential impact on the capital costs or funding. The total best case is that the Establishment Costs may be $4m lower, but the Worse Case is a total worsening cash flow of ($37m). In summary, there is much more probability that the establishment costs will worsen than they will improve.
Risk / Opportunity Cashflow Impact $m Risk Classification and Actions
Subject Details Worse Case
Mid
Best Case
1 Capital Costs higher than estimated
The costs at Schematic Design are not final; the Detailed Design stage will provide further refinement whilst the tender/procurement stage will also provide changes. Therefore the Capital Costs of $99.7m must be recognised as an estimate based on a set of assumptions – the final outcome will NOT be $99.7m, it will be higher or it will be lower. ARM has provided an evaluation of the range of probabilities for some of the most expensive capital items. This indicates a high level of confidence in the volume assumptions but a lower level of confidence in the rates. The evaluation has been used to prepare the overall worse case increase that could arise or the best case reduction in costs. This indicates the following: - Best case is that the costs may be $95.7m instead of $99.7m, a reduction of $4m - Worse Case is that the costs could be $113.7m, an increase of $14m. However it must be emphasised that this is an extreme worse case.
($14m)
($5m)
$4m
o This likelihood is POSSIBLE, the consequence is medium and therefore the overall risk score is LOW.
o The risks of the capital costs increasing can be managed as follows - All future specification changes are evaluated
individually with a Cost/Benefit Analysis taking account of operational implications
- Capital Costs remain as they are in the business case and the project needs to find ways to manage the cost increase. This could be achieved by reviewing other design issues, or managing the procurement process to ensure that the overall costs remain within budget.
- Contingency already included in the Capital Cost estimates and may be sufficient to cover the costs of these additional items
- Tender has the opportunity (particularly in the current market place) to provide cost reductions which cover the risks of unforeseen costs.
273
Joondalup Performing Arts and Cultural Facility – Financial and Scenarios Evaluation
56 | Page
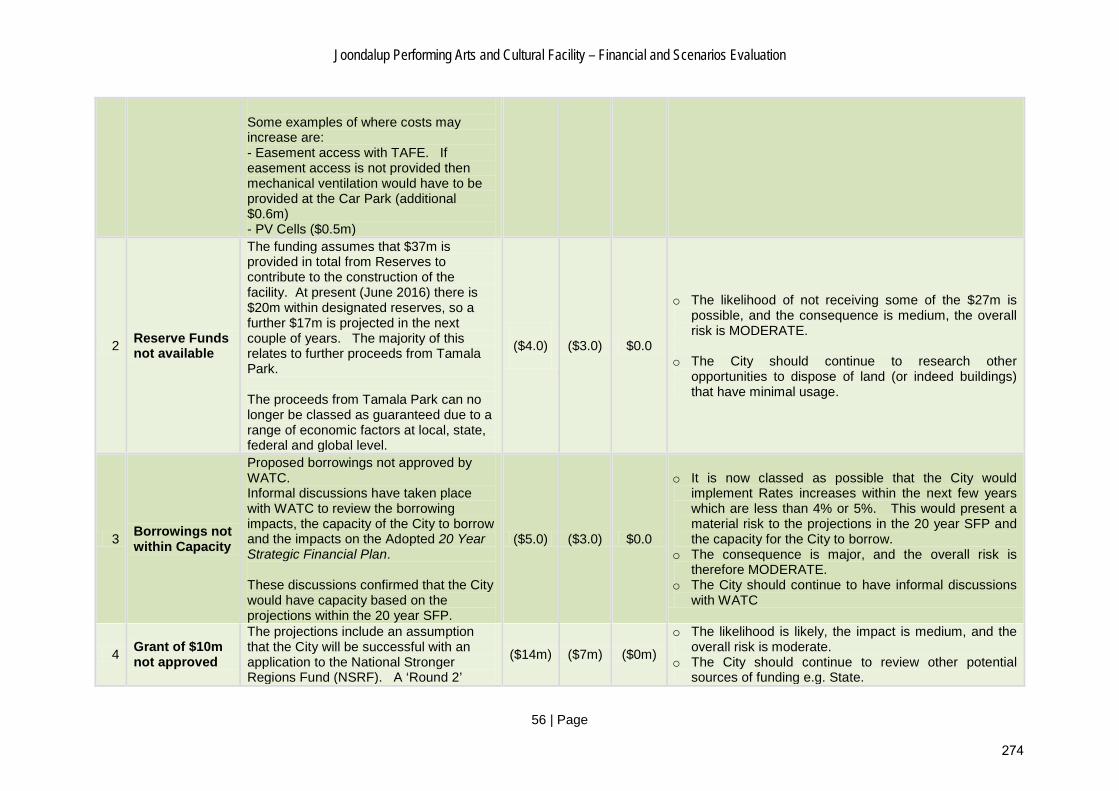
Some examples of where costs may increase are: - Easement access with TAFE. If easement access is not provided then mechanical ventilation would have to be provided at the Car Park (additional $0.6m) - PV Cells ($0.5m)
2 Reserve Funds not available
The funding assumes that $37m is provided in total from Reserves to contribute to the construction of the facility. At present (June 2016) there is $20m within designated reserves, so a further $17m is projected in the next couple of years. The majority of this relates to further proceeds from Tamala Park. The proceeds from Tamala Park can no longer be classed as guaranteed due to a range of economic factors at local, state, federal and global level.
($4.0)
($3.0) $0.0
o The likelihood of not receiving some of the $27m is possible, and the consequence is medium, the overall risk is MODERATE.
o The City should continue to research other
opportunities to dispose of land (or indeed buildings) that have minimal usage.
3 Borrowings not within Capacity
Proposed borrowings not approved by WATC. Informal discussions have taken place with WATC to review the borrowing impacts, the capacity of the City to borrow and the impacts on the Adopted 20 Year Strategic Financial Plan. These discussions confirmed that the City would have capacity based on the projections within the 20 year SFP.
($5.0) ($3.0) $0.0
o It is now classed as possible that the City would implement Rates increases within the next few years which are less than 4% or 5%. This would present a material risk to the projections in the 20 year SFP and the capacity for the City to borrow.
o The consequence is major, and the overall risk is therefore MODERATE.
o The City should continue to have informal discussions with WATC
4 Grant of $10m not approved
The projections include an assumption that the City will be successful with an application to the National Stronger Regions Fund (NSRF). A ‘Round 2’
($14m) ($7m) ($0m)
o The likelihood is likely, the impact is medium, and the overall risk is moderate.
o The City should continue to review other potential sources of funding e.g. State.
274

Joondalup Performing Arts and Cultural Facility – Financial and Scenarios Evaluation
57 | Page
application was made in July 2015 and failed, so it is possible that the ‘Round 3’ application made in March 2016 will not succeed either. The total impact (Worse case) would be $14m as additional borrowings would be required to bridge the gap which would attract interest costs of $4m.
o It may be worthwhile for the overall case to be reconsidered if the Grant Application is unsuccessful.
275
Joondalup Performing Arts and Cultural Facility – Financial and Scenarios Evaluation
58 | Page
19.4 Potential Opportunity – Cap the Establishment Costs at $97.6m
The previous Business Case (December 2015) indicated an overall cost to establish the project of $97.6m. The $97.6m estimate was used to update the recently adopted 20 Year Strategic Financial Plan. The revised estimates for the favoured Scenario 2 are $2.1m higher, with a total revised cost of $99.7m. It may be worth capping the capital costs at $97.6m and reducing some parts of the specification. Indeed going forward it may be worthwhile to place a cap on the project costs and ensure that any other increase in the capital costs are offset with reductions in other elements.
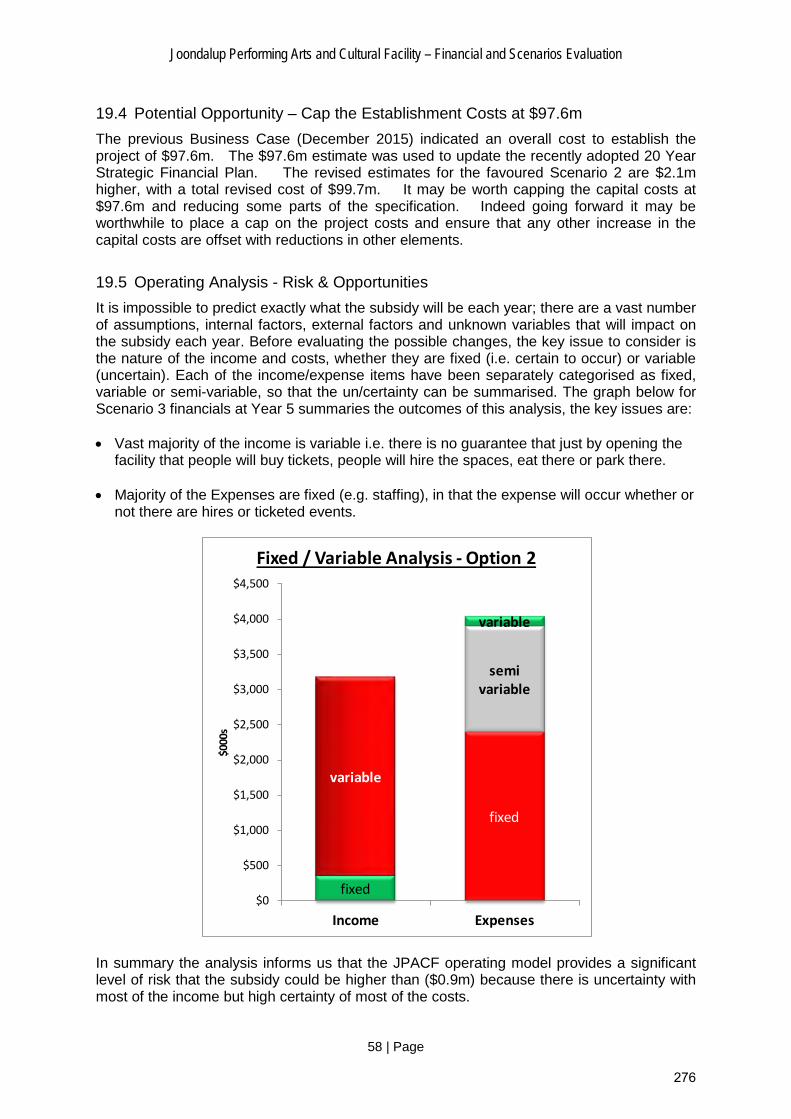
19.5 Operating Analysis - Risk & Opportunities
It is impossible to predict exactly what the subsidy will be each year; there are a vast number of assumptions, internal factors, external factors and unknown variables that will impact on the subsidy each year. Before evaluating the possible changes, the key issue to consider is the nature of the income and costs, whether they are fixed (i.e. certain to occur) or variable (uncertain). Each of the income/expense items have been separately categorised as fixed, variable or semi-variable, so that the un/certainty can be summarised. The graph below for Scenario 3 financials at Year 5 summaries the outcomes of this analysis, the key issues are: • Vast majority of the income is variable i.e. there is no guarantee that just by opening the
facility that people will buy tickets, people will hire the spaces, eat there or park there.
• Majority of the Expenses are fixed (e.g. staffing), in that the expense will occur whether or not there are hires or ticketed events.
In summary the analysis informs us that the JPACF operating model provides a significant level of risk that the subsidy could be higher than ($0.9m) because there is uncertainty with most of the income but high certainty of most of the costs.
fixed
fixed
semi variable
variable
variable
$0
$500
$1,000
$1,500
$2,000
$2,500
$3,000
$3,500
$4,000
$4,500
Income Expenses
$000
s
Fixed / Variable Analysis - Option 2
276

Joondalup Performing Arts and Cultural Facility – Financial and Scenarios Evaluation
59 | Page
The table below evaluates some of the financial risks and opportunities of the annual Operating Subsidy.
Risk / Opportunity Subsidy Impact $m Risk – How to Mitigate /
Subject Details Worse Case
Mid Best Case
Opportunity – How to Exploit
1 Audience Activation
By year 5, the program and audience need to be well developed to achieve industry standard utilisation and a subsidy of ($0.9m) per year. There will need to be significant effort in Years 1 to 4 to help develop the program/audience. There is a risk that the subsidy will be higher than ($0.9m), comparison to other facilities confirms this whilst the nature of the cash flows (uncertainty of income but certainty of costs) is another key factor. Therefore the worse case is that the subsidy could be ($1.0m) higher i.e. a total subsidy of ($1.9m) per year
($1.0) ($0.5) $0.0
o This likelihood is possible, the consequence is major and therefore the overall risk score is MODERATE.
o Full consideration of how to activate the facility
is crucial so that the Year 5 Financial Targets can be achieved, e.g. - High profile company to activate
Restaurant space in its own right - Encourage (large discount ?) a company
to become resident in the space for the first couple of years (at least) to help build a name for the facility
- Program built up 1 to 2 years before facility opens
2
Conferences, Exhibitions, Studios, Gallery
There is now much higher income included in the projections than previous estimates.
($0.2) ($0.1) $0.0
o This likelihood is possible and the consequence is minor and therefore the overall risk score is LOW.
o Continue to review the utilisation assumptions.
3 Finance Officer
The projections now assume a full-time Finance officer within the JPACF. There is an opportunity for the financial support to be provided by the COJ Finance team.
$0.1 $0.1 $0.1 o Cost benefit Analysis will be required to justify
all staff that the JPACF intends to use, that could otherwise be supported by the City
4
Occupancy / Catchment Area / Social Economic Profile
Catchment area in the revised projections is much larger than other Regional Arts Facilities. It is possible that the opportunities for utilisation and occupancy are higher than projected. Additionally the demographics of the catchment area indicate a higher level of education and appetite for arts participation/attendance than average.
$0.1 $0.2 $0.3
o The marketing of the facility should consider the full catchment area ensuring the facility becomes recognised as a regional facility and not just a City of Joondalup facility
277

Joondalup Performing Arts and Cultural Facility – Financial and Scenarios Evaluation
60 | Page
However the City should bear in mind that WA is isolated and it can often be difficult to attract artists to the area.
5 Operating Grants
MPAC receive funding from Federal body to help subsidise some performances (e.g. with travel costs), but this may be discontinued in future as no longer classed as Regional. The Department of Culture Arts have a range of grants available to help support activities but it is deemed unlikely that these could be accessed and mitigate the subsidy
$0.0 $0.0 $0.0 o Further consultation with the Department of
Culture & Arts.
6 Building Maintenance and Utilities
The revised projections have now increased the Utility and Building maintenance costs based on consultancy advice.
$0.0 $0.1 $0.2 Continue to review the projections for the Building Maintenance and Repair costs. Bottom up analysis (i.e. space by space) required.
7 Volunteers Many Arts Facilities use Volunteers, people who have an interest in supporting the facility
Tbc Tbc Tbc
Set up a Volunteer program as early as possible. Analysis of volunteers used by other centres and identification of the possible savings.
8 Buy a Seat Is there an opportunity for patrons to purchase a seat, which provides them with the opportunity of discounted tickets
$0.1 $0.1 $0.2 This could provide the JPACF with additional income, for example $500 per seat x 400 seats. To be investigated
9 Parking Utilisation
The projections from Year 15 assume 50% utilisation of the parking bays during the day. This could be higher or lower due to a range of factors e.g. development in immediate area.
($0.2) ($0.05) $0.2
Continue to review and update utilisation assumptions.
10 Parking Cost of Sales
It is now assumed that the existing parking team should be used to assist with operating the parking at the JPACF. However the City could consider at a later point in time that it would prefer dedicated staff during the day
($0.1) ($0.05) $0.0 Continue to review the operating model for the Parking Facility in conjunction with the Parking Services Team.
278

JPACF Business Case Supporting Document – Financial Evaluation
61 | P a g e
19.6 Sensitivity Analysis
The table below summarises the sensitivity of the overall cash flows for Scenario 3 i.e. how much higher or lower than the $217.5 million the outcome may be by 2058-59. The parameters used for the analysis are: - Capital Costs being higher or lower than the $99.7m currently estimated. It is more likely
that the capital costs could be higher than the $99.7m than lower, and therefore the analysis evaluates the impacts of a 30% increase to capital costs but only considers a reduction of 10%. These are evaluated in steps of 5%.
- Operating Subsidy being $400,000 less than the $863,000 estimated or $400,000 more. These are evaluated in steps of $100,000.
The results of the sensitivity analysis indicate that the overall cost by 2058-59: - Best case could be $165 million which would arise if the capital costs were 10% lower
and the Operating Subsidy was $400,000 less - Worst Case could be $318 million which would arise if capital costs were 30% higher and
the Operating Subsidy was $400,000 more.
Cost of Facility Different to $99.7m-10% -5% 0% 5% 10% 15% 20% 25% 30%
($463) ($165) ($173) ($180) ($188) ($195) ($203) ($211) ($218) ($244)($563) ($174) ($182) ($190) ($197) ($205) ($212) ($220) ($227) ($253)($663) ($184) ($191) ($199) ($206) ($214) ($222) ($229) ($237) ($262)
($763) ($193) ($201) ($208) ($216) ($223) ($231) ($238) ($246) ($272)
($863) ($202) ($210) ($217) ($225) ($233) ($240) ($248) ($255) ($281)
($963) ($212) ($219) ($227) ($234) ($242) ($249) ($257) ($265) ($290)($1,063) ($221) ($228) ($236) ($244) ($251) ($259) ($266) ($274) ($299)($1,163) ($230) ($238) ($245) ($253) ($260) ($268) ($276) ($283) ($309)($1,263) ($239) ($247) ($255) ($262) ($270) ($277) ($285) ($292) ($318)
Op
erating
Su
bsid
yp
er year
279

JPACF Business Case Supporting Document – Financial Evaluation
62 | P a g e
19.7 Further Reviews of the Financial Projections
The financial projections are based on a set of assumptions. It is not expected that the projections will come to pass exactly as shown. The financials have been, and will continue to be, constantly reviewed, so that the risk and sensitivity of the project can be managed and the forward projections updated in the annual budget, 5 year Capital Works and future updates of the 20 Year Strategic Financial Plan. Below are some of the key improvements required to the financial projections: • Utilities – detailed review of each space in the JPACF, the potential usage, power
required and detailed Utility forecast. At present the forecast is still high level. • Building Maintenance & Utility Costs built up bottom up. • Capital Replacement – detailed review of each capital element (QS Breakdown) and
consideration of the likely life cycle. • Commercial returns of each area. It would be a useful exercise to allocate the income
and all costs to each individual space, and compare to the capital costs. This would give an indication of the commercial return/loss of each space.
19.8 Reviews undertaken of the Financial Modelling
The analysis used within the financial evaluation does not contend to be precise. The analysis is deemed reasonable taking account of the assumptions by the project and provides robust supporting information to the Business Case and to assist decision makers with evaluating the project. In support of the Financial Analysis it is worth noting that there have been two external reviews of the Financial Analysis and Financial Modelling: • November 2015 – external review of financial projections • 2016 – Integrity Review of Financial Model used for JPACF project Both reviews provide the City with a high level of assurance regarding the techniques and financial models used in the evaluation.
280
JPACF Business Case Supporting Document – Financial Evaluation
63 | P a g e
APPENDICES
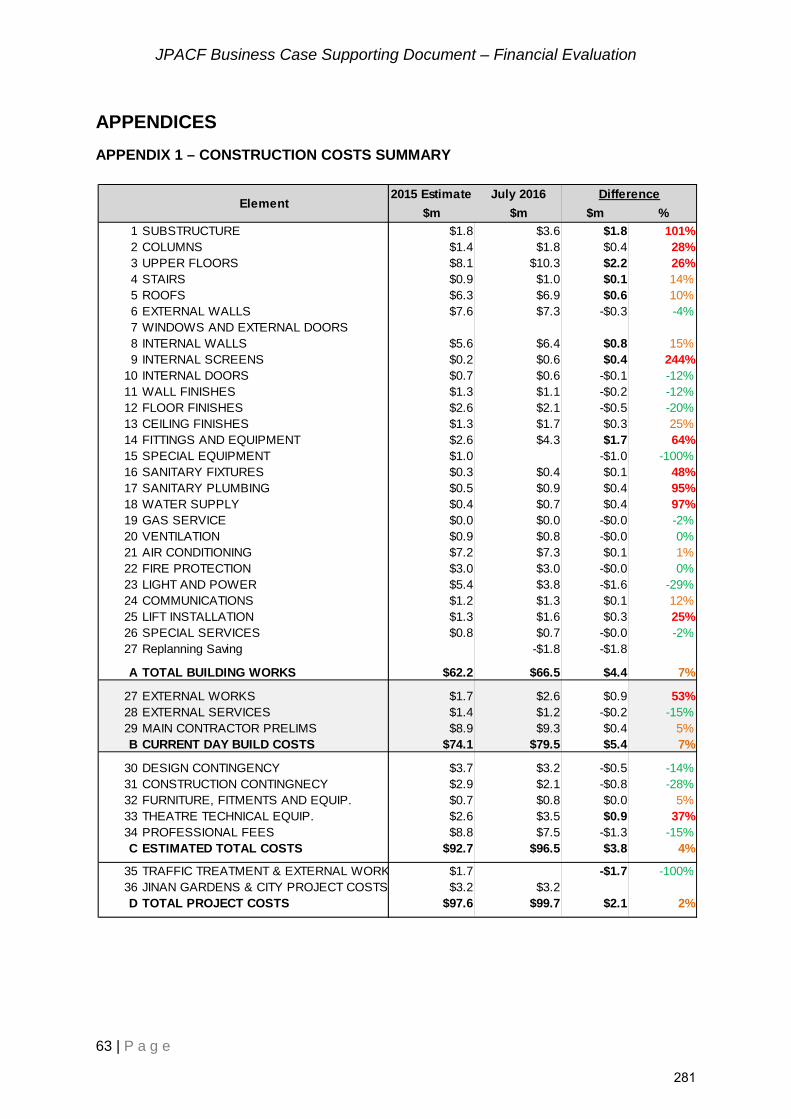
APPENDIX 1 – CONSTRUCTION COSTS SUMMARY
2015 Estimate July 2016 Difference
$m $m $m %
1 SUBSTRUCTURE $1.8 $3.6 $1.8 101%2 COLUMNS $1.4 $1.8 $0.4 28%3 UPPER FLOORS $8.1 $10.3 $2.2 26%4 STAIRS $0.9 $1.0 $0.1 14%5 ROOFS $6.3 $6.9 $0.6 10%6 EXTERNAL WALLS $7.6 $7.3 -$0.3 -4%7 WINDOWS AND EXTERNAL DOORS8 INTERNAL WALLS $5.6 $6.4 $0.8 15%9 INTERNAL SCREENS $0.2 $0.6 $0.4 244%
10 INTERNAL DOORS $0.7 $0.6 -$0.1 -12%11 WALL FINISHES $1.3 $1.1 -$0.2 -12%12 FLOOR FINISHES $2.6 $2.1 -$0.5 -20%13 CEILING FINISHES $1.3 $1.7 $0.3 25%14 FITTINGS AND EQUIPMENT $2.6 $4.3 $1.7 64%15 SPECIAL EQUIPMENT $1.0 -$1.0 -100%16 SANITARY FIXTURES $0.3 $0.4 $0.1 48%17 SANITARY PLUMBING $0.5 $0.9 $0.4 95%18 WATER SUPPLY $0.4 $0.7 $0.4 97%19 GAS SERVICE $0.0 $0.0 -$0.0 -2%20 VENTILATION $0.9 $0.8 -$0.0 0%21 AIR CONDITIONING $7.2 $7.3 $0.1 1%22 FIRE PROTECTION $3.0 $3.0 -$0.0 0%23 LIGHT AND POWER $5.4 $3.8 -$1.6 -29%24 COMMUNICATIONS $1.2 $1.3 $0.1 12%25 LIFT INSTALLATION $1.3 $1.6 $0.3 25%26 SPECIAL SERVICES $0.8 $0.7 -$0.0 -2%27 Replanning Saving -$1.8 -$1.8
A TOTAL BUILDING WORKS $62.2 $66.5 $4.4 7%
27 EXTERNAL WORKS $1.7 $2.6 $0.9 53%28 EXTERNAL SERVICES $1.4 $1.2 -$0.2 -15%29 MAIN CONTRACTOR PRELIMS $8.9 $9.3 $0.4 5%B CURRENT DAY BUILD COSTS $74.1 $79.5 $5.4 7%
30 DESIGN CONTINGENCY $3.7 $3.2 -$0.5 -14%31 CONSTRUCTION CONTINGNECY $2.9 $2.1 -$0.8 -28%32 FURNITURE, FITMENTS AND EQUIP. $0.7 $0.8 $0.0 5%33 THEATRE TECHNICAL EQUIP. $2.6 $3.5 $0.9 37%34 PROFESSIONAL FEES $8.8 $7.5 -$1.3 -15%C ESTIMATED TOTAL COSTS $92.7 $96.5 $3.8 4%
35 TRAFFIC TREATMENT & EXTERNAL WORK $1.7 -$1.7 -100%36 JINAN GARDENS & CITY PROJECT COSTS $3.2 $3.2D TOTAL PROJECT COSTS $97.6 $99.7 $2.1 2%
Element
281

JPACF Business Case Supporting Document – Financial Evaluation
64 | P a g e
APPENDIX 2 – ESCALATION ASSUMPTIONS APPLIED
2016-17 2017-18 2018-19 2019-20 2020-21 2021-22 2022-23 2023-24 2024-25 2025-26 and every year until 2058-59
CPI % 2.5% 2.5% 2.5% 2.5% 3.0% 3.5% 3.5% 3.5% 3.5% 3.5% 3.5%Employment Costs % 3.0% 3.0% 3.0% 3.0% 3.0% 3.0% 3.0% 3.0% 3.0% 3.5% 3.5%Utilities % 3.3% 3.3% 3.3% 3.3% 3.8% 4.3% 4.3% 4.3% 4.3% 4.3% 4.3%Parking Fees % 20.0% 16.7% 14.3% 12.5% 5.6% 5.3% 5.0% 5.0% 5.0% 3.5% 3.5%
282

JPACF Business Case Supporting Document – Financial Evaluation
65 | P a g e
T: 08 9400 4000
283

Appendix 5 - Economic Activity Report: Australian Performing Arts Centres Association (July, 2015)
284

2015 Economic Activity Report
Australian Performing Arts Centres Association www.apaca.com.au Published July 2016 Prepared by Ruth Hodgman / Visual Focus
285

2015 Economic Activity Report 1
Table of Contents
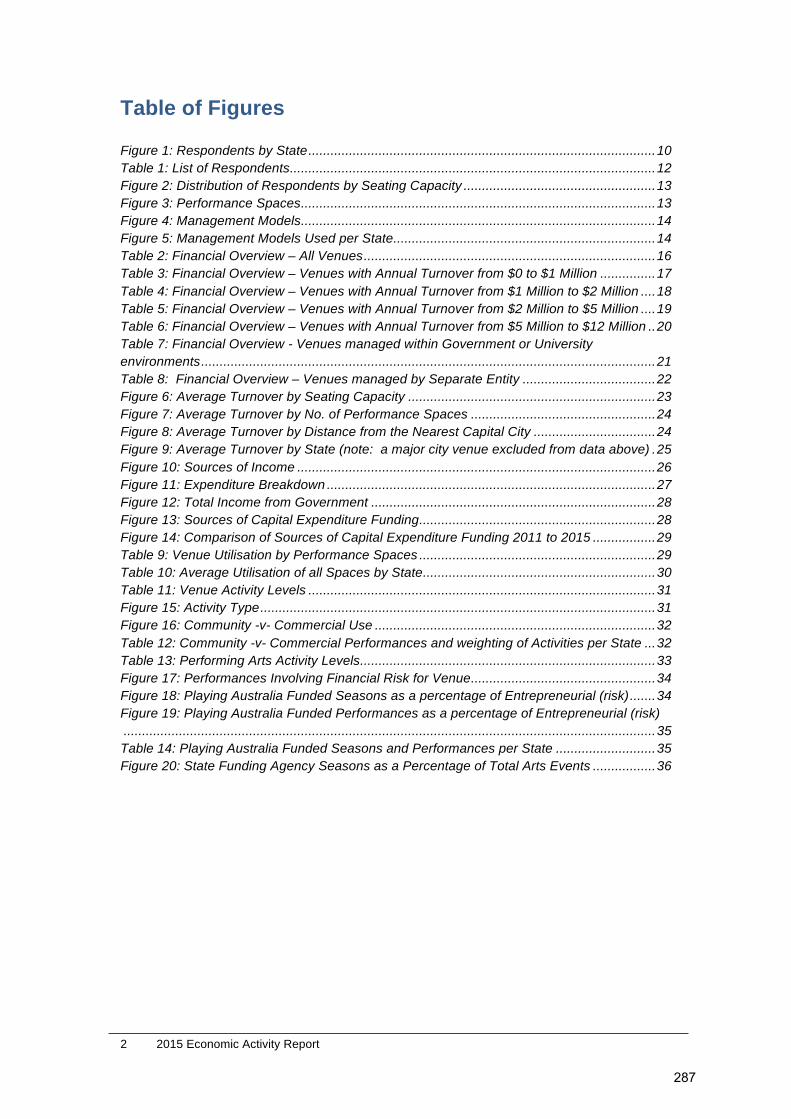
Table of Figures ......................................................................................................... 2
EXECUTIVE SUMMARY ............................................................................................. 3 Methodology ............................................................................................................ 3 Findings .................................................................................................................... 4 Conclusions .............................................................................................................. 7
INTRODUCTION ......................................................................................................... 8
AIM .............................................................................................................................. 8
METHODOLOGY ........................................................................................................ 8 Response Rates ...................................................................................................... 9
FINDINGS .................................................................................................................. 11 Respondents .......................................................................................................... 11 Capacity ................................................................................................................. 13 Financial Snapshot ................................................................................................ 15 Turnover ................................................................................................................. 23 Expenses ............................................................................................................... 26 Funding .................................................................................................................. 27 Venue Utilisation .................................................................................................... 29 Activity Levels ........................................................................................................ 30 Programming ......................................................................................................... 32
APPENDIX A: GLOSSARY ....................................................................................... 37
APPENDIX B: QUESTIONNAIRES .......................................................................... 38 © Australian Performing Arts Centres’ Association www.apaca.com.au [email protected] Prepared by Ruth Hodgman Cover Photo from the production Lake by Lisa Wilson Performer: Hsin-Ju Chiu, Photographer: Fen-Lan Chuang
286
2 2015 Economic Activity Report
Table of Figures Figure 1: Respondents by State .............................................................................................. 10 Table 1: List of Respondents ................................................................................................... 12 Figure 2: Distribution of Respondents by Seating Capacity .................................................... 13 Figure 3: Performance Spaces ................................................................................................ 13 Figure 4: Management Models ................................................................................................ 14 Figure 5: Management Models Used per State ....................................................................... 14 Table 2: Financial Overview – All Venues ............................................................................... 16 Table 3: Financial Overview – Venues with Annual Turnover from $0 to $1 Million ............... 17 Table 4: Financial Overview – Venues with Annual Turnover from $1 Million to $2 Million .... 18 Table 5: Financial Overview – Venues with Annual Turnover from $2 Million to $5 Million .... 19 Table 6: Financial Overview – Venues with Annual Turnover from $5 Million to $12 Million .. 20 Table 7: Financial Overview - Venues managed within Government or University environments ........................................................................................................................... 21 Table 8: Financial Overview – Venues managed by Separate Entity .................................... 22 Figure 6: Average Turnover by Seating Capacity ................................................................... 23 Figure 7: Average Turnover by No. of Performance Spaces .................................................. 24 Figure 8: Average Turnover by Distance from the Nearest Capital City ................................. 24 Figure 9: Average Turnover by State (note: a major city venue excluded from data above) . 25 Figure 10: Sources of Income ................................................................................................. 26 Figure 11: Expenditure Breakdown ......................................................................................... 27 Figure 12: Total Income from Government ............................................................................. 28 Figure 13: Sources of Capital Expenditure Funding ................................................................ 28 Figure 14: Comparison of Sources of Capital Expenditure Funding 2011 to 2015 ................. 29 Table 9: Venue Utilisation by Performance Spaces ................................................................ 29 Table 10: Average Utilisation of all Spaces by State ............................................................... 30 Table 11: Venue Activity Levels .............................................................................................. 31 Figure 15: Activity Type ........................................................................................................... 31 Figure 16: Community -v- Commercial Use ............................................................................ 32 Table 12: Community -v- Commercial Performances and weighting of Activities per State ... 32 Table 13: Performing Arts Activity Levels ................................................................................ 33 Figure 17: Performances Involving Financial Risk for Venue .................................................. 34 Figure 18: Playing Australia Funded Seasons as a percentage of Entrepreneurial (risk) ....... 34 Figure 19: Playing Australia Funded Performances as a percentage of Entrepreneurial (risk) ................................................................................................................................................ 35 Table 14: Playing Australia Funded Seasons and Performances per State ........................... 35 Figure 20: State Funding Agency Seasons as a Percentage of Total Arts Events ................. 36
287

2015 Economic Activity Report 3
EXECUTIVE SUMMARY The Australian Performing Arts Centres Association (APACA) is the national peak body servicing the needs and interests of performing arts centres and presenters in regional and metropolitan Australia. APACA’s membership base is broad including performing arts centres, independent producers, small to medium dance and theatre companies, festivals, funding bodies, touring organisations, other industry associations and some of Australia’s major performing arts companies. 63% of APACA’s membership comprises professionally managed performing arts centres located in all corners of Australia from the remote northwest’s Broome Civic Centre to the far north’s Cairns Civic Theatre to southern capitals such as Hobart’s Theatre Royal and The Arts Centre Melbourne and large and small regional centres around the country from The Hopgood Theatre in South Australia to the Dubbo Regional Theatre and Convention Centre in western New South Wales and Darwin Entertainment Centre in the Northern Territory. The Economic Activity survey has now been conducted with fundamentally the same questions in 2006, 2009, 2011, 2013 and now 2015 giving the opportunity to analyse industry trends. The aim of the bi-annual survey project is to measure the extent of operations and economic activity of performing arts centres across Australia.
Methodology The survey was carried out online through Survey Monkey (www.surveymonkey.com) in three parts. The questionnaire was sent to APACA Ordinary Members only, which is those members who manage performing arts venues. There were 83 responses to Part 1 and 74 responses to Part 2 representing 73.5% and 65.5% respectively of the 113 ordinary members. 70 members (62%) responded to both parts although it is noted some did not complete all questions. As responses to each section was voluntary, the number of responses relating to the section’s analysis is noted against the tables and figures in this report. In reviewing the 2015 findings, comparisons have been made with the results of surveys conducted in 2009, 2011 and 2013 to identify emerging trends and industry changes overtime.
288
4 2015 Economic Activity Report
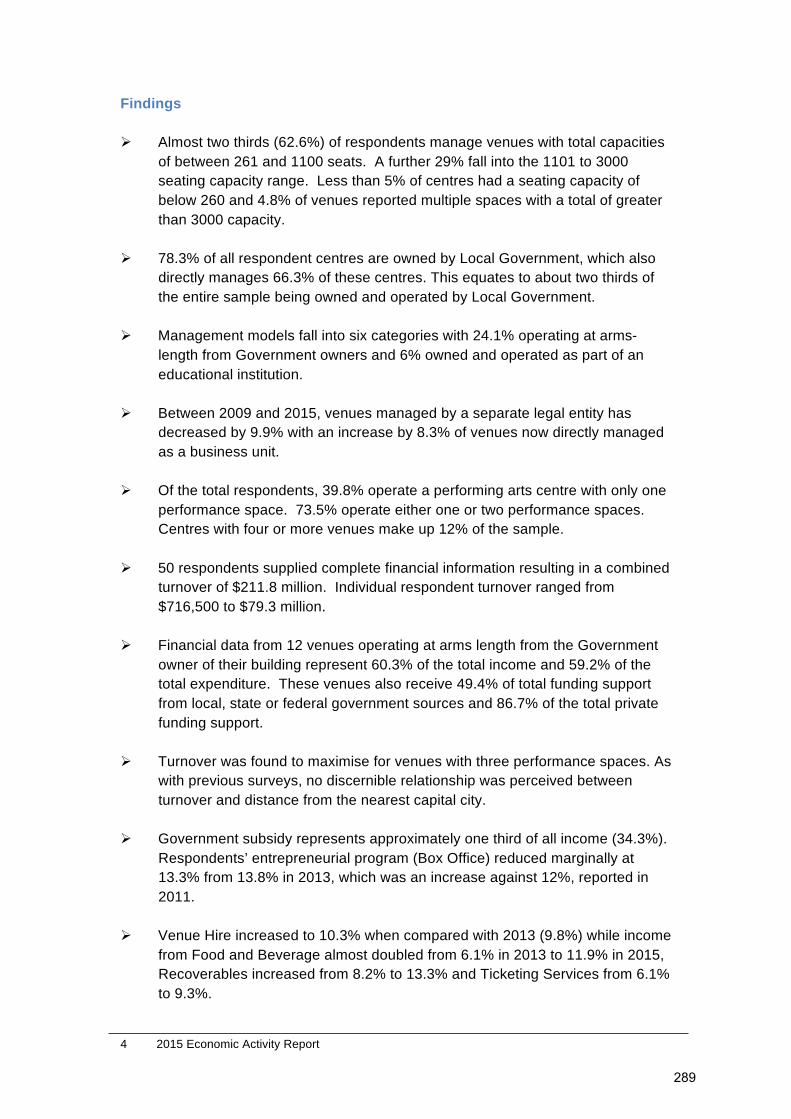
Findings Ø Almost two thirds (62.6%) of respondents manage venues with total capacities
of between 261 and 1100 seats. A further 29% fall into the 1101 to 3000 seating capacity range. Less than 5% of centres had a seating capacity of below 260 and 4.8% of venues reported multiple spaces with a total of greater than 3000 capacity.
Ø 78.3% of all respondent centres are owned by Local Government, which also
directly manages 66.3% of these centres. This equates to about two thirds of the entire sample being owned and operated by Local Government.
Ø Management models fall into six categories with 24.1% operating at arms-
length from Government owners and 6% owned and operated as part of an educational institution.
Ø Between 2009 and 2015, venues managed by a separate legal entity has
decreased by 9.9% with an increase by 8.3% of venues now directly managed as a business unit.
Ø Of the total respondents, 39.8% operate a performing arts centre with only one
performance space. 73.5% operate either one or two performance spaces. Centres with four or more venues make up 12% of the sample.
Ø 50 respondents supplied complete financial information resulting in a combined
turnover of $211.8 million. Individual respondent turnover ranged from $716,500 to $79.3 million.
Ø Financial data from 12 venues operating at arms length from the Government
owner of their building represent 60.3% of the total income and 59.2% of the total expenditure. These venues also receive 49.4% of total funding support from local, state or federal government sources and 86.7% of the total private funding support.
Ø Turnover was found to maximise for venues with three performance spaces. As
with previous surveys, no discernible relationship was perceived between turnover and distance from the nearest capital city.
Ø Government subsidy represents approximately one third of all income (34.3%).
Respondents’ entrepreneurial program (Box Office) reduced marginally at 13.3% from 13.8% in 2013, which was an increase against 12%, reported in 2011.
Ø Venue Hire increased to 10.3% when compared with 2013 (9.8%) while income
from Food and Beverage almost doubled from 6.1% in 2013 to 11.9% in 2015, Recoverables increased from 8.2% to 13.3% and Ticketing Services from 6.1% to 9.3%.
289

2015 Economic Activity Report 5
Ø The predominant expense for centres remains labour at 41.4%, a reduction from 44.4% in 2013.
Ø Respondents spent just over $33.5million purchasing and presenting their
programs, with another $9.4million spent on marketing these events and their venues.
Ø Local Government still represents the most significant government contributor
with respondents reporting $57.4million or a consistent 78.9% (78.9% reported in 2013).
Ø $29.2 million in capital funding was received for projects conducted by 40
venues. 8 venues reported that almost 30% of the combined capital funding came from alternative sources to the three levels of Government.
Ø The average utilisation rate for all performance spaces is up to 59% from 58%
in 2013 and the average utilisation rate for primary performance space has been maintained at 59% (down from 61% in 2011).
Ø As cultural hubs in their respective communities, performing arts centres host a
range of both arts and community events. More than 9.1million people attended over 36,000 events of some kind at the respondents’ venues.
Ø In 2015, 33% of arts centre activities were determined as non-arts events
(down from 34% in 2015 and 37% in 2011), which demonstrates the importance of performing arts venues as a resource for each community that fulfils a variety of needs that are not necessarily arts related.
Ø 52.2% of respondents’ venue usage is attributed to community events referring
to events produced by amateur groups, dance schools etc. (See Appendix 1 for definitions). This represents a significant decrease from 65% in 2013 and 55% in 2011.
Ø Commercial performances has significantly increased from 35% to 47.8%
providing evidence that venues are being required to increase earned income as funding conditions tighten.
Ø Seasons presented or co-presented by the respondents [that is where there is
a financial risk to the presenter] make up 48% of the total performances presented.
Ø Of the total seasons on which respondents incurred full or part financial risk,
Playing Australia supported 15%, a reduction from 21% in 2013. This represents 4.6% of all performing arts performances in the respondents’ venues.
Ø State based funding provides 14% of the support for venues to present their
entrepreneurial programming.
290

6 2015 Economic Activity Report
Ø Performances presented or co-presented by the respondents make up 48% of
the total performances presented. This is a further increase from 2013 levels (41%) and 2011 levels (37%) and continues to demonstrate the growing trend towards entrepreneurial programming.
Ø 30 venues operate with a dedicated programming budget representing an investment in entrepreneurial activities of approximately $8.5 million annually.
Ø 70% of venues (n=30) reporting they were able to budget for a net loss
annually on their programming budget, also reported either an annual surplus or breakeven result in their overall operating result from all venue activities.
Ø Of the respondents reporting on how an annual surplus is treated (n=33), 18
(54.5%) stated that they were able to retain this amount within their operations.
291

2015 Economic Activity Report 7
Conclusions The respondents represented a wide range of performing arts centres, both in geographical spread from capital city to remote and in the size of enterprise, demonstrating the breadth of the APACA membership across Australia. Local government remains at the centre of the sector, playing a most significant role in the management and operational funding of performing arts centres. Arms length management is preferred for larger enterprises particularly those funded through State and Territory Governments. Performing arts centres are increasingly taking on greater risk in order to earn additional income and are looking to alternative funding sources, particularly to support their capital requirements and new infrastructure projects. Venues continue to be important community resources, with high levels of subsidised community and non-arts related activity undertaken within these facilities. Playing Australia funds continue to deliver a proportion of seasons into venues, and remains an integral aspect of venue’s entrepreneurial programs. Performing arts centres are also taking more risk in their programming reflecting the importance of self presented program activity, which delivers significant, economic and arts activity in the respondents’ individual communities. Playing Australia funds are catalysts for programming, in turn stimulating a significant percentage of employment expenditure of $85.7 million annually in the community in addition to the work generated through artists’ fees with the $22 million invested in touring productions. Playing Australia alongside each State’s touring funding programs are essential in the activation of national touring particularly for venues located in regional and remote communities. The respondent venues invested an additional $20.9 million in presenting and marketing events supported by Playing Australia. Venues are highly valued in their community as the central focus for arts and entertainment access for audiences and generate employment opportunities for artists, venue workers and for the supporting industries in hospitality directly reported in this survey. The on-going impact where APACA members operate is shown to be excelling with the return on investment generating artistic, social and economic benefits for communities.
292

8 2015 Economic Activity Report
INTRODUCTION The Australian Performing Arts Centres’ Association (APACA) represents 190 organisations throughout Australia. 63% of these members operate a professionally managed performing arts centres. Other members (37%) are from organisations that have substantially similar objectives to the Association and include producing companies, touring organisations and funding bodies. Our members operate predominantly in the subsidised sector. There are four international members. The performing arts centres’ sector presents productions from a vast array of art forms from plays, opera and classical music, to comedy, circus and contemporary dance. Typically the sector operates with a limited resource base in service of delivering benefits to their community. Whilst members are geographically dispersed, technology facilitates regular communication that has developed the sector into a strong network.
AIM The purpose of this survey and report is twofold. In the first instance, it is to provide members with comparative data that will assist in decision-making. Secondly, the report will provide information regarding the scale of operations of the sector. Performing arts centres often work in isolation as a result of the relatively unique nature of the industry and their geographic location. Similarly, lean staff structures and resource limitations restrict the ability of organisations to undertake research to inform the management and operation of their organisations and provide an evidence base for decision-making. The overall aim of this project was to measure the extent of operations and economic activity of performing arts centres across Australia.
METHODOLOGY APACA undertook research into its members’ economic activity for the first time in 2006, and again in 2009, 2011 and 2013. This is the fifth such survey. Primary research has been undertaken due to a lack of consistent, standardised and available secondary data. All iterations of the project have revealed an on-going problem in the agreement on common definitions of terms used within the industry. A glossary of how terms are used in respect of this research is provided at Appendix A. Each time this research is undertaken, APACA endeavours to further clarify usage, but there is still variations within the industry on the use and definition of terms. A review was undertaken prior to commencing the survey design in an attempt to clarify terminology, maximise participation in order to provide a strong representation of the sector and ensure the information presented met member needs. Based on
293

2015 Economic Activity Report 9
feedback, the geographic disparity of respondents and the extent of variables to be considered in the survey, an online survey tool was considered most effective in achieving high response rates. The questionnaires were distributed over a period November to 2015 to January 2016 through Survey Monkey to Ordinary members only, i.e. those members who manage performing arts venues. The survey tools can be found at Appendix B. Where possible, closed questions were asked requiring respondents to tick boxes or use drop down menus, however some questions required specific quantities and dollar values to be inserted by respondents. Conversely, for some questions it was important to provide an opportunity for respondents to clarify responses and opportunities for general comments were given. Not only did the questionnaires enable accurate collation of data, but also provided valuable insight for developing subsequent surveys.
Response Rates There were 83 responses to Part 1 and 74 responses to Part 2 representing 73.5% and 65.5% respectively of the 113 ordinary members. 4 ordinary members are venue associations in their respective states and excluded from the data. 70 members (62%) responded to both parts although it is noted some did not complete all questions. As responses to each section was voluntary, the number of responses relating to the section’s analysis is noted against the tables and figures in this report. Respondent numbers were slightly lower than in previous surveys however detailed data from a majority of the largest capital city centres is again notably absent from the respondent sample. This has affected data and analysis in various areas of the survey and will be discussed as needed. In Figure 1, the percentage of respondents state by state against total responses is shown and compared with the percentage of total ordinary member venues per state. Both ACT venues responded to the survey registering a 100% response rate with the next highest response rate contributed by New South Wales with 86%. Most states averaged approximately 75% response rates from ordinary members operating venues providing a strong confidence level in the data result.
294

10 2015 Economic Activity Report
Figure 1: Respondents by State
13.8%
27.5%
3.7%
6.4%
19.3%
1.8%
26.6%
1.8%
12.0%
25.3%
3.6%
6.0%
19.3%
1.2%
30.1%
2.4%
0.0% 10.0% 20.0% 30.0% 40.0%
WA
VIC
TAS
SA
QLD
NT
NSW
ACT
Respondents by State Vs Membership (n=83)
Respondents
295

2015 Economic Activity Report 11
FINDINGS
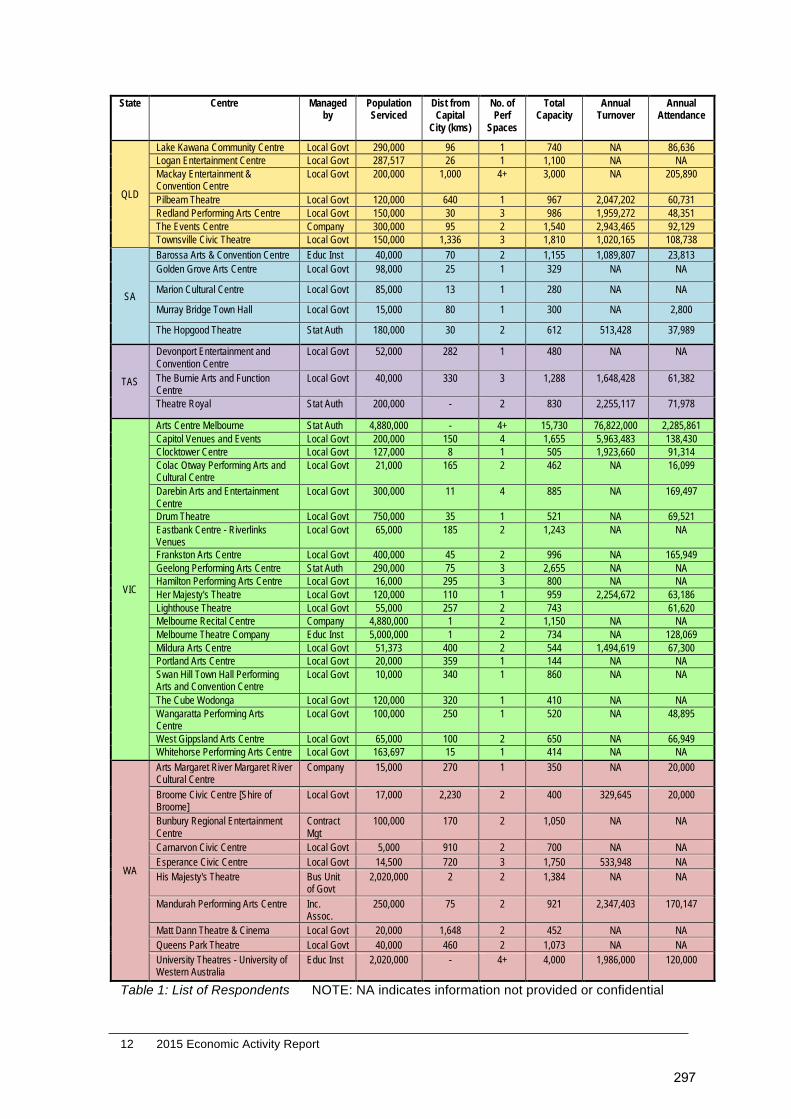
Respondents The following venues listed in Table 1 responded to the survey:
State Centre Managed by
Population Serviced
Dist from Capital
City (kms)
No. of Perf
Spaces
Total Capacity
Annual Turnover
Annual Attendance
ACT Canberra Theatre Centre Stat Auth 900,000 - 3 1,954 9,008,931 219,716 The Street Theatre Contract
Mgt 350,000 - 3 400 NA NA
NSW
Albury Entertainment Centre Local Govt 180,000 320 1 818 1,884,486 63,828 Bathurst Memorial Entertainment Centre
Local Govt 42,000 200 2 1,642 1,790,579 47,791
Capitol Theatre Tamworth Local Govt 60,000 405 3 6,102 1,260,768 69,073
Casula Powerhouse Local Govt 190,000 40 1 326 NA 71,329
Cessnock Community Performing Arts Centre
Local Govt 53,000 152 1 466 706,545 15,535
City Recital Hall Angel Place Company 4,293,000 - 1 1,238 NA NA
Coffs Harbour Jetty Memorial Theatre
Local Govt 75,000 300 1 249 NA NA
Dubbo Regional Theatre and Convention Centre
Local Govt 120,000 408 1 1,250 4,340,787 65,493
Griffith Regional Theatre Local Govt 55,000 575 1 523 1,189,413 24,080
Hurstville Entertainment Centre Local Govt 215,000 16 2 1,128 NA 137,233
Illawarra Performing Arts Centre
Company 485,118 84 4+ 801 3,705,683 130,846
Joan Sutherland Performing Arts Centre
Company 500,000 55 3 1,288 3,418,069 224,505
Laycock Street Com. Theatre Local Govt 330,000 80 2 516 NA NA
Manning Entertainment Centre Local Govt 95,000 310 1 505 721,071 26,843
Monkey Baa Theatre Company Company 4,293,000 - 1 380 NA NA
NIDA Parade Theatres Educ Inst 100,000 10 4 1,260 NA 46,000
NORPA, Northern Rivers Performing Arts
Company 240,000 200 2 750 NA NA
Orange Civic Theatre Local Govt 100,000 255 1 502 2,111,945 44,990
Queanbeyan Performing Arts Centre
Local Govt 443,409 10 1 346 NA 30,181
Riverside Theatres Parramatta Local Govt 200,000 26 3 1,062 5,199,616 160,673
Seymour Centre Educ Inst 4,293,000 2 4 1,704 3,938,997 203,905
Shoalhaven Ent. Centre Local Govt 120,000 160 2 1,100 1,914,903 54,223
Sutherland Ent. Centre Local Govt 280,000 23 3 1,165 1,913,939 151,477
The Glasshouse Arts Conference and Ent. Centre
Local Govt 75,000 388 2 694 4,016,100 122,000
Wagga Wagga Civic Theatre Local Govt 120,000 453 1 491 NA NA
NT Darwin Entertainment Centre Company 136,245 - 2 1,280 NA 87,867
QLD
Brisbane Powerhouse Local Govt 2,100,000 3 3 875 10,745,799 NA Brolga Theatre Local Govt 102,000 256 1 900 1,191,000 41,853 Burdekin Theatre Local Govt 20,000 1,200 3 1,612 738,393 96,000 Cairns Civic Theatre Local Govt 242,000 1,684 1 669 2,996,353 70,937 Centre of Contemporary Arts Cairns
Bus Unit of Govt
160,285 1,684 1 250 NA NA
Empire Theatre Company 250,000 125 4 2,297 4,842,495 118,711 Gladstone Entertainment Centre
Local Govt 67,464 518 2 1,675 NA NA
Ipswich Civic Centre Local Govt 195,000 39 2 921 NA NA Judith Wright Centre of Contemporary Arts
Bus Unit of Govt
2,100,000 3 2 380 NA NA
296
12 2015 Economic Activity Report
State Centre Managed by
Population Serviced
Dist from Capital
City (kms)
No. of Perf
Spaces
Total Capacity
Annual Turnover
Annual Attendance
QLD
Lake Kawana Community Centre Local Govt 290,000 96 1 740 NA 86,636 Logan Entertainment Centre Local Govt 287,517 26 1 1,100 NA NA Mackay Entertainment & Convention Centre
Local Govt 200,000 1,000 4+ 3,000 NA 205,890
Pilbeam Theatre Local Govt 120,000 640 1 967 2,047,202 60,731 Redland Performing Arts Centre Local Govt 150,000 30 3 986 1,959,272 48,351 The Events Centre Company 300,000 95 2 1,540 2,943,465 92,129 Townsville Civic Theatre Local Govt 150,000 1,336 3 1,810 1,020,165 108,738
SA
Barossa Arts & Convention Centre Educ Inst 40,000 70 2 1,155 1,089,807 23,813 Golden Grove Arts Centre Local Govt 98,000 25 1 329 NA NA
Marion Cultural Centre Local Govt 85,000 13 1 280 NA NA
Murray Bridge Town Hall Local Govt 15,000 80 1 300 NA 2,800
The Hopgood Theatre Stat Auth 180,000 30 2 612 513,428 37,989
TAS
Devonport Entertainment and Convention Centre
Local Govt 52,000 282 1 480 NA NA
The Burnie Arts and Function Centre
Local Govt 40,000 330 3 1,288 1,648,428 61,382
Theatre Royal Stat Auth 200,000 - 2 830 2,255,117 71,978
VIC
Arts Centre Melbourne Stat Auth 4,880,000 - 4+ 15,730 76,822,000 2,285,861 Capitol Venues and Events Local Govt 200,000 150 4 1,655 5,963,483 138,430 Clocktower Centre Local Govt 127,000 8 1 505 1,923,660 91,314 Colac Otway Performing Arts and Cultural Centre
Local Govt 21,000 165 2 462 NA 16,099
Darebin Arts and Entertainment Centre
Local Govt 300,000 11 4 885 NA 169,497
Drum Theatre Local Govt 750,000 35 1 521 NA 69,521 Eastbank Centre - Riverlinks Venues
Local Govt 65,000 185 2 1,243 NA NA
Frankston Arts Centre Local Govt 400,000 45 2 996 NA 165,949 Geelong Performing Arts Centre Stat Auth 290,000 75 3 2,655 NA NA Hamilton Performing Arts Centre Local Govt 16,000 295 3 800 NA NA Her Majesty's Theatre Local Govt 120,000 110 1 959 2,254,672 63,186 Lighthouse Theatre Local Govt 55,000 257 2 743 61,620 Melbourne Recital Centre Company 4,880,000 1 2 1,150 NA NA Melbourne Theatre Company Educ Inst 5,000,000 1 2 734 NA 128,069 Mildura Arts Centre Local Govt 51,373 400 2 544 1,494,619 67,300 Portland Arts Centre Local Govt 20,000 359 1 144 NA NA Swan Hill Town Hall Performing Arts and Convention Centre
Local Govt 10,000 340 1 860 NA NA
The Cube Wodonga Local Govt 120,000 320 1 410 NA NA Wangaratta Performing Arts Centre
Local Govt 100,000 250 1 520 NA 48,895
West Gippsland Arts Centre Local Govt 65,000 100 2 650 NA 66,949 Whitehorse Performing Arts Centre Local Govt 163,697 15 1 414 NA NA
WA
Arts Margaret River Margaret River Cultural Centre
Company 15,000 270 1 350 NA 20,000
Broome Civic Centre [Shire of Broome]
Local Govt 17,000 2,230 2 400 329,645 20,000
Bunbury Regional Entertainment Centre
Contract Mgt
100,000 170 2 1,050 NA NA
Carnarvon Civic Centre Local Govt 5,000 910 2 700 NA NA Esperance Civic Centre Local Govt 14,500 720 3 1,750 533,948 NA His Majesty's Theatre Bus Unit
of Govt 2,020,000 2 2 1,384 NA NA
Mandurah Performing Arts Centre Inc. Assoc.
250,000 75 2 921 2,347,403 170,147
Matt Dann Theatre & Cinema Local Govt 20,000 1,648 2 452 NA NA Queens Park Theatre Local Govt 40,000 460 2 1,073 NA NA University Theatres - University of Western Australia
Educ Inst 2,020,000 - 4+ 4,000 1,986,000 120,000
Table 1: List of Respondents NOTE: NA indicates information not provided or confidential
297

2015 Economic Activity Report 13
Capacity Figure 2 shows that almost two thirds of the respondents (63%) manage performing arts centres which have a capacity of between 261 and 1100. The venue size parameters have been decided arbitrarily and are consistent with previous years’ parameters.
Figure 2: Distribution of Respondents by Seating Capacity 73.5% of respondents operate performing arts centres with either one or two performance spaces as show in Figure 3 below. Only 12% have four or more spaces.
Figure 3: Performance Spaces
3.6%
30.1%
32.5%
14.5%
14.5%
4.8%
0.0% 5.0% 10.0% 15.0% 20.0% 25.0% 30.0% 35.0%
0-260
261-550
551-1100
1101-1500
1501-3000
3000+
Total capacities (n=86)
1 39.8%
2 33.7%
3 14.5%
4 6.0%
5+ 6.0%
Performance spaces per Venue (n=83)
298

14 2015 Economic Activity Report
Figure 4 below shows that the majority of respondents’ venues (66.3%) are managed directly by local government. In terms of ownership, local government’s role is broader still (reaching 78.3%) as owners of the venues managed by separate legal entities. Two venue management entities recorded they maintain multiple contracts for management over venues owned by local government and respectively a state government agency and a private venue owner. Results from APACA surveys over the past 8 years (2009, 2011, 2013 and the current 2015 results) shows a 9.9% decrease in venues that are managed by a separate legal entity (e.g.: Association, Statutory Authority or Company Limited by Guarantee) with an 8.3% increase in direct management of a business unit by the Government owner. This variation is presented with the understanding that each survey attracts a different mix of venues.
Figure 4: Management Models
Figure 5: Management Models Used per State
6.0%
3.6%
3.6%
13.3%
7.2%
66.3%
0% 10% 20% 30% 40% 50% 60% 70%
Part of Education Institution
Contract Management
Business Unit of State or Federal Gov't
Assoc/Company Ltd by Guarantee
Statutory Authority
Local Government
Management Model Used by Centres (n=83)
4.5% 6.3%
25%
6.7% 11.1%
50%
6.3% 9.1%
18.8% 22.2%
50%
25%
33.3%
13.3%
86.4%
68.8%
50%
66.7%
80%
66.7%
0.0%
10.0%
20.0%
30.0%
40.0%
50.0%
60.0%
70.0%
80.0%
90.0%
100.0%
ACT NSW QLD SA TAS VIC WA
Management Models per State Part of Education Institution Contract Management
Business Unit of State or Federal Gov't Assoc/Company Ltd by Guarantee Statutory Authority
Local Government
299

2015 Economic Activity Report 15
Financial Snapshot In order to understand the indicative scope of financial activity in the sector, respondents were asked to provide their last annual financial statement. Comprehensive and validated financial data was provided by a total of 50 respondent venues with a combined turnover of $211.7 million as shown in Table 2. There are some difficulties in collating financial data in this form, as local government venues often show their operating deficit as an adjusted local government contribution under income, while those managed by separate legal entities have a final deficit or surplus that is taken up in their own separate balance sheets. Of the 33 respondents reporting on how a surplus is treated, 18 (54.5%) of venues stated that they were able to retain this amount. The treatment of retained surplus varies with 10 venues reporting they are able to transfer amounts into a general purpose reserve, 4 are able to transfer to either a building, capital or programming reserve and 4 venues are able to add the surplus to the available funds for the following year. The income generated from venue activities has increased from results of the 2013 survey but remains consistent with 2011 and 2009 results. Total funding from local government sources has substantially increased from 2009 at 9.7% to 2015 at 27.1% although the highest level of support was reported in 2013 at 34.8% of total income. Overall, government funding support has reduced by 10% in the last two years. Table 2 shows that expenditure remains consistent with the 2011 and 2009 survey results. In 2013, the expenditure figures were reported as considerably lower than in previous surveys and the net surplus is considerably higher. Even with a lower number of participant venues (80 in 2013 and 50 in 2015), the inclusion of a number of larger city venues in the 2015 survey provides a significant increase in the volume of activities and a healthy net surplus.
300
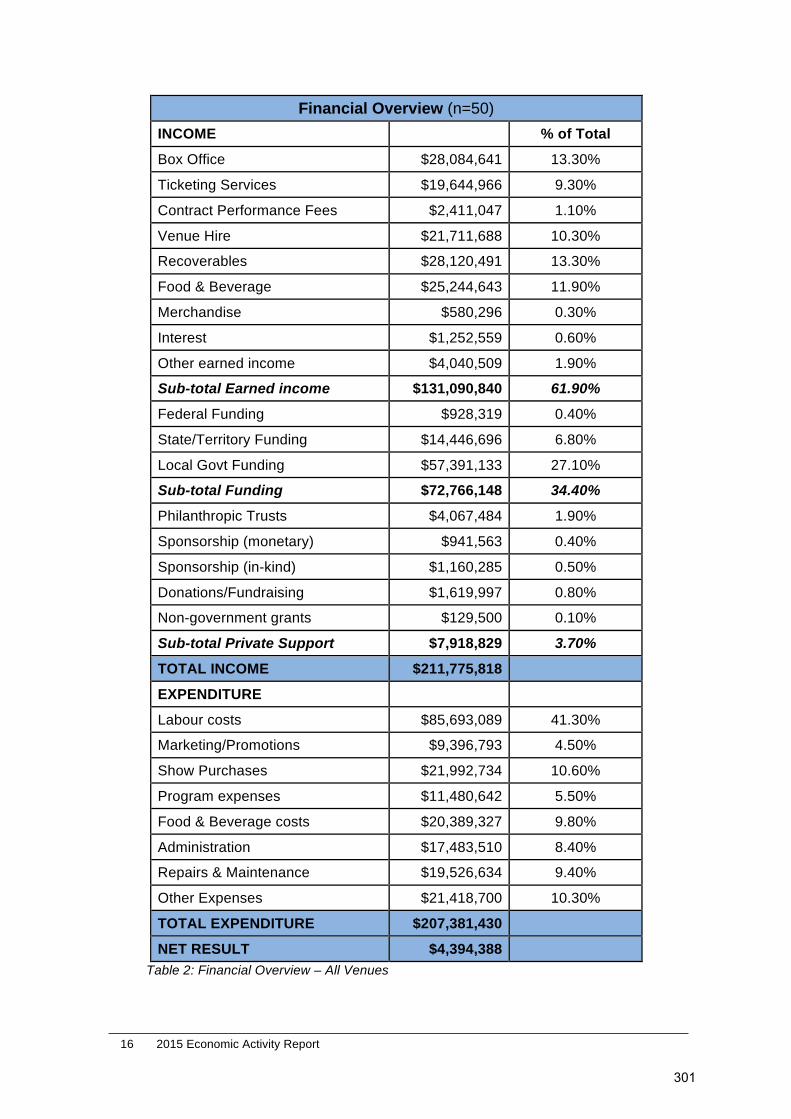
16 2015 Economic Activity Report
Financial Overview (n=50)
INCOME % of Total
Box Office $28,084,641 13.30%
Ticketing Services $19,644,966 9.30%
Contract Performance Fees $2,411,047 1.10%
Venue Hire $21,711,688 10.30%
Recoverables $28,120,491 13.30%
Food & Beverage $25,244,643 11.90%
Merchandise $580,296 0.30%
Interest $1,252,559 0.60%
Other earned income $4,040,509 1.90%
Sub-total Earned income $131,090,840 61.90%
Federal Funding $928,319 0.40%
State/Territory Funding $14,446,696 6.80%
Local Govt Funding $57,391,133 27.10%
Sub-total Funding $72,766,148 34.40%
Philanthropic Trusts $4,067,484 1.90%
Sponsorship (monetary) $941,563 0.40%
Sponsorship (in-kind) $1,160,285 0.50%
Donations/Fundraising $1,619,997 0.80%
Non-government grants $129,500 0.10%
Sub-total Private Support $7,918,829 3.70%
TOTAL INCOME $211,775,818
EXPENDITURE
Labour costs $85,693,089 41.30%
Marketing/Promotions $9,396,793 4.50%
Show Purchases $21,992,734 10.60%
Program expenses $11,480,642 5.50%
Food & Beverage costs $20,389,327 9.80%
Administration $17,483,510 8.40%
Repairs & Maintenance $19,526,634 9.40%
Other Expenses $21,418,700 10.30%
TOTAL EXPENDITURE $207,381,430
NET RESULT $4,394,388
Table 2: Financial Overview – All Venues
301
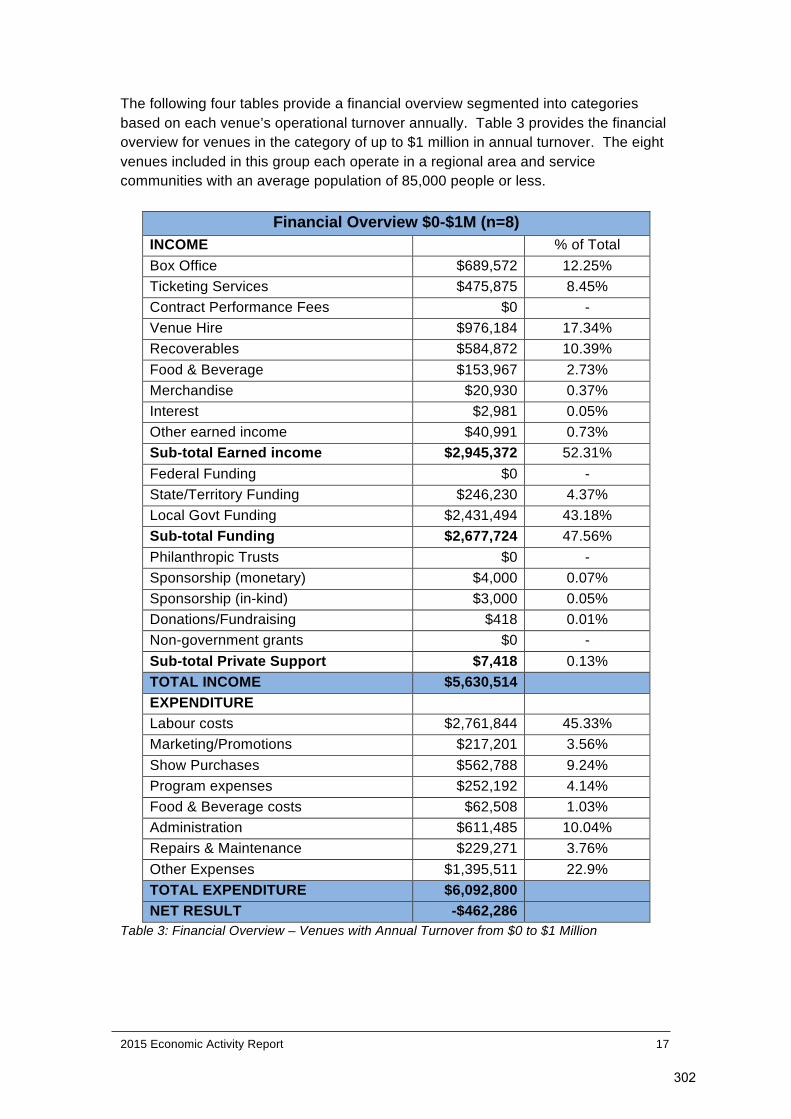
2015 Economic Activity Report 17
The following four tables provide a financial overview segmented into categories based on each venue’s operational turnover annually. Table 3 provides the financial overview for venues in the category of up to $1 million in annual turnover. The eight venues included in this group each operate in a regional area and service communities with an average population of 85,000 people or less.
Financial Overview $0-$1M (n=8) INCOME % of Total
Box Office $689,572 12.25%
Ticketing Services $475,875 8.45%
Contract Performance Fees $0 -
Venue Hire $976,184 17.34%
Recoverables $584,872 10.39%
Food & Beverage $153,967 2.73%
Merchandise $20,930 0.37%
Interest $2,981 0.05%
Other earned income $40,991 0.73%
Sub-total Earned income $2,945,372 52.31%
Federal Funding $0 -
State/Territory Funding $246,230 4.37%
Local Govt Funding $2,431,494 43.18%
Sub-total Funding $2,677,724 47.56%
Philanthropic Trusts $0 -
Sponsorship (monetary) $4,000 0.07%
Sponsorship (in-kind) $3,000 0.05%
Donations/Fundraising $418 0.01%
Non-government grants $0 -
Sub-total Private Support $7,418 0.13%
TOTAL INCOME $5,630,514
EXPENDITURE
Labour costs $2,761,844 45.33%
Marketing/Promotions $217,201 3.56%
Show Purchases $562,788 9.24%
Program expenses $252,192 4.14%
Food & Beverage costs $62,508 1.03%
Administration $611,485 10.04%
Repairs & Maintenance $229,271 3.76%
Other Expenses $1,395,511 22.9%
TOTAL EXPENDITURE $6,092,800
NET RESULT -$462,286 Table 3: Financial Overview – Venues with Annual Turnover from $0 to $1 Million
302

18 2015 Economic Activity Report
The 19 venues included in this group have an annual turnover of between $1 million and $2 million. The majority operate in a regional area and three are small capacity venues located within a capital city. Excluding the capital city venues, the average size of the communities the remaining 16 venues service has a population base of approximately 100,000 people.
Financial Overview - Annual Turnover $1M-$2M (n=19)
INCOME % of Total
Box Office $2,183,518 7.32%
Ticketing Services $1,266,894 4.25%
Contract Performance Fees $869,992 2.92%
Venue Hire $3,254,223 10.91%
Recoverables $3,811,818 12.78%
Food & Beverage $2,860,311 9.59%
Merchandise $36,577 0.12%
Interest $0 -
Other earned income $741,757 2.49%
Sub-total Earned income $15,025,091 50.38%
Federal Funding $654,359 2.19%
State/Territory Funding $1,640,958 5.50%
Local Govt Funding $12,417,763 41.64%
Sub-total Funding $14,713,080 49.33%
Philanthropic Trusts $0 -
Sponsorship (monetary) $72,203 0.24%
Sponsorship (in-kind) $10,000 0.03%
Donations/Fundraising $2,755 0.01%
Non-government grants $0 -
Sub-total Private Support $84,958 0.28%
TOTAL INCOME $29,823,129
EXPENDITURE
Labour costs $13,558,164 46.16%
Marketing/Promotions $902,222 3.07%
Show Purchases $1,902,699 6.48%
Program expenses $1,023,179 3.48%
Food & Beverage costs $1,425,906 4.85%
Administration $2,240,407 7.63%
Repairs & Maintenance $1,474,637 5.02%
Other Expenses $6,843,263 23.3%
TOTAL EXPENDITURE $29,370,477
NET RESULT $452,652 Table 4: Financial Overview – Venues with Annual Turnover from $1 Million to $2 Million
303
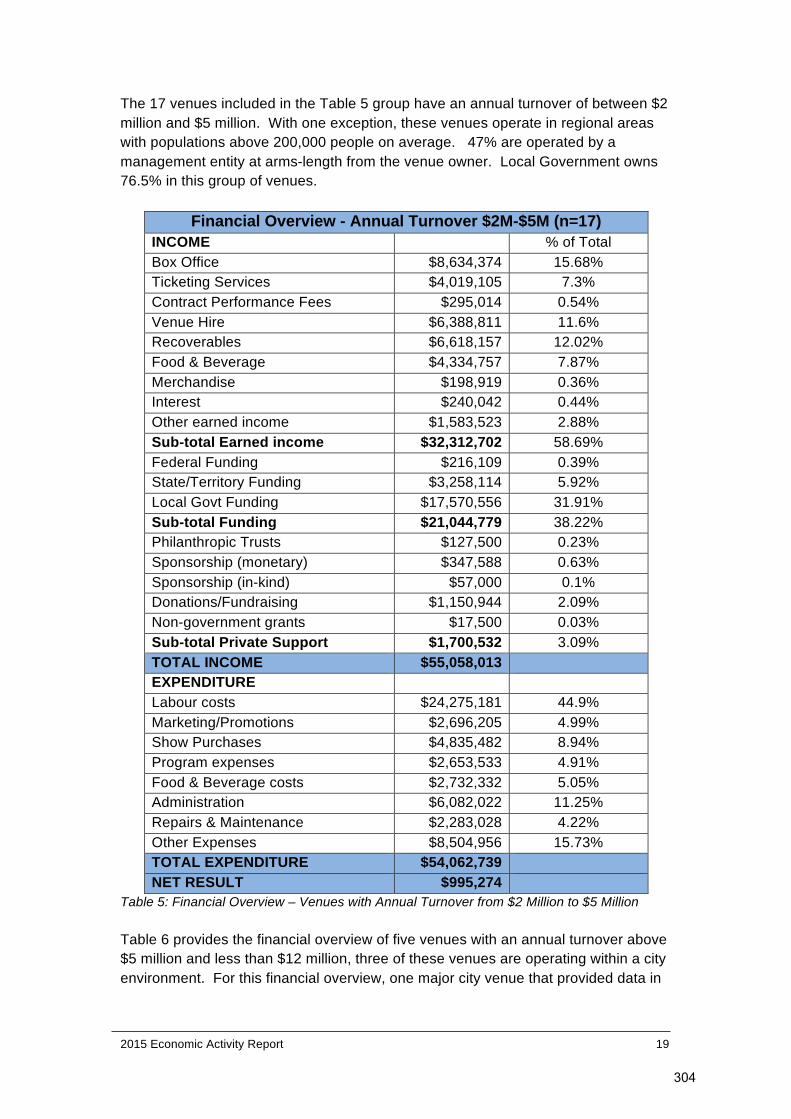
2015 Economic Activity Report 19
The 17 venues included in the Table 5 group have an annual turnover of between $2 million and $5 million. With one exception, these venues operate in regional areas with populations above 200,000 people on average. 47% are operated by a management entity at arms-length from the venue owner. Local Government owns 76.5% in this group of venues.
Financial Overview - Annual Turnover $2M-$5M (n=17) INCOME % of Total
Box Office $8,634,374 15.68% Ticketing Services $4,019,105 7.3%
Contract Performance Fees $295,014 0.54%
Venue Hire $6,388,811 11.6% Recoverables $6,618,157 12.02%
Food & Beverage $4,334,757 7.87%
Merchandise $198,919 0.36% Interest $240,042 0.44%
Other earned income $1,583,523 2.88%
Sub-total Earned income $32,312,702 58.69%
Federal Funding $216,109 0.39% State/Territory Funding $3,258,114 5.92%
Local Govt Funding $17,570,556 31.91%
Sub-total Funding $21,044,779 38.22% Philanthropic Trusts $127,500 0.23%
Sponsorship (monetary) $347,588 0.63%
Sponsorship (in-kind) $57,000 0.1% Donations/Fundraising $1,150,944 2.09%
Non-government grants $17,500 0.03%
Sub-total Private Support $1,700,532 3.09%
TOTAL INCOME $55,058,013
EXPENDITURE
Labour costs $24,275,181 44.9%
Marketing/Promotions $2,696,205 4.99% Show Purchases $4,835,482 8.94%
Program expenses $2,653,533 4.91%
Food & Beverage costs $2,732,332 5.05% Administration $6,082,022 11.25%
Repairs & Maintenance $2,283,028 4.22%
Other Expenses $8,504,956 15.73% TOTAL EXPENDITURE $54,062,739
NET RESULT $995,274 Table 5: Financial Overview – Venues with Annual Turnover from $2 Million to $5 Million Table 6 provides the financial overview of five venues with an annual turnover above $5 million and less than $12 million, three of these venues are operating within a city environment. For this financial overview, one major city venue that provided data in
304

20 2015 Economic Activity Report
the survey was excluded as its turnover is well above $15 million which would skew the combined figures.
Financial Overview - Annual Turnover $5M-$12M (n=5) INCOME % age of Total
Box Office $8,348,177 19.89%
Ticketing Services $6,564,092 15.64% Contract Performance Fees $12,041 0.03%
Venue Hire $3,618,470 8.62%
Recoverables $2,739,643 6.53% Food & Beverage $3,745,608 8.93%
Merchandise $323,869 0.77%
Interest $169,536 0.4% Other earned income $1,674,239 3.99%
Sub-total Earned income $27,195,676 64.81%
Federal Funding $57,851 0.14% State/Territory Funding $2,301,394 5.48%
Local Govt Funding $10,237,320 24.4%
Sub-total Funding $12,596,565 30.02%
Philanthropic Trusts $97,984 0.23% Sponsorship (monetary) $517,772 1.23%
Sponsorship (in-kind) $1,090,285 2.6%
Donations/Fundraising $465,880 1.11% Non-government grants $0 -
Sub-total Private Support $2,171,921 5.18%
TOTAL INCOME $41,964,162
EXPENDITURE
Labour costs $16,041,900 39.09%
Marketing/Promotions $2,800,165 6.82% Show Purchases $4,093,765 9.98%
Program expenses $6,015,738 14.66%
Food & Beverage costs $4,024,581 9.81%
Administration $4,366,597 10.64% Repairs & Maintenance $2,297,699 5.60%
Other Expenses $1,392,969 3.39%
TOTAL EXPENDITURE $41,033,414 NET RESULT $930,748
Table 6: Financial Overview – Venues with Annual Turnover from $5 Million to $12 Million Of the total of 50 venues providing full financial data, 38 venue respondents reported operating within either a Local or State Government environment as a Business Unit or within a University department and are generally working with budgets requiring a breakeven result at the end of the financial year. Table 7 provides a financial overview of their data.
305

2015 Economic Activity Report 21
57% of these venues provided data showing the subsidy received is equal to the total income earned less expenses giving a zero end of year result. 23% of these venues showed an operating surplus while 20% showed a deficit in their yearly operational result.
Financial Overview - Venues managed within Government (n=38) INCOME % age of Total
Box Office $10,885,299 14.01%
Ticketing Services $7,950,097 10.23% Contract Performance Fees $1,053,893 1.36%
Venue Hire $9,116,967 11.73%
Recoverables $8,028,926 10.33% Food & Beverage $6,627,102 8.53%
Merchandise $450,217 0.58%
Interest $3,977 0.01%
Other earned income $2,102,179 2.7% Sub-total Earned income $46,218,657 59.47%
Federal Funding $833,220 1.07%
State/Territory Funding $2,215,582 2.85% Local Govt Funding $33,810,532 43.5%
Sub-total Funding $36,859,334 47.43%
Philanthropic Trusts $185,484 0.24% Sponsorship (monetary) $370,412 0.48%
Sponsorship (in-kind) $50,900 0.07%
Donations/Fundraising $442,118 0.57%
Non-government grants $- 0.00% Sub-total Private Support $1,048,914 1.35%
TOTAL INCOME $84,126,906
EXPENDITURE
Labour costs $35,444,424 45.64%
Marketing/Promotions $3,456,681 4.45%
Show Purchases $7,646,638 9.85% Program expenses $6,329,970 8.15%
Food & Beverage costs $5,139,142 6.62%
Administration $7,140,889 9.19% Repairs & Maintenance $4,105,939 5.29%
Other Expenses $15,413,638 19.85%
TOTAL EXPENDITURE $84,677,322
NET RESULT $-550,416 Table 7: Financial Overview - Venues managed within Government or University environments Table 8 isolates the data contributed by 12 venues reporting their management as being at arms length from the Government owner of their building. Five of these venues report their management model as a Statutory Authority and five operate through a Company Limited by Guarantee owned by their Local Government
306
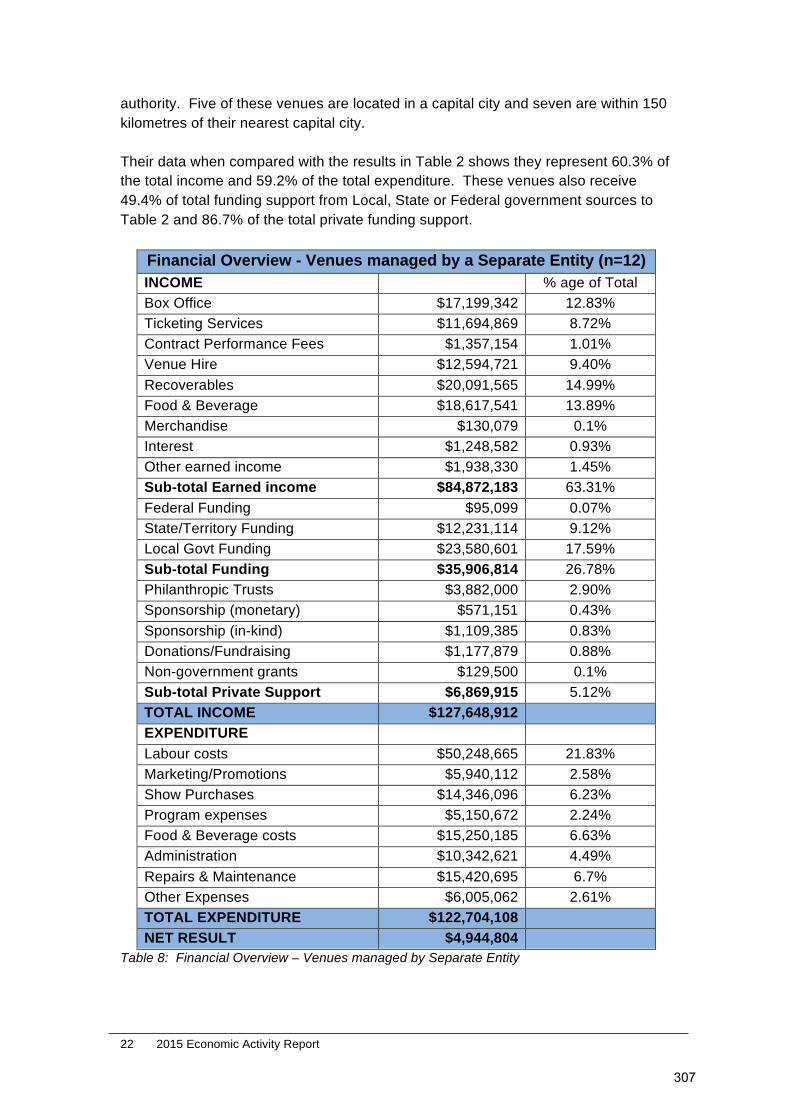
22 2015 Economic Activity Report
authority. Five of these venues are located in a capital city and seven are within 150 kilometres of their nearest capital city. Their data when compared with the results in Table 2 shows they represent 60.3% of the total income and 59.2% of the total expenditure. These venues also receive 49.4% of total funding support from Local, State or Federal government sources to Table 2 and 86.7% of the total private funding support.
Financial Overview - Venues managed by a Separate Entity (n=12) INCOME
% age of Total
Box Office $17,199,342 12.83%
Ticketing Services $11,694,869 8.72%
Contract Performance Fees $1,357,154 1.01%
Venue Hire $12,594,721 9.40%
Recoverables $20,091,565 14.99%
Food & Beverage $18,617,541 13.89%
Merchandise $130,079 0.1%
Interest $1,248,582 0.93%
Other earned income $1,938,330 1.45%
Sub-total Earned income $84,872,183 63.31%
Federal Funding $95,099 0.07%
State/Territory Funding $12,231,114 9.12%
Local Govt Funding $23,580,601 17.59%
Sub-total Funding $35,906,814 26.78%
Philanthropic Trusts $3,882,000 2.90%
Sponsorship (monetary) $571,151 0.43%
Sponsorship (in-kind) $1,109,385 0.83%
Donations/Fundraising $1,177,879 0.88%
Non-government grants $129,500 0.1%
Sub-total Private Support $6,869,915 5.12%
TOTAL INCOME $127,648,912
EXPENDITURE
Labour costs $50,248,665 21.83%
Marketing/Promotions $5,940,112 2.58%
Show Purchases $14,346,096 6.23%
Program expenses $5,150,672 2.24%
Food & Beverage costs $15,250,185 6.63%
Administration $10,342,621 4.49%
Repairs & Maintenance $15,420,695 6.7%
Other Expenses $6,005,062 2.61%
TOTAL EXPENDITURE $122,704,108
NET RESULT $4,944,804 Table 8: Financial Overview – Venues managed by Separate Entity
307
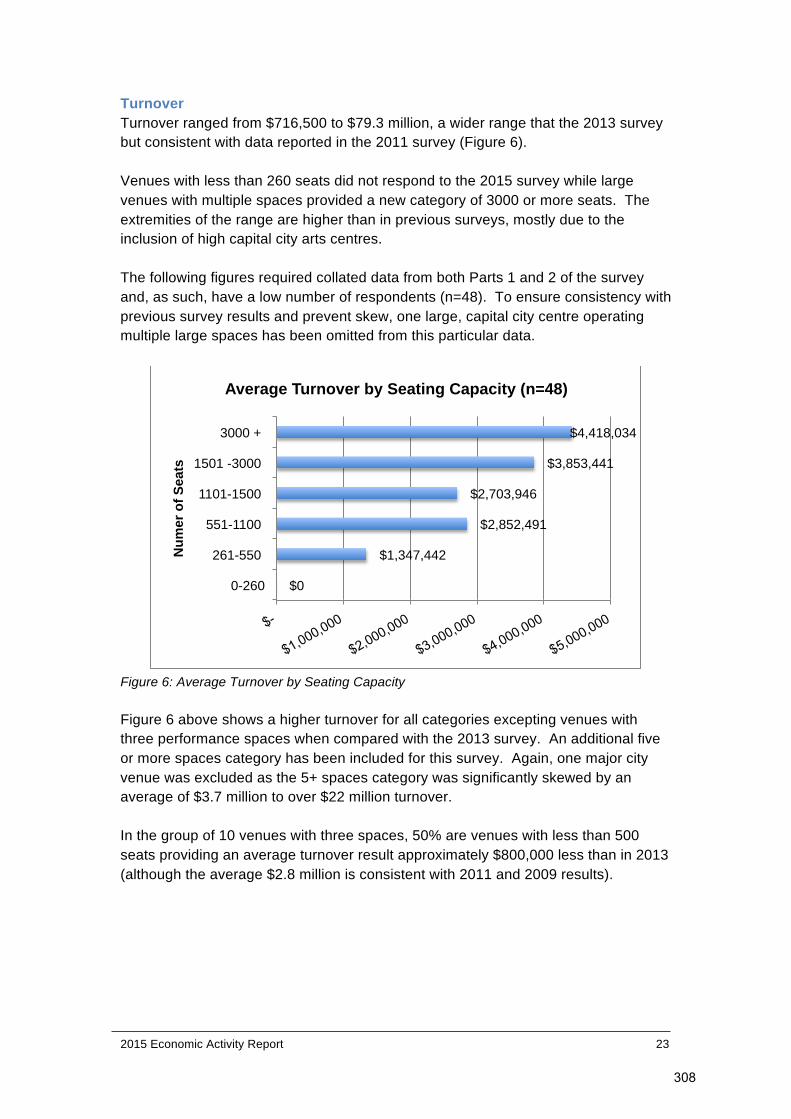
2015 Economic Activity Report 23
Turnover Turnover ranged from $716,500 to $79.3 million, a wider range that the 2013 survey but consistent with data reported in the 2011 survey (Figure 6). Venues with less than 260 seats did not respond to the 2015 survey while large venues with multiple spaces provided a new category of 3000 or more seats. The extremities of the range are higher than in previous surveys, mostly due to the inclusion of high capital city arts centres. The following figures required collated data from both Parts 1 and 2 of the survey and, as such, have a low number of respondents (n=48). To ensure consistency with previous survey results and prevent skew, one large, capital city centre operating multiple large spaces has been omitted from this particular data.
Figure 6: Average Turnover by Seating Capacity Figure 6 above shows a higher turnover for all categories excepting venues with three performance spaces when compared with the 2013 survey. An additional five or more spaces category has been included for this survey. Again, one major city venue was excluded as the 5+ spaces category was significantly skewed by an average of $3.7 million to over $22 million turnover. In the group of 10 venues with three spaces, 50% are venues with less than 500 seats providing an average turnover result approximately $800,000 less than in 2013 (although the average $2.8 million is consistent with 2011 and 2009 results).
$0
$1,347,442
$2,852,491
$2,703,946
$3,853,441
$4,418,034
0-260
261-550
551-1100
1101-1500
1501 -3000
3000 +
Nu
mer
of
Sea
ts
Average Turnover by Seating Capacity (n=48)
308
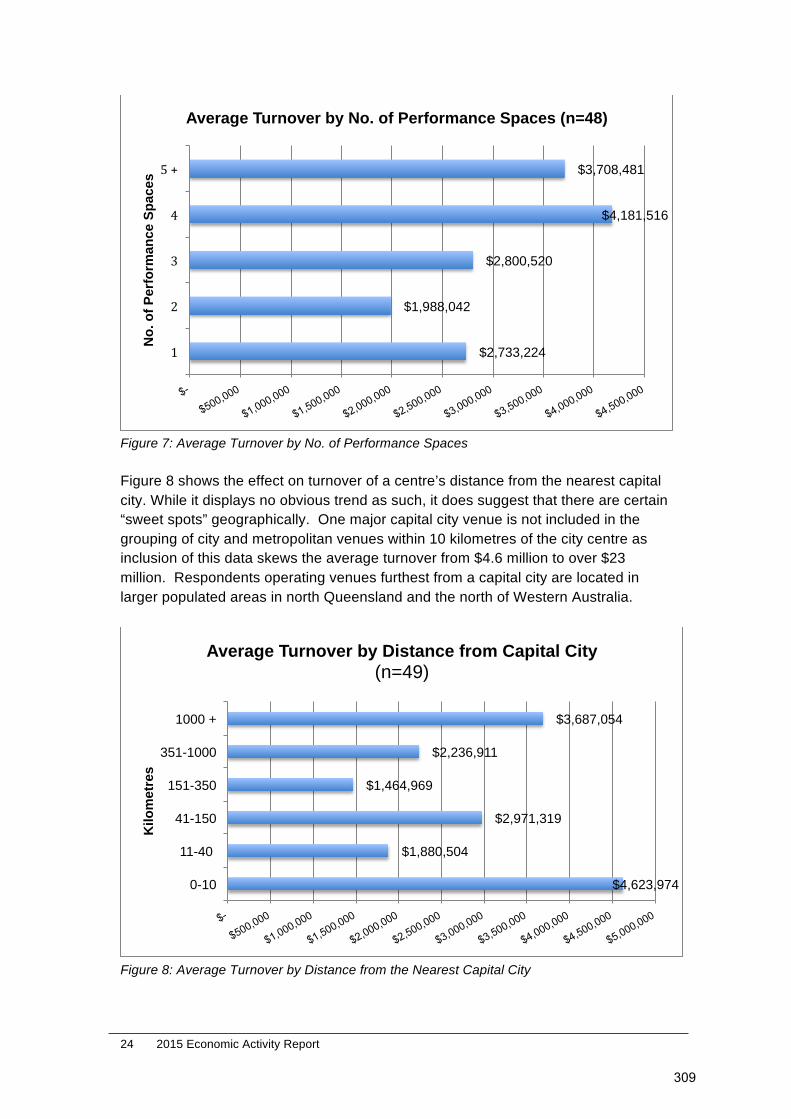
24 2015 Economic Activity Report
Figure 7: Average Turnover by No. of Performance Spaces Figure 8 shows the effect on turnover of a centre’s distance from the nearest capital city. While it displays no obvious trend as such, it does suggest that there are certain “sweet spots” geographically. One major capital city venue is not included in the grouping of city and metropolitan venues within 10 kilometres of the city centre as inclusion of this data skews the average turnover from $4.6 million to over $23 million. Respondents operating venues furthest from a capital city are located in larger populated areas in north Queensland and the north of Western Australia.
Figure 8: Average Turnover by Distance from the Nearest Capital City
$2,733,224
$1,988,042
$2,800,520
$4,181,516
$3,708,481
1
2
3
4
5 +
No
. of
Per
form
ance
Sp
aces
Average Turnover by No. of Performance Spaces (n=48)
$4,623,974
$1,880,504
$2,971,319
$1,464,969
$2,236,911
$3,687,054
0-10
11-40
41-150
151-350
351-1000
1000 +
Kilo
met
res
Average Turnover by Distance from Capital City (n=49)
309

2015 Economic Activity Report 25
Figure 9: Average Turnover by State (note: a major city venue excluded from data above) Local Government subsidy represents the largest source of income at just under one third (27.1%) of all revenue. This percentage has reduced since 2013 where Local Government provided 34.8% of all revenue. Income from venues’ entrepreneurial program has changed marginally from 2013 figures (Box Office from 13.7% to 13.3% and Venue Hire from 9.8% to 10.3%). In the 2013 survey, Food and Beverage income decreased to 6.1% (from 12.1% in 2011) and Ticketing Services dropped to 6.1% (8.4% in 2011). The 2015 survey shows both categories have returned to 2011 levels at 11.9% income from Food and Beverage and 9.3% for the provision of Ticketing Services. Income from monetary categories of private support (Philanthropic Trusts, Sponsorship and Donations/Fundraising) has increased by almost 1%. This increase represents $3.5 million that can be attributed in its entirety to the inclusion of the one major capital city venue. By excluding this venue, private support for venues has decreased by approximately $500,000 since 2013.
$2,770,196
$3,771,503
$729,788
$1,697,647
$2,074,447
$2,226,472
ACT/NSW
QLD
SA
TAS
VIC
WA
Average Turnover by State
310

26 2015 Economic Activity Report
Figure 10: Sources of Income
Expenses Labour costs remain the largest expense for respondents (41.4%) representing $85.7M in employment for the sector. Employment also benefits from a reported doubling of food and beverage costs from $5.5M in 2013 to $20.4M in 2015. Expenditure on entrepreneurial programming (show purchases 10.6% and program expenditure 5.5%) is slightly lower than in 2013 (17.1% combined) although still higher than in 2009 (13% combined) and 2011 (15.8% combined). Respondents spent just under $22M purchasing and presenting their programs, with another $9.3M spent on marketing these events and their venues. Both these figures are higher than the 2013 survey’s figures of $12.9M and $7M respectively, although compare well with the 2011 results showing $24M for purchase and presentation of programs and $8.2M for marketing. Repairs and Maintenance also shows a significant increase since 2013 moving from 4.4% to 9.4% although as shown in Tables 3 and 4, much of the increase can be attributed to the inclusion of one major capital city venue.
Box Office 13.3%
Ticketing Services 9.3%
Contract Performance
Fees 1.1%
Venue Hire 10.3%
Recoverables 13.3% Food & Beverage
11.9%
Merchandise 0.3%
Interest 0.6%
Other earned income 1.9%
Federal Funding
0.4%
State/Territory Funding
6.8%
Local Govt Funding 27.1%
Philanthropic Trusts 1.9%
Sponsorship (monetary)
0.4%
Sponsorship (in-kind) 0.5%
Donations/Fundraising
0.8%
Non-government grants 0.1%
Sources of Income (n=50)
311

2015 Economic Activity Report 27
Figure 11: Expenditure Breakdown
Funding Figure 12 represents the breakdown of total operational government funding received by respondents. It shows Federal Government Funding has remained static at 1.3% and State/Territory Funding has shown 0.1% increase from 19.8% in 2013. However, by excluding the one major capital city venue that receives significant funding from its State Government agency, the percentage of State/Territory Funding received by the remaining 49 venues across Australia shows a reduction by 5.26% from 2013 results. Local Government remains the largest contributor at $57.4 million. 48 respondents provided the total value of the contribution made by their primary source of operational subsidy including the total value of their Community Service Obligation (CSO). Approximately one quarter of these venues also recognised the value of services such as business support in accounting or IT services provided by their parent organisation. The total value reported is just over $75 million.
Labour costs 41.4%
Marketing/Promotions
4.5% Show Purchases
10.6%
Program expenses
5.5%
Food & Beverage
costs 9.8%
Administration 8.4%
Repairs & Maintenance
9.4%
Other Expenses 10.3%
Expenditure (n=50)
312
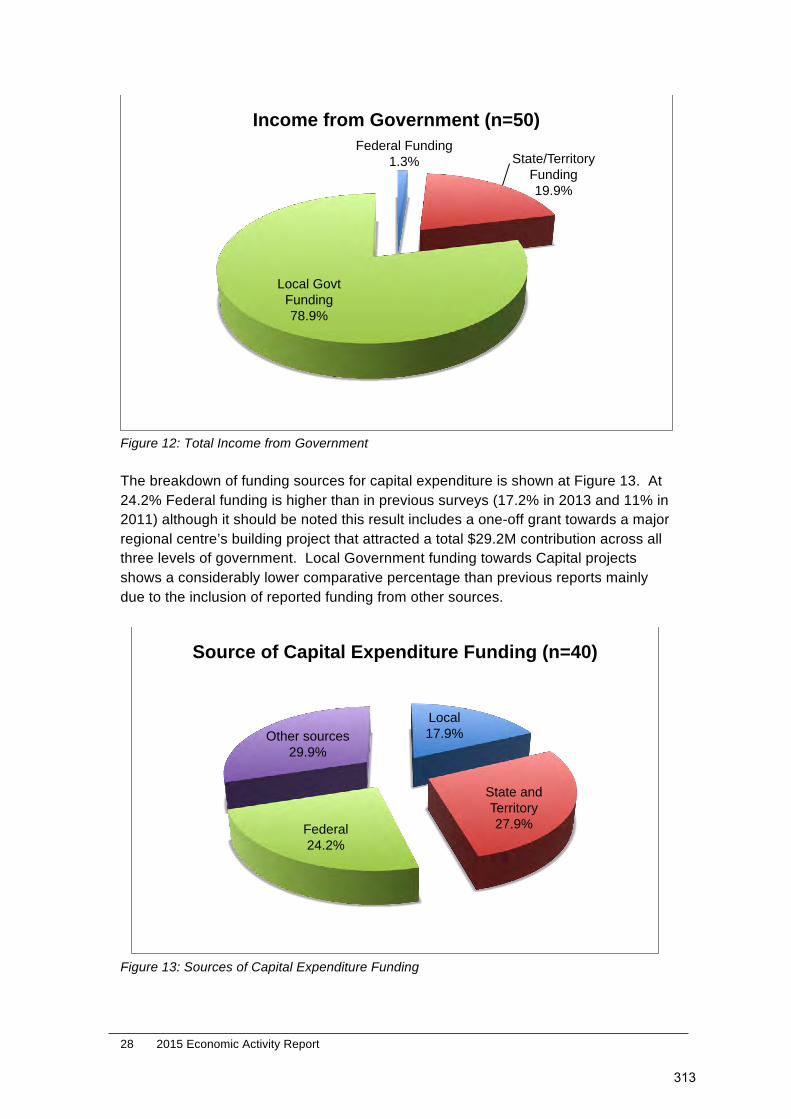
28 2015 Economic Activity Report
Figure 12: Total Income from Government The breakdown of funding sources for capital expenditure is shown at Figure 13. At 24.2% Federal funding is higher than in previous surveys (17.2% in 2013 and 11% in 2011) although it should be noted this result includes a one-off grant towards a major regional centre’s building project that attracted a total $29.2M contribution across all three levels of government. Local Government funding towards Capital projects shows a considerably lower comparative percentage than previous reports mainly due to the inclusion of reported funding from other sources.
Figure 13: Sources of Capital Expenditure Funding
Federal Funding 1.3% State/Territory
Funding 19.9%
Local Govt Funding 78.9%
Income from Government (n=50)
Local 17.9%
State and Territory 27.9% Federal
24.2%
Other sources 29.9%
Source of Capital Expenditure Funding (n=40)
313

2015 Economic Activity Report 29
In 2015, eight venues reported attracting capital from other sources at 29.9% of the total, which changes the weighting of contributions by the three levels of government. This is a significant change over previous survey results that in 2011 reported other sources contributing 4% towards capital projects (nil was reported in 2013). Figure 13 shows the comparison of Capital Funding sources between only Local, State/Territory and Federal sources over three surveys.
Figure 14: Comparison of Sources of Capital Expenditure Funding 2011 to 2015
Venue Utilisation The average total utilisation rate for all spaces operated by 73 venues across Australia has increased by 0.1% (59% in 2015) over 2013 results (58% up from 54.7% in 2009). The average occupancy rate for the respondents’ primary venue is also at 59%, equal to the 2013 survey rate although lower than in the 2011 survey (61%).
Perf Space 1
Perf Space 2
Perf Space 3
Perf Space 4
Perf Space 5
All Spaces
Utilisation 59% 52% 59% 56% 64% 59%
Avg # Seats 654 334 407 300 207
Avg # Days Available 313 315 299 254 188 314
Average # Days Unused 127 152 124 111 68 128
Number Sampled (n=) 82 50 21 10 4* Table 9: Venue Utilisation by Performance Spaces * Data for performance spaces 5 calculates from a small a sample size
25.6%
39.9%
34.6%
38.9%
43.0%
17.2%
51%
34%
11%
0.0% 10.0% 20.0% 30.0% 40.0% 50.0% 60.0%
Local
State and Territory
Federal
Comparison - Capital Funding Sources
2011
2013
2015
314

30 2015 Economic Activity Report
The utilisation rate varies from state to state as shown in Table 10. The number of days annually available in each venue is rarely 365 days as in some venues, operational conditions and costs preclude uses on days such as public holidays or when a space is allocated to maintenance and equipment installation.
State Average
Utilisation% Avg # Days Available
Avg # days Used
Sample size
ACT* NA NA NA 1 NSW 58.3% 312 182 22 NT* NA NA NA 1 QLD 59.4% 330 196 12 SA 54.9% 334 183 5 TAS 32.6% 287 94 3 VIC 67.1% 317 213 19 WA 64.1% 289 185 10
Table 10: Average Utilisation of all Spaces by State * Data provided from the ACT and NT is excluded so as not to identify the one venue respondent.
Activity Levels As cultural hubs in their respective communities, performing arts centres host a range of both performing arts and community events. Table 11 demonstrates the respondents’ overall level of venue activity. While this survey samples an average of 60% of all APACA venue members, these results give an indication of the total volume of activity being undertaken. Significant numbers of people are attending performing arts centres in Australia, the sample venue members are attracting over $9.15 million attendances annually. The number of performances presented by member venues has risen significantly over the past six years from 8,495 (n=72) in 2011 to 13,116 (n=76) in 2013 and in these results, has almost doubled to 24,425 (n=64). Approximately, 12% of the increase can be attributed to the inclusion of data belonging to one major capital city venue. The total attendances at performances is also shown to have increased over time, with 64 respondents in 2009 attracting over 4.5 million people rising to almost 5 million in 2015. In 2009, three major capital city venues (The Arts Centre Melbourne, Sydney Opera House and the Queensland Performing Arts Centre) contributed to the data. The comparative 2015 results indicates increases in attendances at regional venues over the six-year period.
315

2015 Economic Activity Report 31
State
Total Perfs n=64
Total Attendance
at Perfs n=66
Total all Activities
n=68
Attendance at all Activities
n=64
Total Non-Arts
Activities n=64
%age Non-Arts
Activities ACT 144 207,578 155 219,716 11 7%
NSW 10,618 1,376,470 12,100 1,949,757 1,482 12% NT 255 84,000 260 87,867 5 2%
QLD 2,283 598,777 5,008 1,114,890 2,725 54%
SA 404 28,759 834 94,996 430 52%
TAS 726 126,777 1,142 160,511 416 36% VIC 8,363 2,223,077 14,452 3,903,976 6,089 42%
WA 1,632 348,809 2,333 1,616,950 701 30%
Total 24,425 4,994,247 36,284 9,148,663 11,859 33% Table 11: Venue Activity Levels Figure 15 shows that 32.7% of annual activity in the respondent venues was non-arts activities. The number of arts activities conducted in respondent venues annually has increased in 6 years from 63% in 2011, 66% in 2013 to 67.3% in 2015.
Figure 15: Activity Type Community usage has decreased to 52.2% having risen to 65% in 2013, although the 2015 percentage is more consistent with a 55% result recorded in 2011. Community events are defined as activities produced by amateur performance groups, dance and drama school concerts, etc using the respondent venue for their presentations. Most states excepting the Australian Capital Territory (ACT), Queensland (QLD) and South Australia (SA) show an increase in the number of community activities and overall, the level of community use has increased from 5,145 in 2013 to 5,362 in the 2015 survey results.
Arts Activity 67.3%
Non-Arts Activity 32.7%
Arts V Non-Arts Activity (n=64)
316

32 2015 Economic Activity Report
Figure 16: Community -v- Commercial Use Table 12 shows a breakdown by state of community and commercial performances. Commercial use has seen a dramatic increase from 35% in 2013 to 47.8% in 2015. Queensland and South Australia show decreases in commercial activities while New South Wales (NSW), Tasmania (TAS) and Victoria (VIC) recorded significant increases taking total commercial activities from 2,980 in 2013 to 4,904 in 2015.
Community
Performances Community
Activities
Community as % age
of total activities per state
Commercial Performances
Commercial Activities
Commercial as % age of
total activities per state
n=68
n=68 ACT 113 14 11% 223 113 89%
NSW 2054 589 38% 1657 961 62%
NT 36 34 42% 47 47 58%
QLD 782 303 56.3% 345 235 43.7%
SA 146 84 79.2% 24 22 20.8%
TAS 93 23 21.3% 182 85 78.7%
VIC 1426 609 58.3% 2073 435 41.7%
WA 712 413 59.4% 353 282 40.6%
Total 5362 2069 4904 2180 Table 12: Community -v- Commercial Performances and weighting of Activities per State
Programming Of the 83 respondents to part 2 of the survey, 30 responded with data that allowed a study of dedicated programming budgets representing an investment in entrepreneurial activities of approximately $8.5 million annually. 70% of the venues reporting they were able to budget for a net loss annually on their programming budget, also reported either an annual surplus or breakeven result in their overall operating result from all venue activities.
Community Performances
52.2% Commercial
Performances 47.8%
Commercial -v- Community Use
317

2015 Economic Activity Report 33
Table 13 shows a breakdown of the performing arts events undertaken by respondents. Definitions of terms can be found at Appendix A. It should be noted that the number of productions supported by Playing Australia is a subset of the “Full Risk” and “Shared Risk” categories. In comparison to the 2013 data, the number of entrepreneurial seasons presented by respondents has remained similar with an overall increase of 3%. This result is mainly due to a marked increase for both New South Wales and Tasmania in the number of seasons presented. All other states are reporting a reduction of entrepreneurial activities, five of them by up to 40%. While the number of seasons remains similar, the number of entrepreneured performances within seasons is reducing with approximately 1,500 less presented in 2015 than reported in 2013. There is also a marginal increase in the number of seasons presented by Hirers of the respondent venues (from 3,252 to 3,378). The number of Playing Australia supported seasons (339) is again down from 2013 (397), 2011 (411) and from the 2009 results (482) as are Playing Australia supported performances being 639 in 2015 (726 in 2013, 845 in 2011 and 931 in 2009).
Table 13: Performing Arts Activity Levels
Productions entrepreneured
at Full Risk
Productions entrepreneured at
Shared Risk Hires
Risk as a percentage Total Arts Activities
Productions Supported by
Playing Australia
Productions Supported by State Funding
Agencies n=59 n=50 n=67
n=52 n=51
Seasons Perfs Seasons Perfs Seasons Perfs Seasons Perfs Seasons Perfs Seasons Perfs
ACT 16 87 12 37 127 336 18% 27% 2 11 2 11 NSW 430 1,036 102 323 1,254 2,152 30% 39% 95 223 77 206 NT 24 52 1 10 47 47 35% 57% - - 2 4 QLD 233 443 22 41 526 1,165 33% 29% 61 109 53 113 SA 79 105 8 15 93 147 48% 45% 10 15 - - TAS 30 72 21 49 96 258 35% 32% 16 46 24 58 VIC 434 3,089 354 1,029 881 2,494 47% 62% 100 168 122 166 WA 165 220 21 67 354 561 34% 34% 55 67 51 76 Total 1,411 5,104 541 1,571 3,378 7,160 37% 48% 339 639 331 634
318

34 2015 Economic Activity Report
Figure 17 shows the total number of venue performances broken down by financial risk. Performances presented or co-presented by the respondents make up 48% of the total performances presented. This is a further increase from 2013 levels (41%) and 2011 levels (37%) and continues to demonstrate the growing trend towards entrepreneurial programming.
Figure 17: Performances Involving Financial Risk for Venue Many Australian venues participate in processes that access Playing Australia funds to support the delivery of touring shows. Of the total events on which respondents incurred financial risk, Playing Australia supported 15% of performing arts seasons in the respondents’ venues (a reduction from 21% in 2013 and 17% in 2011). This represented 4.6% of all venue performances (6% in 2013 and 7% in 2011) and 9.6% of venue entrepreneurial programming.
Figure 18: Playing Australia Funded Seasons as a percentage of Entrepreneurial (risk)
Hire 52%
Full Risk 37%
Shared Risk 11%
Financial Risk
Playing Australia
15%
Other Funding 85%
Playing Australia Funded Seasons (n=52)
319

2015 Economic Activity Report 35
Figure 19: Playing Australia Funded Performances as a percentage of Entrepreneurial (risk) The value of the investment regional venues across Australia make in bringing high quality touring productions supported by Playing Australia to their community was also captured in the 2015 survey. The respondent venues program to take the entrepreneurial risk and allocate an annual budget towards performance fees, technical and front-of-house labour, marketing etc to successfully host a Playing Australia funded production. 36 venues, mainly regionally and remotely based, reported the value of the additional presentation funds made, as part of their programming commitment to Playing Australia funded productions was $5.7million.
Playing Australia supported
productions/seasons
Playing Australia supported
performances
Avg # Performances per Production/Season
n=68
ACT 2 11 5.5 NSW 95 223 2.3
NT 0 0 -
QLD 61 109 1.8
SA 10 15 1.5 TAS 16 46 2.9
VIC 100 168 1.7
WA 55 67 1.2
Total 339 639 1.88 Table 14: Playing Australia Funded Seasons and Performances per State
Playing Australia
9%
Other Funding 91%
Playing Australia Funded Performances (n=52)
320

36 2015 Economic Activity Report
State funding supporting productions touring to respondents’ venues was captured for the first time in the 2015 survey. These results (14% state funding support of the total seasons presented by venues) reveal a similar percentage of tours were supported by the combined state agencies to that of the total seasons funded through Playing Australia.
Figure 20: State Funding Agency Seasons as a Percentage of Total Arts Events
State Funding 14%
Other Funding 86%
State Agency Funded Seasons (n=51)
321

2015 Economic Activity Report 37
APPENDIX A: GLOSSARY Performance: a single performing arts presentation e.g. in the season of A Midsummer Night’s Dream there were 3 performances. This does not include closed rehearsals with audience or events as detailed below. A day of three sessions of Eisteddfod is considered to be three performances. Season: a series of more than one performance (over a defined period of time i.e. a week) of any one production e.g. 3 performances of A Midsummer Night’s Dream would constitute one season of that play. Event: a non-performance presentation such as a wedding, conference, film, rehearsal, class, workshop, ceremony, exhibition etc. Individual classes and rehearsals are counted separately, unless rehearsals are on stage or under stage lights (“production week”). Entrepreneured: a show that a performing arts centre has proactively programmed, for which the organisation receives part of or total box office takings, and on which the performing arts centre takes or shares the financial risk. Dedicated Programming Budget: a budgeted net expenditure that represents the net result of a centre’s programming activities for the year - i.e. the contribution made by its owner or management to offset the financial loss from presenting program. Activities: sum of all performances, films, lectures, seminars, conferences, workshops, rehearsals, exhibitions and other events [weddings, functions etc]. Activities of a non-arts nature: Product launches, conferences, functions etc of a non-arts related matter. Community events: Hirers were charged a discounted rate or hire was valued at a discounted rate as part of in-kind support. Commercial events: Hirers were charged a non-discounted rate or hire was valued at a non- discounted rate.
322

38 2015 Economic Activity Report
APPENDIX B: QUESTIONNAIRES
Introduction
This is part one of the three parts of the 2015 Biennial APACA Survey.
Please note, you can return to the survey any number of times to complete various questions and you can email your centre's
survey link to various members of your team for completion of questions relevant to their area of responsibility
BUT, PLEASE DON'T USE A SURVEY LINK THAT HAS NOT BEEN SPECIFICALLY SENT TO YOUR CENTRE
We are going to ask you a range of questions about your activities over the past year.
If you report on a financial year then provide details for the 2014/15 year, if you report on a calendar year then provide details for
the 2014 year.
If you have more than one venue include statistics for ALL venues in your answers ie: A ‘centre’ can include a number of individual
venues.
If you had a production that only had one performance, count it as one season AND one performance.
Please enter figures without dollar signs, commas, spaces or decimal points.
If you require assistance regarding clarification of definitions and/or questions please direct your enquiry via email to Rick Heath
[[email protected]] or call 08 9298 8822 [please note WA time zone].
1. Your Name:
Other (please specify)
2. Organisation name: (ie the APACA member)*
3. State:
QLD NSW ACT VIC TAS SA WA NT
323

2015 Economic Activity Report 39
4. What is the management model of your organisation? (select one)
Local Gov't, Statutory Authority, Part of an Education body, Bus. Unit of State/Federal Gov't dept., Co
Limited by Guarantee, Contract Management
Other (please specify)
5. Who is the owner of your venue? (select one)
Local Gov't, State Gov't, Federal Gov't, Private
6. What is the current estimated capital value of the centre you manage (including building and
contents)? Please enter a figure without dollar sign, commas, spaces or decimal points.
7. What is the total estimated number of people in your catchment area. i.e. that your organisation
makes services available to (including outlying areas)?
8. What is the distance, in kms, to the state or territory capital city nearest you, which may be in another
state or territory ?
9. What is the age of your centre/venue in years?
10. How many years is it since your centre had a capital upgrade [greater than $250K]?
324

40 2015 Economic Activity Report
Venue Capacity and Utilization
11. How many performance spaces are owned or managed by your organisation?*
12. What is the TOTAL combined seated capacity of ALL the performance venues you manage?
Capacity (the maximum seated capacity of the
performance space per performance)
Total Days per annum venue available for hire (e.g.
excluding maintenance days etc)
Whole days NOT used per annum (i.e. when the
venue was not used and could have been available
for hire or self presenting, preparation or
performance)
13. At the end of the year in which you’re accounting, how many days in that year was this performance
space available for hire but not used?
(If you report on a financial year then 2012/13 year OR if you report on a calendar year then 2012 year)
Performance Space 1
325
2015 Economic Activity Report 41
Venue Capacity and Utilization for more than one venue
Capacity (the seated capacity of the performance
space per performance)
Total Days per annum venue available for hire (eg
excluding maintenance days etc)
Whole days NOT used per annum
14. Performance Space 2
Capacity (the seated capacity of the performance
space per performance)
Total Days per annum venue available for hire (eg
excluding maintenance days etc)
Whole days NOT used per annum
15. Performance Space 3
Capacity (the seated capacity of the performance
space per performance)
Total Days per annum venue available for hire (eg
excluding maintenance days etc)
Whole days NOT used per annum
16. Performance Space 4
Capacity (the seated capacity of the performance
space per performance)
Total Days per annum venue available for hire (eg
excluding maintenance days etc)
Whole days NOT used per annum
17. Performance Space 5
326

42 2015 Economic Activity Report
Productions and Performances
This section relates to your Performing Arts activities - NOTE: productions reported on in this section do not include other non-
cultural events.
Definitions
Performance: a single Performing Arts presentation e.g. in the season of A Midsummer Night’s Dream there were three
performances. This does not include closed rehearsals with audience or events as detailed below. A day of three sessions of
Eisteddfod is considered to be three performances.
Season: a series of more than one performance (over a defined period of time i.e. a week) of any one production e.g. three
performances of A Midsummer Night’s Dream would constitute one season of that play.
Event: a non-performance presentation such as a wedding, conference, film, rehearsal, class, workshop, ceremony, exhibition etc.
Count individual classes and rehearsals separately, unless rehearsals are on stage or under stage lights (“production week”).
Entrepreneured: a show that your venue has proactively programmed, that your organisation receives part of or total box office
takings and on which you take, or share financial risk.
(If you report on a financial year then please use the 2014/15 year OR if you report on a calendar year then please report on 2014)
Number of productions/seasons:
Number of performances:
18. Of the productions you entrepreneured last
year, on how many did you take the full financial
risk?
Number of productions/seasons:
Number of performances:
19. Of the productions you entrepreneured last
year, on how many did you co-produce/co-present
(ie: you shared the financial risk)?
327

2015 Economic Activity Report 43
Number of productions/seasons:
Number of performances:
20. Of the total number of productions presented at
your Centre last year that you had a financial risk in
[professional and non-professional], how many
were financially supported by Playing Australia?
Number of
productions/seasons
Number of performances
21. Of the total number of productions presented at your Centre last year that you had a financial risk in
[professional and non-professional], how many were financially supported by State Government
Support?
Number of productions/seasons:
Number of performances:
22. Of the total number of productions undertaken
at your Centre last year, how many were
considered ‘community’ (ie: you charged a
discounted rate or valued hire at a discounted rate
as part of your in-kind support)?
Number of productions/seasons:
Number of performances
23. How many productions were outside hires last
year (ie: you had no financial risk)?
328

44 2015 Economic Activity Report
Productions and Performances
This section relates to your Performing Arts activities - NOTE: productions reported on in this section do not include other non-
cultural events.
Definitions
Performance: a single Performing Arts presentation of 1-3 hours duration e.g. in the season of A Midsummer Night’s Dream there
were 3 performances. This does not include closed rehearsals with audience or events as detailed below. A day of three sessions
of Eisteddfod is considered to be three performances.
Season: a series of more than one performance (over a defined period of time ie a week) of any one production e.g. 3
performances of A Midsummer Night’s Dream would constitute 1 season of that play.
Event: a non-performance presentation such as a wedding, conference, film, rehearsal, class, workshop, ceremony, exhibition etc.
Count individual classes and rehearsals separately, unless rehearsals are on stage or under stage lights (“production week”).
Entrepreneured: a show that your venue has proactively programmed, that your organisation receives part of or total box office
takings and on which you take, or share financial risk.
Number of productions/seasons:
Number of performances:
24. Of the total number of productions undertaken
at your Centre last year, how many were
considered ‘commercial’ (ie: you charged a non-
discounted rate or valued hire at a non-discounted
rate)?
25. What is the total attendance at performances (i.e. do not include non-performance events such as
weddings) at your Centre for the last year?
329

2015 Economic Activity Report 45
Other events
26. What is the total number of activities at your Centre for the last year?
Include the sum of all performances, films, lectures, seminars, conferences, workshops, rehearsals,
exhibitions and other events [weddings, functions etc].
27. Of all the activities/events counted above how many were of a non-arts nature?
E.g. product launches, conferences etc of a non-arts related matter
28. What is the total number of attendees to all your performances and events held at your centre?
330
46 2015 Economic Activity Report
THANK YOU
29. Do you have any comments regarding questions that you found difficult to answer ?
30. Any comments and/or feedback
331

Appendix 6 - Venues and Charges Report: Australian Performing Arts Centres Association (July, 2015)
332

Australian Performing Arts Centres Association www.apaca.com.au Published August 2016 Prepared by Ruth Hodgman / Visual Focus
Venue Charges and Salaries Report 2015
333
2015 Venue Charges and Salaries Report
2
Table of Contents Table of Figures ......................................................................................................... 3!INTRODUCTION ......................................................................................................... 4!AIM .............................................................................................................................. 4!METHODOLOGY ........................................................................................................ 4!
Response Rates ...................................................................................................... 5!RESPONDENT PROFILE ........................................................................................... 5!REMUNERATION AND EMPLOYMENT CONDITIONS ............................................. 7!
Centre Managers ..................................................................................................... 7!Venue Staff ............................................................................................................ 13!Staffing Levels ....................................................................................................... 17!
Venue Operations .................................................................................................... 19!Commercial Hire Rates – Primary Space .............................................................. 19!Commercial Hire Rates – Secondary Space ......................................................... 20!Commercial Hire Rates - Tertiary Space ............................................................... 21!Additional Performance Spaces ............................................................................. 22!Community Rates .................................................................................................. 22!Community Hire Rates - Primary Space ................................................................ 23!Community Hire Rates – Secondary Venue .......................................................... 24!Community Hire Rates – Tertiary venue ................................................................ 25!Community Rates – Additional Spaces .................................................................. 26!
Hire Package Inclusions .......................................................................................... 26!Staff Charge Out and Minimum Staffing ................................................................ 28!Staff Charge Out Rates .......................................................................................... 29!Minimum Staffing Levels ........................................................................................ 31!
Ticketing Operations ............................................................................................... 36!Ticketing Charges .................................................................................................. 38!
Subscribers and Volunteers ................................................................................... 44!Other Venue Services and Charges ....................................................................... 46!Appendix A – Respondents .................................................................................... 50!Appendix B – Survey Questionnaire ...................................................................... 52!
© Australian Performing Arts Centres’ Association www.apaca.com.au [email protected] Prepared by Ruth Hodgman Cover Photo from shake & stir's production of George Orwell's 1984. Image by Dylan Evans Performers (left to right) Nick Skubij, Bryan Probets, Nelle Lee, David Whitney, Ross Balbuziente
334

2015 Venue Charges and Salaries Report
3
Table of Figures Figure 1: Respondents by State ............................................................................................... 5!Figure 2: Venue Turnover of Respondents .............................................................................. 6!Figure 3: Respondents by Audience Capacity of Primary Space ............................................. 6!Figure 4: Comparative Performance Space Sizes ................................................................... 7!Figure 5: Centre Managers’ Total Remuneration ..................................................................... 8!Figure 6: Centre Managers’ Cash Salary by Venue Turnover ................................................. 8!Figure 7: Provision of Vehicle by Turnover .............................................................................. 9!Figure 8: Centre Managers’ Other Benefits .............................................................................. 9!Figure 9: Additional Superannuation rates ............................................................................. 10!Figure 10: Managers’ Salary Comparison 2011 to 2015 ........................................................ 10!Figure 11: Employment Basis for Centre Managers .............................................................. 11!Figure 12: Additional Responsibilities taken by Centre Managers ......................................... 12!Figure 13: Additional Responsibilities taken by Centre Managers ......................................... 12!Figure 14: Centre Managers’ Overtime Remuneration ........................................................... 13!Figure 15: Overtime Remuneration Comparison 2011 to 2015 ............................................... 13!Figure 16: Venue Staff Salaries - Turnover $0 - $1M .............................................................. 14!Figure 17: Venue Staff Salaries - Turnover $1M - $2M ........................................................... 14!Figure 18: Venue Staff Salaries - Turnover $2M - $5M ........................................................... 15!Figure 19: Venue Staff Salaries - Turnover $5M - $10M ......................................................... 15!Figure 20: Staff Overtime ........................................................................................................ 16!Figure 21: Venue Staff Industrial Agreements ........................................................................ 16!Figure 22: FTE Staff per Department – Turnover $0 to $1M ................................................... 17!Figure 23: FTE Staff per Department – Turnover $1 to $2M ................................................... 17!Figure 24: FTE Staff per Department – Turnover $2 to $5M ................................................... 18!Figure 25: Total Employment in Respondent Venues ............................................................. 18!Figure 26: Qualification Criteria for Community Hire Rates .................................................... 22!Figure 27: Hire Package Inclusions – Commercial –v- Community ........................................ 26!Figure 28: Marketing Services for Hirers ................................................................................. 27!Figure 29: Cleaning Charges .................................................................................................. 27!Figure 30: Ticketing Systems used by Respondents .............................................................. 36!Figure 31: Points-of-Sale per Venue ....................................................................................... 37!Figure 32: Frequency of Sales Channel Usage (on-line, telephone & counter sales) ............. 37!Figure 33: Frequency of Usage for External Sales Channels ................................................. 38!Figure 34: Card Merchant Fee Payment ................................................................................. 38!Figure 35: Use of Volunteers ................................................................................................... 46!Figure 36: Food and Beverage Services ................................................................................. 47!Figure 37: Commissions on Programs, Merchandise and Equipment Hire ............................. 47!
335

2015 Venue Charges and Salaries Report
4
INTRODUCTION The Australian Performing Arts Centres’ Association (APACA) represents 190 organisations throughout Australia. 63% of these members operate a professionally managed performing arts centres. Other members (37%) are from organisations that have substantially similar objectives to the Association and include producing companies, touring organisations and funding bodies. Our members operate predominantly in the subsidised sector. There are four international members. The performing arts centres’ sector presents productions from a vast array of art forms from plays, opera and classical music, to comedy, circus and contemporary dance. Typically the sector operates with a limited resource base in service of delivering benefits to their community. Whilst members are geographically dispersed, technology facilitates regular communication that has developed the sector into a strong network.
AIM The primary aim of the survey is to provide members with a benchmark document that allows for comparison of centres of a similar scale or those in the same state.
More specifically, the information contained in this report is designed as a tool to allow performing arts centres to review the salaries and charges associated with arts centre operation, or in some cases, benchmark performance. Managers of existing or proposed arts centres can use this information when setting or reviewing salaries and charges, or more broadly, in the development or review of business plans.
METHODOLOGY This survey is undertaken biennially and the questionnaire reviewed each time to minimise respondent burden and maximise participation in order to provide a strong representation of the sector.
A review was undertaken prior to commencing the survey design in an attempt to clarify terminology, maximise participation in order to provide a strong representation of the sector and ensure the information presented met member needs. Based on feedback, the geographic disparity of respondents and the extent of variables to be considered in the survey, an online survey tool was considered most effective in achieving high response rates. The questionnaires were distributed over a period November to 2015 to January 2016 through Survey Monkey to Ordinary members only, i.e. those members who manage performing arts venues. The survey tools can be found at Appendix B. Where possible, closed questions were asked requiring respondents to tick boxes or use drop down menus, however some questions required specific quantities and dollar values to be inserted by respondents. Conversely, for some questions it was important to provide an opportunity for respondents to clarify responses and opportunities for general comments were given.
336

2015 Venue Charges and Salaries Report
5
Data on the industry with turnover greater than $5M has been omitted from graphs where the limited number of respondents made it impossible to not disclose specific respondent details.
Response Rates Response rates were slightly higher than the previous survey in 2013, (70 vs 66) and represent 58% of the Ordinary (venue) membership (List of respondents at Appendix A). As response to each section was voluntary, the number of responses varies by question. All questions received sufficient response from the population of interest for the responses to be regarded as reliable. The limited sample of respondents with turnover greater than $5 million produced some skewed data, due to the diversity of that group, and a differing understanding of the questions, so responses have only been included when the data is consistent enough to be judged to be indicative. Data for turnover was provided by 42 venues that responded to the Economic survey distributed by APACA. As responses to each section was voluntary, the number of responses relating to the section’s analysis is noted against the tables and figures in this report.
RESPONDENT PROFILE A full list of respondents is attached at Appendix A. The following charts show the breakdown of the respondents by state, turnover and size of primary space. A similar sample of venues from each State/Territory was represented in previous surveys conducted by APACA in 2011 and 2013.
Figure 1: Respondents by State
NSW 24%
ACT 3%
QLD 22% SA
7%
NT 0%
TAS 6%
VIC 24%
WA 14%
Respondents By State (n=70)
337

2015 Venue Charges and Salaries Report
6
The range of turnover defined in previous surveys has been maintained for comparison. Overall, smaller size venues have increased their total turnover particularly noting the two low ranges ($0 to $2 million) have moved from 56% in 2013 down to 50% in 2015. The upper range of over $10million has decreased from 5% in 2013 to 2% in 2015. The larges increase is found in venue turnover of between the $2 and $10 million range, with a rise from 40% to 48% in 2015.
Figure 2: Venue Turnover of Respondents More than half of the respondents (53%) have venues with primary spaces between 500 and 999 seating capacity. This result is an increase from 48% in 2013. Performing arts centres generally have more than one auditorium available for public use.
Figure 3: Respondents by Audience Capacity of Primary Space
$0-$1M 14%
$1M-$2M 36%
$2M-$5M 39%
$5M-$10M 9%
Over $10M 2%
Turnover of Respondents (n=44)
Over 2000 1% 1,000-1,999
seats 9%
500-999 seats 53%
Under 500 seats 37%
Respondents by Audience Capacity of Primary Space (n=70)
338
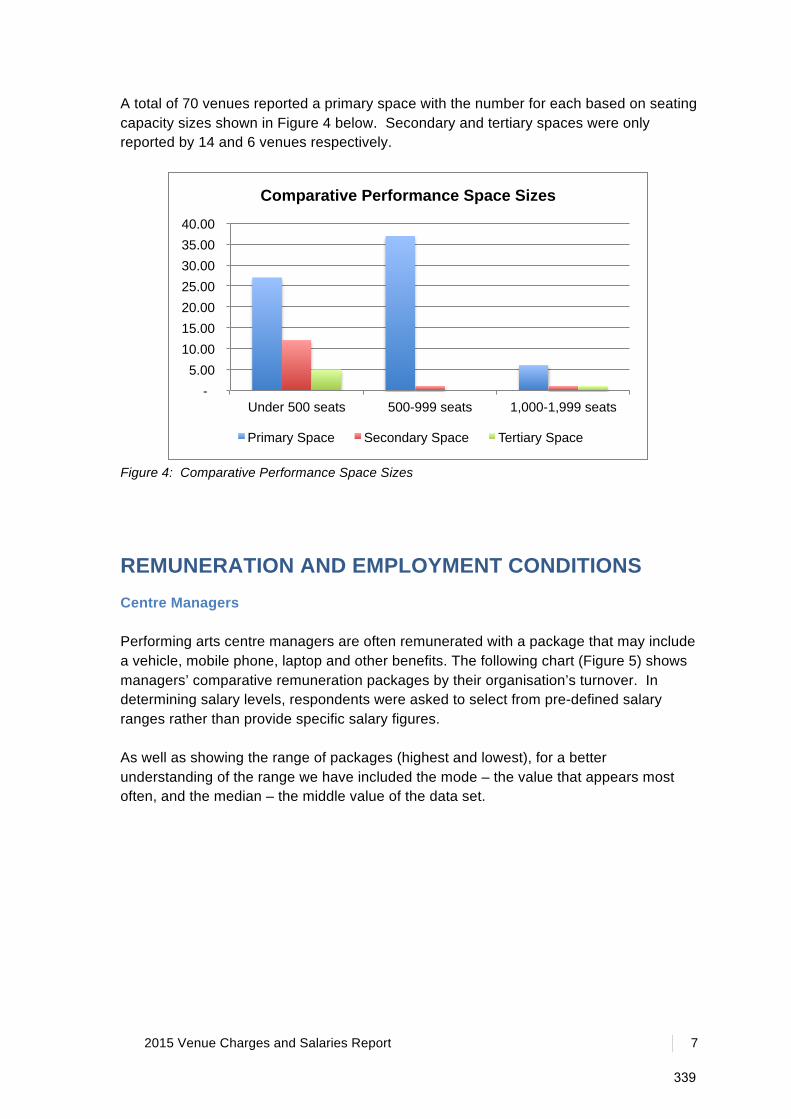
2015 Venue Charges and Salaries Report
7
A total of 70 venues reported a primary space with the number for each based on seating capacity sizes shown in Figure 4 below. Secondary and tertiary spaces were only reported by 14 and 6 venues respectively.
Figure 4: Comparative Performance Space Sizes
REMUNERATION AND EMPLOYMENT CONDITIONS
Centre Managers Performing arts centre managers are often remunerated with a package that may include a vehicle, mobile phone, laptop and other benefits. The following chart (Figure 5) shows managers’ comparative remuneration packages by their organisation’s turnover. In determining salary levels, respondents were asked to select from pre-defined salary ranges rather than provide specific salary figures. As well as showing the range of packages (highest and lowest), for a better understanding of the range we have included the mode – the value that appears most often, and the median – the middle value of the data set.
-
5.00
10.00
15.00
20.00
25.00
30.00
35.00
40.00
Under 500 seats 500-999 seats 1,000-1,999 seats
Comparative Performance Space Sizes
Primary Space Secondary Space Tertiary Space
339
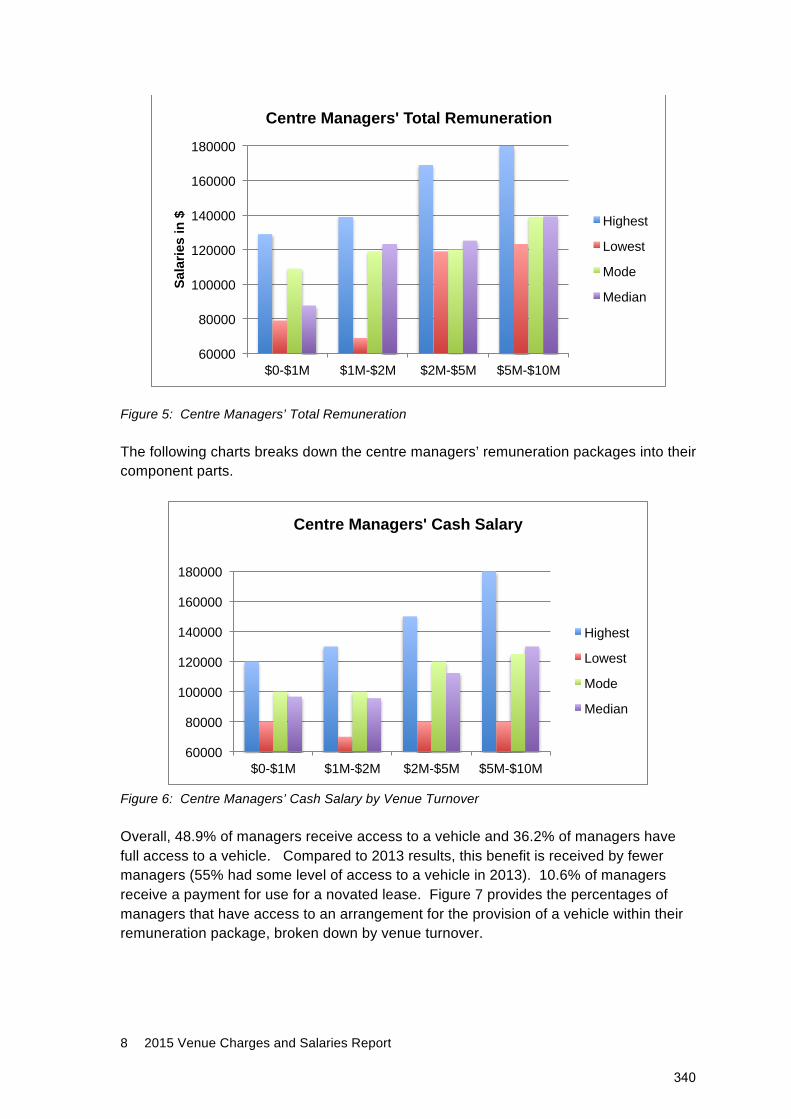
2015 Venue Charges and Salaries Report
8
Figure 5: Centre Managers’ Total Remuneration The following charts breaks down the centre managers’ remuneration packages into their component parts.
Figure 6: Centre Managers’ Cash Salary by Venue Turnover Overall, 48.9% of managers receive access to a vehicle and 36.2% of managers have full access to a vehicle. Compared to 2013 results, this benefit is received by fewer managers (55% had some level of access to a vehicle in 2013). 10.6% of managers receive a payment for use for a novated lease. Figure 7 provides the percentages of managers that have access to an arrangement for the provision of a vehicle within their remuneration package, broken down by venue turnover.
60000
80000
100000
120000
140000
160000
180000
$0-$1M $1M-$2M $2M-$5M $5M-$10M
Sal
arie
s in
$
Centre Managers' Total Remuneration
Highest
Lowest
Mode
Median
60000
80000
100000
120000
140000
160000
180000
$0-$1M $1M-$2M $2M-$5M $5M-$10M
Centre Managers' Cash Salary
Highest
Lowest
Mode
Median
340
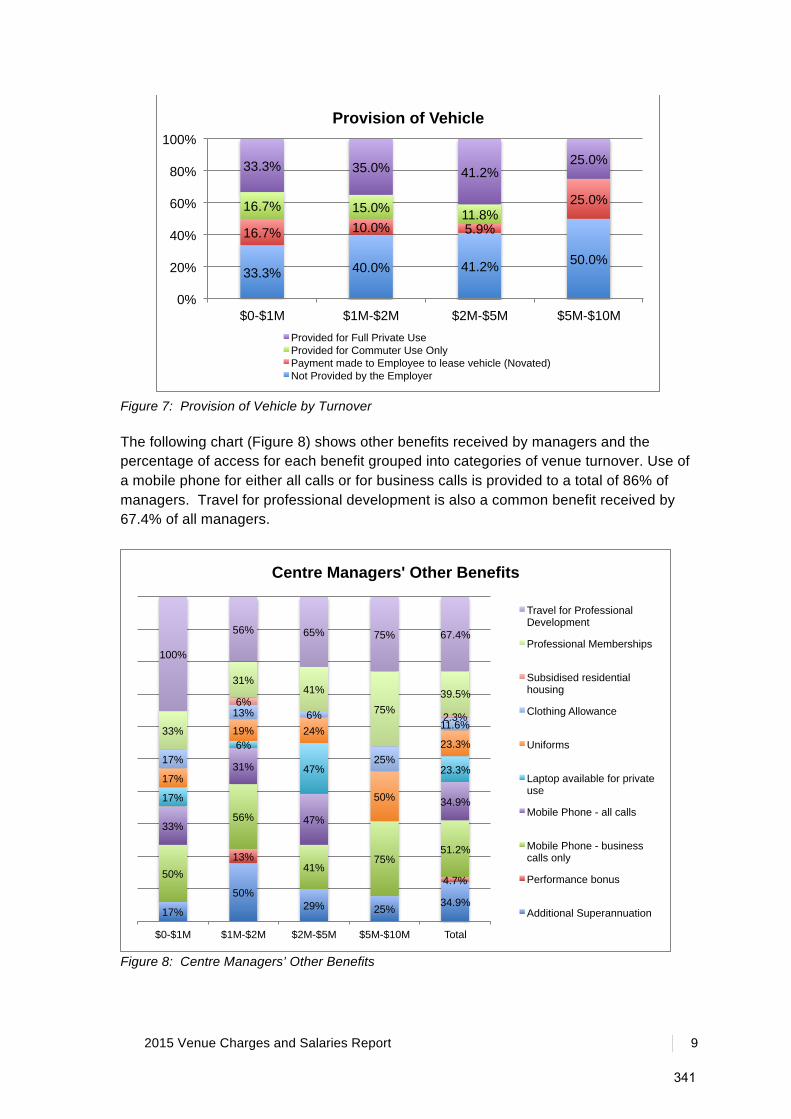
2015 Venue Charges and Salaries Report
9
Figure 7: Provision of Vehicle by Turnover The following chart (Figure 8) shows other benefits received by managers and the percentage of access for each benefit grouped into categories of venue turnover. Use of a mobile phone for either all calls or for business calls is provided to a total of 86% of managers. Travel for professional development is also a common benefit received by 67.4% of all managers.
Figure 8: Centre Managers’ Other Benefits
33.3% 40.0% 41.2% 50.0%
16.7% 10.0% 5.9%
25.0% 16.7% 15.0% 11.8%
33.3% 35.0% 41.2% 25.0%
0%
20%
40%
60%
80%
100%
$0-$1M $1M-$2M $2M-$5M $5M-$10M
Provision of Vehicle
Provided for Full Private Use Provided for Commuter Use Only Payment made to Employee to lease vehicle (Novated) Not Provided by the Employer
17%
50% 29% 25%
34.9%
13%
4.7% 50%
56%
41% 75%
51.2%
33%
31%
47%
34.9% 17%
6%
47% 23.3% 17%
19% 24%
50%
23.3%
17%
13% 6%
25%
11.6%
6%
2.3% 33%
31% 41%
75%
39.5%
100%
56% 65% 75% 67.4%
$0-$1M $1M-$2M $2M-$5M $5M-$10M Total
Centre Managers' Other Benefits
Travel for Professional Development
Professional Memberships
Subsidised residential housing
Clothing Allowance
Uniforms
Laptop available for private use
Mobile Phone - all calls
Mobile Phone - business calls only
Performance bonus
Additional Superannuation
341
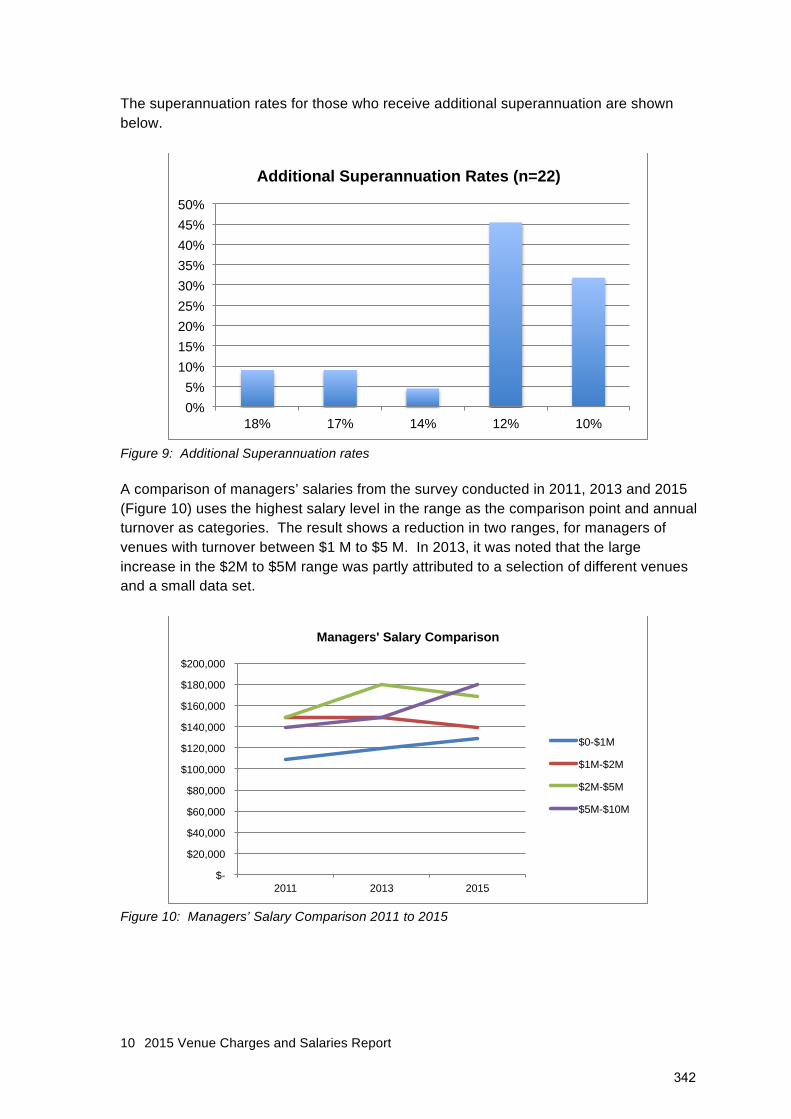
2015 Venue Charges and Salaries Report
10
The superannuation rates for those who receive additional superannuation are shown below.
Figure 9: Additional Superannuation rates A comparison of managers’ salaries from the survey conducted in 2011, 2013 and 2015 (Figure 10) uses the highest salary level in the range as the comparison point and annual turnover as categories. The result shows a reduction in two ranges, for managers of venues with turnover between $1 M to $5 M. In 2013, it was noted that the large increase in the $2M to $5M range was partly attributed to a selection of different venues and a small data set.
Figure 10: Managers’ Salary Comparison 2011 to 2015
0%
5%
10%
15%
20%
25%
30%
35%
40%
45%
50%
18% 17% 14% 12% 10%
Additional Superannuation Rates (n=22)
$-
$20,000
$40,000
$60,000
$80,000
$100,000
$120,000
$140,000
$160,000
$180,000
$200,000
2011 2013 2015
Managers' Salary Comparison
$0-$1M
$1M-$2M
$2M-$5M
$5M-$10M
342

2015 Venue Charges and Salaries Report
11
Performing arts centre managers are often employed on a different basis to their staff. The following chart shows a high incidence of private contracts although the percentage of occurrence has reduced by 3% since the 2013 survey. Managers employed by industrial award have increased by 2% and enterprise agreements have increased by 1%.
Figure 11: Employment Basis for Centre Managers The breadth of the sector is demonstrated by the range of the responsibilities undertaken by centre managers in addition to the programming and management of their venue. The most common added responsibility is Events and Community Celebrations with 34% reporting it as part of their role, which has increased by 5% in each survey from 2011 and 2013. Management of Arts Galleries or Visual Arts programs has also increased across surveys from 17% to 21% while the management of various services including leases, food and beverage outlets as well as Tourism Information Centres, Sports Stadiums and Function Centres are included in an increasing number of Centre Manager roles, increasing from 9% in 2011 to 18% in 2015.
Enterprise agreement
44%
Contract for service via a
separate legal entity 2%
Industrial award 27%
Private contract of
employment 27%
Employment Basis (n=62)
343

2015 Venue Charges and Salaries Report
12
Figure 12: Additional Responsibilities taken by Centre Managers Centre managers were asked to estimate their average weekly hours over the previous three months prior to the survey. Overall, centre managers commitment of work hours has remained constant. In 2013, 75% of managers reported their working week was more than 40 hours (an increase of 8% over 2011) which is consistent with the 2015 result. In 2015, the survey provided an additional category asking for work hours more than 50 hours per week, with 10% of managers reporting this time commitment.
Figure 13: Additional Responsibilities taken by Centre Managers Centre managers were asked to clarify how overtime was remunerated. TOIL (Time off in lieu of payment) is the most common way of dealing with overtime, particularly for venues with less than $2M turnover. Three venues reported receiving additional payment for overtime. Venues with higher turnover more commonly have overtime included within their salary. Work/life balance is a concern in many workplaces and in this survey, 19% of all venue managers reported that additional hours and overtime is ‘largely ignored’.
0% 5%
10% 15% 20% 25% 30% 35% 40%
Managers' Responsibilities
2015
2013
2011
Less than 35 hrs 3%
35-40 hrs 22%
40-45 hrs 34%
45-50 hrs 31%
More than 50 hrs 10%
Managers' Average Hours (n=62)
344

2015 Venue Charges and Salaries Report
13
Figure 14: Centre Managers’ Overtime Remuneration When comparing the 2015 results with the past two surveys, the category ‘largely ignored’ has shown an increase of 5% while TOIL has reduced by 3% since 2013. The acknowledgment via payment for overtime was only reported by two venues with a turnover between $1M and $2M. The availability of TOIL plus overtime payment has reduced significantly and was only reported by one venue in 2015.
Figure 15: Overtime Remuneration Comparison 2011 to 2015
Venue Staff Similar to the information on centre managers’ remuneration, respondents were asked to select from pre-defined salary ranges rather than provide specific salary figures. Once again, for a better understanding of the range we have included the mode – which is the value that appears most often, and the median – which is the middle value of the data set. The information is presented by organisation turnover to assist with comparisons.
17% 19%
47% 50% 17% 19%
18% 25%
6% 67% 50%
29% 25% 13%
0%
10%
20%
30%
40%
50%
60%
70%
80%
90%
100%
$0-$1M $1M-$2M $2M-$5M $5M-$10M
Managers' Overtime Remuneration (n=43)
Included in Salary Largely Ignored TOIL plus Payment TOIL Overtime Payment
0%
5%
10%
15%
20%
25%
30%
35%
40%
45%
50%
Included in Salary
Largely Ignored
TOIL plus Payment
TOIL Overtime Payment
Overtime Remuneration Comparison
2015
2013
2011
345
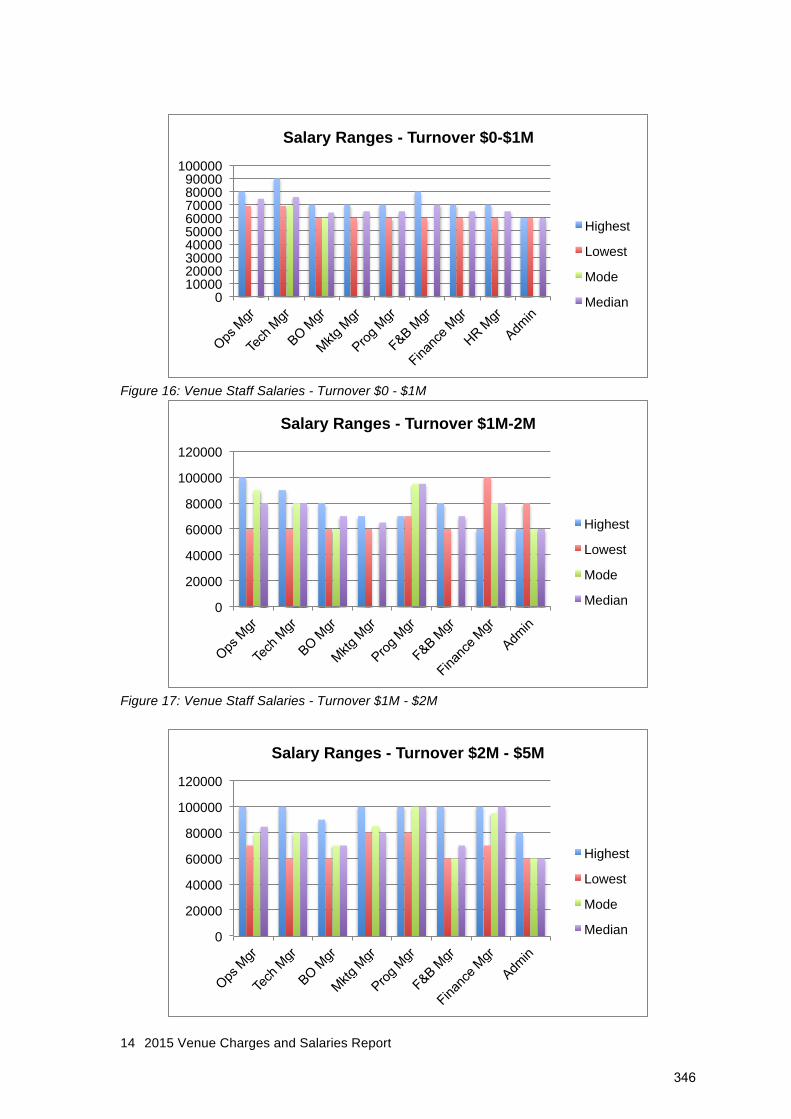
2015 Venue Charges and Salaries Report
14
Figure 16: Venue Staff Salaries - Turnover $0 - $1M
Figure 17: Venue Staff Salaries - Turnover $1M - $2M
0 10000 20000 30000 40000 50000 60000 70000 80000 90000
100000
Salary Ranges - Turnover $0-$1M
Highest
Lowest
Mode
Median
0
20000
40000
60000
80000
100000
120000
Salary Ranges - Turnover $1M-2M
Highest
Lowest
Mode
Median
0
20000
40000
60000
80000
100000
120000
Salary Ranges - Turnover $2M - $5M
Highest
Lowest
Mode
Median
346

2015 Venue Charges and Salaries Report
15
Figure 18: Venue Staff Salaries - Turnover $2M - $5M In the group of venues with turnover between $2M and $5M there was no data reported for Human Resource Managers (Figure 18). For Administration personnel, the majority of venues reported their staff are paid at $60,000 or less. In Figure 19, the number of venue respondents is small and data was not provided for salary ranges for Program or Human Resource Manager roles. Finance Manager and Administration roles were only reported by one of these venues.
Figure 19: Venue Staff Salaries - Turnover $5M - $10M The following charts show different aspects of conditions of employment.
0
20000
40000
60000
80000
100000
120000
Ops Mgr Tech Mgr
BO Mgr Mktg Mgr
Finance Mgr
Admin
Salary Ranges - Turnover $5M or more
Highest
Lowest
Mode
Median
347

2015 Venue Charges and Salaries Report
16
Figure 20: Staff Overtime
Figure 21: Venue Staff Industrial Agreements
7% 8% 4% 13%
5% 5% 4%
17% 10%
6%
27%
18% 5%
22%
3%
10% 23%
18%
40%
18%
11%
17%
27%
12%
15% 29%
13%
9%
16%
9%
21%
54% 44% 43%
13%
50% 63%
48% 48%
0%
10%
20%
30%
40%
50%
60%
70%
80%
90%
100%
Ops Mgr Tech Mgr BO Mgr Mktg Mgr Prog Mgr F&B Mgr Fin Mgr Admin Off'
Staff Overtime Arrangements
Included in Salary Not Paid
Paid as per Award Combination TOIL & payment
Provided as TOIL
28% 14% 12% 9% 15%
38% 47% 50% 52% 43%
3% 7% 12% 9% 11%
3% 3% 5% 5% 5% 7% 7%
23% 24% 22% 24% 24%
0%
10%
20%
30%
40%
50%
60%
70%
80%
90%
100%
Management Administration Technical Front of House Food & Beverage
Industrial Agreements by Department
Contract of Employment Enterprise Agreement Federal Industrial Award Federal Local Govt Award State Industrial Award State Local Govt Award
348

2015 Venue Charges and Salaries Report
17
Staffing Levels The following charts plot the number of full-time equivalent (FTE) staff employed by centres across the various departments. It shows the percentage of respondents that staff each department at a particular level of FTEs. Data from centres with a turnover of more than $5M was insufficient to be significant and has been omitted. In respondent venues with a turnover of less than $1million per annum, there is no public programs department.
Figure 22: FTE Staff per Department – Turnover $0 to $1M
Figure 23: FTE Staff per Department – Turnover $1 to $2M
50% 33%
100%
40% 25% 20%
50%
50%
40%
20%
25%
25%
20%
25%
20%
20%
25%
33%
25% 20% 33%
0% 10% 20% 30% 40% 50% 60% 70% 80% 90%
100%
Full-Time Equivalent Staff per Department Turnover $0 - $1M
5 or more
4 FTEs
3.5 FTEs
3 FTEs
2.5 FTEs
2 FTEs
1.5 FTEs
1 FTE
0.5 FTEs
13% 20% 20% 25%
50%
50%
18%
10% 33%
60%
60%
38%
18%
20% 25%
20% 25%
30%
17%
25%
18%
17%
20%
17%
20% 13%
27%
10% 13% 18%
10% 17% 25%
0%
10%
20%
30%
40%
50%
60%
70%
80%
90%
100%
Full-Time Equivalent Staff per Department Turnover $1 - $2M
5 or more
4 FTEs
3.5 FTEs
3 FTEs
2.5 FTEs
2 FTEs
1.5 FTEs
1 FTE
0.5 FTEs
349

2015 Venue Charges and Salaries Report
18
Figure 24: FTE Staff per Department – Turnover $2 to $5M Total FTE across the 53 respondent venues and all departments provides an indication of the level of employment generated by the sector. A total of 746 people are employed across respondent venues with an average of 14 staff per venue. Figure 23 shows the spread of departments and percentage of skilled persons required on average per venue.
Figure 25: Total Employment in Respondent Venues
20% 20% 29%
13%
50%
25% 20%
30%
25%
57%
25% 8%
30% 25%
50%
13%
10% 20% 25%
14%
13%
10%
25%
20% 10%
13% 17%
10%
25%
13% 20%
8%
20% 10% 17%
25% 25% 13%
0%
10%
20%
30%
40%
50%
60%
70%
80%
90%
100%
Full-Time Equivalent Staff per Department Turnover $2 - $5M
5 or more
4 FTEs
3.5 FTEs
3 FTEs
2.5 FTEs
2 FTEs
1.5 FTEs
1 FTE
0.5 FTEs
Operations 15%
Technical 26%
Box Office 13%
Marketing 8%
Public Progs 6%
Food & Bev 20%
Finance 4%
Administration 8%
Total Employment across all Departments (n=53)
350

2015 Venue Charges and Salaries Report
19
Venue Operations
Commercial Hire Rates – Primary Space Capacity Venue –
Primary Performance Space State Commercial Hire (Package Rate) Commercial Hire
(Rehearsal Rate) Per
week Per day Per
session Hours
per session
Vs % of Net Box Office
Per Hour Per Day
Under 500
Seats
BEMAC - Brisbane Multicultural Arts Centre
QLD 1,200 720 4 150 1,200
Broome Civic Centre [Shire of Broome] WA 3,435 1,145 625 - - 1,145 Burnie Arts and Function Centre TAS 695 75 Colac Otway Performing Arts and Cultural Centre
VIC NA 1,400 950 4 NA NA 1,400
Devonport Entertainment and Convention Centre
TAS - - - 8.5% 160 320
Don Russell Performing Arts Centre WA 610 < 8 41 Dubbo Regional Theatre and Convention Centre
NSW NA 1,560 NA 10% 120 675
Judith Wright Centre of Contemporary Arts
QLD 8,260 2,060 - 1,240
Karralyka Centre VIC 261 2,088 Marion Cultural Centre SA 14,455 1,947 825 4 NA 150 1,947 Matt Dann Theatre & Cinema WA NA 855 433 4 540 Mildura Arts Centre VIC 1,350 83 Monkey Baa Theatre Company NSW by
request 4,150 2,500 5 215 4,150
Pilbeam Theatre QLD 1,160 10% 75 Playford Civic Centre SA 1,947 583 120 583 Portland Arts Centre VIC 75 1 QUT Gardens Theatre QLD 17,300 3,850 Street Theatre ACT 5,000 The Cube Wodonga VIC 1,943 1,227 4 NA The Hopgood Theatre SA 1190 6 12.5% 4 hours 250 Wagga Wagga Civic Theatre NSW 2,200 12% West Gippsland Arts Centre VIC NA 1,400 1,400 10 NA 55 NA Whitehorse Performing Arts Centre VIC NA NA 1,500 5 150
Capacity Venue -
Primary Performance Space State Commercial Hire (Package Rate) Commercial Hire
(Rehearsal Rate) Per
week Per day Per
session Hours
per session
Vs % of Net Box Office
Per Hour Per Day
500 to 999
Seats
Manning Entertainment Centre NSW 3,600 1,000 1,000 8 10% 100 800 Barossa Arts & Convention Centre SA 2,500 1,350 Brolga Theatre QLD 920 10% 68 Redland Performing Arts Centre QLD 1,209 10% 76 533 Eastbank Centre - Riverlinks Venues VIC 2,010 520 Frankston Arts Centre VIC 2,420 5 220 Bathurst Memorial Entertainment Centre
NSW 1,400 700 4 10% 119 700
Albury Entertainment Centre NSW 1,795 12% 140 Shoalhaven Entertainment Centre NSW NA 1,925 1,925 8 NA NA 970 Clocktower Centre VIC 545 1 290 University Theatres - University of Western Australia
WA 880 440
Orange Civic Theatre NSW $1246 NA NA NA 12.5% Her Majesty's Theatre VIC NA 3,280 9 NA 225 1,250 Bunbury Regional Entertainment Centre
WA 3,468 16 172 520
351
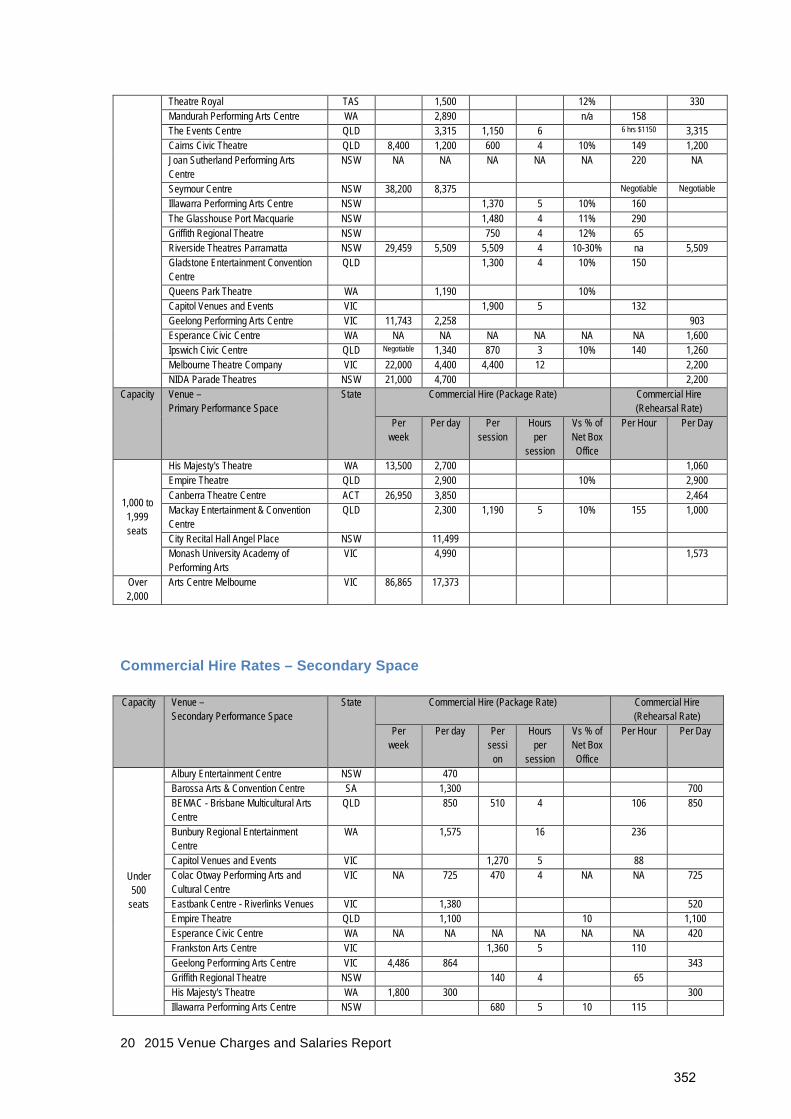
2015 Venue Charges and Salaries Report
20
Theatre Royal TAS 1,500 12% 330 Mandurah Performing Arts Centre WA 2,890 n/a 158 The Events Centre QLD 3,315 1,150 6 6 hrs $1150 3,315 Cairns Civic Theatre QLD 8,400 1,200 600 4 10% 149 1,200 Joan Sutherland Performing Arts Centre
NSW NA NA NA NA NA 220 NA
Seymour Centre NSW 38,200 8,375 Negotiable Negotiable Illawarra Performing Arts Centre NSW 1,370 5 10% 160 The Glasshouse Port Macquarie NSW 1,480 4 11% 290 Griffith Regional Theatre NSW 750 4 12% 65 Riverside Theatres Parramatta NSW 29,459 5,509 5,509 4 10-30% na 5,509 Gladstone Entertainment Convention Centre
QLD 1,300 4 10% 150
Queens Park Theatre WA 1,190 10% Capitol Venues and Events VIC 1,900 5 132 Geelong Performing Arts Centre VIC 11,743 2,258 903 Esperance Civic Centre WA NA NA NA NA NA NA 1,600 Ipswich Civic Centre QLD Negotiable 1,340 870 3 10% 140 1,260 Melbourne Theatre Company VIC 22,000 4,400 4,400 12 2,200 NIDA Parade Theatres NSW 21,000 4,700 2,200
Capacity Venue – Primary Performance Space
State Commercial Hire (Package Rate) Commercial Hire (Rehearsal Rate)
Per week
Per day Per session
Hours per
session
Vs % of Net Box Office
Per Hour Per Day
1,000 to 1,999 seats
His Majesty's Theatre WA 13,500 2,700 1,060 Empire Theatre QLD 2,900 10% 2,900 Canberra Theatre Centre ACT 26,950 3,850 2,464 Mackay Entertainment & Convention Centre
QLD 2,300 1,190 5 10% 155 1,000
City Recital Hall Angel Place NSW 11,499 Monash University Academy of Performing Arts
VIC 4,990 1,573
Over 2,000
Arts Centre Melbourne
VIC 86,865 17,373
Commercial Hire Rates – Secondary Space Capacity Venue –
Secondary Performance Space State Commercial Hire (Package Rate) Commercial Hire
(Rehearsal Rate) Per
week Per day Per
session
Hours per
session
Vs % of Net Box Office
Per Hour Per Day
Under 500
seats
Albury Entertainment Centre NSW 470 Barossa Arts & Convention Centre SA 1,300 700 BEMAC - Brisbane Multicultural Arts Centre
QLD 850 510 4 106 850
Bunbury Regional Entertainment Centre
WA 1,575 16 236
Capitol Venues and Events VIC 1,270 5 88 Colac Otway Performing Arts and Cultural Centre
VIC NA 725 470 4 NA NA 725
Eastbank Centre - Riverlinks Venues VIC 1,380 520 Empire Theatre QLD 1,100 10 1,100 Esperance Civic Centre WA NA NA NA NA NA NA 420 Frankston Arts Centre VIC 1,360 5 110 Geelong Performing Arts Centre VIC 4,486 864 343 Griffith Regional Theatre NSW 140 4 65 His Majesty's Theatre WA 1,800 300 300 Illawarra Performing Arts Centre NSW 680 5 10 115
352

2015 Venue Charges and Salaries Report
21
Ipswich Civic Centre QLD Negoitable 990 330 3 10% 110 990 Joan Sutherland Performing Arts Centre
NSW NA NA NA NA NA 220 NA
Judith Wright Centre of Contemporary Arts
QLD 1,650 500 230
Mandurah Performing Arts Centre WA 990 NA 150 Melbourne Theatre Company VIC 5,500 1,100 550 6 1,100 Mildura Arts Centre VIC 115 115 NIDA Parade Theatres NSW 6,600 1,600 850 Queens Park Theatre WA 310 Redland Performing Arts Centre QLD 430 10 56 430 Riverside Theatres Parramatta NSW 7,543 1,604 1,604 4 10-30% NA 1,604 Shoalhaven Entertainment Centre NSW NA 580 290 4 NA NA 580 Street Theatre ACT 1,500 The Glasshouse Port Macquarie NSW 360 4 The Hopgood Theatre SA 260 4 per 4
hours 260
Theatre Royal TAS 1,100 385 220 Capacity Venue –
Secondary Performance Space State Commercial Hire (Package Rate) Commercial Hire
(Rehearsal Rate) Per
week Per day Per
session
Hours per
session
Vs % of Net Box Office
Per Hour Per Day
500 to 999
seats
Bathurst Memorial Entertainment Centre
NSW 1,258 677 4 10% 119 677
Burnie Arts and Function Centre TAS 910 75 Canberra Theatre Centre ACT 15,785 2,255 1,551 Dubbo Regional Theatre and Convention Centre
NSW 1,295 8 10% 120 620
Orange Civic Theatre NSW 1,010 11% Seymour Centre NSW 31,000 6,880 Negotiable Negotiable
University Theatres - University of Western Australia
WA 1,320 660
Capacity Venue –
Secondary Performance Space State Commercial Hire (Package Rate) Commercial Hire
(Rehearsal Rate) Per
week Per day Per
session
Hours per
session
Vs % of Net Box Office
Per Hour Per Day
Over 1,000 seats
Mackay Entertainment & Convention Centre
QLD
NA 7,800 5,000 Day & Evening
10% Discretional
Discretional
Arts Centre Melbourne
VIC 88,321 17,648
Commercial Hire Rates - Tertiary Space Capacity Venue –
Tertiary Performance Space State Commercial Hire (Package Rate) Commercial Hire
(Rehearsal Rate) Per
week Per day Per
session
Hours per
session
Vs % of Net Box Office
Per Hour Per Day
Under 500
seats
Bathurst Memorial Entertainment Centre NSW 228 118 4 NA 59 228 Canberra Theatre Centre ACT 924 154 154 Capitol Venues and Events VIC 417 5 47 Empire Theatre QLD 850 10% 850
353

2015 Venue Charges and Salaries Report
22
Illawarra Performing Arts Centre NSW 330 5 10% 45 Joan Sutherland Performing Arts Centre NSW NA NA NA NA NA 88 Redland Performing Arts Centre QLD 683 10 70 683 Riverside Theatres Parramatta NSW 5,576 1,084 1,084 4 10-30% NA 1,084 Seymour Centre NSW 6,100 1,950 Negotiable Negotiable Street Theatre ACT 1,000 The Glasshouse Port Macquarie NSW 350 175 4 University Theatres - University of Western Australia WA 440 440
500 to 999
seats Arts Centre Melbourne
VIC 33064 6608
1,000 to 1,999
Geelong Performing Arts Centre
VIC 16356 3145
Additional Performance Spaces
Capacity Venue – Additional Performance Space State
Commercial Hire (Package Rate) Commercial Hire (Rehearsal Rate)
Per week
Per day Per sessi
on
Hours per
session
Vs % of Net Box Office
Per Hour
Per Day
Under 500
seats
Bathurst Memorial Entertainment Centre
NSW 337 169 4 NA NA 337
Capitol Venues and Events VIC 217 128 4 217 Empire Theatre QLD 700 10% 700 Seymour Centre NSW 5,900 985 Negotiable Negotiable
Arts Centre Melbourne
VIC
13,450 2,688
1,000 to 1,999
Illawarra Performing Arts Centre
NSW
1,900 5 10 190
Community Rates Almost all venues offer discounted rates for community groups, however the definition varies between centres. The following chart shows the principal types of qualifications hirers require to access these rates and the percentage of venue respondents that apply those criteria.
Figure 26: Qualification Criteria for Community Hire Rates
0%
10%
20%
30%
40%
50%
60%
70%
80%
90%
Public Education
Private Education
NFP in Area Any NFP Dance School
Qualification for Community Rate (n=60)
354
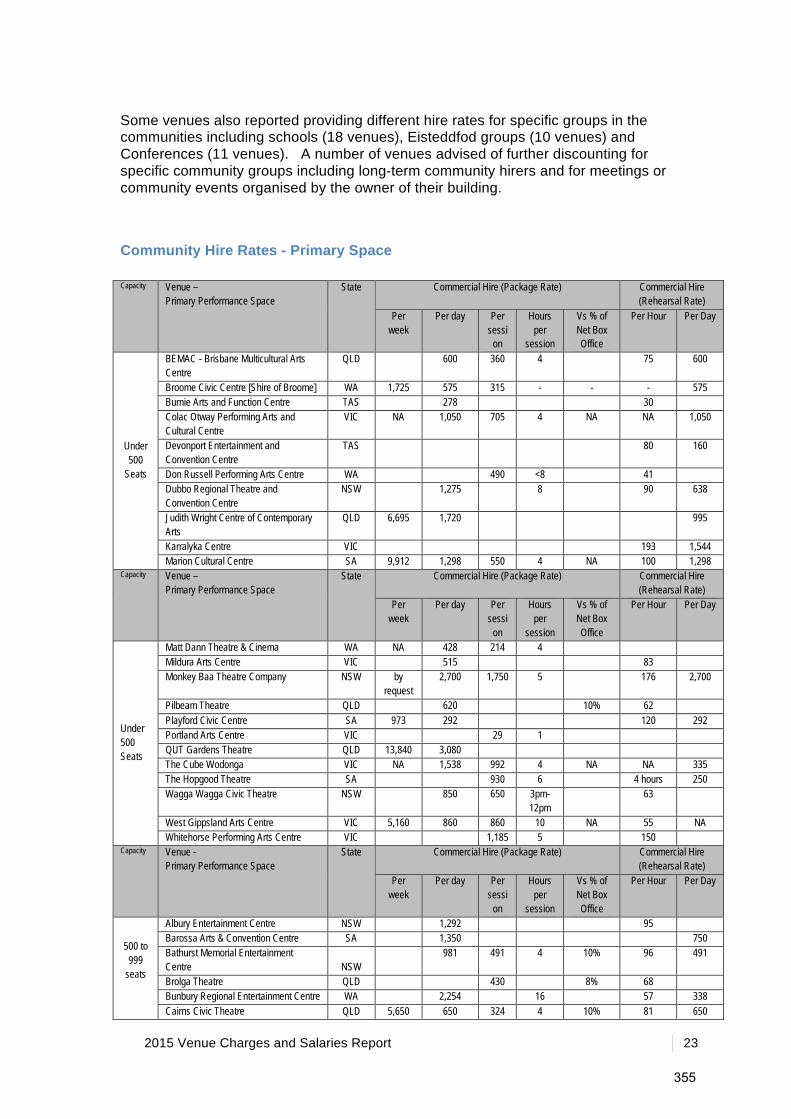
2015 Venue Charges and Salaries Report
23
Some venues also reported providing different hire rates for specific groups in the communities including schools (18 venues), Eisteddfod groups (10 venues) and Conferences (11 venues). A number of venues advised of further discounting for specific community groups including long-term community hirers and for meetings or community events organised by the owner of their building.
Community Hire Rates - Primary Space Capacity Venue –
Primary Performance Space State Commercial Hire (Package Rate) Commercial Hire
(Rehearsal Rate) Per
week Per day Per
session
Hours per
session
Vs % of Net Box Office
Per Hour Per Day
Under 500
Seats
BEMAC - Brisbane Multicultural Arts Centre
QLD 600 360 4 75 600
Broome Civic Centre [Shire of Broome] WA 1,725 575 315 - - - 575 Burnie Arts and Function Centre TAS 278 30 Colac Otway Performing Arts and Cultural Centre
VIC NA 1,050 705 4 NA NA 1,050
Devonport Entertainment and Convention Centre
TAS 80 160
Don Russell Performing Arts Centre WA 490 <8 41 Dubbo Regional Theatre and Convention Centre
NSW 1,275 8 90 638
Judith Wright Centre of Contemporary Arts
QLD 6,695 1,720 995
Karralyka Centre VIC 193 1,544 Marion Cultural Centre SA 9,912 1,298 550 4 NA 100 1,298
Capacity Venue – Primary Performance Space
State Commercial Hire (Package Rate) Commercial Hire (Rehearsal Rate)
Per week
Per day Per sessi
on
Hours per
session
Vs % of Net Box Office
Per Hour Per Day
Under 500 Seats
Matt Dann Theatre & Cinema WA NA 428 214 4 Mildura Arts Centre VIC 515 83 Monkey Baa Theatre Company NSW by
request 2,700 1,750 5 176 2,700
Pilbeam Theatre QLD 620 10% 62 Playford Civic Centre SA 973 292 120 292 Portland Arts Centre VIC 29 1 QUT Gardens Theatre QLD 13,840 3,080 The Cube Wodonga VIC NA 1,538 992 4 NA NA 335 The Hopgood Theatre SA 930 6 4 hours 250 Wagga Wagga Civic Theatre NSW 850 650 3pm-
12pm 63
West Gippsland Arts Centre VIC 5,160 860 860 10 NA 55 NA Whitehorse Performing Arts Centre VIC 1,185 5 150
Capacity Venue - Primary Performance Space
State Commercial Hire (Package Rate) Commercial Hire (Rehearsal Rate)
Per week
Per day Per sessi
on
Hours per
session
Vs % of Net Box Office
Per Hour Per Day
500 to 999
seats
Albury Entertainment Centre NSW 1,292 95 Barossa Arts & Convention Centre SA 1,350 750 Bathurst Memorial Entertainment Centre NSW
981 491 4 10% 96 491
Brolga Theatre QLD 430 8% 68 Bunbury Regional Entertainment Centre WA 2,254 16 57 338 Cairns Civic Theatre QLD 5,650 650 324 4 10% 81 650
355

2015 Venue Charges and Salaries Report
24
Capitol Venues and Events VIC 1,676 5 81 Clocktower Centre VIC 505 1 200 Eastbank Centre - Riverlinks Venues VIC 1,380 445 Esperance Civic Centre WA NA NA NA NA NA NA 1,280 Frankston Arts Centre VIC 1,760 5 220 Geelong Performing Arts Centre VIC 10,674 2,053 822 Gladstone Entertainment Convention Centre QLD
520 4 10% 60
Griffith Regional Theatre NSW
$400 or
$2.50 / seat
4 First 4 hours free,
$65 / hr
Her Majesty's Theatre VIC NA 2,560 9 225 1,250 Illawarra Performing Arts Centre NSW 870 5 10% 120
Ipswich Civic Centre QLD Negotia
ble 1,005 525 3 NA 90 720
Joan Sutherland Performing Arts Centre NSW NA NA NA NA NA 110 NA Mandurah Performing Arts Centre WA 2,200 NA 150 Manning Entertainment Centre NSW 3,600 500 500 8 10% 100 800 Melbourne Theatre Company VIC 22,000 4,400 4,400 12 2,200 NIDA Parade Theatres NSW 15,000 3,000 1,750
Orange Civic Theatre NSW $865 perf 12.5%
NBO
Queens Park Theatre WA 595 5% Redland Performing Arts Centre QLD 725 10% 46 320 Riverside Theatres Parramatta NSW 25,045 4,662 4,662 4 10-30% NA 4,662 Seymour Centre NSW Negotiable Negotiable Negotiable Negotiable
Shoalhaven Entertainment Centre NSW NA 935 935 8 NA NA 385 The Events Centre QLD 3,015
1,108 6 6 hours 3,015
The Glasshouse Port Macquarie NSW 888 4 174 Theatre Royal TAS 1,000 330
Capacity Venue –
Primary Performance Space State Commercial Hire (Package Rate) Commercial Hire
(Rehearsal Rate) Per
week Per day Per
session
Hours per
session
Vs % of Net Box Office
Per Hour Per Day
More than
1,000
Canberra Theatre Centre ACT City Recital Hall Angel Place NSW 8,440 3,874 Empire Theatre QLD 1,800 10% 1,800 His Majesty’s Theatre WA 12,500 2,500 1,000 Mackay Entertainment & Convention Centre QLD
0 2,000 810 5 10% 155 1,000
Monash University Academy of Performing Arts VIC
4,670
Community Hire Rates – Secondary Venue Capacity Venue –
Secondary Performance Space State Commercial Hire (Package Rate) Commercial Hire
(Rehearsal Rate) Per
week Per day Per
session
Hours per
session
Vs % of Net Box Office
Per Hour Per Day
Under 500
seats
Albury Entertainment Centre NSW 423 Barossa Arts & Convention Centre SA 700 13.4 350 BEMAC – Brisbane Multicultural Arts Centre
QLD 425 255 4 53.15 425
Bunbury Regional Entertainment Centre
WA 1,260 16 189
Capitol Venues and Events VIC 1,118 5 81
356

2015 Venue Charges and Salaries Report
25
Colac Otway Performing Arts and Cultural Centre
VIC NA 620 395 4 NA NA 620
Eastbank Centre – Riverlinks Venues VIC 1,020 445 Empire Theatre QLD 800 10% 800 Esperance Civic Centre WA NA NA NA NA NA NA 336 Frankston Arts Centre VIC 890 5 110 Geelong Performing Arts Centre VIC 4,064 782 312 Griffith Regional Theatre NSW 140 65 His Majesty’s Theatre WA 1,800 300 300 Illawarra Performing Arts Centre NSW 490 5 10% 90 Ipswich Civic Centre QLD Negotiable 495 165 3 NA 55 495 Joan Sutherland Performing Arts Centre
NSW NA NA NA NA NA 110 NA
Judith Wright Centre of Contemporary Arts
QLD 1,350 425 185
Mandurah Performing Arts Centre WA 770 NA 135 Melbourne Theatre Company VIC 5,500 1,100 550 6 1,100 Mildura Arts Centre VIC 115 115 NIDA Parade Theatres NSW 3,000 850 600 Queens Park Theatre WA 180 Redland Performing Arts Centre QLD 172 10 22 172 Riverside Theatres Parramatta NSW 6,429 1,356 1,356 4 10-30% NA 1,356 Shoalhaven Entertainment Centre NSW NA 470 235 4 NA NA 470 Street Theatre ACT Negotiable The Glasshouse Port Macquarie NSW 216 4 The Hopgood Theatre SA 260 4 per 4 hours 260 Theatre Royal TAS 990 250 110
Capacity Venue –
Secondary Performance Space State Commercial Hire (Package Rate) Commercial Hire
(Rehearsal Rate) Per
week Per day Per
session
Hours per
session
Vs % of Net Box Office
Per Hour Per Day
500 to 999
seats
Bathurst Memorial Entertainment Centre
NSW 697 396 4 10% 96 396
Burnie Arts and Function Centre TAS 364 30 Canberra Theatre Centre ACT Dubbo Regional Theatre and Convention Centre
NSW 0 1035 0 8 0 80 517
Orange Civic Theatre NSW Seymour Centre NSW Negotiable Negotiable Negotiable Negotiable
University Theatres - University of Western Australia
WA
Over 1,000 seats
Mackay Entertainment & Convention Centre
QLD
NA 7,000 4,660 Day & Evening
10% Discretional Discretional
Community Hire Rates – Tertiary venue Capacity Venue –
Tertiary Performance Space State Commercial Hire (Package Rate) Commercial Hire
(Rehearsal Rate) Per
week Per day Per
session Hours
per session
Vs % of Net Box Office
Per Hour Per Day
Under 500
seats
Bathurst Memorial Entertainment Centre NSW
208 110 4 NA 52 208
Capitol Venues and Events VIC 605 5 56 Empire Theatre QLD 630 10% 630
357

2015 Venue Charges and Salaries Report
26
Illawarra Performing Arts Centre NSW 255 5 10% 40 Joan Sutherland Performing Arts Centre NSW NA NA NA NA NA 66 NA Redland Performing Arts Centre QLD 273 10% 28 273 Riverside Theatres Parramatta NSW 5,001 1,035 1,035 4 10-30% NA 1,035 Seymour Centre NSW Negotiable Negotiable Negotiable Negotiable
Street Theatre ACT Negotiable The Glasshouse Port Macquarie NSW 210 105 4
1,000 to
1,999 Geelong Performing Arts Centre
VIC
2,859 1,141 2,859
Community Rates – Additional Spaces Capacity Venue –
Tertiary Performance Space State Commercial Hire (Package Rate) Commercial Hire
(Rehearsal Rate) Per
week Per day Per
session Hours
per session
Vs % of Net Box Office
Per Hour Per Day
Under 500
seats
Bathurst Memorial Entertainment Centre
NSW 312 156 4 N/A N/A 312
Capitol Venues and Events VIC 642 115 75 4 0 0 115 Empire Theatre QLD 550 10 550 Seymour Centre NSW Negotiable Negotiable Negotiable Negotiable
1,000 to
1,999
Illawarra Performing Arts Centre
NSW
1500 5 10 150
Hire Package Inclusions There is very little difference between commercial and community hire package inclusions. Most packages have similar inclusions for both commercial and community hirers. Differences are seen in the inclusion of duty managers and technical staff for community hirers. The following chart shows the percentage of respondents that include each specific charge within their overall hire fee.
Figure 27: Hire Package Inclusions – Commercial –v- Community
0% 10% 20% 30% 40% 50% 60% 70% 80% 90%
100%
Commercial & Community Package Inclusions (n=65)
Hires
Community
358

2015 Venue Charges and Salaries Report
27
Almost one-third of venues respondents (72%) provide basic marketing advice to hirers of the venue at no additional charge. This result is a significant change from the 2013 survey where 54% of venues provided this support at no additional cost.
Figure 28: Marketing Services for Hirers The treatment of cleaning charges has changed between 1%-5% for most categories allowing for a doubling of the percentage of venues (from 7% in 2013 to 14% in 2015) charging cleaning at a flat rate of between $150 and $300.
Figure 29: Cleaning Charges
Not provided by the venue
3% Charged at an
hourly rate 16%
Charges as % paid
advertising 9%
Basic advice at no
additional cost 72%
Marketing Support to Hirers (n=65)
Not charged 29%
Charged at a flat rate < $150 5%
Charged at a flat rate $150-
$300 14%
Charged at a flat rate >$$300
5%
Charged at an hourly rate
12%
Charged in extraordinary circumstances
at an hourly rate 35%
Cleaning Charges (n=65)
359

2015 Venue Charges and Salaries Report
28
Staff Charge Out and Minimum Staffing The following tables are set out by state rather than audience capacity as hirer and owner comparisons are often made in a geographical area. Further, a number of centres use state industrial awards, making comparison based on jurisdiction more appropriate.
360

2015 Venue Charges and Salaries Report
29
Staff Charge Out Rates Venue State Duty Manager Usher Merch Seller Box Office Stage Door
Rate $/hr Min.Call Rate $/hr Min.Call Rate $/hr Min.Call Rate $/hr Min.Call Rate $/hr Min.Call Canberra Theatre Centre ACT $60-
$64.90 4 hrs $35-
$39.90 4 hrs $35-
$39.90 4 hrs $45-
$49.90 4 hrs $35-
$39.90 4 hrs
Street Theatre ACT $35-$39.90
4 hrs $20-$24.90
4 hrs $30-$34.90
4 hrs
Albury Entertainment Centre NSW $30-$34.90
3 hrs $30-$34.90
3 hrs $35-$39.90
2 hrs
Bathurst Memorial Entertainment Centre
NSW $40-$44.90
1 hr <$20 1 hr $40-$44.90
1 hr $40-$44.90
1 hr
City Recital Hall Angel Place NSW $50-$54.90
3 hrs $40-$44.90
3 hrs $40-$44.90
3 hrs $40-$44.90
3 hrs $40-$44.90
4 hrs
Dubbo Regional Theatre and Convention Centre
NSW $25-$29.90
3 hrs $25-$29.90
3 hrs $55-$59.90
3 hrs
Griffith Regional Theatre NSW $45-$49.90
3 hrs $40-$44.90
2 hrs $40-$44.90
2 hrs
Illawarra Performing Arts Centre NSW $45-$49.90
3 hrs $35-$39.90
3 hrs $35-$39.90
3 hrs $40-$44.90
3 hrs
Joan Sutherland Performing Arts Centre
NSW $40-$44.90
3 hrs $35-$39.90
3 hrs $35-$39.90
3 hrs $35-$39.90
3 hrs $35-$39.90
3 hrs
Manning Entertainment Centre NSW $40-$44.90
4 hrs $40-$44.90
3 hrs $40-$44.90
3 hrs
Monkey Baa Theatre Company NSW $35-$39.90
4 hrs $35-$39.90
4 hrs $35-$39.90
3 hrs $35-$39.90
4 hrs $35-$39.90
4 hrs
NIDA Parade Theatres NSW $35-$39.90
3 hrs $35-$39.90
3 hrs $35-$39.90
3 hrs $35-$39.90
3 hrs $35-$39.90
3 hrs
Orange Civic Theatre NSW $30-$34.90
2 hrs
Riverside Theatres Parramatta NSW $45-$49.90
4 hrs $45-$49.90
4 hrs $45-$49.90
4 hrs $45-$49.90
4 hrs
Seymour Centre NSW $30-$34.90
4 hrs
Shoalhaven Entertainment Centre NSW $55-$59.90
2 hrs $55-$59.90
2 hrs $55-$59.90
1 hr $55-$59.90
2 hrs $55-$59.90
3 hrs
The Glasshouse Port Macquarie NSW $50-$54.90
3 hrs $45-$49.90
3 hrs $45-$49.90
3 hrs
Wagga Wagga Civic Theatre NSW $45-$49.90
3 hrs $35-$39.90
3 hrs $35-$39.90
3 hrs $35-$39.90
3 hrs
BEMAC - Brisbane Multicultural Arts Centre
QLD $25-$29.90
4 hrs $20-$24.90
4 hrs $20-$24.90
4 hrs $25-$29.90
4 hrs $20-$24.90
4 hrs
Brisbane Powerhouse QLD $40-$44.90
4 hrs $35-$39.90
4 hrs $40-$44.90
4 hrs $40-$44.90
4 hrs
Brolga Theatre QLD $50-$54.90
4 hrs
Cairns Civic Theatre QLD $50-$54.90
3 hrs $40-$44.90
3 hrs $40-$44.90
3 hrs $45-$49.90
3 hrs $55-$59.90
3 hrs
Empire Theatre QLD $50-$54.90
$50-$54.90
Gladstone Entertainment Convention Centre
QLD $55-$59.90
3 hrs > $65 1 hr $55-$59.90
3 hrs $55-$59.90
3 hrs
Judith Wright Centre of Contemporary Arts
QLD $45-$49.90
4 hrs $45-$49.90
3 hrs $45-$49.90
3 hrs $45-$49.90
3 hrs
Lake Kawana Community Centre QLD $45-$49.90
3 hrs $45-$49.90
3 hrs $45-$49.90
3 hrs $45-$49.90
3 hrs $45-$49.90
3 hrs
Mackay Entertainment & Convention Centre
QLD $55-$59.90
2 hrs $55-$59.90
2 hrs $55-$59.90
2 hrs $55-$59.90
2 hrs
Pilbeam Theatre QLD $60-$64.90
3 hrs $45-$49.90
3 hrs
QUT Gardens Theatre QLD $55-$59.90
3 hrs $45-$49.90
3 hrs $45-$49.90
3 hrs $45-$49.90
3 hrs
Redland Performing Arts Centre QLD $50-$54.90
3 hrs $35-$39.90
3 hrs $35-$39.90
3 hrs
361

2015 Venue Charges and Salaries Report
30
Venue State Duty Manager Usher Merch Seller Box Office Stage Door
Rate $/hr Min.Call Rate $/hr Min.Call Rate $/hr Min.Call Rate $/hr Min.Call Rate $/hr Min.Call The Events Centre QLD $50-
$54.90 2 hrs $50-
$54.90 2 hrs $50-
$54.90 2 hrs $50-
$54.90 2 hrs $50-
$54.90 2 hrs
Barossa Arts & Convention Centre SA $45-$49.90
1 hr <$20 1 hr $45-$49.90
1 hr <$20 1 hr <$20 1 hr
Marion Cultural Centre SA $50-$54.90
3 hrs $50-$54.90
3 hrs $50-$54.90
3 hrs $50-$54.90
3 hrs $50-$54.90
3 hrs
The Hopgood Theatre SA $45-$49.90
3 hrs $35-$39.90
3 hrs $35-$39.90
3 hrs $30-$34.90
3 hrs $35-$39.90
3 hrs
Burnie Arts and Function Centre TAS $40-$44.90
3 hrs $40-$44.90
2 hrs $40-$44.90
2 hrs $40-$44.90
2 hrs $40-$44.90
2 hrs
Devonport Entertainment and Convention Centre
TAS $35-$39.90
3 hrs $35-$39.90
3 hrs $35-$39.90
3 hrs $35-$39.90
3 hrs $35-$39.90
3 hrs
Theatre Royal TAS $35-$39.90
3 hrs $35-$39.90
3 hrs $35-$39.90
3 hrs
Arts Centre Melbourne VIC $35-$39.90
4 hrs $25-$29.90
3 hrs $25-$29.90
3 hrs
Capitol Venues and Events VIC $45-$49.90
3 hrs $45-$49.90
3 hrs $45-$49.90
3 hrs $45-$49.90
3 hrs $45-$49.90
3 hrs
Clocktower Centre VIC $55-$59.90
4 hrs $50-$54.90
4 hrs $50-$54.90
4 hrs
Colac Otway Performing Arts and Cultural Centre
VIC $60-$64.90
3 hrs $60-$64.90
3 hrs $60-$64.90
3 hrs
Eastbank Centre - Riverlinks Venues VIC $45-$49.90
4 hrs $40-$44.90
3 hrs $40-$44.90
2 hrs
Frankston Arts Centre VIC $55-$59.90
3 hrs $45-$49.90
3 hrs $45-$49.90
3 hrs
Geelong Performing Arts Centre VIC $40-$44.90
3 hrs $35-$39.90
3 hrs $25-$29.90
$40-$44.90
3 hrs $35-$39.90
3 hrs
Her Majesty's Theatre VIC $45-$49.90
2 hrs $40-$44.90
2 hrs $40-$44.90
2 hrs $45-$49.90
2 hrs $40-$44.90
2 hrs
Karralyka Centre VIC $40-$44.90
3 hrs $40-$44.90
2 hrs $40-$44.90
2 hrs $40-$44.90
2 hrs
Melbourne Theatre Company VIC $40-$44.90
4 hrs $35-$39.90
3 hrs $35-$39.90
3 hrs
Mildura Arts Centre VIC $55-$59.90
$45-$49.90
3 hrs $45-$49.90
3 hrs $45-$49.90
3 hrs $45-$49.90
3 hrs
Monash University Academy of Performing Arts
VIC $50-$54.90
3 hrs $40-$44.90
2 hrs $40-$44.90
2 hrs $50-$54.90
3 hrs $45-$49.90
3 hrs
Portland Arts Centre VIC $35-$39.90
1 hr $35-$39.90
1 hr $35-$39.90
1 hr $35-$39.90
1 hr
The Cube Wodonga VIC $45-$49.90
3 hrs $40-$44.90
2 hrs $40-$44.90
2 hrs $40-$44.90
2 hrs $40-$44.90
2 hrs
West Gippsland Arts Centre VIC $50-$54.90
3 hrs $45-$49.90
3 hrs $45-$49.90
3 hrs
Whitehorse Performing Arts Centre VIC $35-$39.90
4 hrs $35-$39.90
1 hr
Broome Civic Centre [Shire of Broome] WA > $65 1 hr > $65 1 hr > $65 1 hr > $65 1 hr > $65 1 hr Bunbury Regional Entertainment Centre
WA $55-$59.90
4 hrs $55-$59.90
1 hr
Don Russell Performing Arts Centre WA $40-$44.90
3 hrs $35-$39.90
3 hrs
Esperance Civic Centre WA $55-$59.90
2 hrs $55-$59.90
2 hrs
His Majesty's Theatre WA $50-$54.90
4 hrs $35-$39.90
4 hrs $35-$39.90
4 hrs $40-$44.90
4 hrs
Mandurah Performing Arts Centre WA $45-$49.90
4 hrs $35-$39.90
3 hrs
362

2015 Venue Charges and Salaries Report
31
Venue State Duty Manager Usher Merch Seller Box Office Stage Door
Rate $/hr Min.Call Rate $/hr Min.Call Rate $/hr Min.Call Rate $/hr Min.Call Rate $/hr Min.Call Matt Dann Theatre & Cinema WA $50-
$54.90 1 hr $50-
$54.90 1 hr $50-
$54.90 1 hr $50-
$54.90 1 hr $50-
$54.90 1 hr
Queens Park Theatre WA $45-$49.90
3 hrs $35-$39.90
3 hrs $35-$39.90
3 hrs $35-$39.90
3 hrs $35-$39.90
3 hrs
University Theatres - University of Western Australia
WA $45-$49.90
4 hrs $35-$39.90
4 hrs $35-$39.90
4 hrs $35-$39.90
4 hrs
Minimum Staffing Levels Venue State Minimum FOH Staffing Levels NOT included in Hire Charges
Theatre Performances Unticketed Events Duty
Manager Ushers Ticket
Seller Stage Door
Duty Manager
Ushers Ticket Seller
Stage Door
Canberra Theatre Centre ACT 1 8 2 1 1 8 - 1 Street Theatre ACT 1 2 1 2 Albury Entertainment Centre NSW 1 4 1 1 4 1 Bathurst Memorial Entertainment Centre NSW 1 3 1 - 1 2 - - City Recital Hall Angel Place NSW 1 >8 1 1 4 1 Dubbo Regional Theatre and Convention Centre
NSW 4 1
Griffith Regional Theatre NSW 1 2 1 1 Illawarra Performing Arts Centre NSW 1 2 1 2 Joan Sutherland Performing Arts Centre NSW 1 2 1 - 1 1 - - Manning Entertainment Centre NSW 1 8 1 - 1 2 - - Monkey Baa Theatre Company NSW 1 1 1 1 NIDA Parade Theatres NSW 1 6 1 1 1 6 - 1 Riverside Theatres Parramatta NSW 1 2 1 1 2 1 Seymour Centre NSW 1 4 2 1 1 4 1 Shoalhaven Entertainment Centre NSW 1 2 1 1 1 1 - 1 The Glasshouse Port Macquarie NSW 1 4 1 Wagga Wagga Civic Theatre NSW 1 3 - - 1 - BEMAC - Brisbane Multicultural Arts Centre QLD - 2 1 >1 - - - - Brolga Theatre QLD 1 4 1 >1 1 4 - >1 Cairns Civic Theatre QLD 1 2 1 - 1 2 - - Empire Theatre QLD 1 6 1 1 6 1 Gladstone Entertainment Convention Centre QLD 1 1 1 - 1 1 - - Judith Wright Centre of Contemporary Arts QLD 1 1 1 1 1 Lake Kawana Community Centre QLD 1 3 1 - 1 3 - - Mackay Entertainment & Convention Centre QLD 1 2 1 - 1 2 - - Pilbeam Theatre QLD 1 4 1 - 1 2 - - QUT Gardens Theatre QLD 1 2 1 - 1 - - - Redland Performing Arts Centre QLD 1 4 1 4 The Events Centre QLD 1 2 1 1 1 Barossa Arts & Convention Centre SA 1 - - - 1 - - Marion Cultural Centre SA 1 1 The Hopgood Theatre SA 1 3 - >1 1 2 - >1 Burnie Arts and Function Centre TAS 1 2 1 - 1 1 - - Devonport Entertainment and Convention Centre
TAS 1 3 1 1 1 3 1 1
Theatre Royal TAS 1 4 1 4 Arts Centre Melbourne VIC 1 >8 Capitol Venues and Events VIC 1 - 1 - 1 - - - Clocktower Centre VIC 1 4 - - 1 4 - - Colac Otway Performing Arts and Cultural Centre
VIC 1 1 1
Eastbank Centre - Riverlinks Venues VIC 1 4 1 1 4 Frankston Arts Centre VIC 1 1 1 1 1
363
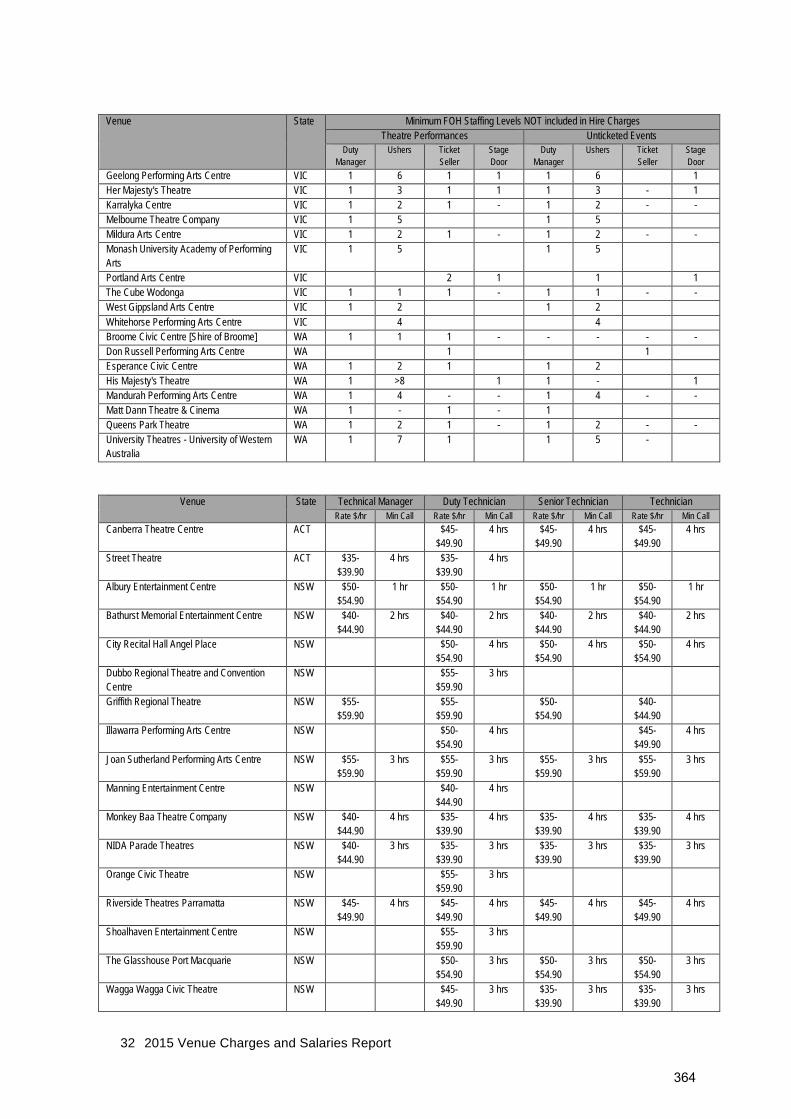
2015 Venue Charges and Salaries Report
32
Venue State Minimum FOH Staffing Levels NOT included in Hire Charges
Theatre Performances Unticketed Events Duty
Manager Ushers Ticket
Seller Stage Door
Duty Manager
Ushers Ticket Seller
Stage Door
Geelong Performing Arts Centre VIC 1 6 1 1 1 6 1 Her Majesty's Theatre VIC 1 3 1 1 1 3 - 1 Karralyka Centre VIC 1 2 1 - 1 2 - - Melbourne Theatre Company VIC 1 5 1 5 Mildura Arts Centre VIC 1 2 1 - 1 2 - - Monash University Academy of Performing Arts
VIC 1 5 1 5
Portland Arts Centre VIC 2 1 1 1 The Cube Wodonga VIC 1 1 1 - 1 1 - - West Gippsland Arts Centre VIC 1 2 1 2 Whitehorse Performing Arts Centre VIC 4 4 Broome Civic Centre [Shire of Broome] WA 1 1 1 - - - - - Don Russell Performing Arts Centre WA 1 1 Esperance Civic Centre WA 1 2 1 1 2 His Majesty's Theatre WA 1 >8 1 1 - 1 Mandurah Performing Arts Centre WA 1 4 - - 1 4 - - Matt Dann Theatre & Cinema WA 1 - 1 - 1 Queens Park Theatre WA 1 2 1 - 1 2 - - University Theatres - University of Western Australia
WA 1 7 1 1 5 -
Venue State Technical Manager Duty Technician Senior Technician Technician
Rate $/hr Min Call Rate $/hr Min Call Rate $/hr Min Call Rate $/hr Min Call Canberra Theatre Centre ACT $45-
$49.90 4 hrs $45-
$49.90 4 hrs $45-
$49.90 4 hrs
Street Theatre ACT $35-$39.90
4 hrs $35-$39.90
4 hrs
Albury Entertainment Centre NSW $50-$54.90
1 hr $50-$54.90
1 hr $50-$54.90
1 hr $50-$54.90
1 hr
Bathurst Memorial Entertainment Centre NSW $40-$44.90
2 hrs $40-$44.90
2 hrs $40-$44.90
2 hrs $40-$44.90
2 hrs
City Recital Hall Angel Place NSW $50-$54.90
4 hrs $50-$54.90
4 hrs $50-$54.90
4 hrs
Dubbo Regional Theatre and Convention Centre
NSW $55-$59.90
3 hrs
Griffith Regional Theatre NSW $55-$59.90
$55-$59.90
$50-$54.90
$40-$44.90
Illawarra Performing Arts Centre NSW $50-$54.90
4 hrs $45-$49.90
4 hrs
Joan Sutherland Performing Arts Centre NSW $55-$59.90
3 hrs $55-$59.90
3 hrs $55-$59.90
3 hrs $55-$59.90
3 hrs
Manning Entertainment Centre NSW $40-$44.90
4 hrs
Monkey Baa Theatre Company NSW $40-$44.90
4 hrs $35-$39.90
4 hrs $35-$39.90
4 hrs $35-$39.90
4 hrs
NIDA Parade Theatres NSW $40-$44.90
3 hrs $35-$39.90
3 hrs $35-$39.90
3 hrs $35-$39.90
3 hrs
Orange Civic Theatre NSW $55-$59.90
3 hrs
Riverside Theatres Parramatta NSW $45-$49.90
4 hrs $45-$49.90
4 hrs $45-$49.90
4 hrs $45-$49.90
4 hrs
Shoalhaven Entertainment Centre NSW $55-$59.90
3 hrs
The Glasshouse Port Macquarie NSW $50-$54.90
3 hrs $50-$54.90
3 hrs $50-$54.90
3 hrs
Wagga Wagga Civic Theatre NSW $45-$49.90
3 hrs $35-$39.90
3 hrs $35-$39.90
3 hrs
364

2015 Venue Charges and Salaries Report
33
Venue State Technical Manager Duty Technician Senior Technician Technician Rate $/hr Min Call Rate $/hr Min Call Rate $/hr Min Call Rate $/hr Min Call
BEMAC - Brisbane Multicultural Arts Centre QLD $45-$49.90
4 hrs $45-$49.90
4 hrs $50-$54.90
4 hrs $45-$49.90
4 hrs
Brisbane Powerhouse QLD 4 hrs 4 hrs 4 hrs 4 hrs Brolga Theatre QLD $50-
$54.90
Cairns Civic Theatre QLD $55-$59.90
3 hrs
Empire Theatre QLD $50-$54.90
$50-$54.90
$50-$54.90
$50-$54.90
Gladstone Entertainment Convention Centre QLD $55-$59.90
3 hrs $55-$59.90
3 hrs $55-$59.90
3 hrs $55-$59.90
3 hrs
Judith Wright Centre of Contemporary Arts QLD $45-$49.90
4 hrs $45-$49.90
4 hrs $45-$49.90
4 hrs
Lake Kawana Community Centre QLD $45-$49.90
3 hrs $45-$49.90
3 hrs $45-$49.90
3 hrs $45-$49.90
3 hrs
Lake Kawana Community Centre QLD 3 hrs 3 hrs 3 hrs 3 hrs Mackay Entertainment & Convention Centre QLD $55-
$59.90 2 hrs $55-
$59.90 2 hrs $55-
$59.90 2 hrs $55-
$59.90 2 hrs
Pilbeam Theatre QLD $60-$64.90
3 hrs $60-$64.90
3 hrs $60-$64.90
3 hrs $60-$64.90
3 hrs
QUT Gardens Theatre QLD > $65 1 hr $60-$64.90
3 hrs $55-$59.90
3 hrs $45-$49.90
3 hrs
Redland Performing Arts Centre QLD $50-$54.90
3 hrs $50-$54.90
3 hrs $50-$54.90
3 hrs
The Events Centre QLD $50-$54.90
2 hrs $50-$54.90
2 hrs $50-$54.90
2 hrs $50-$54.90
2 hrs
Barossa Arts & Convention Centre SA $60-$64.90
1 hr
Marion Cultural Centre SA $50-$54.90
3 hrs
Playford Civic Centre SA $40-$44.90
3 hrs $40-$44.90
3 hrs
The Hopgood Theatre SA $50-$54.90
1 hr $40-$44.90
3 hrs $45-$49.90
3 hrs $30-$34.90
3 hrs
Burnie Arts and Function Centre TAS $45-$49.90
2 hrs $45-$49.90
2 hrs $45-$49.90
2 hrs $45-$49.90
2 hrs
Devonport Entertainment and Convention Centre
TAS $40-$44.90
3 hrs $35-$39.90
3 hrs
Theatre Royal TAS $40-$44.90
3 hrs $40-$44.90
3 hrs $40-$44.90
3 hrs $40-$44.90
3 hrs
Arts Centre Melbourne VIC $50-$54.90
4 hrs $45-$49.90
4 hrs $45-$49.90
4 hrs $40-$44.90
4 hrs
Capitol Venues and Events VIC $45-$49.90
3 hrs
Clocktower Centre VIC $55-$59.90
4 hrs $50-$54.90
4 hrs
Colac Otway Performing Arts and Cultural Centre
VIC $60-$64.90
3 hrs $60-$64.90
3 hrs $60-$64.90
3 hrs $60-$64.90
3 hrs
Eastbank Centre - Riverlinks Venues VIC $45-$49.90
4 hrs $45-$49.90
4 hrs $45-$49.90
4 hrs $45-$49.90
4 hrs
Frankston Arts Centre VIC $55-$59.90
3 hrs $55-$59.90
3 hrs $55-$59.90
3 hrs $55-$59.90
3 hrs
Geelong Performing Arts Centre VIC $40-$44.90
3 hrs
Her Majesty's Theatre VIC $50-$54.90
3 hrs $45-$49.90
3 hrs $45-$49.90
3 hrs $40-$44.90
3 hrs
Karralyka Centre VIC $40-$44.90
3 hrs $40-$44.90
2 hrs $40-$44.90
2 hrs $40-$44.90
2 hrs
Melbourne Theatre Company VIC $50-$54.90
4 hrs $50-$54.90
4 hrs $45-$49.90
4 hrs
Mildura Arts Centre VIC $55-$59.90
3 hrs
365

2015 Venue Charges and Salaries Report
34
Venue State Technical Manager Duty Technician Senior Technician Technician Rate $/hr Min Call Rate $/hr Min Call Rate $/hr Min Call Rate $/hr Min Call
Monash University Academy of Performing Arts
VIC $50-$54.90
3 hrs $50-$54.90
3 hrs $55-$59.90
3 hrs $50-$54.90
3 hrs
Portland Arts Centre VIC $40-$44.90
1 hr
The Cube Wodonga VIC $45-$49.90
2 hrs $45-$49.90
3 hrs $45-$49.90
2 hrs $45-$49.90
2 hrs
West Gippsland Arts Centre VIC $50-$54.90
3 hrs $50-$54.90
3 hrs $50-$54.90
3 hrs $45-$49.90
3 hrs
Whitehorse Performing Arts Centre VIC $45-$49.90
4 hrs $35-$39.90
4 hrs
Broome Civic Centre [Shire of Broome] WA > $65 1 hr > $65 1 hr > $65 1 hr > $65 1 hr Bunbury Regional Entertainment Centre WA $55-
$59.90 4 hrs $55-
$59.90 4 hrs $55-
$59.90 4 hrs
Don Russell Performing Arts Centre WA $40-$44.90
3 hrs $40-$44.90
3 hrs
Esperance Civic Centre WA $55-$59.90
4 hrs
His Majesty's Theatre WA $50-$54.90
4 hrs $40-$44.90
4 hrs
Mandurah Performing Arts Centre WA $45-$49.90
3 hrs $45-$49.90
3 hrs
Matt Dann Theatre & Cinema WA > $65 1 hr $50-$54.90
1 hr $50-$54.90
1 hr $50-$54.90
1 hr
Queens Park Theatre WA $35-$39.90
3 hrs $35-$39.90
3 hrs $45-$49.90
1 hr $35-$39.90
3 hrs
University Theatres - University of Western Australia
WA $60-$64.90
4 hrs $50-$54.90
4 hrs $50-$54.90
4 hrs $40-$44.90
4 hrs
Venue State Min. Production Staff for Events per Performance Overtime Penalties Theatre Performances Unticketed event Included Extra
Canberra Theatre Centre ACT 1 per department 1 per department ✓ Street Theatre ACT 1 1 ✓ Albury Entertainment Centre NSW 2 2 ✓ Bathurst Memorial Entertainment Centre NSW 1 1 ✓ City Recital Hall Angel Place NSW 2 2 ✓ Dubbo Regional Theatre and Convention Centre NSW 1 per department 1 but included in base hire ✓ Griffith Regional Theatre NSW 1 but included in
base hire 1 but included in base hire ✓
Illawarra Performing Arts Centre NSW 1 per department 1 per department ✓ Joan Sutherland Performing Arts Centre NSW 1 per department 1 per department ✓ Manning Entertainment Centre NSW 1 per department 1 per department ✓ Monkey Baa Theatre Company NSW 1 but included in
base hire 1 but included in base hire ✓
NIDA Parade Theatres NSW 1 per department 1 per department ✓ Orange Civic Theatre NSW 1 but included in
base hire 1 but included in base hire ✓
Riverside Theatres Parramatta NSW 1 per department 1 per department ✓ Seymour Centre NSW 1 but included in
base hire 1 but included in base hire ✓
Shoalhaven Entertainment Centre NSW 1 per department 1 per department ✓ The Glasshouse Port Macquarie NSW 1 but included in
base hire - ✓
Wagga Wagga Civic Theatre NSW 2 1 ✓ BEMAC - Brisbane Multicultural Arts Centre QLD 1 per department 1 per department ✓ Brisbane Powerhouse QLD 1 per department 1 per department ✓ Brolga Theatre QLD 1 but included in
base hire 1 but included in base hire ✓
Cairns Civic Theatre QLD 1 1 ✓ Empire Theatre QLD 1 1 ✓
366

2015 Venue Charges and Salaries Report
35
Venue State Min. Production Staff for Events per Performance Overtime Penalties Theatre Performances Unticketed event Included Extra
Gladstone Entertainment Convention Centre QLD 1 1 ✓ Judith Wright Centre of Contemporary Arts QLD 3 2 ✓ Lake Kawana Community Centre QLD 4 2 ✓ Mackay Entertainment & Convention Centre QLD 1 but included in
base hire 1 but included in base hire ✓
Pilbeam Theatre QLD 1 1 ✓ QUT Gardens Theatre QLD 1 per department 1 per department ✓ Redland Performing Arts Centre QLD 3 3 ✓ The Events Centre QLD 2 2 ✓ Barossa Arts & Convention Centre SA 1 1 ✓ Marion Cultural Centre SA 1 but included in
base hire 1 but included in base hire ✓
Playford Civic Centre SA 1 but included in base hire ✓
The Hopgood Theatre SA 1 but included in base hire 1 but included in base hire
✓
Burnie Arts and Function Centre TAS 1 1 ✓ Devonport Entertainment and Convention Centre TAS 1 1 ✓ Theatre Royal TAS 2 2 ✓ Arts Centre Melbourne VIC > 4 ✓ Capitol Venues and Events VIC 1 per department 1 per department ✓ Clocktower Centre VIC 2 2 ✓ Colac Otway Performing Arts and Cultural Centre VIC 1 but included in
base hire 1 but included in base hire ✓
Eastbank Centre - Riverlinks Venues VIC 1 but included in base hire 1 but included in base hire ✓
Frankston Arts Centre VIC 1 but included in base hire 1 but included in base hire
✓
Geelong Performing Arts Centre VIC 3 3 ✓ Her Majesty's Theatre VIC 1 per department 1 per department ✓ Karralyka Centre VIC 2 2 ✓ Melbourne Theatre Company VIC 1 per department 1 per department ✓ Mildura Arts Centre VIC 1 1 ✓ Monash University Academy of Performing Arts VIC 3 3 ✓ Portland Arts Centre VIC 1 1 ✓ The Cube Wodonga VIC 1 but included in
base hire 1 but included in base hire ✓
West Gippsland Arts Centre VIC 1 per department 1 per department ✓ Whitehorse Performing Arts Centre VIC 1 1 ✓ Broome Civic Centre [Shire of Broome] WA 1 1 ✓ Bunbury Regional Entertainment Centre WA 2 2 ✓ Don Russell Performing Arts Centre WA 1 per department 1 ✓ Esperance Civic Centre WA 1 but included in
base hire 1 but included in base hire ✓
His Majesty's Theatre WA 1 per department 1 per department ✓ Mandurah Performing Arts Centre WA 2 2 ✓ Matt Dann Theatre & Cinema WA 1 per department 1 per department ✓ Queens Park Theatre WA 1 per department 1 per department ✓ University Theatres - University of Western Australia WA 1 per department 1 per department ✓
367

2015 Venue Charges and Salaries Report
36
Ticketing Operations There is an increase in the options available to respondent venues to source software and external agencies to provide ticketing operations. In 2013, the most popular systems were reported as Provenue/Tickets.com at 35% and SABO/Seat Advisor at 36%. The 2015 results show an increase by 2.2% in use of SABO/Seat Advisor and a reduction by over half for ProVenue/Tickets.com to 15.8%. New entrants to this market include TicketServ, PatronBase and Try Booking. About 20% of respondents reported using multiple systems with a primary system for program inventory and secondary systems also available at their box office. Approximately one sixth of respondents (15.7%) use external agencies.
Figure 30: Ticketing Systems used by Respondents
Most respondents (74.6%) have two or more points-of-sale in their box office with almost half (46%) operating with two points-of-sale for ticketing (Figure 31). 17.2% of venues reported using external box office outlets and of these, 58% have only one outlet with the remainder operating with up to 4 external outlets.
Ticketek 10.5%
Bass 1.3%
TicketServ 3.9% Enta
10.5%
Manual 1.3%
Tessitura 6.6%
Try Booking 2.6%
TicketMaster 3.9%
PatronBase 2.6%
SABO/Seat Adviser 38.2%
ProVenue/Tickets.com
15.8%
Other 2.6%
Ticketing Systems (n=63)
368

2015 Venue Charges and Salaries Report
37
Figure 31: Points-of-Sale per Venue
The following charts allow centres to benchmark their sales channels usage. The charts show the percentage of respondents on the y-axis and the level of usage for each sales channel on the x-axis. Almost 97% of venues report using all three sales channels, telephone, counter and on-line in their box office. Since 2013, the use of on-line channels for sales has increased significantly over sales via telephone and counter.
Figure 32: Frequency of Sales Channel Usage (on-line, telephone & counter sales)
0.0%
5.0%
10.0%
15.0%
20.0%
25.0%
30.0%
35.0%
40.0%
45.0%
50.0%
1 POS 2 POS 3 POS 4 POS 5+ POS
Points-of-Sale per Venue (n=63)
0%
10%
20%
30%
40%
50%
60%
70%
80%
% o
f Res
pond
ents
% of Sales
Frequency of Sales Channel Usage (n=59)
On-line
Telephone
Counter Sales
369

2015 Venue Charges and Salaries Report
38
Figure 33 provides sales channels used externally by nine respondent venues. “External Agency” refers to sales through a third party in another location, while “Outlet” refers to a box office run by the venue at another location.
Figure 33: Frequency of Usage for External Sales Channels
Ticketing Charges Centres deal with ticketing fees in a range of ways as the following charts and tables demonstrate. In terms of event builds, 41% of respondents reported they charge a fee to build a new event in their ticketing software and 22% charge to edit an event already on sale. Most charge a fee between $40 and $100 with 63.3% charging per performance while 36.7% charge per event for this service. Figure 34 shows how respondents charge for card merchant fees.
Figure 34: Card Merchant Fee Payment
0% 10% 20% 30% 40% 50% 60% 70% 80% 90%
100%
% o
f Res
pond
ents
% of Sales
Frequency of Sales Channel Usage (n=9)
Outlet
External Agency
0%
10%
20%
30%
40%
50%
60%
70%
Credit Cards (n=63) Debit Cards (n=61) Paypal (n=18)
Card Merchant Fee Payment
Hirer
Patron
Inc in BO Fee
370
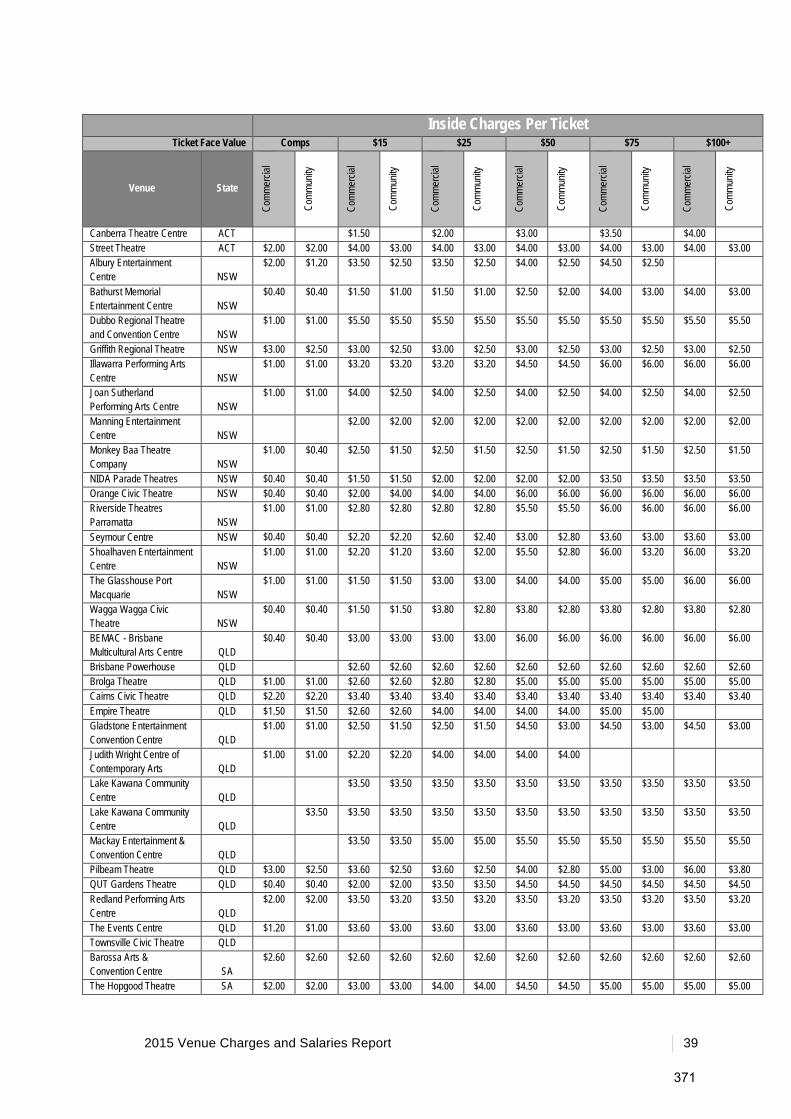
2015 Venue Charges and Salaries Report
39
Inside Charges Per Ticket Ticket Face Value Comps $15 $25 $50 $75 $100+
Venue State
Comm
ercia
l
Comm
unity
Comm
ercia
l
Comm
unity
Comm
ercia
l
Comm
unity
Comm
ercia
l
Comm
unity
Comm
ercia
l
Comm
unity
Comm
ercia
l
Comm
unity
Canberra Theatre Centre ACT $1.50 $2.00 $3.00 $3.50 $4.00 Street Theatre ACT $2.00 $2.00 $4.00 $3.00 $4.00 $3.00 $4.00 $3.00 $4.00 $3.00 $4.00 $3.00 Albury Entertainment Centre NSW
$2.00 $1.20 $3.50 $2.50 $3.50 $2.50 $4.00 $2.50 $4.50 $2.50
Bathurst Memorial Entertainment Centre NSW
$0.40 $0.40 $1.50 $1.00 $1.50 $1.00 $2.50 $2.00 $4.00 $3.00 $4.00 $3.00
Dubbo Regional Theatre and Convention Centre NSW
$1.00 $1.00 $5.50 $5.50 $5.50 $5.50 $5.50 $5.50 $5.50 $5.50 $5.50 $5.50
Griffith Regional Theatre NSW $3.00 $2.50 $3.00 $2.50 $3.00 $2.50 $3.00 $2.50 $3.00 $2.50 $3.00 $2.50 Illawarra Performing Arts Centre NSW
$1.00 $1.00 $3.20 $3.20 $3.20 $3.20 $4.50 $4.50 $6.00 $6.00 $6.00 $6.00
Joan Sutherland Performing Arts Centre NSW
$1.00 $1.00 $4.00 $2.50 $4.00 $2.50 $4.00 $2.50 $4.00 $2.50 $4.00 $2.50
Manning Entertainment Centre NSW
$2.00 $2.00 $2.00 $2.00 $2.00 $2.00 $2.00 $2.00 $2.00 $2.00
Monkey Baa Theatre Company NSW
$1.00 $0.40 $2.50 $1.50 $2.50 $1.50 $2.50 $1.50 $2.50 $1.50 $2.50 $1.50
NIDA Parade Theatres NSW $0.40 $0.40 $1.50 $1.50 $2.00 $2.00 $2.00 $2.00 $3.50 $3.50 $3.50 $3.50 Orange Civic Theatre NSW $0.40 $0.40 $2.00 $4.00 $4.00 $4.00 $6.00 $6.00 $6.00 $6.00 $6.00 $6.00 Riverside Theatres Parramatta NSW
$1.00 $1.00 $2.80 $2.80 $2.80 $2.80 $5.50 $5.50 $6.00 $6.00 $6.00 $6.00
Seymour Centre NSW $0.40 $0.40 $2.20 $2.20 $2.60 $2.40 $3.00 $2.80 $3.60 $3.00 $3.60 $3.00 Shoalhaven Entertainment Centre NSW
$1.00 $1.00 $2.20 $1.20 $3.60 $2.00 $5.50 $2.80 $6.00 $3.20 $6.00 $3.20
The Glasshouse Port Macquarie NSW
$1.00 $1.00 $1.50 $1.50 $3.00 $3.00 $4.00 $4.00 $5.00 $5.00 $6.00 $6.00
Wagga Wagga Civic Theatre NSW
$0.40 $0.40 $1.50 $1.50 $3.80 $2.80 $3.80 $2.80 $3.80 $2.80 $3.80 $2.80
BEMAC - Brisbane Multicultural Arts Centre QLD
$0.40 $0.40 $3.00 $3.00 $3.00 $3.00 $6.00 $6.00 $6.00 $6.00 $6.00 $6.00
Brisbane Powerhouse QLD $2.60 $2.60 $2.60 $2.60 $2.60 $2.60 $2.60 $2.60 $2.60 $2.60 Brolga Theatre QLD $1.00 $1.00 $2.60 $2.60 $2.80 $2.80 $5.00 $5.00 $5.00 $5.00 $5.00 $5.00 Cairns Civic Theatre QLD $2.20 $2.20 $3.40 $3.40 $3.40 $3.40 $3.40 $3.40 $3.40 $3.40 $3.40 $3.40 Empire Theatre QLD $1.50 $1.50 $2.60 $2.60 $4.00 $4.00 $4.00 $4.00 $5.00 $5.00 Gladstone Entertainment Convention Centre QLD
$1.00 $1.00 $2.50 $1.50 $2.50 $1.50 $4.50 $3.00 $4.50 $3.00 $4.50 $3.00
Judith Wright Centre of Contemporary Arts QLD
$1.00 $1.00 $2.20 $2.20 $4.00 $4.00 $4.00 $4.00
Lake Kawana Community Centre QLD
$3.50 $3.50 $3.50 $3.50 $3.50 $3.50 $3.50 $3.50 $3.50 $3.50
Lake Kawana Community Centre QLD
$3.50 $3.50 $3.50 $3.50 $3.50 $3.50 $3.50 $3.50 $3.50 $3.50 $3.50
Mackay Entertainment & Convention Centre QLD
$3.50 $3.50 $5.00 $5.00 $5.50 $5.50 $5.50 $5.50 $5.50 $5.50
Pilbeam Theatre QLD $3.00 $2.50 $3.60 $2.50 $3.60 $2.50 $4.00 $2.80 $5.00 $3.00 $6.00 $3.80 QUT Gardens Theatre QLD $0.40 $0.40 $2.00 $2.00 $3.50 $3.50 $4.50 $4.50 $4.50 $4.50 $4.50 $4.50 Redland Performing Arts Centre QLD
$2.00 $2.00 $3.50 $3.20 $3.50 $3.20 $3.50 $3.20 $3.50 $3.20 $3.50 $3.20
The Events Centre QLD $1.20 $1.00 $3.60 $3.00 $3.60 $3.00 $3.60 $3.00 $3.60 $3.00 $3.60 $3.00 Townsville Civic Theatre QLD Barossa Arts & Convention Centre SA
$2.60 $2.60 $2.60 $2.60 $2.60 $2.60 $2.60 $2.60 $2.60 $2.60 $2.60 $2.60
The Hopgood Theatre SA $2.00 $2.00 $3.00 $3.00 $4.00 $4.00 $4.50 $4.50 $5.00 $5.00 $5.00 $5.00
371

2015 Venue Charges and Salaries Report
40
Inside Charges Per Ticket Ticket Face Value Comps $15 $25 $50 $75 $100+
Venue State
Comm
ercia
l
Comm
unity
Comm
ercia
l
Comm
unity
Comm
ercia
l
Comm
unity
Comm
ercia
l
Comm
unity
Comm
ercia
l
Comm
unity
Comm
ercia
l
Comm
unity
Burnie Arts and Function Centre TAS
$3.50 $1.00 $3.50 $2.20 $3.50 $3.20 $4.00 $3.20 $4.00 $3.20 $4.00 $3.20
Devonport Entertainment and Convention Centre TAS
$4.00 $2.50 $4.00 $2.50 $4.00 $2.50 $4.00 $2.50 $4.00 $2.50 $4.00 $2.50
Theatre Royal TAS $3.40 $3.40 $4.00 $4.00 $4.50 $4.50 $5.00 $5.00 $5.00 $5.00 Arts Centre Melbourne VIC $2.00 $2.00 $3.00 $3.00 $3.50 $3.50 $5.00 $5.00 $6.00 $6.00 $6.00 $6.00 Capitol Venues and Events VIC
$2.00 $1.00 $4.00 $2.00 $4.00 $2.00 $4.00 $2.00 $4.00 $2.00 $4.00 $2.00
Clocktower Centre VIC $1.00 $1.00 $3.40 $2.40 $3.40 $2.40 $3.40 $2.40 $3.40 $2.40 $3.40 $2.40 Colac Otway Performing Arts and Cultural Centre VIC
$2.80 $1.50 $2.80 $1.50 $2.80 $1.50 $2.80 $1.50 $2.80 $1.50
Eastbank Centre - Riverlinks Venues VIC
$0.40 $0.40 $5.00 $2.50 $5.00 $2.50 $5.00 $2.50 $5.00 $2.50 $5.00 $2.50
Frankston Arts Centre VIC $3.80 $2.20 $3.80 $2.20 $3.80 $2.20 $3.80 $2.20 $3.80 $2.20 $3.80 $2.20 Geelong Performing Arts Centre VIC
$2.20 $2.20 $3.60 $3.00 $3.60 $3.00 $3.60 $3.00 $3.60 $3.00 $3.60 $3.00
Her Majesty's Theatre VIC $1.00 $1.00 $1.50 $1.50 $4.50 $3.20 $4.50 $3.20 $4.50 $3.20 $4.50 $3.20 Karralyka Centre VIC $1.00 $1.00 $4.00 $2.00 $4.00 $2.00 $4.00 $2.00 $4.00 $2.00 $4.00 $2.00 Melbourne Theatre Company VIC
$1.20 $1.20 $2.20 $2.20 $3.50 $3.50 $5.00 $5.00 $5.50 $5.50 $6.00 $6.00
Mildura Arts Centre VIC $4.00 $1.50 $4.00 $1.50 $4.00 $1.50 $4.00 $1.50 $4.00 $1.50 Monash University Academy of Performing Arts VIC
$1.00 $1.00 $3.80 $2.40 $3.80 $2.40 $3.80 $2.40 $3.80 $2.40 $3.80 $2.40
Portland Arts Centre VIC $3.00 $3.00 $3.00 $3.00 $3.00 $3.00 $3.00 $3.00 $3.00 $3.00 $3.00 $3.00 The Cube Wodonga VIC $2.20 $1.20 $4.00 $2.20 $4.00 $2.20 $4.00 $2.20 $4.00 $2.20 $4.00 $2.20 West Gippsland Arts Centre VIC
$1.00 $1.00 $3.60 $2.40 $3.60 $2.40 $3.60 $2.40 $3.60 $2.40 $3.60 $2.40
Whitehorse Performing Arts Centre VIC
$3.50 $1.50 $3.50 $1.50 $3.50 $1.50 $3.50 $1.50 $3.50 $1.50
Broome Civic Centre [Shire of Broome] WA
$4.00 $4.00 $4.00 $4.00 $4.00 $4.00 $4.00 $4.00 $4.00 $4.00 $4.00
Bunbury Regional Entertainment Centre WA
$2.50 $2.50 $3.60 $3.60 $3.60 $3.60 $6.00 $6.00 $6.00 $6.00 $6.00 $6.00
Don Russell Performing Arts Centre WA
$1.20 $1.20 $1.20 $1.20 $1.20 $1.20
Esperance Civic Centre WA $5.00 $4.00 $5.00 $4.00 $5.00 $4.00 $5.00 $4.00 $5.00 $4.00 $5.00 $4.00 His Majesty's Theatre WA $0.40 $4.50 $5.50 $6.00 $6.00 $6.00 Koorliny Arts Centre WA Mandurah Performing Arts Centre WA
$3.50 $3.50 $3.50 $3.50 $3.50 $3.50 $6.00 $6.00 $6.00 $6.00 $6.00 $6.00
Matt Dann Theatre & Cinema WA
$4.00 $4.00 $4.00 $4.00 $4.00 $4.00 $4.00 $4.00 $4.50 $4.00
Queens Park Theatre WA $0.20 $0.20 $3.00 $3.00 $3.00 $3.00 $3.00 $3.00 $3.00 $3.00 $3.00 $3.00
372

2015 Venue Charges and Salaries Report
41
Transaction Charges Telephone Sales Online Sales Counter Sales (Primary BO) Counter Sales External
Agency Refund at Patron’s Request Refund due to Cancellation
Venue State Fee Per To Max
Paid by Fee Per To
Max Paid by Fee Per To
Max Paid by Fee Per To
Max Paid by Fee Per To
Max Paid by Fee Per To
Max Paid by
Street Theatre ACT $4.00 ticket no max.
Hirer $4.00 trans no max.
Patron $4.00 ticket no max
Hirer N/C $3.00 ticket no max.
Hirer
Albury Entertainment Centre NSW $3.00 trans no max.
Patron N/C trans no max.
Patron $3.00 trans no max
Patron $1.50 ticket no max.
Patron $1.50 ticket no max.
Hirer
Dubbo Regional Theatre and Convention Centre
NSW $3.00 trans no max.
Patron N/C N/C N/C $5.00 ticket no max.
Hirer
Griffith Regional Theatre NSW N/C $1.50 Patron N/C N/C $3.00 Hirer
Illawarra Performing Arts Centre NSW $6.00 $6.00 Patron $6.00 $6.00 Patron N/C - - 2 x original B/Fee
Hirer
Joan Sutherland Performing Arts Centre
NSW $4.00 trans $4.00 Patron $4.00 trans $4.00 Patron $4.00 trans $4 Patron $4.00 trans $4.00 Patron N/C
Manning Entertainment Centre NSW Original B/F
ticket no max.
Patron Original B/F
ticket no max.
Patron Original B/F
ticket no max
Patron Original B/F
ticket no max
Patron N/C ticket no max.
Patron Original B/F
ticket no max.
Patron
Monkey Baa Theatre Company NSW $2.00 trans $2.00 trans $2.00 trans N/C N/C N/C
NIDA Parade Theatres NSW $1.50 ticket Hirer $1.50 ticket Hirer N/C ticket Hirer $1.00 ticket Hirer
Orange Civic Theatre NSW Original B/F
ticket Patron Original B/F
ticket Patron Original B/F
ticket Patron Original B/F
ticket Patron Original B/F
ticket Patron Original B/F
Hirer
Riverside Theatres Parramatta NSW $5.00 trans no max.
Patron $4.00 trans no max.
Patron $3.00 trans no max
Patron trans no max
Patron N/C trans no max.
Patron N/C trans no max.
Patron
Seymour Centre NSW $6.00 trans $6.00 Patron $4.00 trans $4.00 Patron N/C Patron N/C Patron $5.00 ticket no max.
Hirer N/C
Shoalhaven Entertainment Centre NSW $4.00 trans $4.00 Patron $4.00 trans $4.00 Patron N/C N/C $3.00 ticket no max.
Patron N/C
The Glasshouse Port Macquarie NSW $5.00 trans Patron $3.00 trans Patron $3.00 trans Patron N/C N/C 2 x original B/Fee
ticket Hirer
BEMAC - Brisbane Multicultural Arts Centre
QLD $1.00 trans Patron $3.00 ticket Patron $1.00 trans Patron N/C N/C N/C
Brisbane Powerhouse QLD $6.00 trans $6.00 Patron $6.00 trans $6.00 Patron $6.00 trans $6 Patron $6.00 trans $6 Patron $6.00 trans $6.00 Patron $6.00 trans $6.00 Hirer
Brolga Theatre QLD $3.00 trans Patron $3.00 trans Patron N/C N/C N/C N/C
Cairns Civic Theatre QLD $5.00 trans no max.
Patron $5.00 trans $5.00 Patron $5.00 trans $5 Patron $5.00 trans $5 Patron $2.00 N/C ticket no max.
Patron
Empire Theatre QLD $5.00 trans $5.00 Patron $5.00 trans $5.00 Patron
Gladstone Entertainment Convention Centre
QLD $3.00 trans no max.
Patron $3.00 trans no max.
Patron N/C
Judith Wright Centre of Contemporary Arts
QLD $4.00 trans Hirer $4.00 trans Hirer N/C trans $4 Hirer 2 x original B/Fee
ticket Patron 2 x original B/Fee
ticket Hirer
373

2015 Venue Charges and Salaries Report
42
Telephone Sales Online Sales Counter Sales (Primary BO) Counter Sales External Agency Refund at Patron’s Request Refund due to Cancellation
Venue State Fee Per To Max
Paid by Fee Per To
Max Paid by Fee Per To
Max Paid by Fee Per To
Max Paid by Fee Per To
Max Paid by Fee Per To
Max Paid by
Lake Kawana Community Centre QLD $3.00 trans Patron N/C trans N/C trans N/C trans N/C trans N/C trans
Mackay Entertainment & Convention Centre
QLD $3.00 trans no max.
Patron
Pilbeam Theatre, Rockhampton QLD $5.00 trans $1.50 ticket N/C N/C $3.00 2 x original B/Fee
QUT Gardens Theatre QLD $3.00 trans Patron N/C $3.00 trans Patron N/C
Redland Performing Arts Centre QLD $3.00 trans no max.
Patron $3.00 ticket Patron N/C Patron
The Events Centre QLD $6.00 trans no max.
Patron N/C ticket N/C ticket no max
N/C ticket N/C ticket 2 x original B/Fee
ticket no max.
Hirer
Barossa Arts & Convention Centre
SA $5.00 trans no max.
Patron $5.00 trans no max.
Patron $5.00 trans no max
Patron $5.00 trans no max.
Patron N/C ticket no max.
Patron N/C ticket no max.
Patron
Marion Cultural Centre SA $3.00 ticket no max.
Hirer - $3.00 ticket no max
Hirer $3.00 ticket no max.
Hirer
The Hopgood Theatre SA $3.00 trans no max.
Patron $2.00 trans no max.
Patron $3.00 trans no max
Patron ticket no max
Patron $2.00 ticket no max.
Patron 2 x original B/Fee
ticket no max.
Hirer
Burnie Arts and Function Centre TAS $3.00 trans Patron $5.00 trans Patron N/C trans Patron $4.00 trans Patron Original B/F
trans Hirer
Devonport Entertainment and Convention Centre
TAS N/C $2.00 ticket no max.
Patron N/C - $4.00 ticket no max.
Patron $4.00 ticket no max.
Hirer
Theatre Royal TAS N/C $2.00 trans no max.
Patron N/C N/C $3.00 ticket no max.
Patron N/C
Arts Centre Melbourne VIC $8.00 trans $10 Patron $8.00 trans $10 Patron N/C trans $3.00 ticket $10 Patron Original B/F
trans no max.
Hirer
Capitol Venues and Events VIC Original B/F
ticket no max.
Hirer Original B/F
ticket no max.
Hirer Original B/F
ticket no max
Hirer N/C 2 x original B/Fee
ticket no max.
Hirer
Clocktower Centre VIC $7.00 trans no max.
Patron
Frankston Arts Centre VIC N/C $1.50 ticket no max.
Patron N/C Original B/F
ticket no max.
Patron 2 x original B/Fee
trans no max.
Hirer
Her Majesty's Theatre VIC N/C N/C N/C N/C $5.00 ticket no max.
Patron N/C
Karralyka Centre VIC $3.00 trans no max.
Patron $3.00 trans no max.
Patron $3.00 trans no max
Patron N/C trans no max
Patron N/C trans no max.
Patron N/C trans no max.
Patron
Melbourne Theatre Company VIC $7.00 trans no max.
Patron $7.00 trans no max.
Patron N/C Original B/F
ticket no max.
Patron N/C
Mildura Arts Centre VIC $3.00 trans no max.
Patron
374
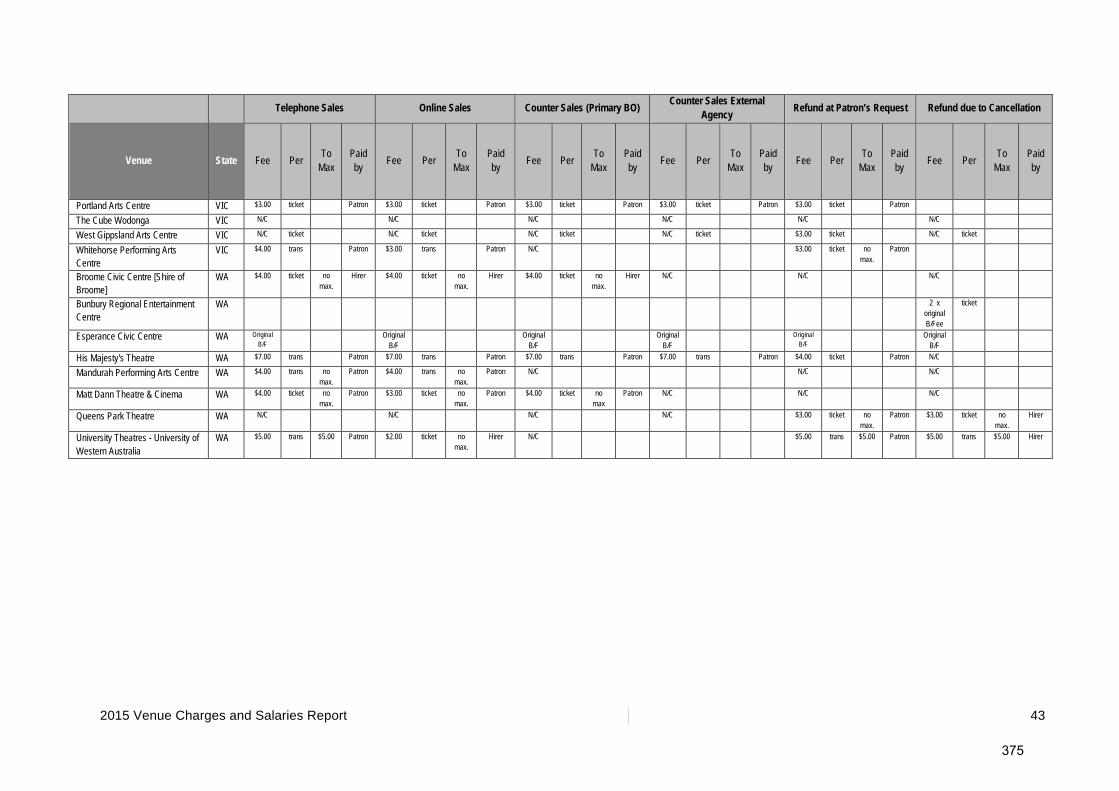
2015 Venue Charges and Salaries Report
43
Telephone Sales Online Sales Counter Sales (Primary BO) Counter Sales External Agency Refund at Patron’s Request Refund due to Cancellation
Venue State Fee Per To Max
Paid by Fee Per To
Max Paid by Fee Per To
Max Paid by Fee Per To
Max Paid by Fee Per To
Max Paid by Fee Per To
Max Paid by
Portland Arts Centre VIC $3.00 ticket Patron $3.00 ticket Patron $3.00 ticket Patron $3.00 ticket Patron $3.00 ticket Patron
The Cube Wodonga VIC N/C N/C N/C N/C N/C N/C
West Gippsland Arts Centre VIC N/C ticket N/C ticket N/C ticket N/C ticket $3.00 ticket N/C ticket
Whitehorse Performing Arts Centre
VIC $4.00 trans Patron $3.00 trans Patron N/C $3.00 ticket no max.
Patron
Broome Civic Centre [Shire of Broome]
WA $4.00 ticket no max.
Hirer $4.00 ticket no max.
Hirer $4.00 ticket no max.
Hirer N/C N/C N/C
Bunbury Regional Entertainment Centre
WA 2 x original B/Fee
ticket
Esperance Civic Centre WA Original B/F
Original B/F
Original B/F
Original B/F
Original B/F
Original B/F
His Majesty's Theatre WA $7.00 trans Patron $7.00 trans Patron $7.00 trans Patron $7.00 trans Patron $4.00 ticket Patron N/C
Mandurah Performing Arts Centre WA $4.00 trans no max.
Patron $4.00 trans no max.
Patron N/C N/C N/C
Matt Dann Theatre & Cinema WA $4.00 ticket no max.
Patron $3.00 ticket no max.
Patron $4.00 ticket no max
Patron N/C N/C N/C
Queens Park Theatre WA N/C N/C N/C N/C $3.00 ticket no max.
Patron $3.00 ticket no max.
Hirer
University Theatres - University of Western Australia
WA $5.00 trans $5.00 Patron $2.00 ticket no max.
Hirer N/C $5.00 trans $5.00 Patron $5.00 trans $5.00 Hirer
375

2015 Venue Charges and Salaries Report 44
Subscribers and Volunteers
Venue State No. of Subscribers
No. of Shows in
Subs Package
Membership, Friends or Loyalty Programs Operated by Venue
– Members Volunteer in Venue
Operated by Venue
– no Volunteers
Separate Organisation – Members Volunteer in
Venue
No. of Members
Canberra Theatre Centre ACT 500 > 10
Street Theatre ACT ✓
50-100
Albury Entertainment Centre NSW 100-150 8 ✓
100-200
Bathurst Memorial Entertainment Centre NSW 200-300 > 10
City Recital Hall Angel Place NSW ✓
200 Dubbo Regional Theatre and Convention Centre NSW 300-400 > 10 ✓
Griffith Regional Theatre NSW ✓
100-200
Illawarra Performing Arts Centre NSW 500 > 10
Joan Sutherland Performing Arts Centre NSW 200-300 > 10
Manning Entertainment Centre NSW Nil Nil ✓
50-100
Monkey Baa Theatre Company NSW Nil Nil
NIDA Parade Theatres NSW Nil Nil
Orange Civic Theatre NSW 500 > 10
Riverside Theatres Parramatta NSW 400-500 > 10 ✓
200
Shoalhaven Entertainment Centre NSW Nil Nil ✓
100-200
The Glasshouse Port Macquarie NSW Nil Nil ✓
200
Wagga Wagga Civic Theatre NSW 400-500 > 10
BEMAC - Brisbane Multicultural Arts Centre QLD Nil Nil ✓
50-100
Brisbane Powerhouse QLD Nil Nil
Brolga Theatre QLD ✓ 200
Cairns Civic Theatre QLD Nil Nil
Empire Theatre QLD ✓ 400 Gladstone Entertainment Convention Centre QLD < 50 6 ✓ 50-100
Lake Kawana Community Centre QLD < 50 7 ✓ 25-50 Mackay Entertainment & Convention Centre QLD Nil Nil ✓ 200
Pilbeam Theatre QLD < 50 10 ✓ 50-100
376

2015 Venue Charges and Salaries Report
45
Venue State No. of Subscribers
No. of Shows in
Subs Package
Membership, Friends or Loyalty Programs Operated by Venue
– Members Volunteer in Venue
Operated by Venue
– no Volunteers
Separate Organisation – Members Volunteer in
Venue
No. of Members
QUT Gardens Theatre QLD 150-200 5
The Events Centre QLD Nil ✓
200
Barossa Arts & Convention Centre SA Nil Nil ✓
50-100
Marion Cultural Centre SA < 50 > 10
The Hopgood Theatre SA Nil Nil ✓
50-100
Burnie Arts and Function Centre TAS 500 > 10
Devonport Entertainment and Convention Centre TAS 100-150 > 10
Theatre Royal TAS 500 10 ✓ 100-200
Arts Centre Melbourne VIC ✓
200
Capitol Venues and Events VIC 150-200 > 10 ✓
200
Clocktower Centre VIC 200-300 8
Colac Otway Performing Arts and Cultural Centre VIC < 50 7
Eastbank Centre - Riverlinks Venues VIC ✓
200
Frankston Arts Centre VIC ✓
200
Geelong Performing Arts Centre VIC 500 9 ✓
200
Her Majesty's Theatre VIC 50-100 > 10 ✓
100-200
Karralyka Centre VIC 50-100 9 ✓
50-100
Melbourne Theatre Company VIC 500 > 10 ✓
200
Mildura Arts Centre VIC Nil Nil ✓ 50-100
The Cube Wodonga VIC Nil Nil ✓ 50-100
West Gippsland Arts Centre VIC ✓ 200
Whitehorse Performing Arts Centre VIC 500 6
Bunbury Regional Entertainment Centre WA Nil Nil ✓ 200
Don Russell Performing Arts Centre WA Nil Nil
Esperance Civic Centre WA Nil Nil ✓ 25-50
Mandurah Performing Arts Centre WA Nil Nil ✓ 200
Matt Dann Theatre & Cinema WA Nil Nil ✓ 25-50
Queens Park Theatre WA Nil Nil ✓ <25
377

2015 Venue Charges and Salaries Report
46
Volunteers take on various roles in centres. The 2015 survey asked venues to estimate the number of hours that volunteers work in four different areas within their venues. The use of volunteers in front of house positions has the highest participation rate with a significant annual contribution of approximately 43,390 hours. This contribution remains comparatively constant to the 2013 results. In addition, volunteers provide 8,250 hours in food and beverage services, 1,640 hours in administration and 660 in technical areas. In the Figure below, the percentage of venues engaging volunteers in each role is shown within each category of venue turnover. 17 venues that use volunteers did not provide turnover figures. The results show that volunteers undertaking technical roles have reduced since 2013. In the participating venues with more than $5M turnover, no volunteer programs are in place.
Figure 35: Use of Volunteers
Other Venue Services and Charges Figure 36 shows a variety of arrangements are in place for the provision of food and beverage services within respondent venues. Most venues (84%) manage their own bars. The provision of food is managed through a variety of options for both patrons and delivery to artists backstage.
0.0%
10.0%
20.0%
30.0%
40.0%
50.0%
60.0%
70.0%
80.0%
$0-$1M (n=10) $1M-$2M (n=12) $2M-$5M (n=15) Turnover not provided (n=17)
Use of Volunteers by Venues
Front of House Food & Beverage Technical Administration
378

2015 Venue Charges and Salaries Report
47
For an increasing number of venues, food provision is being taken on as part of core business and less are outsourcing these services. When comparing these results with 2013, the provision of light meals and snacks has been introduced by approximately 15% more venues and possibly correlates to the 9% increase in venues now operating their own bar. Provision of catering by the venue has also increased from approximately 10% to 25% of respondent venues.
Figure 36: Food and Beverage Services
Figure 37 shows the commission charged by respondents on programs, merchandise and equipment hire. The most frequently charged percentage commission on programs and merchandise was 10% consistent with past surveys. In 2013, almost half of the respondents (45%) did not charge commission on equipment hire. This has slightly reduced to 43% although the number charging higher percentage rates of 15% and 20% has also reduced since 2013.
Figure 37: Commissions on Programs, Merchandise and Equipment Hire
0%
20%
40%
60%
80%
100%
Bar Services (n=61)
Light Meals/Snacks (n=48)
Restaurant (n=23)
Catering (n=53) Backstage Catering (n=56)
Food and Beverage Services
By Others on Site Arranged by Venue Venue's contractor
By Venue Arranged by Hirer
0%
10%
20%
30%
40%
50%
60%
70%
80%
Programs (n=61) Merchandise (n=63) Equipment Hire (n=44)
Commissions
Free
10%
12.50%
15%
20%
379

2015 Venue Charges and Salaries Report
48
Outsourced Services and Functions to Building Owner Finance Payroll Human
Resources Building
Maintenance Cleaning Building Security
Venue State No cost Charge No
cost Charge No cost Charge No
cost Charge No cost Charge No cost Charge
Albury Entertainment Centre
NSW ✓ ✓ ✓ ✓ ✓ ✓
Bathurst Memorial Entertainment Centre
NSW ✓ ✓ ✓ ✓ ✓
Dubbo Regional Theatre and Convention Centre
NSW ✓ ✓ ✓ ✓ ✓ ✓
Griffith Regional Theatre NSW ✓ ✓ ✓ ✓ ✓ ✓ Illawarra Performing Arts Centre
NSW ✓
Joan Sutherland Performing Arts Centre
NSW ✓
Manning Entertainment Centre
NSW ✓ ✓ ✓ ✓ ✓
Monkey Baa Theatre Company
NSW ✓ ✓ ✓ ✓ ✓ ✓
NIDA Parade Theatres NSW ✓ ✓ ✓ ✓ ✓ ✓ Orange Civic Theatre NSW ✓ ✓ ✓ ✓ ✓ ✓ Riverside Theatres Parramatta
NSW ✓ ✓ ✓
Seymour Centre NSW ✓ ✓ ✓ ✓ Shoalhaven Entertainment Centre
NSW ✓ ✓ ✓ ✓
The Glasshouse Port Macquarie
NSW ✓ ✓ ✓ ✓ ✓ ✓
Wagga Wagga Civic Theatre
NSW ✓ ✓ ✓ ✓ ✓
BEMAC - Brisbane Multicultural Arts Centre
QLD ✓ ✓ ✓ ✓ ✓ ✓
Brisbane Powerhouse QLD ✓ ✓ Brolga Theatre QLD ✓ ✓ ✓ ✓ Cairns Civic Theatre QLD ✓ ✓ ✓ ✓ ✓ ✓ Empire Theatre QLD ✓ Gladstone Entertainment Convention Centre
QLD ✓ ✓ ✓
Judith Wright Centre of Contemporary Arts
QLD ✓ ✓ ✓ ✓ ✓
Lake Kawana Community Centre
QLD ✓ ✓ ✓ ✓ ✓ ✓
Mackay Entertainment & Convention Centre
QLD ✓ ✓ ✓ ✓ ✓ ✓
Pilbeam Theatre QLD ✓ ✓ ✓ ✓ QUT Gardens Theatre QLD ✓ ✓ ✓ ✓ ✓ ✓ Redland Performing Arts Centre
QLD ✓ ✓ ✓ ✓ ✓ ✓
The Events Centre QLD ✓ ✓ Barossa Arts & Convention Centre
SA ✓ ✓ ✓ ✓ ✓
Marion Cultural Centre SA ✓ ✓ ✓ ✓ ✓ ✓ Playford Civic Centre SA ✓ The Hopgood Theatre SA ✓ ✓ ✓ ✓ ✓ ✓
380

2015 Venue Charges and Salaries Report
49
Finance Payroll Human Resources
Building Maintenance Cleaning Building Security
Venue State No cost Charge No
cost Charge No cost Charge No
cost Charge No cost Charge No cost Charge
Burnie Arts and Function Centre
TAS ✓ ✓ ✓ ✓ ✓ ✓
Devonport Entertainment and Convention Centre
TAS
✓ ✓ ✓ ✓ ✓ ✓ Capitol Venues and Events
VIC ✓ ✓ ✓ ✓ ✓
Clocktower Centre VIC ✓ ✓ ✓ ✓ ✓ Colac Otway Performing Arts and Cultural Centre
VIC ✓ ✓ ✓ ✓ ✓
Eastbank Centre - Riverlinks Venues
VIC ✓ ✓ ✓ ✓ ✓ ✓
Frankston Arts Centre VIC ✓ ✓ ✓ ✓ ✓ ✓ Geelong Performing Arts Centre
VIC ✓ ✓
Her Majesty's Theatre VIC ✓ ✓ ✓ Karralyka Centre VIC ✓ ✓ ✓ ✓ ✓ ✓ Mildura Arts Centre VIC ✓ ✓ ✓ ✓ ✓ ✓ Monash University Academy of Performing Arts
VIC
✓ ✓ ✓ ✓ ✓ ✓ Portland Arts Centre VIC ✓ ✓ ✓ ✓ ✓ ✓ The Cube Wodonga VIC ✓ ✓ ✓ ✓ ✓ ✓ West Gippsland Arts Centre
VIC ✓ ✓ ✓ ✓ ✓
Whitehorse Performing Arts Centre
VIC ✓ ✓ ✓
Broome Civic Centre [Shire of Broome]
WA ✓ ✓ ✓ ✓ ✓ ✓
Don Russell Performing Arts Centre
WA ✓
✓ ✓ ✓ ✓
Esperance Civic Centre WA ✓ ✓ ✓ ✓ ✓ His Majesty's Theatre WA ✓ ✓ ✓ ✓ ✓ Mandurah Performing Arts Centre
WA
✓ ✓
Matt Dann Theatre & Cinema
WA ✓
✓ ✓ ✓ ✓
Queens Park Theatre WA ✓ ✓ ✓ ✓ ✓ ✓
381

2015 Venue Charges and Salaries Report
50
Appendix A – Respondents Canberra Theatre Centre ACT Street Theatre ACT Albury Entertainment Centre NSW Bathurst Memorial Entertainment Centre NSW City Recital Hall Angel Place NSW Dubbo Regional Theatre and Convention Centre NSW Griffith Regional Theatre NSW Illawarra Performing Arts Centre NSW Joan Sutherland Performing Arts Centre NSW Laycock Street Community Theatre NSW Manning Entertainment Centre NSW Monkey Baa Theatre Company NSW NIDA Parade Theatres NSW Orange Civic Theatre NSW Riverside Theatres Parramatta NSW Seymour Centre NSW Shoalhaven Entertainment Centre NSW The Glasshouse Port Macquarie NSW Wagga Wagga Civic Theatre NSW BEMAC - Brisbane Multicultural Arts Centre QLD Brisbane Powerhouse QLD Brolga Theatre QLD Cairns Civic Theatre QLD Empire Theatre QLD Gladstone Entertainment Convention Centre QLD Ipswich Civic Centre QLD Judith Wright Centre of Contemporary Arts QLD Lake Kawana Community Centre QLD Mackay Entertainment & Convention Centre QLD Pilbeam Theatre, Rockhampton QLD QUT Gardens Theatre QLD Redland Performing Arts Centre QLD The Events Centre, Caloundra QLD Townsville Civic Theatre QLD Barossa Arts & Convention Centre SA Marion Cultural Centre SA Murray Bridge Town Hall SA Playford Civic Centre SA The Hopgood Theatre SA Burnie Arts and Function Centre TAS Devonport Entertainment and Convention Centre TAS Theatre Royal TAS Arts Centre Melbourne VIC Capitol Venues and Events VIC Clocktower Centre VIC Colac Otway Performing Arts and Cultural Centre VIC Drum Theatre VIC Eastbank Centre - Riverlinks Venues VIC Frankston Arts Centre VIC Geelong Performing Arts Centre VIC Her Majesty's Theatre VIC Karralyka Centre VIC
382

2015 Venue Charges and Salaries Report
51
Melbourne Theatre Company VIC Mildura Arts Centre VIC Monash University Academy of Performing Arts VIC Portland Arts Centre VIC The Cube Wodonga VIC West Gippsland Arts Centre VIC Whitehorse Performing Arts Centre VIC Broome Civic Centre, Shire of Broome WA Bunbury Regional Entertainment Centre WA Don Russell Performing Arts Centre WA Esperance Civic Centre WA His Majesty's Theatre WA Koorliny Arts Centre WA Mandurah Performing Arts Centre WA Matt Dann Theatre & Cinema WA Queens Park Theatre WA University Theatres - University of Western Australia WA
383

2015 Venue Charges and Salaries Report
52
Appendix B – Survey Questionnaire
1. Introduction
This is the final part of the 2015 APACA Survey
The survey covers your venue's fees and charges and the remuneration of you and your staff.
You can return to the survey any number of times to complete various questions and you can email your centre's email link to
various members of your team for completion of questions relevant to their area of responsibility.
BUT, PLEASE DON'T USE A SURVEY LINK THAT HAS NOT BEEN SPECIFICALLY SENT TO YOUR CENTRE.
Please do not include dollar signs ['$'], commas or spaces in numeric responses and please enter a zero for zero values, do not
leave the field blank or enter 'N/A'.
If you require assistance regarding clarification of definitions and/or questions please direct your enquiry via email to Rick Heath
[[email protected]] or call 1300 66 52 63 [please note WA time zone]
1. Your Name:
Other (please specify)
2. Organisation name: (ie the APACA member)*
3. State/Territory:
NT QLD NSW ACT VIC TAS SA WA
1
384

2015 Venue Charges and Salaries Report
53
2. Venue Hire Charges Primary Space
You ill have the opportunity to provide Venue Hire charges for up to four spaces. Please enter details for your primary
performance space on this page.
If you have different rates for a different days of the eek please include the highest rate on this survey.
. Audience capacity of the primary space
Under 500
500 to
1,000 to 1,
Over 2,000
After you have entered the venue charges you ill be able to indicate hat is or is not included in the package hire rate.
Per eek
Per day
Per session
Hours per session
Vs of Net Bo Office
5. Commercial Hire (Package Rate)
Per hour
Per day
6. Commerical Hire Rehearsal Rate
2
385
2015 Venue Charges and Salaries Report
54
Per eek
Per day
Per session
Hours per session
Vs of Net Bo Office
. Community Subsidised Hire (Package Rate)
Per hour
Per day
. Community Subsidised Hire Rehearsal Rate
Other (please specify)
. Do you have any other hire rates for this spaces other than Commercial and Community Use
Schools
Eisteddfod
Conferences
roups
10. Does the centre operate more than one space for hich you ish to enter venue charges*
3
386

2015 Venue Charges and Salaries Report
55
3. Venue Hire Charges Space 2
After you have entered the venue charges you ill be able to indicate hat is or is not included in the package hire rate.
11. Audience capacity of the space
Under 500
500 to
1,000 to 1,
Over 2,000
Per eek
Per day
Per session
Hours per session
Vs of Net Bo Office
12. Commercial Hire (Package Rate)
Per hour
Per day
13. Commerical Hire Rehearsal Rate
387
2015 Venue Charges and Salaries Report
56
Per eek
Per day
Per session
Hours per session
Vs of Net Bo Office
1 . Community Subsidised Hire (Package Rate)
Per hour
Per day
15. Community Subsidised Hire Rehearsal Rate
16. Do you ish to enter venue charges for another space*
5
388

2015 Venue Charges and Salaries Report
57
. Venue Hire Charges Space 3
After you have entered the venue charges you ill be able to indicate hat is or is not included in the package hire rate.
1 . Audience capacity of the space
Under 500
500 to
1,000 to 1,
Over 2,000
Per eek
Per day
Per session
Hours per session
Vs of Net Bo Office
1 . Commercial Hire (Package Rate)
Per hour
Per day
1 . Commerical Hire Rehearsal Rate
6
389

2015 Venue Charges and Salaries Report
58
Per eek
Per day
Per session
Hours per session
Vs of Net Bo Office
20. Community Subsidised Hire (Package Rate)
Per hour
Per day
21. Community Subsidised Hire Rehearsal Rate
22. Do you ish to enter venue charges for another space*
390

2015 Venue Charges and Salaries Report
59
5. Venue Hire Charges Space
After you have entered the venue charges you ill be able to indicate hat is or is not included in the package hire rate.
23. Audience capacity of the space
Under 500
500 to
1,000 to 1,
Over 2,000
Per eek
Per day
Per session
Hours per session
Vs of Net Bo Office
2 . Commercial Hire (Package Rate)
Per hour
Per day
25. Commerical Hire Rehearsal Rate
391

2015 Venue Charges and Salaries Report
60
Per eek
Per day
Per session
Hours per session
Vs of Net Bo Office
26. Community Subsidised Hire (Package Rate)
Per hour
Per day
2 . Community Subsidised Hire Rehearsal Rate
392

2015 Venue Charges and Salaries Report
61
6. Venue Hire Charges applies to all spaces in the venue
Yes No
Electricity
Air conditioning
Basic Lighitng
Equipment
Basic Audio Equipment
Duty Technician /
Technical Staff
Duty anager
Bo Officer Ticket
Seller
Cleaning
2 . Does the package hire rate for CO ERCIAL USE include*
2 . What qualifies a hirer for the Community Use hire rate
(you may select a number of responses)
Public Educational Institution (Kindergarden, Primary or Secondary School)
Private Educational Institution (Kindergarden, Primary or Secondary School)
Not for Profit group or organisation based in the L area
Not for Profit group or organisation regardless of origin or base location
Dance School providing recreational and entry level training
10
393

2015 Venue Charges and Salaries Report
62
Yes No
Electricity
Air conditioning
Basic Lighitng
Equipment
Basic Audio Equipment
Duty Technician /
Technical Staff
Duty anager
Bo Officer Ticket
Seller
Cleaning
30. Does the package hire rate for CO UNITY USE include*
31. If you charge for the provision of marketing and publicity services please provide details.
arketing and publicity services are
*
not provided by the venue
basic advice and support is provided at no additional cost
is provided and charged at a set hourly rate
is provided as a percentage of the value of paid advertising placed for the hirer
32. If you charge for cleaning staff in addition to standard venue rental charges please provide details.
Additional cleaning is
*
not charged
charged at a flat rate per performance of less than $150
charged at a flat rate per performance of bet een $150 and $300
charged at a flat rate per performance of more than $300
charged at an hourly rate and based on actual time to clean
only charged in e traordinary circumstances and at an hourly rate and based on actual time to clean
11
394

2015 Venue Charges and Salaries Report
63
. Staff Recharge Rates Front of House
These are the rates charged to hirer for the services provided by venue staff in Front of House.
Rate $/hr in. Call
Duty anager
Usher
erch. Seller
Bo Office
Stage Door
33. Staff recharges rates per hour charged to the hirer
Duty
anager Ushers
Ticket
Seller
Stage Door
Keeper
Theatre performances
Unticketed events
3 . inimum Front of House staff level for events for each
performance venue
(include only those staff that are at the hirer's e pense i.e. if the
venue provides the bo office ticket seller at the venue's e pense do
not include that position in this question)
12
395

2015 Venue Charges and Salaries Report
64
. Staff Recharge Rates Production
These are the rates charged to hirer for the services provided by venue staff in the Production department. If you have only one
rate for production staff please enter this at the Duty Technician question belo .
Rate $/hr in. Call
Technical anager
Duty Technician
Senior Technician
Technician
35. Staff recharges rates per hour charged to the hirer
Technical Staff
Theatre performances
Unticketed events
36. inimum Production staff level for events for each performance
The ans er One for each department in use means that if a hirer is using the venues lighting, sound
or mechanical systems one venue technician a minimum of one of the head technicians must be
engaged
*
3 . A ard overtime penalties are
applied to the above rates and charged to the hirer
included in the above flat rates
13
396

2015 Venue Charges and Salaries Report
65
. Bo Office Services
Other (please specify)
3 . Bo Office system used (you can select more than one)
ProVenue / Tickets.com
TIKE
Ticketek
Bass
TicketServ
Enta
SABO / Seat Advisor
anual hard tickets
Tesatura
TryBooking
3 . Does the venue have e ternal Bo Office outlets removed from the primary venues
No Yes, 1 Yes, 2 Yes, 3 Yes,
0. Number of points of sale in the primary bo office
1 2 3 5 or more
of Sales
Counter Sales
Telephone
Online
E ternal Agency
Outlet
1. Of the methods of sale available at your Bo Office
please estimate the percent of sales by each method
1
397

2015 Venue Charges and Salaries Report
66
15
398

2015 Venue Charges and Salaries Report
67
10. Bo Office Services
Commercial Community
Complimentary
$15
$25
$50
$ 5
$100
2. Booking Fees
(select the booking fee that applies to a ticket ith the follo ing net values)
Rate per
Original build
Edit on sale event
3. Event Build Fee
Please provide details of any additional bo office charges
For the purposes of this question an 'Inside Charge' is a charge included in the public selling price of a ticket and is not disclosed to
the patron and an 'Outside Charge' is a charge that is added to this selling price and is disclosed.
16
399

2015 Venue Charges and Salaries Report
68
Fee per
ma . per
transaction Type ie Paid for
Charge for
tickets sold by
telephone
Charge for
tickets sold
online
Charge for
counter sale at
primary bo
office
Charge for
counter sale at
e ternal
agencey
Refund at the
request of the
patron
Refund as a
result of
cancellation
. Other bo office charges
Charged to
Credit Card
Debit Card
Paypal
5. erchant fee for tickets purchased on purchase cards
6. If you offer a subscription season please indicate the number of subscribers
. If you offer a subscription season please indicate the number of sho s in your subscription
package
Type No. members
. Please provide details of any embership, Friends or loyalty program
1
400

2015 Venue Charges and Salaries Report
69
11. Venue Catering Charges
Service provided by
Beverage / Bar
Services
Food Light eals /
Snacks
Full restaurant meals
Function Catering
Backstage Catering
. Food and Beverage services
1
401

2015 Venue Charges and Salaries Report
70
12. Staff Recharge other services
Charge
Programs
Other merchandise
Equipment Hire
50. Commission Rates
1
402
2015 Venue Charges and Salaries Report
71
13. Administration Charges
Provided at No Cost On Charged to Venue
Finance
Payroll
Human Resources
arketing
Building aintenance
Cleaning
Building Security
51. Are any of the follo ing functions or services outsourced to the building o ner or parent
organsiation i.e. Local overnment. Please indicate if the cost of providing this service is recorded
against the operating e penditure of the venue.
52. Ho many house seats do you hold per performance hen the venue is hired by an e ternal party
20
403
2015 Venue Charges and Salaries Report
72
1 . Salary Venue anager
53. Venue anager Salary (Cash component only)
5 . Overtime is
paid in addition to Salary above
included in Salary
is remunerated by the provision of TOIL (Time Off in Lieu)
is remunerated by a combination of TOIL and paid overtime
is largely ignored by my employer despite all of their 'talk' of ork life balance
55. On average over the past three months ho many hours has the Centre anager orked per eek
35 hours
35 0 hours
0 5 hours
5 50 hours
more than 50 hours
Other (please specify)
56. In many centres the person that has direct management responsibility for the Performing Arts
program and venue often has other operational responsibilities. Please indicate if you also manage the
follo ing programs
Art allery / Visual Arts programs
Events and Community Celebrations
Community Arts programs
Heritage programs
Sho grounds
Stadiums
21
404

2015 Venue Charges and Salaries Report
73
Other (please specify)
5 . The employment / engagement is under the terms of an
industrial a ard
enterprise agreement
private contract of employment
contract for service via a separate legal entity
5 . A motor vehicle is
provided by the employer for commuter (private to and from ork) use only
provided by the employer for full private use
not provided by the employer but an additional payment is made to the employee
not provided by the employer but an additional payment is made to the employee hich must be used to lease a suitable
vehcile ie a novated lease
not provided by the employer
5 . Where superannuation is provided at a level above the legislative requirement (ie ) please
provide details.
(This is the amount paid by your employer do not include your pre ta salary sacrifice or post ta
private contribution)
60. Is a performance bonus paid
Yes No
61. Please provide details of any other remuneration or non cash benefits provided. You may select
more than one option.
obile phone business calls only
obile phone all calls
Laptop available for private use
Uniforms
Clothing allo ance
Subsidized residential housing
Professional memberships
Travel for professional development
22
405

2015 Venue Charges and Salaries Report
74
62. Total value of the package provided (including all benefits and superannuation)
23
406

2015 Venue Charges and Salaries Report
75
15. Salary Venue Staff
Salary Overtime is
Operations
anager/Director
Technical
anager/Director
Bo Office/FOH
anager
arketing
anager/Director
Program anager
F B anager
Finance anager
HR anager
Admin. Officer
63. Staff Salary and Conditions
2
407

2015 Venue Charges and Salaries Report
76
16. Employment Agreements
Type of Agreement
anagement
Admin. staff
Technical
Front of House
Food and Beverage
6 . Venue staff (as above) are engaged under the terms of
Operations
Technical
Bo Office
arketing
Public Programs
Food and Beverage
Finance anager
Administration
65. Provide the total number of FTE (Full time equivalent) employees, including casual staff and
contractors in each department.
For e ample, if you employed 3 casual staff for 20 hours per a eek that ould be 3 20 60 hours,
hich is 1.5 FTE's.
66. Provide the TOTAL number of FTE (Full time equivalent) staff employed across your entire
organisation (including yourself, contracted and casual staff).
25
408

2015 Venue Charges and Salaries Report
77
6 . If the venue utilises volunteers in hat areas are they engaged
Front of House
Food and Beverage
Technical
Administration
Front of House
Food and Beverage
Technical
Administration
6 . If the venue utilises volunteers, please enter the total number of hours orked per annum in each
area in hich they are engaged [please enter '0' if no hours are volunteered]
26
409

2015 Venue Charges and Salaries Report
78
1 . Programming / Cultural Plan
Other (please specify)
6 . Does your centre have a ritten programming policy or plan
Yes
No
Other (please specify)
0. Does your centre have a ritten audience development plan or strategy
Yes
No
Other/Comment:
1. Does your Local Council have a Cultural Plan
Yes
No
2
410

2015 Venue Charges and Salaries Report
79
1 . Cultural Plan
Other/Comment (please specify)
2. Does your Local Council Cultural Plan refer to the activities or goals of your centre
Yes
No
2
411
2015 Venue Charges and Salaries Report
80
1 . THANK YOU
Thank you for completing this survey.
Sub ect to the timing of responses, e hope to be able to distribute the survey to participating members by the end of April. Thanks
for your patience.
3. Can you please confirm that you have completed this part of the survey
Yup all done
Nup still lookin' I'll be back to add more responses
. Do you have any comments regarding questions that you found difficult to ans er
5. Any other comments
2
412

Appendix 7 - Examining Perth’s Performing Arts Infrastructure: Committee for Perth (2013)
413
Examining Perth’s Performing Arts InfrastructureActions to position Perth as a global leader in the arts
June 2013
414

About the Committee for Perth
The Committee for Perth is a member funded think tank focused on
maintaining and improving the liveability of the Perth metropolitan
region by ensuring its vibrancy, economic prosperity, cultural diversity
and sustainability.
We currently have over 90 members representing a broad cross sector of
the business community, civic institutions and local government and rely
solely on our members’ financial contribution to enable us to undertake
the work, research and activities that we do. A full membership listing is
included as Appendix F.
The role of the Committee for Perth is to advocate on issues that we
believe will help us realise our vision for Perth and we have developed
a unique model of advocacy through which this is achieved. Regardless
of whether a project is our initiative or one implemented by government
or others, we remain informed advocates for projects that we believe
will benefit future Perth whatever stage they are at in concept or
development.
Further information about the Committee for Perth and our work can be
obtained from our website at www.committeeforperth.com.au
This report is the copyright of the Committee for Perth. While we encourage its use, it should be referenced as :
(2013) Examining Perth’s Performing Arts Infrastructure, The Committee for Perth, Perth
415
Examining Perth’s Performing Arts Infrastructure 1
Foreword
In late 2008 the Committee for Perth released its landmark report A Cultural Compact
for Western Australia, the 10 year challenge (the Compact). In the report we invited
the arts and cultural sector, the Western Australian Government and other political
parties, the business and philanthropic sectors and Local Government Authorities
to commit to work through the report’s recommendations together for 10 years to
revitalise our capital city, regional cities and towns and to achieve:
• avibrantstatewhereartsandculturalappreciationandactivityarepartof
everyday life for all Western Australians;
• acknowledgementoftheimportanceofAboriginalcultureandtheartstothe
future fabric of Western Australia;
• theengagementofyoungartistswhochosetostay,returnto,orvisitbecause
they are encouraged and supported within an incubator environment;
• adynamiccapitalcitythatallWesternAustraliansareproudof;and
• boldandcourageousartthatplacesWAfirmlyontheinternationalstage.
Since the Compactwasreleasedtherehasbeenasignificantre-energisationand
coalescence across the sector itself, governments and the business and philanthropic
sectors which has brought the vision closer to reality.
In the Compactwenotedtheneedtoaddressdeficienciesinartsinfrastructure.
This was not addressed in the Compact project because we understood that
the Department of Culture and the Arts was undertaking an audit of arts and
cultural infrastructure across the state which would inform the development of an
infrastructure plan. Many years later we await that plan which we believe would be a
key enabler to fully realising the vision.
Without such a plan, the conversations about needs, wants, gaps and desires
continues without direction. The Committee for Perth therefore decided to
commissionthisquantitativeauditofperformingartsvenuesinPerthasafirststep
in examining the region’s major performing arts venues in their current context and
against the backdrop of decades of predicted population growth. The report also
compares how Perth fares in terms of infrastructure provision against a number of
other cities.
It is our desire that the research efforts in this report, which culminate in a number of
recommendations, again act as a catalyst for renewed energy and focus in planning
forthefuture.Wehaveidentifiedthatadditionalresearchwillberequiredtoprogress
this issue including a qualitative analysis of venues, research into venue cost and
funding and broad stakeholder consultation to determine the needs and aspirations
of the performing arts sector.
WeareconfidentthatbyhighlightingthemajorinfrastructuregapsinPerth’scurrent
and future infrastructure this report will lay the foundation for further investigation
and action that leads to a genuinely vibrant and sustainable arts and cultural sector
forthebenefitofallWesternAustralians.
Marion Fulker
CEO, Committee for Perth
416

2 Committee For Perth
Table of Contents
Executive Summary 3
1. Introduction 6
2. Methodology 7
3. Demand for Arts & Culture in Perth 8
3.1 Attendance at Performing Arts Venues in Western Australia 9
3.2 International Performing Arts Trends 10
3.3 Current Attendance Trends in Perth 10
3.3.1 Perth International Arts Festival 11
3.3.2 Fringe World Festival 11
3.4 Contribution to the Economy 12
3.5 Population Growth 13
3.6 Tourism Growth 13
3.7 Key Findings 14
4. Audit of Perth’s Existing Arts Facilities 15
4.1 Index of Venues and Map References 15
4.2 Summary of Venues Audited 17
4.3 Summary of Audited Venues by Directions 2031 19
4.4 Stakeholder feedback 20
4.5 Key Findings 20
5. Benchmarking Perth’s Performing Arts Infrastructure 21
5.1 Benchmark Data: Number, Type and Capacity of Venues 22
5.2 Observed Trends in Performing Arts Infrastructure 26
5.3 Key Findings 27
6. Conclusions and Recommendations 29
6.1 Conclusions 29
6.2 Recommendations for State Government 30
6.3 Considerations for the arts and cultural sector 30
Appendices 32
Appendix A: Full List of References 33
Appendix B: Venue Summaries, Performing Arts Perth 34
Appendix C: Project Team 104
Appendix D: Member Acknowledgement 106
Appendix E: Gathering Issues 108
417

Examining Perth’s Performing Arts Infrastructure 3
Executive Summary
Cities today are increasingly competing with each other. They compete to attract investment, people,
businesses and company headquarters, along with sporting and cultural events. Cultural prowess and
economic success are becoming interlinked and cultural vibrancy is recognised as central to a city’s
liveability.
In this context, high quality cultural facilities are integral to any liveable, modern city, and while Perth
is considered highly liveable in terms of a high standard of living, the area of arts and culture has not
traditionally been viewed as one of the region’s strengths.
In recognition of the role cultural facilities play in developing a competitive city as well as the
importance of effective long term planning for cultural infrastructure needs, the Committee for Perth
commissionedtwopiecesofwork:-
• anauditofmajorperformingartsinfrastructureinthePerthandPeelregion;and
• ananalysisoftheauditinordertobenchmarkPerth’smajorperformingartsinfrastructureofferings
against other cities.
Thisreportisthecombinedfindingsofthoseresearchprojects.Purelyquantitativeinnature,itis
intended to help the Western Australian government in planning for Perth’s future performing arts
needs. It also will assist the Committee for Perth and other associated organisations in advocating for
improved cultural infrastructure in Perth.
Perth’s cultural sector is flourishing. Attendance at performing arts events is increasing and there is
significantevidencethatPerth’speoplenotonlyhaveagrowingappetiteforartsandculturebutthat
there remains untapped potential for audience growth.
In addition, ongoing rapid population and economic growth could direct Perth towards attendance
growth up to or even in excess of 34% by 2021, meaning that Perth’s existing cultural infrastructure,
some of which is already struggling to meet demand, will come under enormous pressure over the next
decade.
Furthermore, over the next 40 to 50 years Perth will need adequate performing arts infrastructure to
meet the demand of an estimated population of four million people, meaning that Perth will need
infrastructure that is of comparable size and quality to that in metropolitan Melbourne today. This
means that the number of performing arts venues in Perth will need to approximately double.
In addition to this, Tourism Western Australia has a target to double the value of tourism in Western
Australia by 2020. Achieving this target requires positioning WA as a recognised events destination
for locals and visitors, and providing every visitor with the opportunity to have an Indigenous cultural
experience–bothgoalsthatarelikelytoincreasedemandforculturalfacilitiesandspecifically
highlighttheneedforaworld-classIndigenousculturalcentreinPerth.
The report includes an audit of 35 venues in the Perth and Peel region with a seating capacity of 200 or
more that are currently used as performing arts venues. Of these, 22 are indoor venues whose primary
function is for the performing arts and 13 are outdoor venues or stadiums, 6 of which do not have
performing arts as their primary function but do stage large concerts and festival style events.
418

4 Committee For Perth
In addition to the audit, a smaller selection of 21 venues, each with a seating capacity of 500 and
a location within 20 kilometers of the Perth city centre, has been used to provide a comparison of
performing arts infrastructure in Perth with that in seven other national and international cities. This
comparison indicates that Perth generally compares favourably with the other cities on a number of
venuesandseatingpercapitabasisbutitalsoidentifiessomemajorinfrastructuregaps.
In particular it has found that:
• Perthisverywellservedinsomeinfrastructurecategories(particularlylargeoutdoorvenues)but
relatively poorly served in others.
• Perthappearstoberelativelywellservedwithdanceanddramatheatres.
• Perthhasarelativelylargenumberofarenas/largemultipurposevenuescomparedto
benchmarked cities.
• Perthhasacomparativelyhighproportionofstadiumsthatareprimarilyforsportingusebutare
also occasionally used for performing arts events. This may reflect the popularity of outdoor events
in the region, but could also be a reflection on the lack of large purpose built venues in the region,
particularly prior to the opening of the Perth Arena.
• Perthhasanundersupplyoflyrictheatres,withcurrentlyonlyonelyrictheatreandnodedicated
lyric theatre for musicals.
• Perthhasanundersupplyofconcerthallswith0.5venuespermillionpeoplecomparedtoan
average of 1.35 venues per million across the benchmarked cities.
• Perthhasaslightundersupplyofcontemporarymusicvenues.
The report indicates that investment in some types of performing arts infrastructure is needed to meet
current demand in Perth and to enable performing arts attendance rates to continue to grow.
It is also evident that very substantial medium and long term investment in performing arts
infrastructure will be required to meet the demand generated by population growth – investment that
should also aim to position Perth as a global leader in the arts.
419

Examining Perth’s Performing Arts Infrastructure 5
Onthebasisofthereportfindings,wemakethefollowingrecommendationstotheStateGovernment:
1. The State Government prepares a long term Plan for Arts and Cultural Infrastructure that positions
Perth as a global leader in arts and culture.
2. The Infrastructure Plan should be completed within 12 months and funding decisions flowing from
thePlancommenceinthe2014-15Budget
3. Priority infrastructure requirements to be addressed in the Plan include:
• thedevelopmentofanIndigenousculturalcentreinPerththatincludesperformingarts
space in order to meet the demand for Indigenous cultural events both within the Indigenous
communities and the tourism sector.
• thedevelopmentofanewmajorlyrictheatreinPerththatissuitableforlargescaleopera,
ballet and musical theatre.
• whetherthereisaneedforanadditionalconcerthallorrecitalhall.
4. The plan should develop locational criteria for major infrastructure to ensure that it makes a
positive contribution to the urban landscape and capitalises on the potential for city activation and
economicbenefits.
The scope of works of this report has been to analyse the commercial performing arts infrastructure
that is presently in use in the Perth and Peel region with an audience capacity of over 200, offering
ticketed events and available for public hire.
Following a review of the draft report by the Committee for Perth’s Revitalising Working Group
and representatives of the Chamber of Arts and Culture, it is felt that the report gives rise to other
considerations that require further examination from within the sector. These include:
• Shouldadditionalworkbeundertakentoexamineindetailthedemandfordanceanddrama
theatres in Perth to identify whether there remains a shortage of supply; whether there is a
shortage of high quality theatres; and whether there is a need for additional rehearsal space in the
region?
• ShouldadditionalworkbeundertakentoexamineculturalinfrastructurefundinginPerthin
comparison to other cities and identify potential funding opportunities to ensure that existing, new
andrenewedculturalinfrastructureremainsfinanciallyviablethroughitsprojectedlifecycle?
• Isthecurrentsituationinregardstosuitability,availabilityandaffordabilityofperformanceand
rehearsal venues acceptable?
• Areadequateconsiderationsforcostsofandfundingfortheongoingmaintenanceand
improvement of existing venues in place?
• Wouldafurtherstudyintoglobalaudienceandliveperformancetrendsanddemographics
provide useful information as to the nature of the performing arts venues that are likely to be in
demand in the future?
• Shouldconsiderationbegiventothedevelopmentofaproposaltoincentivisedevelopersto
providealyrictheatre/rehearsalspaceandartsadministrationfacilityaspartofaprecinct/arts
hub in the Elizabeth Quay waterfront project area?
420

6 Committee For Perth
1.0 Introduction
In this era of globalisation, cities are increasingly competing with each other. They compete to
attract investment, people, businesses and company headquarters, along with sporting and
cultural events. Cultural prowess and economic success are becoming interlinked and cultural
vibrancy is recognised as central to a city’s liveability.
High quality cultural facilities are therefore integral to a liveable, modern city. While Perth is
considered highly liveable in terms of a high standard of living, the area of arts and culture has
not traditionally been viewed as one of the region’s strengths. Perth has long been criticised
for lacking vibrancy and recreation choice and as a community we smarted when Lonely
Planet labelled our city ‘dullsville’.
The Committee for Perth is a think tank and advocate for a bright future for the Perth region.
Our vision of this future is one in which Perth becomes increasingly innovative, culturally
vibrant and forward thinking.
The Committee supports the aspirations of local arts champion, the Chamber of Arts and
Culture to ‘imagine Western Australia as a global leader in the arts’.
Ensuring that Perth has high quality arts and cultural infrastructure is integral to this aspiration.
Recognising this importance, the Committee for Perth commissioned Hames Sharley (WA)
Pty Ltd to conduct an audit of major performing arts venues in the Perth metropolitan region
andlong-termresearchconsultanttotheCommittee,GemmaDavistoanalysehowwellPerth
fares.
Thisreportisthecombinedfindingsofthoseresearchprojects.Itisintendedtohelpthe
Western Australian government in planning for Perth’s future performing arts needs. It also
will assist the Committee for Perth and other associated organisations in advocating for
improved cultural infrastructure in Perth.
The purpose of this report is therefore to examine existing and likely future demand for
performing arts infrastructure in Perth as the region grows and changes; and to audit Perth’s
existing performing arts infrastructure to identify existing infrastructure gaps and priority
needs. The report also aims to identify the likely performing arts infrastructure needed to
make Perth a liveable and vibrant city into the future.
This report provides a comprehensive overview of major performing arts venues in Perth and
enables comparison with other cities in Australia and overseas. The report:
• Providesanoverviewofthedemandforandimportanceofartsandculturalactivitiesand
infrastructure to Perth and the Western Australian economy.
• Examinesthefindingsofacomprehensive,desktopreviewofperformingartsvenues
across Perth.
• BenchmarksPerth’sperformingartsinfrastructureagainstthatinotherAustraliancapitals
and cities overseas.
• IdentifiesinfrastructuregapsinPerth.
• Makesrecommendationsonmajorperformingartsinfrastructureneedsforthefuture.
421

Examining Perth’s Performing Arts Infrastructure 7
2.0 Methodology
To provide a comprehensive review of supply and demand for cultural facilities a three stage
methodology has been used to undertake this study. This has included:
1. A summary of performing arts demand and attendance trends and likely future demand
growth.
2. An audit of existing performing arts venues and facilities in Perth and Peel focused
on commercial venues that have a seating capacity of 200 or more, that offer ticketed
performances and are available for public hire. The selection of venues considered was
informed by discussion with the Department of Culture and the Arts. 35 venues from
across the region met the required criteria and were included in the study.
Each venue has been audited to achieve consistent data capture and includes: venue
name; street address; Local Government Authority; primary and secondary purposes;
stageconfigurations;operatorandmanagementarrangements;fundingsources;seating
capacityinallconfigurations;imagesoftheexteriorandinteriorofthefacility;the
yearthevenuewasbuilt,datesofsignificantrenovationswithanoutlineoftheworks
undertaken; additional amenities within the facility such as bars, dining venues, exhibition
spaces or meeting rooms.
3. A comparison of major performing arts venues in Perth with those in three national and
four international cities using benchmark data from Planning Sydney’s Cultural Facilities
review prepared by Sweet Reason Pty Ltd in 2011 for the City of Sydney. The Sydney
benchmark data only included venues located within 20 kilometres of the city centre with
a seating capacity of 500 or more and so, in order to make a like for like comparison, we
only used data from the 21 Perth venues that also meet this criteria.
The comparison cities are:
• Sydney
• Brisbane
• Melbourne
• Manchester
• HongKong
• Copenhagen
• Chicago
422

8 Committee For Perth
3.0 Demand for Arts and Culture in Perth
Perth’s arts and cultural sector is flourishing. With a booming economy and expanding
population, Perth’s people have a growing appetite for arts and culture. The local arts and
culture scene is in the midst of a period of renewed energy and creativity and the sector has
more private sector support and champions than ever before.
Attendance statistics for some of Perth’s major performing arts companies show they are
experiencing solid attendance growth which in part has been assisted by investment in new
infrastructure. This increase in patronage is bucking national and international trends of
audience decline.
The huge success of new performing arts initiatives in Perth such as Fringe World Perth
is encouraging a broader range of community participation and developing new arts and
cultural enthusiasts.
Growing audiences when cities elsewhere are experiencing a drop in patronage, coupled
withprojectionsforcontinuedpopulationandeconomicgrowthforthisregion,signifiesan
opportunity for Perth to become a global leader in arts and culture.
HoweverPerthisstillfightingcriticismforlackingvibrancy,sophisticationandrecreation
choice, from its own residents, from national business and academic leaders1 and from
international ‘liveability’ surveys such as the Economist Intelligence Unit2 and Mercer
Consulting3, both of which rate Perth relatively poorly against their culture, recreation and
environment criteria.
These criticisms and negative perceptions should not be ignored as they have a direct
negative impact on our own satisfaction with living in Perth; on Perth’s national and
international reputation; and on the region’s ability to attract and retain talented people and
investment dollars.
It is also evident that, despite the cultural attendance growth that has been achieved, Perth’s
cultural participation rates fall well below the nation’s leader, the Australian Capital Territory,
andthereispotentialforPerthtodevelopasignificantlystrongerculturaltourismsector.
This section provides a snap shot of attendance at performing arts venues and events in
Western Australia and the Perth and Peel region based on the most recently available
statisticaldata.Itexaminesattendancetrendsandthebenefitsofculturalsectorgrowthand
provides indicators for the future.
1 Wetzstein S (2010) Perceptions of Urban Elites on Four Australian Cities: How does Perth compare?, Committee for Perth, Perth www.committeeforperth.com.au
2 Economist Intelligence Unit (2011) Global liveability report, EIU, London3 Mercer Consulting (2012) Quality of Living Survey 2012, Mercer LLC, New York
423

Examining Perth’s Performing Arts Infrastructure 9
3 .1 Attendance at Performing Arts Venues in Western Austral ia
Western Australia has not traditionally had a reputation as a cultural leader and statistics
indicate that performing arts attendance in the state has been average in comparison with
other states and territories.
In2009-10,atotalof945,500peopleor53.7%ofpeopleagedover15yearsinWestern
Australia and 55.5% of people over 15 living in Perth attended a performing arts venue4.
This is consistent with the national average of 53.6% attendance but is behind the nation’s
leader, the Australian Capital Territory which achieved 63.9% attendance (among those aged
15 years and older).
Comparingattendancein2005-06withthatin2009-10indicatesthatoverallrateshave
remained relatively stable.
In2009-10,16%ofpeopleagedover15inWesternAustraliaattendedatheatreperformance,
comparedto16.8%in2005-06;12%wenttoamusicaloropera,comparedto14.8%in
2005-06;9%attendedclassicalmusicconcertscomparedto10.8%in2005-06;anddance
performancesattracted11%ofpeoplein2009-10comparedto9.7%in2005-06.In2009-
1017%(comparedto17.6%in2005-06)ofpeopleinthestateattendedothertypesof
performing arts5/6.
Younger people are the most culturally active age group in the state. In the 12 months
prior to April 2009 over two thirds (72%) of Western Australian children aged 5 to 14 years
attended a public library, museum, art gallery or performing arts event at least once outside
school hours7.
Of people aged over 15 years, individuals in the 15 to 34 year age group are the most
culturally active and are the most likely people to attend a performing arts event, with annual
attendance rates of between 64.4% (25 to 34 year olds) and 68.4% (18 to 24 years olds). Popular
music concerts are the most attended performing arts events by people in these age groups8.
Indigenous Western Australians are also highly culturally engaged. In 2008, one third (29%)
of Indigenous persons aged 15 years and older living in Western Australia participated in at
least one Indigenous creative activity, with the most popular activities being art and craft and
writingorstory-telling;whilemorethantwothirds(70%)attendedatleastoneIndigenous
cultural event9.
4 Australian Bureau of Statistics (2013) Arts and Culture in Australia, A Statistical Overview Category Number 4172.0, Commonwealth of Australia, Canberra
5 Australian Bureau of Statistics (2012) AttendanceatSelectedCulturalVenuesandEvents2005-06,CatalogueNumber:4114.0, Commonwealth of Australia, Canberra
6 Australian Bureau of Statistics (2007) AttendanceatSelectedCulturalVenuesandEvents2005-06,CatalogueNumber:4114.0, Commonwealth of Australia, Canberra
7 National Centre for Culture and Recreation Studies, Australian Bureau of Statistics (2012) Culture Report 2012 for Western Australia, Western Australian Department of Culture and the Arts, Perth
8 Australian Bureau of Statistics (2012) AttendanceatSelectedCulturalVenuesandEvents2005-06,CatalogueNumber:4114.0, Commonwealth of Australia, Canberra
9 Australian Bureau of Statistics (2009) 2008 National Aboriginal and Torres Strait Islander Social Survey (NATSISS), Commonwealth of Australia, Canberra
424

10 Committee For Perth
3.2 Internat ional Performing Arts Trends
There is international evidence that the structure of the performing arts system is undergoing
a fundamental shift, with the recorded and broadcast performing arts industry becoming
more concentrated; increasing numbers of small, local, low budget organisations; and a few
verylargenon-profitandcommercialorganisationsgrowinglargerandstagingevermore
elaborate productions on a global scale10.
Withinthisparadigmshift,midsizednon-profitorganisationsareexpectedtoexperiencethe
greatestdifficultiesinattractingadequaterevenuestocovertheircostsandoperacompanies,
symphonyorchestras,balletcompaniesandtheatregroupsservingsmallandmedium-sized
cities in particular will be facing realities of ageing audiences, escalating costs, and static or
even declining funding forcing them to rethink their primary mission – the audiences they
want to reach, and their organisational structure11.
3 .3 Current Attendance Trends in Perth
There is evidence that this shift is having some bearing on performing arts attendance in
Australia and in major east coast cities. Yet the story for Perth is a good one in that overall
performing arts attendance in Perth is rising and, contrary to national and international trends,
this growth is occurring across a wide range of performing arts types and organisations.
A 2011 Australia wide survey of live entertainment industry ticket attendances and revenues
indicates that in 2010 and 2011 Western Australia accounted for between 10% and 11% of
theliveentertainmentindustry(behindNewSouthWales34-36.5%;Victoria31-34%;and
Queensland12.5-12%)12.
HoweverthesamesurveyindicatesthatWesternAustralianattendancefiguresare
significantlyhigherinsomecategoriesthanthisproportionsuggestswiththestate
accountingfor12.8%ofattendanceatballetanddanceperformances;nearly33%ofmulti-
categoryfestivalattendance(thehighestattendancefigureinAustralia);andapproximately
16.5% of attendance at single category festivals.
There are also indicators that Western Australia’s share of the performing arts market is
increasing. For example, in 2011 1,788,262 tickets were sold to live performances in Perth
compared to 1,468,882 tickets in 2009, an increase of 22%.
Ananalysisof2012ticketandaudiencefiguresforindividualcompaniespreparedby
media organisation Crikeyalsoindicatesthatwhileaudiencefiguresformanyofthemajor
performing arts companies and organisations have been stagnating in recent years, Western
Australia’s major theatre, ballet and opera companies have experienced solid growth13.
The analysis compared data from 17 large opera, music, theatre and dance companies from
2007 to 2011. It found that most major Australian performing arts companies are shedding
audiences,andattendancesintotalhavedeclinedby6%overthepastfiveyears.
Of the 17 companies surveyed, 10 have seen declining audiences since 2007. This includes all
six of the largest performing arts companies with audiences of more than 200,000 annually.
Australia’s largest performing arts organisation, Opera Australia, is down about 130,000
attendances from its 2008 peak.
Yet Perth companies are an exception. For example Crikey reported that, from 2007 to 2011,
Black Swan Theatre Company had more than doubled its footprint.
10 McCarthy, Brooks A, Lowell J, Zakaras L (2001) The Performing Arts in the New Era, RAND Corporation, Santa Monica11 Ibid.12 Ernst & Young (2011) Ticket Attendance and Revenue Survey, Live Performance Australia, Melbourne13 Ibid
425
Examining Perth’s Performing Arts Infrastructure 11
In 2011, paid attendance to Black Swan productions increased by 60%, three of the company’s
fivemajorproductionsreachedselloutcapacityandtheseasonofoneproductionwas
extended for an additional week to meet popular demand. Attendances as a percentage of
capacity also grew by 8% (to 85%) despite the company moving performances to the newly
opened State Theatre Centre’s 575 seat Heath Ledger Theatre from the 427 seat Playhouse
Theatre, indicating that the company’s growth was most likely previously constrained by
seating capacity14.
The Western Australian Symphony Orchestra and the Western Australian Ballet have also
experienced more modest but very healthy gains.
Forexample,theWesternAustralianBalletachieveda15%increaseinboxofficeincomein
2011; a 5% increase in main stage attendance and a 220% increase in education and access
participation from 2008 to 201115.
Similarly the Western Australian Symphony Orchestra achieved a 4.5% increase in revenue
from subscriptions and ticket sales from 2010 to 201116.
It is also evident from the annual reports of all three companies that the reported gains can be
at least partially attributed to new creative directions and innovative strategies to engage with
the community and build new audiences. These types of strategies are essential in the current
age of shifting public and audience expectations and Western Australian creative industries
are clearly showing leadership in adapting and capitalising on this change.
3.3.1 Perth International Arts Fest ival
The success of Perth’s original festival, the Perth International Arts Festival (known as the Perth
Festival) established in 1953 also demonstrates the appetite for arts and culture in Perth.
At the completion of the 2013 festival in March this year, with the Lotterywest Festival Films
stilltorun,theFestivalreportedthatithadexceededitsboxofficetargetof$4,800,000,
reached a paid audience of about 190,000, and engaged approximately half a million people
in festival activities and events17.
Together, for a few months of the year, Perth Festival and Fringe World transform Perth into
avibrantmeltingpotofcreativity-reachingvastaudiencesanddemonstratingthatPerth’s
people are hungry for new cultural experiences.
3.3.2 Fr inge World Fest ival
An additional boost to audience numbers has been achieved through the establishment of
the staggeringly successful Fringe World festival.
The inaugural Fringe World festival was held in 2012. According to an impact assessment of
the 2012 festival prepared by BOP Consulting, Fringe World attracted audience numbers in
excessof150,000peopleinitsfirstyear,50,438ofwhomattendedticketedperformances,
generatingboxofficerevenueofover$1,038,50018.
But that was just the start. Figures from the 2013 Fringe World indicate that this year’s ticket
salesmorethandoubledto110,000withmorethan$2,000,000spentthroughtheboxoffice
andtotalattendance(tobothticketedandnon-ticketedevents)reaching215,00019.
14 Ernst & Young (2009) Ticket Attendance and Revenue Survey, Live Performance Australia, Melbourne15 Western Australian Ballet Company (2012) Annual Report 2011, Western Australian Ballet Company, Perth16 Western Australian Symphony Orchestra (2012) WASO Annual Report 2011, Western Australian Symphony Orchestra, Perth17 Perth International Arts Festival (2013) Media Release Perth International Arts Festival Draws to a Close 4 March 2013, http://www.perthfestival.com.au/About/Media/Media-Releases/
18 BOP Consulting (2012) Impact Assessment of the Fringe World Festival, Artrage, Perth19 Artrage (2013) Fringe World Festival 2013 Results Snapshot, Unpublished
426

12 Committee For Perth
Yet,perhapsevenmoresignificantisthefactthatFringeWorldappearstohavesuccessfully
tapped into new cultural audiences in Perth, substantially increased city vibrancy, made people
feel safe in the city centre, given people a new sense of pride in the city and helped to
re-invigoratePerth’sartsandculturalscene.
A survey of more than one thousand 2012 Fringe World audience members and more than two
thousand eight hundred 2013 attendees indicated that:
• 44%of2012respondentsand49%of2013respondentsarenotregularattendeesatarts
events.
• 76%of2012respondentsand70%of2013respondentswouldhavestayedathomeifFringe
World had not been happening.
• 86%ofrespondentsin2012and90%of2013respondentssaidthatFringeWorldincreased
their pride in Perth.
• 83%of2012respondentsand89%of2013respondentssaidthatFringeWorldpromoted
Perth as a city that is globally connected.
• 99%saidthattheyintendedtoattendFringeWorldagainin2013and201420.
This shows that Perth’s people see arts and culture as central to Perth’s development as a
vibrant, competitive, globally connected city, and that new events like Fringe World are making
a contribution to the city that goes far beyond entertainment or dollars and cents – they are
positively contributing to Perth’s competitive identity. Critically, it also indicates that there is
untapped demand for arts and cultural events in Perth.
Fringe World Director Marcus Canning has also observed that Fringe World has had a positive
impact on Perth’s local arts and culture scene.
“From the performing arts sector, one thing that I’ve really been pleased with at the Fringe
this year is the growth of local practitioners plugging in,” he said, saying local performers “saw
the success of the 2012 festival and have all really jumped on board”... “The excitement is
palpable.”21
3 .4 Contr ibut ion to the Economy
Cultivating Perth’s arts and cultural resurgence is in the best interests of both our society and our
economy.
Theartsandculturalsectorisasignificantandgrowingpartoftheeconomy.In2009-10
Australianhouseholdsspentfourpercentoftheirincome—morethan$19billion—onartsand
cultural goods and services, demonstrating the economic value of culture in everyday life22.
InPerth,a2007studyestimatedthedirectoutputofPerth’screativeindustriestobe$4.6billion,
andtotalvalue(includingflowoneffects)wasestimatedtobeinexcessof$10.6billion.Ofthis
themusicandperformingartssectorsgeneratedanestimated$331millionineconomicoutput23.
Itisreasonabletoassumethatthisoutputislikelytohaveincreasedsignificantlyinthepast6
years, with Fringe World alone estimated to have generated spending within the Perth economy
(includingapplicationofrelevantgrossvalueaddedmultiplier)ofover$14.5millioninitsfirstyear24.
20 Ibid.21 Eltham B, (2013) And the centre of arts innovation is … Perth, Crikey 15 February 2013, www.crickey.com.au22 Australian Government (2012) Creative Australia – The National Cultural Policy, Commonwealth of Australia, Canberra http://creativeaustralia.arts.gov.au/full-policy/
23 Telsis Consulting et al (2007) Perth’s Creative Industries – An Analysis, Department of Culture and the Arts, Government of Western Australia, Perth
24 BOP Consulting (2012) Impact Assessment of the Fringe World Festival, Artrage, Perth
427

Examining Perth’s Performing Arts Infrastructure 13
3 .5 Populat ion Growth
Population growth alone will drive demand for more arts and cultural activities, events and
infrastructure in Perth’s future, and this growth is occurring at a rapid pace.
At June 2011, the population of Greater Perth was 1.83 million people25, which was 78% of the
state’s total population. Between 2001 and 2011, Greater Perth increased by 380,100 people,
or 26%. This was the fastest growth of all capital cities in Australia26.
It is further predicted that Perth will grow to a population of between 2.1 million and 2.45
million by the year 2021 and between 2.8 million and 4.2 million by 205627. Based on historic
growth patterns in Perth and the economic outlook for the region, we believe that a medium
to high growth scenario is most likely.
This means that, even if performing arts attendance rates remain the same, Perth’s performing
arts sector will need to cater for audience growth of between 24% and 34% just to keep pace
with growth needs over the next eight years.
Longer term it is reasonable to expect that Perth will need to cater for growth in demand of
approximately 80% to more than 100% by 2056.
Accommodating this demand will require a doubling in the capacity of our performing arts
infrastructureinjustover40years-meaningthatwhatPerthhasslowlybuiltovermorethan
100 years now has to be reproduced in just 40.
3.6 Tourism Growth
It is fair to assume that what is good for residents is also good for visitors. Therefore it can be
expected that as Perth grows so too will the number of visitors that the region attracts.
National projections for Perth’s tourism sector predict only modest growth however Tourism
WesternAustraliahasatargettodoublethevalueoftourisminWesternAustralia-from$6
billionayearin2010to$12billionayearby202028.
This is a target which the organisation believes is achievable and will require the development
of seven ‘strategic pillars’ which include positioning WA as a recognised events destination
for locals and visitors and providing every visitor with the opportunity to have an Aboriginal
tourismexperience-bothgoalsinwhichtheartsandcultural,andperformingartssectors
should play an important role.
The need for an Indigenous cultural centre in Perth with the inclusion of a space for
performing arts has also been well documented and supported, and the demand for such a
centre is likely to substantially increase as demand for cultural tourism in the State grows.
25 Australian Bureau of Statistics (2012) 2011 Census of Population and Housing, Commonwealth of Australia26 Ibid.27 Australian Bureau of Statistics (2011) Regional Population Growth Catalogue Number: 3218.0, Commonwealth of
Australia, Canberra28 Tourism Western Australia (2012) AnnualReport2011-12, Government of Western Australia, Perth
428
14 Committee For Perth
3.7 Key Findings
• Perth’sartsandculturalsectoristhriving.Attendanceatperformingartseventsisincreasing
andthereissignificantevidencethatPerth’speoplenotonlyhaveagrowingappetitefor
arts and culture but that there remains untapped potential for audience growth.
• Perth’spopulationisexpectedtoincreaseby24%to34%(from2011to2021)whichwill
verysignificantlyincreasedemandforperformingartsintheregionandplaceenormous
pressure on existing arts and culture infrastructure over the next decade.
• LongertermitisreasonabletoexpectthatPerthwillneedtocaterforgrowthin
population and associated arts and culture demand of between 80% and 100% by 2056
– meaning that the region will need to effectively double its infrastructure capacity in just
40 years.
• Evidencesuggeststhatperformingartsattendancehasalreadyincreasedinthepastthree
years with three of the state’s top performing arts companies reporting solid growth.
• ThestronggrowthreportedbyStateTheatreCompanyBlackSwanin2011coincided
withtheopeningofthenewStateTheatreCentre,whichsignificantlyincreased
performance seating capacity.
• Continuedgrowthofperformingartscompaniesinthemediumtolongertermcouldbe
constrained by lack of seating capacity within existing venues.
• ThePerthInternationalArtsFestivalperformancesandeventscontinuetoreachvery
large audiences and engage close to one third of the region’s population, indicating that
there is broad demand for arts and cultural activities.
• Perth’sFringeWorldhasdeliveredamajorboosttothecityandthelocalartsand
cultural sector by attracting large, new audiences and activating the central area and
reinvigorating the local arts and cultural scene.
• IndigenousWesternAustraliansareamongthemostculturallyactiveintheState,with
more than two thirds of Indigenous people aged over 15 participating in at least one
Indigenous cultural event per annum, reinforcing the need for Perth to have its own
dedicated Indigenous performing arts space.
• ThereiswidespreadacknowledgementoftheneedforanIndigenousCulturalCentre
that includes performing arts space inPerthtomeetlocalIndigenous,non-Indigenous
and tourist demand for Indigenous performing arts and culture. It is also evident that
demand for a dedicated Indigenous cultural space is likely to increase with population
andtourismgrowth,andspecificallywithgrowthinculturaltourism.
• WATourismhasatargettodoublethevalueoftourisminWAby2020whichislikelyto
increase demand for arts and culture in the Perth region.
• TheTourismWAstrategytogrowtourismincludesgoalstoraiseWA’sroleasanevent
destination and deliver Aboriginal tourism experiences to visitors – both goals in which
the arts and cultural sector can play a vital role.
429
Examining Perth’s Performing Arts Infrastructure 15
4.0 Audit of Perth’s Existing Performing Arts Facilities
In order to identify whether Perth’s existing performing arts infrastructure is adequate to
meet current demand and what investment will be required to meet demand in the medium
and long term, the Committee for Perth commissioned Hames Sharley Pty Ltd to undertake
a major audit of existing performing arts venues and facilities in Perth and Peel. The audit
focused on commercial venues that have a seating capacity of 200 or more, that offer ticketed
performances and are available for public hire. The selection of venues considered was
informed by discussion with the Department of Culture and the Arts.
35 venues from across the region met the required criteria and were included in the study,
ranging from intimate indoor theatre spaces to large outdoor arenas and stadia.
4 .1 Index of Venues and Map Reference Numbers
The following table provides reference to the numbering of the venues on the map (located on
page 18). Detailed information on each venue is shown in alphabetical order in Appendix B.
430

16 Committee For Perth
Map No. Venue Address
1 Bassendean Steel Blue Oval Cnr of Guildford Road and West Road, Bassendean
2 Belvoir Amphitheatre 1177 Great Northern Highway, Upper Swan
3 Challenge Stadium Stephenson Avenue, Mount Claremont
4 Claremont Showgrounds Equestrian Centre, Graylands Road, Claremont
5 Crown Theatre Perth Great Eastern Highway, Burswood
6 Don Russell Performing Arts Centre Murdoch Road, Thornlie
7 Fremantle Arts Centre 1 Finnerty Street, Fremantle
8 Fremantle Town Hall 8 William Street, Fremantle
9 His Majesty’s Theatre 825 Hay Street, Perth
10 Joondalup Arena Kennedya Drive, Joondalup
11 Kalamunda Performing Arts Centre 48 Canning Road, Kalamunda
12 Kings Park Fraser Avenue, Kings Park
13 Koorliny Theatre 20 Sulphur Road, Kwinana
14 Mandurah Performing Arts Centre Ormsby Terrace, Mandurah
15 Metcalfe Theatre at the Empyrean 12 Lake Street, Northbridge
16a NIB Stadium 310 Pier Street, Perth
16b Dolphin Theatre UWA, 35 Stirling Highway, Crawley
16c New Fortune Theatre UWA, 35 Stirling Highway, Crawley
16d Octagon Theatre UWA, 35 Stirling Highway, Crawley
16e Sunken Gardens UWA, 35 Stirling Highway, Crawley
17 Winthrop Hall UWA, 35 Stirling Highway, Crawley
18 Paterson's Stadium Subiaco Road, Subiaco
19 Perth Arena 700 Wellington Street, Perth
20 Perth Concert Hall 5 St Georges Terrace, Perth
21 Perth Zoo 20 Labouchere Road, South Perth
22 Quarry Amphitheatre Reabold Hill, Oceanic Drive, City Beach
23 Regal Theatre 474 Hay Street, Subiaco
24 Riverside Theatre, PCEC, 21 Mounts Bay Road, Perth
25 Short Street Theatre 1 Short Street, Fremantle
26 Speigletent Perth Cultural Centre (mobile venue)
27 State Theatre Centre 174-176WilliamStreet,Perth(cnrRoeSt)
28 Subiaco Arts Centre 180 Hamersley Road, Subiaco
29 Swan Park Theatre Gray Drive, Midvale
30 The Bakery 233 James Street, Northbridge
31 WACA Stadium WACA grounds, Nelson Crescent, East Perth
Some venues were investigated and excluded on the basis that they did not meet all of the
requirements of the audit as outlined above. These include:
• PICA,Northbridge
• BlueRoom,Northbridge
• HarbourTheatre,Fremantle
• SomervilleAuditorium,UWA,Crawley
431

Examining Perth’s Performing Arts Infrastructure 17
4 .2 Summary of Audited Venues by Pr imary Use and Capacity
A number of the venues were used for a variety of purposes such as theatre and concerts and did not have
aprimarypurpose.Wherethisisthecase,morethanoneprimaryusehasbeenidentified.
Map No. Venue
Seating Capacity
Primary Use
Thea
tre
Co
ncer
ts
Co
mm
unity
Bas
ed
Perf
orm
ance
s
Dan
ce
Mus
ical
s
Op
era
Bro
ad r
ang
e o
f p
erfo
rmin
g a
rts
Co
nfer
ence
s
Cal
isth
enic
s
Spo
rt
1 Bassendean Steel Blue Oval 2,500 X X
2 Belvoir Amphitheatre 4,500 X
3 Challenge Stadium 5,031 X X
4 Claremont Showgrounds 55,000 X X X
5 Crown Theatre Perth 2,311 X
6 Don Russell Performing Arts Centre 210 X
7 Fremantle Arts Centre 3100 X
8 Fremantle Town Hall 294 X
9 His Majesty’s Theatre 1,240 X X X X X
10 Joondalup Arena 25,000 X X
11 Kalamunda Performing Arts Centre 257 X
12 Kings Park 6000 X X X X X X
13 Koorliny Theatre 244 X
14 Mandurah Performing Arts Centre 800 X
15 Metcalfe Theatre at the Empyrean 280 X
16a NIB Stadium 35,000 X X
16b Dolphin Theatre 198 X
16c New Fortune Theatre 250 X
16d Octagon Theatre 758 X
16e Sunken Gardens 385 X
17 Winthrop Hall 974 X
18 Paterson's Stadium 43.405 X X
19 Perth Arena 15,500 X
20 Perth Concert Hall 1,731 X
21 Perth Zoo 4,500 X X
22 Quarry Amphitheatre Reabold Hill 556 X
23 Regal Theatre 1,086 X
24 Riverside Theatre, 2,500 X X
25 Short Street Theatre 215 X
26 Speigletent 320 X
27 State Theatre Centre 809 X
28 Subiaco Arts Centre 305 X
29 Swan Park Theatre 594 X X
30 The Bakery 650 X
31 WACA Stadium 24,500 X X X
432

18 Committee For Perth
433

Examining Perth’s Performing Arts Infrastructure 19
4 .3 Summary of Audited Venues by Direct ions 2031 Regions
The following table provides a breakdown of venues into the Directions 2031 planning regions.
Map No. Venue Address
North East Region
2 Belvoir Amphitheatre 1177 Great Northern Highway, Upper Swan NE
11 Kalamunda Performing Arts Centre 48 Canning Road, Kalamunda NE
North West Region
10 Joondalup Arena Kennedya Drive, Joondalup NW
Central Region
1 Bassendean Steel Blue Oval Cnr of Guildford Road and West Road, Bassendean C
3 Challenge Stadium Stephenson Avenue, Mount Claremont C
4 Claremont Showgrounds Equestrian Centre, Graylands Road, Claremont C
5 Crown Theatre Perth Great Eastern Highway, Burswood C
7 Fremantle Arts Centre 1 Finnerty Street, Fremantle C
8 Fremantle Town Hall 8 William Street, Fremantle C
9 His Majesty’s Theatre 825 Hay Street, Perth C
12 Kings Park Fraser Avenue, Kings Park C
15 Metcalfe Theatre at the Empyrean 12 Lake Street, Northbridge C
16 NIB Stadium 310 Pier Street, Perth C
17a Dolphin Theatre UWA, 35 Stirling Highway, Crawley C
17b New Fortune Theatre UWA, 35 Stirling Highway, Crawley C
17c Octagon Theatre UWA, 35 Stirling Highway, Crawley C
17d Sunken Gardens UWA, 35 Stirling Highway, Crawley C
17e Winthrop Hall UWA, 35 Stirling Highway, Crawley C
19 Paterson's Stadium Subiaco Road, Subiaco C
19 Perth Arena 700 Wellington Street, Perth C
20 Perth Concert Hall 5 St Georges Terrace, Perth C
21 Perth Zoo 20 Labouchere Road, South Perth C
22 Quarry Amphitheatre Reabold Hill Oceanic Drive, City Beach C
23 Regal Theatre 474 Hay Street, Subiaco C
24 Riverside Theatre PCEC, 21 Mounts Bay Road, Perth C
25 Short Street Theatre 1 Short Street, Fremantle C
26 Speigletent Perth Cultural Centre (mobile venue) C
27 State Theatre Centre 174-176WilliamStreet,Perth(cnrRoeSt) C
28 Subiaco Arts Centre 180 Hamersley Road, Subiaco C
29 Swan Park Theatre Gray Drive, Midvale C
30 The Bakery 233 James Street, Northbridge C
31 WACA Stadium WACA grounds, Nelson Crescent, East Perth C
South West Region
13 Koorliny Theatre 20 Sulphur Road, Kwinana SW
South East Region
6 Don Russell Performing Arts Centre Murdoch Road, Thornlie SE
Peel Region
14 Mandurah Performing Arts Centre Ormsby Terrace, Mandurah P
434

20 Committee For Perth
4.4 Stakeholder feedback
During the process of conducting the audit and preparing this report, informal feedback was
received from a number of stakeholders which suggested that:
• thereisaneedformoretheatreswithacapacityof800to1,000;
• thereisashortageofaffordable,appropriatelysizedrehearsalspaceintheregion;
• someperformingartscompanieshaveaneedforappropriateadministrationspace;
• Perthisinneedofadedicatedrecitalhallorappropriatelysizednewmusicvenue;and
• venuemaintenanceandcostisanongoingproblemthatislimitingthefinancial
sustainability of performing arts venues in the region.
4.5 Key Findings
• Thereare35commercialvenuesinthePerthandPeelregionwithaseatingcapacityof
200 or more that are currently used as performing arts venues.
• Ofthese,22areindoorvenuesand13areoutdoorvenuesorstadiums.
• 24ofthesevenueshaveaseatingcapacityof500ormore.
• 26arepurposebuiltperformingartsvenueswhile9areeitherstadiumsthatareprimarily
usedforsportingevents,oroutdoorparks/gardensthathavebeensubsequently
developed as performing arts venues.
• Thevenuesarerelativelydispersed,withfouroftheregion’smajorvenueslocatedmore
than 20 kilometres away from the Perth city centre (reflecting the dispersed nature of the
region’s urban growth).
• Stakeholderfeedbacksuggeststhatthereisaneedformoretheatreswithaseating
capacity of between 800 and 1,000 and that there is a shortage of suitable affordable
rehearsal and administration space in the region
• Stakeholderfeedbacksuggeststhatfundingforvenuemaintenanceisasignificant
ongoing issue for performing arts venues in the region.
435
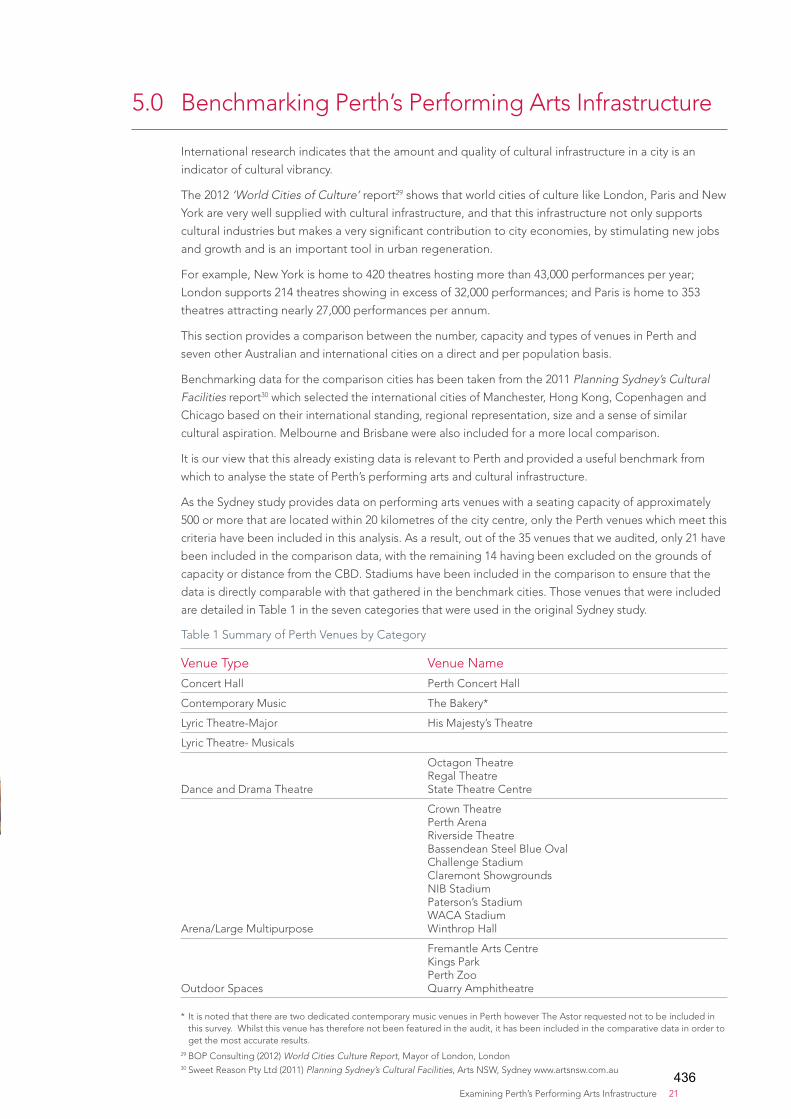
Examining Perth’s Performing Arts Infrastructure 21
5.0 Benchmarking Perth’s Performing Arts Infrastructure
International research indicates that the amount and quality of cultural infrastructure in a city is an
indicator of cultural vibrancy.
The 2012 ‘World Cities of Culture’ report29 shows that world cities of culture like London, Paris and New
York are very well supplied with cultural infrastructure, and that this infrastructure not only supports
culturalindustriesbutmakesaverysignificantcontributiontocityeconomies,bystimulatingnewjobs
and growth and is an important tool in urban regeneration.
For example, New York is home to 420 theatres hosting more than 43,000 performances per year;
London supports 214 theatres showing in excess of 32,000 performances; and Paris is home to 353
theatres attracting nearly 27,000 performances per annum.
This section provides a comparison between the number, capacity and types of venues in Perth and
seven other Australian and international cities on a direct and per population basis.
Benchmarking data for the comparison cities has been taken from the 2011 Planning Sydney’s Cultural Facilities report30 which selected the international cities of Manchester, Hong Kong, Copenhagen and
Chicago based on their international standing, regional representation, size and a sense of similar
cultural aspiration. Melbourne and Brisbane were also included for a more local comparison.
It is our view that this already existing data is relevant to Perth and provided a useful benchmark from
which to analyse the state of Perth’s performing arts and cultural infrastructure.
As the Sydney study provides data on performing arts venues with a seating capacity of approximately
500 or more that are located within 20 kilometres of the city centre, only the Perth venues which meet this
criteria have been included in this analysis. As a result, out of the 35 venues that we audited, only 21 have
been included in the comparison data, with the remaining 14 having been excluded on the grounds of
capacity or distance from the CBD. Stadiums have been included in the comparison to ensure that the
data is directly comparable with that gathered in the benchmark cities. Those venues that were included
are detailed in Table 1 in the seven categories that were used in the original Sydney study.
Table 1 Summary of Perth Venues by Category
Venue Type Venue Name
Concert Hall Perth Concert Hall
Contemporary Music The Bakery*
LyricTheatre-Major His Majesty’s Theatre
LyricTheatre-Musicals
Dance and Drama Theatre
Octagon Theatre Regal Theatre State Theatre Centre
Arena/LargeMultipurpose
Crown Theatre Perth Arena Riverside Theatre Bassendean Steel Blue Oval Challenge Stadium Claremont Showgrounds NIB Stadium Paterson’s Stadium WACA Stadium Winthrop Hall
Outdoor Spaces
Fremantle Arts Centre Kings Park Perth Zoo Quarry Amphitheatre
* It is noted that there are two dedicated contemporary music venues in Perth however The Astor requested not to be included in this survey. Whilst this venue has therefore not been featured in the audit, it has been included in the comparative data in order to get the most accurate results.
29 BOP Consulting (2012) World Cities Culture Report, Mayor of London, London30 Sweet Reason Pty Ltd (2011) Planning Sydney’s Cultural Facilities, Arts NSW, Sydney www.artsnsw.com.au
436

22 Committee For Perth
5.1 Benchmark Data: Number, Type and Capacity of Venues
The following tables provide a summary of the comparative data collected for Perth and each of the comparison
cities.
Table 2 provides a direct comparison of the number and average capacity of venues across seven venue
categories – concert hall, contemporary music, lyric theatre (major), lyric theatre (musicals), dance and drama
theatres,arena/largemultipurposetheatres,andoutdoorspaces.
Table 3 compares the number of venues per category on a per capita basis (i.e. number of venues per million people).
Table 2 Number and Average Seating Capacity of Venues 1
Venue Type Sydney Melbourne Brisbane Manchester Copenhagen Chicago Hong Kong Perth Average
Concert Hall
4 venues Average capacity 1,605
6 venues Average capacity 1,677
6 venues Average capacity 1,243
4 venues Average capacity 2,286
5 venues Average capacity 1,225
3 venues Average capacity 1,870
2 venues Average capacity 1,727
1 venue PCH Capacity 1,731 3.9
Contemporary Music
4 venues Average capacity 1,638
7 venues Average capacity 1,989
3 venues Average capacity 5,067
1 venue Capacity 1,300
6 venues Average capacity 783
9 venues Average capacity 1,372 0
2 venues Average Capacity 775 3.875
LyricTheatre-Major
1 venue Capacity 1,507
1 venue Capacity 2,079
1 venue Capacity 2,000
2 venues Average capacity 1,825
2 venues Average capacity 1,546
3 venues Average capacity 3,697
1 venue Capacity 1,734
1 venue HMT Capacity 1,240 1.5
LyricTheatre-Musicals
3 venues Average capacity 1,867
4 venues Average capacity 1,610 0
3 venues Average capacity 1,492
2 venues Average capacity 856
5 venues Average capacity 1,822
6 venues Average capacity 1,133 0 2.87
Dance and Drama Theatre
6 venues Average capacity 724
7 venues Average capacity 671
2 venues Average capacity 795
4 venues Average capacity 586
3 venues Average capacity 583
4 venues Average capacity 718
3 venues Average capacity 905
3 venues Average capacity 884 4
Arena/LargeMultipurpose
10 venues Average capacity 21,700
7 venues Average capacity 33,086
8 venues Average capacity 17,920
3 venues Average capacity 37,500
2 venues Average capacity 22,500
2 venues Average capacity 20,959
5 venues Average capacity 4,980
10 venues Average capacity 20,922 5.87
Outdoor Spaces 5 4 2 0 2 5 4
4 venues Average capacity 3,539 3.25
**TOTAL 33 36 22 17 22 31 21 21 25.375
Source: Sweet Reason Pty Ltd, 2011, Planning Sydney’s Cultural Facilities, Arts NSW, Sydney
* Benchmarkingdatawassourcedthroughdesktopresearch,anddatacollectedwasconfirmedbyartssectorrepresentativesofeachcity. ItwasnotedbySweetReasonPtyLtdthatthelevelofdetailgatheredforSydneyvenueswassignificantlymoreextensivethanthatcollectedfor the comparator cities. Similarly, more detailed information was available for artist run initiatives in Sydney, Melbourne and Brisbane than for comparable international venues.
437

Examining Perth’s Performing Arts Infrastructure 23
Table 3 Number of venues per million people
Venue Type Sydney Melbourne Brisbane Manchester Copenhagen Chicago Hong Kong Perth Average
Concert Hall 0.8 1.5 3.3 1.5 2.6 0.3 0.3 0.5 1.35
Contemporary Music 0.9 1.75 1.7 0.4 3.15 0.9 0 1.1 1.2
LyricTheatre-Major 0.2 0.25 0.55 0.8 1.0 0.3 0.14 0.55 0.47
LyricTheatre-Musicals 0.7 1 0 1.15 1.0 0.5 0.8 0 0.64
Dance and Drama Theatre 1.3 1.75 1.1 1.5 1.6 0.4 0.4 1.7 1.2
Arena/LargeMultipurpose 2.2 1.75 4.4 1.15 1.0 0.2 0.7 5.5 2.1
Outdoor Spaces 1.1 1 1.1 0 1.0 0.5 0.6 2.2 0.94
A number of observations are immediately apparent when comparing Perth to the benchmarked cities:
• ThetotalnumberofvenuesinPerthiscomparablewithothercities,howeverPerth’svenuestendto
be smaller.
• Perthisundersuppliedwithconcerthalls,withonevenuecomparedtoanaverageof3.9acrossthe
benchmarked cities, and 0.5 venues per million people compared to an average of 1.35 venues per
million.
• Perthhasonlyonelyrictheatrewithaseatingcapacityof1,240,comparedtoanaverageof1.5inthe
benchmarked cities with an average seating capacity of 2,055. This is, however, slightly above the per
capita average on a per population basis.
• Perthdoesnothaveamajorlyrictheatrededicatedtomusicals.
• Perthhasjust2.0dedicatedcontemporarymusicvenuescomparedtoanaverageof3.9inthe
benchmarked cities, however this is comparable with the city average on a per capita basis, with Perth
having 1.1 venues per million people compared to an overall average of 1.2.
• Perthisrelativelywellservedwithdanceanddramatheatres(with3comparedtothebenchmarked
average of 4) and 1.7 venues per million people compared to an average of 1.2.
• Perthcomparesfavourablyinregardtosupplyofarenas/largemultipurposevenues,howeveritis
noted that this is partially due to the large number of sports stadiums in the region that are only
occasionally used as performing arts venues. This may be due to Perth’s climate, which suits outdoor
events in summer, but could also reflect a lack of purpose built, large multipurpose venues in the
region, particularly prior to the development of the Perth Arena. Despite this Perth’s supply of indoor
arenasandlargemultipurposevenuesisgenerallyconsistentwiththeaverage-andhasbeenvery
significantlyboostedbytheconstructionofthePerthArena.
• Perthiswellsuppliedwithoutdoorperformancespaces.
438

24 Committee For Perth
A further comparison of performing arts infrastructure within each of the cities is provided
by comparing the total number of seats and venues in the benchmarked cities on a per
population basis.
Table 4 compares the total number and seating capacity of venues in Perth with those in the
benchmark cities.
Table 4: Number of seats and venues surveyed for each city (including outdoor venues and stadiums)
City Population* Total SeatsSeats Per
1,000 PeopleTotal
Venues
Venues Per 1,000,000
Population
Chicago 9,700,000 136,448 14 31 3.2
Copenhagen 1,894,521 62,380 32.9 22 11.5
Hong Kong 7,100,000 39,601 5.6 21 2.9
Manchester 2,600,100 132,110 50.8 17 6.5
Melbourne 4,000,000 290,317 72.6 36 9
Brisbane 1,800,000 181,104 100.6 22 12
Sydney 4,500,000 272,021 60.5 33 7.3
Perth 1,800,000 230,551 128.1 21 11.7
Average N/A 167,954 58.13 25.38 8
Source: Sweet Reason Pty Ltd, 2011, Planning Sydney’s Cultural Facilities.
* It is noted that Planning Sydney’s Cultural Facilities was prepared in 2011. As a result the population statistics included are outdated but have not been altered due to the need to ensure the data provides an accurate representation of facilities/populationatthetimeofcollection.
ItshouldalsobenotedhoweverthatthefiguresforPertharecorrectasofendof2012inordertocapturethemorerecently opened West Australian State Theatre and Perth Arena in the data.
439

Examining Perth’s Performing Arts Infrastructure 25
Table 5 provides a comparison between the total number and seating capacity of venues
in the benchmark cities excluding outdoor venues and stadiums. These venues have been
excluded due to the comparatively large number of these venue types in Perth and their
limited availability for performing arts as well as limitations in data availability for some
international venues. Please note that indoor stadiums have not been excluded.
Table 5: Number of seats and venues surveyed for each city (excluding outdoor venues and outdoor stadiums)
City Population Total SeatsSeats Per 1,000
PeopleTotal
Venues
Venues Per 1,000,000
Population
Chicago 9,700,000 49,330 5.0 25 2.5
Copenhagen 1,894,521 27,380 14.5 19 9.5
Hong Kong 7,100,000 39,601 5.6 17 1.7
Manchester 2,600,100 42,110 16.2 16 5.4
Melbourne 4,000,000 66,717 16.7 29 6.3
Brisbane 1,800,000 39,046 21.7 16 6.7
Sydney 4,500,000 70,521 15.7 25 4.2
Perth 1,800,000 33,490 18.6 12 6.6
Average N/A 46,024 14.25 19.9 5.36
Source: Sweet Reason Pty Ltd, 2011, Planning Sydney’s Cultural Facilities.
* It is noted that Planning Sydney’s Cultural Facilities was prepared in 2011. As a result the population statistics included are outdated but have not been altered due to the need to ensure the data provides an accurate representation of facilities/populationatthetimeofcollection.
ItshouldalsobenotedhoweverthatthefiguresforPertharecorrectasofendof2012inordertocapturethemorerecently opened West Australian State Theatre and Perth Arena in the data.
These comparisons indicate that:
• Perthhasfewervenuesoverallthantheaverage(21asopposedtoanaverageof25)but
is well served on a seating per capita and venue per capita basis.
• IncludingoutdoorstadiumsandvenuesPerthhasthelargestnumberofseatsavailable
percapitaofanyofthebenchmarkedcitiesalthoughitisnotedthatasignificant
proportion of these seats are within stadiums which are primarily for sporting use.
• ExcludingoutdoorvenuesandstadiumsthenumberofseatsavailablepercapitainPerth
is well above the overall average but is below Copenhagen and Brisbane.
• Perthalsohasahighernumberofvenuespercapitathantheaverage,althoughthe
region has fewer venues per million people than Copenhagen and Brisbane.
• Thereisageneraltrendformediumsizedcitiestohavealargernumberofvenuesand
seats per capita than major cities.
• Itisnotedthatthequalityofvenueshasnotbeenconsideredinthisanalysisanditis
likely that some venues are less attractive and functional for users than others; and that
some of the cities included in this analysis may have higher quality venues than others.
440

26 Committee For Perth
5.2 Observed Trends in Performing Arts Infrastructure
The report Planning for Sydney’s Cultural Facilities makes some additional, general
observations arising from the examination of the performing arts life in the benchmark cities.
A summary of these observations is outlined below:
• Melbourne,ManchesterandChicagohaveallundertakencarefulrenovationsofold
venues in the last few decades as well as building new ones. Cities that have invested
in their performance venue infrastructure have developed reputations for being lively,
culturally vibrant cities with a wide range of performance experiences on offer.
• Insomecases,investmentinexistingandnewinfrastructurehasledtoaresurgenceofa
theatre district and helped to enliven the surrounding city centre.
• Themostsuccessfulandactivevenuesareoftenthosewiththemoststrikingarchitectural
features – whether in the meticulous restoration of former glory or in the creation of bold,
striking new buildings.
• Citieswithagoodsupplyofvenuestendtohaveamoreactiveculturallifeatmanylevels
throughout the community.
• Aclearandstrongthreademerged–thatculturalfacilitiesaremoresuccessfulwhenthey
are aggregated and integrated within a particular precinct.
• ItwasobservedinthecasesofMelbourneandChicago(and,incidentallyfromcommon
experience in other cities including London and New York) that a critical mass of venues
within one precinct can provide a vibrancy which is more than the sum of its parts. Once
theseprecinctsareestablished(orrevived),theytendtobecomeasignificanttourist
attraction and are promoted as a key feature of the character of a city.
• Culturaldevelopmentprovidesanopportunitytorevitalisepreviously‘dead’urbanspace.
Salford Quays in Manchester, Millennium Park in Chicago, and the planned Federation
Square East development in Melbourne are all cited as examples of the regeneration of
urban/industrialvoidsintoactive,centralculturalenvironments.
441
Examining Perth’s Performing Arts Infrastructure 27
5 .3 Key Findings
• Perthgenerallycomparesfavourablywithothercitiesonanumberofvenuesandseating
per capita basis indicating that Perth has an active and vibrant performing arts sector.
• Perthisverywellservedinsomeinfrastructurecategories(particularlylargeoutdoor
venues) but relatively poorly served in others.
• Perthhasnomajorlyrictheatrethatcatersspecificallyformusicals.
• Perthhasanundersupplyofconcerthallswith0.5venuespermillionpeoplecomparedto
an average of 1.35 venues per million across the benchmarked cities.
• Perthhasaslightundersupplyofcontemporarymusicvenues.
• Perthappearstoberelativelywellservedwithdanceanddramatheatres,although
stakeholderfeedbackindicatesthattheatrevenuesarehardtofind,andthereisaneed
for more (affordable) theatres with between 800 to 1,000 seat capacities. This suggests
that there is either a disconnect between perception as opposed to actual supply, or
between the number of venues and the quality of venues (i.e. the number of venues that
are attractive to local performers).
• Perthcomparesfavourablyinregardtothenumberofarenas/largemulti-purposevenues
in the region, the capacity of which has been substantially boosted by the opening of the
Perth Arena.
• Perthhasacomparativelyhighproportionofstadiumsthatareprimarilyforsportinguse
but are also occasionally used for performing arts events. This may reflect the popularity
of outdoor events in the region, but could also be a reflection on the lack of large
purpose built venues in the region, particularly prior to the construction of the Perth
Arena.
• Performingartsinfrastructureintheregionisprimarilyconcentratedininnerandmiddle
suburbs, with the only distinct cluster being in Northbridge.
• Internationalresearchindicatesthatconcentratingnewperformingartsinfrastructure
within a cultural precinct or theatre district has been shown to both contribute to the
success of venues and to generate vibrancy within the precinct that is ‘more than the sum
of its parts’.
• Anumberofcitieshaveinvestedinrenovationsofoldvenuesinthelastfewdecades
as well as building new ones. The report Planning Sydney’s Cultural Facilities found
that cities that have invested in their performance venue infrastructure have developed
reputations for being lively, culturally vibrant cities with a wide range of performance
experiences on offer.
442

28 Committee For Perth
The Committee for Perth supports the
growth of accessible cultural and arts
activities in the Perth region.
443

Examining Perth’s Performing Arts Infrastructure 29
6.0 Conclusions and Recommendations
6.1 Conclusions
Perth’s arts and cultural sector is thriving. Attendance at performing arts events is increasing
andthereissignificantevidencethatPerth’speoplenotonlyhaveagrowingappetiteforarts
and culture but that there remains untapped potential for audience growth.
This trend towards increased demand for arts and cultural events, as well as projected rapid
population and economic growth could direct Perth towards attendance growth up to or even
in excess of 34% by 2021, meaning that Perth’s existing cultural infrastructure, some of which
is already struggling to meet demand, will come under enormous pressure over the next
decade.
In just 40 to 50 years Perth will need adequate performing arts infrastructure to meet the
demand of an estimated population of four million people, meaning that Perth will need
infrastructure that is of comparable size and quality to that in metropolitan Melbourne today.
This means that the number of performing arts venues in Perth will need to approximately
double.
Tourism Western Australia also has a target of doubling the value of tourism in Western
Australiaby2020.Toachievethis,TourismWesternAustraliahasidentifiedsevenstrategic
goals, including positioning WA as a recognised events destination for locals and visitors and
providing every visitor the opportunity to have an Indigenous cultural experience – both goals
that are likely to increase demand for cultural facilities.
It is evident that our existing performing arts infrastructure is not adequate to meet this
growth in demand.
While Perth generally compares favourably with other cities in regards to the number of
venues and seating per capita basis, the region also has some very clear infrastructure gaps.
In particular Perth has an undersupply of lyric theatres and concert halls, and the region’s
supply of contemporary music venues is slightly lower than the average across the
comparison cities.
In addition, while Perth appears to be adequately supplied with dance and drama theatres,
stakeholderfeedbackindicatesthattheatrevenuesarehardtofind,andthereisaneed
for more (affordable) theatres with between 800 to 1,000 seat capacities. This suggests that
there is either a disconnect between perception as opposed to actual supply, or between the
number of venues and the quality of venues (i.e. the number of venues that are attractive to
local performers). This issue may require further investigation.
Stakeholder feedback also suggests that Perth is lacking rehearsal spaces that are affordable
and of an appropriate size; that there is a need for permanent administration and rehearsal
spaces for some companies; and that the cost of venue maintenance is an ongoing issue for
the sector.
444
30 Committee For Perth
There is an opportunity to develop an Indigenous cultural centre which includes performing
arts space in Perth.
International research suggests that when developing new cultural infrastructure, a critical
mass of venues within one precinct both assists in increasing the success of the venue itself
and can also provide a vibrancy which is more than the sum of its parts. Once these precincts
areestablished(orrevived),theytendtobecomesignificanttouristattractionsandare
promoted as a key feature of the character of a city.
Finally, this audit indicates that investment in some types of performing arts infrastructure is
needed to meet current demand in Perth and to enable performing arts attendance rates to
continue to grow.
It is also evident that very substantial medium and long term investment in performing
arts infrastructure will be required to meet the demand generated by population growth –
investment that should aim to position Perth as a global leader in the arts.
6 .2 Recommendations for State Government
Onthebasisofthesefindings,itisrecommendedthat:
1. The State Government prepares a long term Plan for Arts and Cultural Infrastructure that
positions Perth as a global leader in arts and culture.
2. The Infrastructure Plan should be completed within 12 months and funding decisions
flowingfromthePlancommenceinthe2014-15Budget
3. Priority infrastructure requirements to be addressed in the Plan include:
• thedevelopmentofanIndigenousculturalcentreinPerththatincludesperforming
arts space in order to meet the demand for Indigenous cultural events both within
the Indigenous communities and the tourism sector.
• thedevelopmentofanewmajorlyrictheatreinPerththatissuitableforlargescale
opera, ballet and musical theatre.
• whetherthereisaneedforanadditionalconcerthallorrecitalhall.
4. The plan should develop locational criteria for major infrastructure to ensure that it makes
a positive contribution to the urban landscape and capitalises on the potential for city
activationandeconomicbenefits.
445
Examining Perth’s Performing Arts Infrastructure 31
6 .3 Considerat ions for the arts and cultural sector
The scope of works of this report has been to analyse the commercial performing arts
infrastructure that is presently in use in the Perth and Peel region with an audience capacity of
over 200, offering ticketed events and available for public hire.
This report has been fully funded by the Committee for Perth through the membership
contributionsofPerth’sbusiness,civicandlocalgovernmentcommunities.Itisanon-
sectoral, quantitative audit of the infrastructure and, as such, the report does not offer either
commentary or analysis on how the venues are used; how often they are used and how often
they are available; hire costs and restrictions; programs or budgeting for maintenance or
upgrade; or the current condition and quality.
Forexample,despitethereportfindingspositioningPerth’scurrentinfrastructureofferingsin
apositivelight,anauditalonedoesnottakeintoaccounttheneedsofspecificperforming
arts companies, including the need for one of Perth’s major arts bodies the WASO, to have a
suitable permanent administration and rehearsal spaces.
Following a review of the draft report by the Committee for Perth’s Revitalising working group
and representatives of the Chamber of Arts and Culture, it is felt that the report gives rise to
other considerations that require further examination. These include:
• Shouldadditionalworkbeundertakentoexamineindetailthedemandfordanceand
drama theatres in Perth to identify whether there remains a shortage of supply; whether
there is a shortage of high quality theatres; and whether there is a need for additional
rehearsal space in the region?
• ShouldadditionalworkbeundertakentoexamineculturalinfrastructurefundinginPerth
in comparison to other cities and identify potential funding opportunities to ensure that
existing,newandrenewedculturalinfrastructureremainsfinanciallyviablethroughits
projected life cycle?
• Isthecurrentsituationinregardstosuitability,availabilityandaffordabilityof
performance and rehearsal venues acceptable?
• Areadequateconsiderationsforcostsofandfundingfortheongoingmaintenanceand
improvement of existing venues in place?
• Wouldafurtherstudyintoglobalaudienceandliveperformancetrendsand
demographics provide useful information as to the nature of the performing arts venues
that are likely to be in demand in the future?
• Shouldconsiderationbegiventothedevelopmentofaproposaltoincentivise
developerstoprovidealyrictheatre/rehearsalspaceandartsadministrationfacilityas
partofaprecinct/artshubintheElizabethQuaywaterfrontprojectarea?
446
32 Committee For Perth
Appendices
447

Examining Perth’s Performing Arts Infrastructure 33
Appendix A: Full List of References
Australian Bureau of Statistics (2012) AttendanceatSelectedCulturalVenuesandEvents2009-10,
Catalogue Number: 4114.0, Commonwealth of Australia, Canberra
Australian Bureau of Statistics (2012) 2011 Census of Population and Housing, Commonwealth of
Australia, Canberra
Australian Bureau of Statistics (2011) Regional Population Growth Catalogue Number: 3218.0,
Commonwealth of Australia, Canberra
Australian Bureau of Statistics (2009) 2008 National Aboriginal and Torres Strait Islander Social Survey
(NATSISS), Commonwealth of Australia, Canberra
Australian Bureau of Statistics (2007) AttendanceatSelectedCulturalVenuesandEvents2005-06,
Catalogue Number: 4114.0, Commonwealth of Australia, Canberra
Australian Government (2012) Creative Australia – The National Cultural Policy, Commonwealth of
Australia,Canberrahttp://creativeaustralia.arts.gov.au/full-policy/
Black Swan Theatre Company (2012) Annual Report 2011, Black Swan Theatre Company, Perth
BOP Consulting (2012) World Cities Culture Report, Mayor of London, London
BOP Consulting (2012) Impact Assessment of the Fringe World Festival, Artrage, Perth
Department of Culture and the Arts (2012) Culture Report 2012 Western Australia, Government of
Western Australia, Perth
Economist Intelligence Unit (2011) Global liveability report, EIU, London
Eltham B (2012) Performing Arts Audiences Stagnating, Crikey Analysis, Crikey 06 September 2012,
www.crickey.com.au
Eltham B, (2013) And the centre of arts innovation is … Perth, Crikey 15 February 2013, www.crickey.
com.au
Ernst & Young (2009) Ticket Attendance and Revenue Survey, Live Performance Australia, Melbourne
Ernst & Young (2011) Ticket Attendance and Revenue Survey, Live Performance Australia, Melbourne
McCarthy, Brooks A, Lowell J, Zakaras L (2001) The Performing Arts in the New Era, RAND Corporation,
Santa Monica
Mercer Consulting (2012) Quality of Living Survey 2012, Mercer LLC, New York
Sweet Reason Pty Ltd (2011) Planning Sydney’s Cultural Facilities, Arts NSW, Sydney
www.artsnsw.com.au
Telsis Consulting et al (2007) Perth’s Creative Industries – An Analysis, Department of Culture and the
Arts, Government of Western Australia, Perth
Tourism Western Australia (2012) AnnualReport2011-12, Government of Western Australia, Perth
Western Australian Ballet Company (2012) Annual Report 2011, Western Australian Ballet Company,
Perth
Western Australian Symphony Orchestra (2012) WASO Annual Report 2011, Western Australian
Symphony Orchestra, Perth
Wetzstein S (2010) Perceptions of Urban Elites on Four Australian Cities: How does Perth compare?,
Committee for Perth, Perth www.committeeforperth.com.au
448
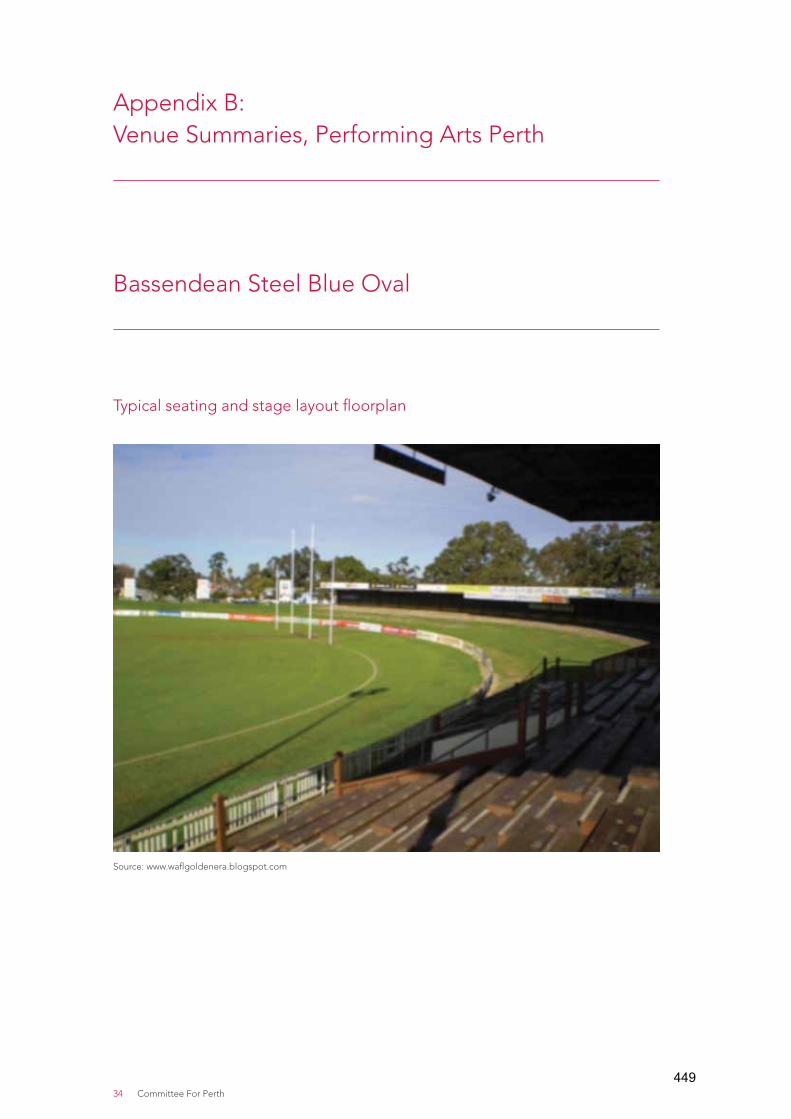
34 Committee For Perth
Appendix B: Venue Summaries, Performing Arts Perth
Bassendean Steel Blue Oval
Typical seating and stage layout floorplan
Source: www.waflgoldenera.blogspot.com
449

Examining Perth’s Performing Arts Infrastructure 35
Bassendean Steel Blue Oval
Street Address Cnr of Guildford Road and West Road, Bassendean
Suburb Bassendean
Best contact person for venue audit Tim Clark – [email protected]
Ross Rayson – [email protected]
Map Ref 1
Directions 2031 Region Central
Local Government Authority Town of Bassendean
Phone number (08) 9377 8000
Email [email protected]
Venue website http://www.bassendean.wa.gov.au
Operator and management arrangements Hiring of venue through the Town of Bassendean
Funding sources
Primary purpose Sport: WAFL
Secondary purpose Hiring venue for concerts, sporting and other purposes
Stageconfigurationoptions Feasible for variety of uses
Seating capacity (including seating capacity in all configurations)
40,000 patrons standing for concert 1,500 seats on stands.
Facilities included • Stands, pavilions, large grass bank, and lounges for members
• Broadcast facilities• Changerooms
Year constructed
Significantrenovations-yearofworksanddetails
Additional amenities in the facility e.g. Bars, dining venues, exhibition space, meeting rooms
• Corporate lounges • Train Station close by (within walking distance)
Source: www.newsite.eventpersonnelaustralia.com.au www.inmycommunity.com.au
450

36 Committee For Perth
Belvoir Amphitheatre, Upper Swan
Typical seating and stage layout floorplan
Source: www.nearmap.com
451

Examining Perth’s Performing Arts Infrastructure 37
Belvoir Amphitheatre, Upper Swan
Street Address 1177 Great Northern Hwy
Suburb Upper Swan
Best contact person for venue audit Tanya-EventsCo-ordinator
Map Ref 2
Directions 2031 Region North-East
Local Government Authority City of Swan
Phone number 9296 3033
Email [email protected]
Venue website http://www.belvoir.net.au/
Operator and management arrangements
Ticketing through Ticketmaster
Funding sources
Primary purpose Hiring venue for concerts
Secondary purpose
Stageconfigurationoptions
Seating capacity (includingseatingcapacityinallconfigurations)
Amphitheatre seats maximum 4,500 patrons
Facilities included
Year constructed
Significantrenovations-yearofworksanddetails
Additional amenities in the facility e.g. Bars, dining venues, exhibition space, meeting rooms
Source:www.my247.mobi/perth
452

38 Committee For Perth
Challenge Stadium, Mount Claremont
Typical seating and stage layout floorplan
Source: www.ticketmaster.com.au Google Maps images
453

Examining Perth’s Performing Arts Infrastructure 39
Challenge Stadium, Mount Claremont
Street Address Stephenson Avenue,
Suburb Mount Claremont
Best contact person for venue audit Hellen Hill, Venues West
Map Ref 3
Directions 2031 Region Central
Local Government Authority Town of Cambridge
Phone number (08) 9441 8222
Email [email protected]
Venue website http://www.venueswest.wa.gov.au/
Operator and management arrangements Venues West
Ticketing through Ticketmaster
Funding sources State government and self funding
Primary purpose Multi purpose sport and aquatic centre
Secondary purpose Recreation, entertainment, functions and banquest, music and concerts
Stageconfigurationoptions Feasible for variety of uses: Sport and Stage with floor standing
Seating capacity (including seating capacity in all configurations)
Full Concert: 5031(Standing room on the floor)
Reserved Seated: 4259 (Seated Floor)
Basketball total Capacity 4,424
Facilities included Gym, Swimming pool
Year constructed 1986
Significantrenovations-yearofworksanddetails 2013/14–additionalofnewWAISfacilitytoSEcorner of Challenge Stadium building
Additional amenities in the facility e.g. Bars, dining venues, exhibition space, meeting rooms
Shop, cafe and creche facilities
Source: www.gtaust.com www.roxettecafe.com
454

40 Committee For Perth
Claremont Showgrounds, Claremont
Typical seating and stage layout floorplan
Source: Supplied by Claremont Showgrounds and permission to use images from www.claremontshowground.com.au
Source: www.soundwave.com
455

Examining Perth’s Performing Arts Infrastructure 41
Claremont Showgrounds, Claremont
Street Address Gate 1 Graylands Road, Claremont
Suburb Claremont
Best contact person for venue audit PeterCooper,ChiefOperatingofficer
Map Ref 4
Directions 2031 Region Central
Local Government Authority Town of Claremont
Phone number (08) 6263 3100
Email [email protected]
Venue website http://www.claremontshowground.com.au/venues/outdoor-areas
Operator and management arrangements Booking through Claremont Showgrounds and Ticketmaster
Funding sources Self Funded
Primary purpose Perth Royal Show , performances, fairs, marquee dinner functions, social club fairs, concerts,markets,filming,outdoorevents,vehicle shows and shines
Secondary purpose
Stageconfigurationoptions Feasible for variety of uses
Seating capacity (including seating capacity in all configurations)
45,000-55,000patrons
Facilities included Exhibition space, Ovals that can be adjusted to beeventspecific.
Year constructed 1902
Significantrenovations-yearofworksanddetails 1999-TranformationofSpeedwayintomultipurpose arena
Additional amenities in the facility e.g. Bars, dining venues, exhibition space, meeting rooms
• Catering• Train station• Exhibition space• Meeting rooms• Bars
Source: www.novation.com.au www.ticketsinvetory.com
456

42 Committee For Perth
Crown Theatre Perth, Burswood
Typical seating and stage layout floorplan
Source:LeanderHarder,EntertainmentCo-ordinator–Theatre,CrownPerth
457

Examining Perth’s Performing Arts Infrastructure 43
Crown Theatre Perth, Burswood
Street Address Great Eastern Hwy
Suburb Burswood
Best contact person for venue audit LeandaHarder-Entertainmentcoordinatorfor Crown Theatre
Map Ref 5
Directions 2031 Region Central
Local Government Authority Town of Victoria Park
Phone number 9362 7685
Email [email protected]
Venue website http://www.crownperth.com.au/entertainment/ crown-theatre-perth
Operator and management arrangements
Privatelyowned.Venuemanagedin-house.Managementhires out the facility. Ticketek are the contracted ticketing provider
Funding sources ExclusivelyfundedbyCrown/JamesPacker.
Primary purpose Mix of long running musicals, concerts, theatrical performances, dance performances, children’s events, school events
Secondary purpose Conference plenary sessions, product launches
Stageconfigurationoptions Nil–thestageisfixed
Seating capacity (including seating capacityinallconfigurations)
2,311 patrons
Facilities included The proscenium opening is 18m x 8.5m. The stage is 14.5m deep from the front lip to the cyc. Dressing rooms; foyers; Green Rooms; laundry; wardrobes; Male and Female Chorus rooms
Year constructed 1985
Significantrenovations- year of works and details
In 2000 the theatre had a major rebuild – changed dress circle, new fly lines for stage
Additional amenities in the facility e.g. Bars, dining venues, exhibition space, meeting rooms
3 bars in the foyers; meeting rooms; exhibition space
458

44 Committee For Perth
Dolphin Theatre, UWA, Crawley
Typical seating and stage layout floorplan
Source: University Theatres
459
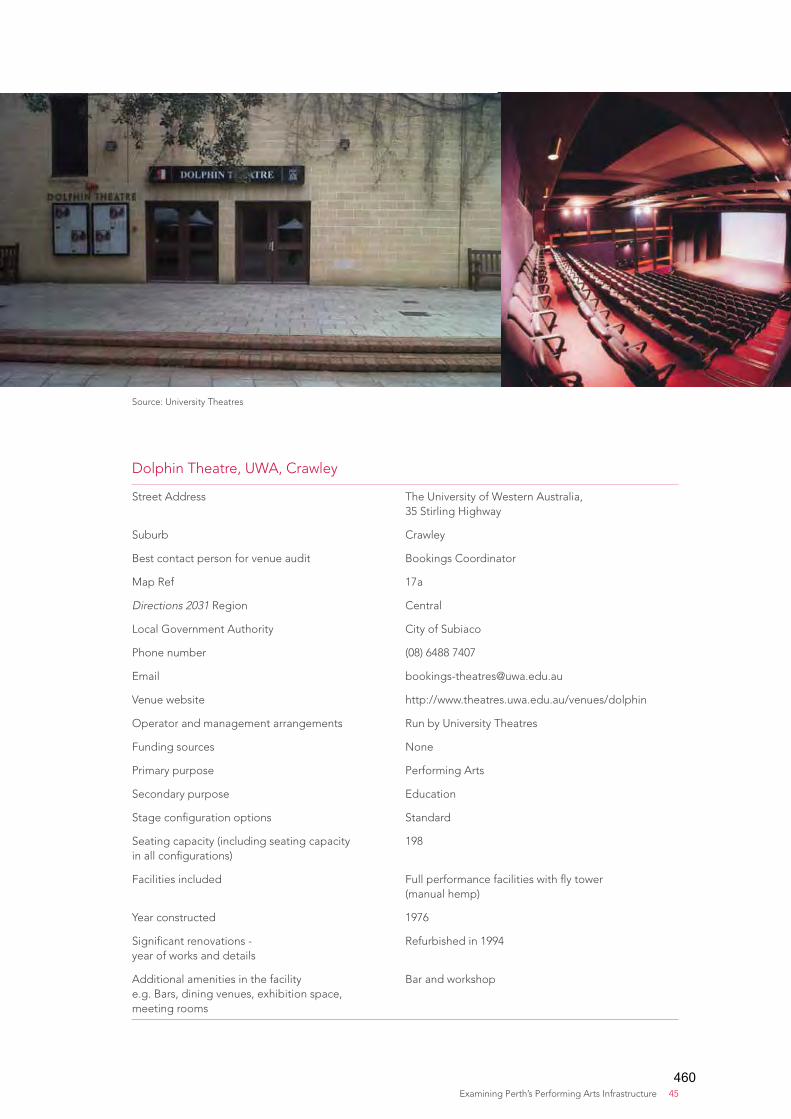
Examining Perth’s Performing Arts Infrastructure 45
Dolphin Theatre, UWA, Crawley
Street Address The University of Western Australia, 35 Stirling Highway
Suburb Crawley
Best contact person for venue audit Bookings Coordinator
Map Ref 17a
Directions 2031 Region Central
Local Government Authority City of Subiaco
Phone number (08) 6488 7407
Email [email protected]
Venue website http://www.theatres.uwa.edu.au/venues/dolphin
Operator and management arrangements Run by University Theatres
Funding sources None
Primary purpose Performing Arts
Secondary purpose Education
Stageconfigurationoptions Standard
Seating capacity (including seating capacity inallconfigurations)
198
Facilities included Full performance facilities with fly tower (manual hemp)
Year constructed 1976
Significantrenovations- year of works and details
Refurbished in 1994
Additional amenities in the facility e.g. Bars, dining venues, exhibition space, meeting rooms
Bar and workshop
Source: University Theatres
460

46 Committee For Perth
Don Russell Performing Arts Centre, Gosnells
Typical seating and stage layout floorplan
Source:ImagesuppliedbyRobertHousley-Manager Source: www.gosnells.wa.gov.au
461

Examining Perth’s Performing Arts Infrastructure 47
Don Russell Performing Arts Centre, Gosnells
Street Address Murdoch Rd
Suburb Thornlie (next to the Forest Lakes Shopping Centre)
Best contact person for venue audit Robert Housley – Manager
Map Ref 6
Directions 2031 Region South-East
Local Government Authority City of Gosnells
Phone number 9493 4577
Email [email protected]
Venue website http://www.gosnells.wa.gov.au
Operator and management arrangements
Owned and managed by the City of Gosnells, this is a purpose-builtperformingartsfacility
Funding sources City of Gosnells
Primary purpose Theatre productions for local performing arts groups, community cultural groups and professional performing arts companies
Secondary purpose Fully equipped dance studio is hired out to private dance teachers
Stageconfigurationoptions It is a proscenium arch style theatre and stage extensions can beaddedtomakeitdeeper,givingupto1/3morestagefloor space
Seating capacity (including seating capacity inallconfigurations)
Capacity for 210 patrons
Facilities included Usual sound and lighting technology of a modern theatre but also has an audio loop under the chairs. Has showers and toilets and a combined dressing room
Year constructed 1994
Significantrenovations- year of works and details
UsingFederalfunding,theinternalconfigurationwasimproved 3 years ago. Minor internal upgrade planned in 2013. Ideally looking at doubling size of foyer to cope with capacity crowds; increase depth of the stage; provide room forcross-overatbackofstage;buildsecondfacilitybehindthe venue to cater for the dance component
Additional amenities in the facility e.g. Bars, dining venues, exhibition space, meeting rooms
Kitchen is available for hire
462

48 Committee For Perth
Fremantle Arts Centre
Typical seating and stage layout floorplan
Source: Fremantle Arts Centre
463

Examining Perth’s Performing Arts Infrastructure 49
Fremantle Arts Centre
Street Address 1 Finnerty Street
Suburb Fremantle
Best contact person for venue audit Pete Stone – General Manager
Map Ref 7
Directions 2031 Region Central
Local Government Authority City of Fremantle
Phone number 61 8 9432 9568
Email [email protected]
Venue website www.fac.org.au
Operator and management arrangements Business Unit of City of Fremantle
Funding sources CityofFremantle,StateGovernment–multi-yearcontract, Govt Grants, philanthropic foundations, sponsors, earned income
Primary purpose Multi-artsorganisation
Secondary purpose
Stageconfigurationoptions See attached document
Seating capacity (including seating capacityinallconfigurations)
See attached document
Facilities included
Year constructed Outdoor heritage venue
Significantrenovations- year of works and details
NA
Additional amenities in the facility e.g. Bars, dining venues, exhibition space, meeting rooms
Multi-artvenuewithgalleries,courseprogram/teachingstudios, artist studios, shop, café, gardens
Source: Fremantle Arts Centre
464

50 Committee For Perth
Fremantle Town Hall, Fremantle
Typical seating and stage layout floorplan
Source:SuppliedbyCharlotteCooper-Dickson
465

Examining Perth’s Performing Arts Infrastructure 51
Fremantle Town Hall, Fremantle
Street Address 8 William Street
Suburb Fremantle
Best contact person for venue audit CharlotteCooper-Dickson-BookingsOfficer
Map Ref 8
Directions 2031 Region Central
Local Government Authority City of Fremantle
Phone number 9432 9702
Email [email protected]
Venue website Does not have own website
Operator and management arrangements City of Fremantle owned. Hires the hall to clients
Funding sources City of Fremantle
Primary purpose Hiring of facility to external clients for functions
Secondary purpose Concerts
Stageconfigurationoptions Stage can be made shallower by drawing across a heavy curtain
Seating capacity (including seatingcapacityinallconfigurations)
Main Hall seats 294 patrons; the Balcony seats 169 patrons and the East Room seats 30. Total seating capacity for venue is 493
Facilities included Kitchen for heating food only. Piano; tables & chairs; very small Green Room
Year constructed 1887
Significantrenovations- year of works and details
Refurbishmentcompetedin1986/7fortheAmerica’sCup.Specificworknotidentified
Ideally would like a commercial kitchen; 2 new green rooms; permanent stage lighting; house soundsystem;overhaulofstagelayoutandfixturesand a repaint
Additional amenities in the facility e.g. Bars, dining venues, exhibition space, meeting rooms
Atrium and the West Room
Source:WebsiteandsuppliedbyCharlotteCooper-Dickson
466
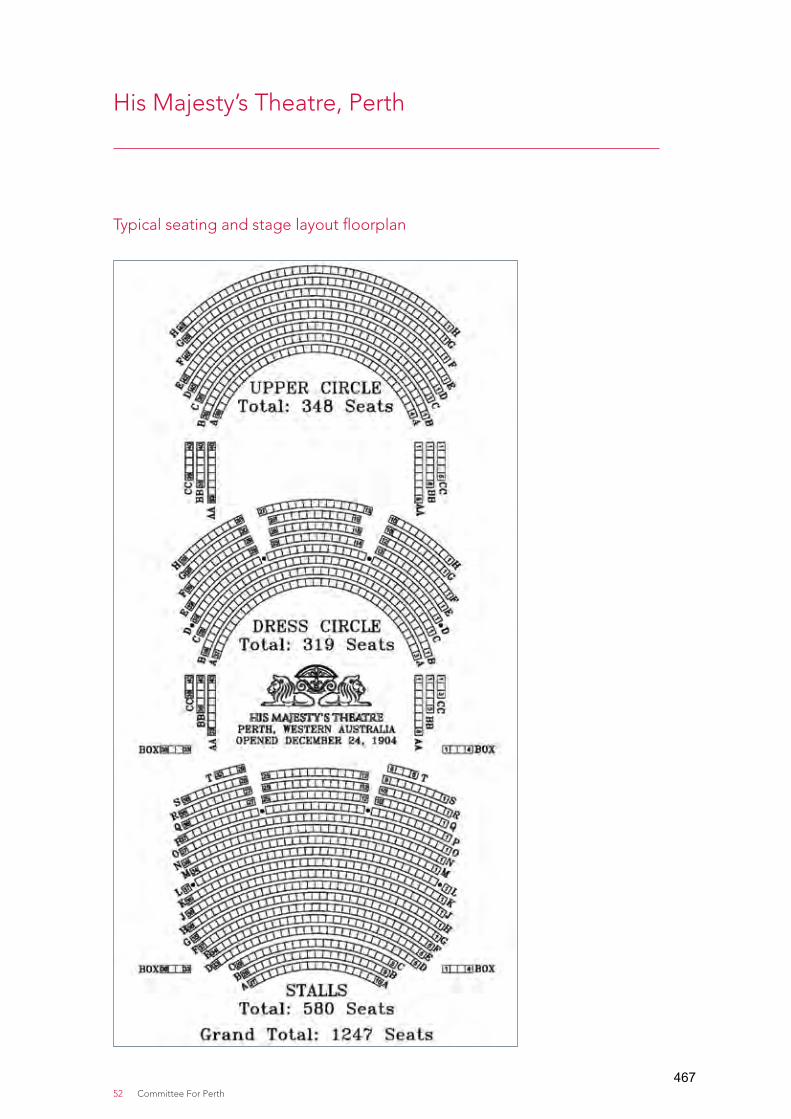
52 Committee For Perth
His Majesty’s Theatre, Perth
Typical seating and stage layout floorplan
467

Examining Perth’s Performing Arts Infrastructure 53
His Majesty’s Theatre, Perth
Street Address 825 Hay St
Suburb Perth
Best contact person for venue audit AlanFerris-GeneralManager-PerthTheatreTrustProperties
Map Ref 9
Directions 2031 Region Central
Local Government Authority City of Perth
Phone number (08) 9265 0900
Venue website http://www.hismajestystheatre.com.au/or http://www.perththeatretrust.com.au
Operator and management arrangements
His Majesty’s Theatre is managed by the external service provider, AEG Ogden (Perth). Ticketing is through Ticketek
Funding sources State Government appropriation
Primary purpose Providing accommodation for resident company, the West Australian Opera and houses The Museum of Performing Arts. Provides a wide range of performing arts events by local, national and international companies and is a major venue for the annual Perth International Arts Festival
Secondary purpose Hiringoutspacetocompanies,alsoofferingon-sitecatering. A Ticketek outlet is located on the ground floor
Stageconfigurationoptions Stage can be extended by using the orchestra pit
Seating capacity (including seatingcapacityinallconfigurations)
1,240 patrons
Facilities included 11 Dressing Rooms; Green Room; Sound Proof Conductor’s Room;Tune-upandRehearsalRooms;Wardrobe-fullfacilities;VisitingManagementOfficeswithphoneandfaxlines
Year constructed 1902-1904
Significantrenovations- year of works and details
1977-80–amalgamationofTheatre&hoteltoformaccommodation for resident companies, WA Ballet & WA Opera
Additional amenities in the facility e.g. Bars, dining venues, exhibition space, meeting rooms
Restaurant, cafe and bar
Source: Image supplied by Perth Theatre Trust
468

54 Committee For Perth
Joondalup Arena
Typical seating and stage layout floorplan
Source: Image extract from Venues West Promoters Guide
469

Examining Perth’s Performing Arts Infrastructure 55
Joondalup Arena
Street Address Kennedya Drive
Suburb Joondalup
Best contact person for venue audit Viki Shelver
Map Ref 10
Directions 2031 Region North West
Local Government Authority City of Joondalup
Phone number (08) 93007143
Email [email protected]/[email protected]
Venue website http://www.venueswest.wa.gov.au/
Operator and management arrangements Venues West Ticketing through Ticketmaster
Funding sources State government and self funding
Primary purpose Multi purpose sport, recreation and aquatic centre
Secondary purpose
Stageconfigurationoptions Feasible for variety of uses: Sport and Stage with floor standing
Seating capacity (including seating capacity in all configurations)
25,000 patrons
Facilities included Gym, Swimming pool, indoor courts, function rooms, outdoor netball courts, AstroTurf hockey field,footballoval,rugbyoval,tenniscourts
Year constructed 1986
Significantrenovations-yearofworksanddetails 1999/2000additionofAquaticCentre(8x50mcompetition pool and 3x25m plus leisure pool)
Additional amenities in the facility e.g. Bars, dining venues, exhibition space, meeting rooms
Sportsbar, cafe and childcare Function rooms
Source: Images supplied by Venues West
470
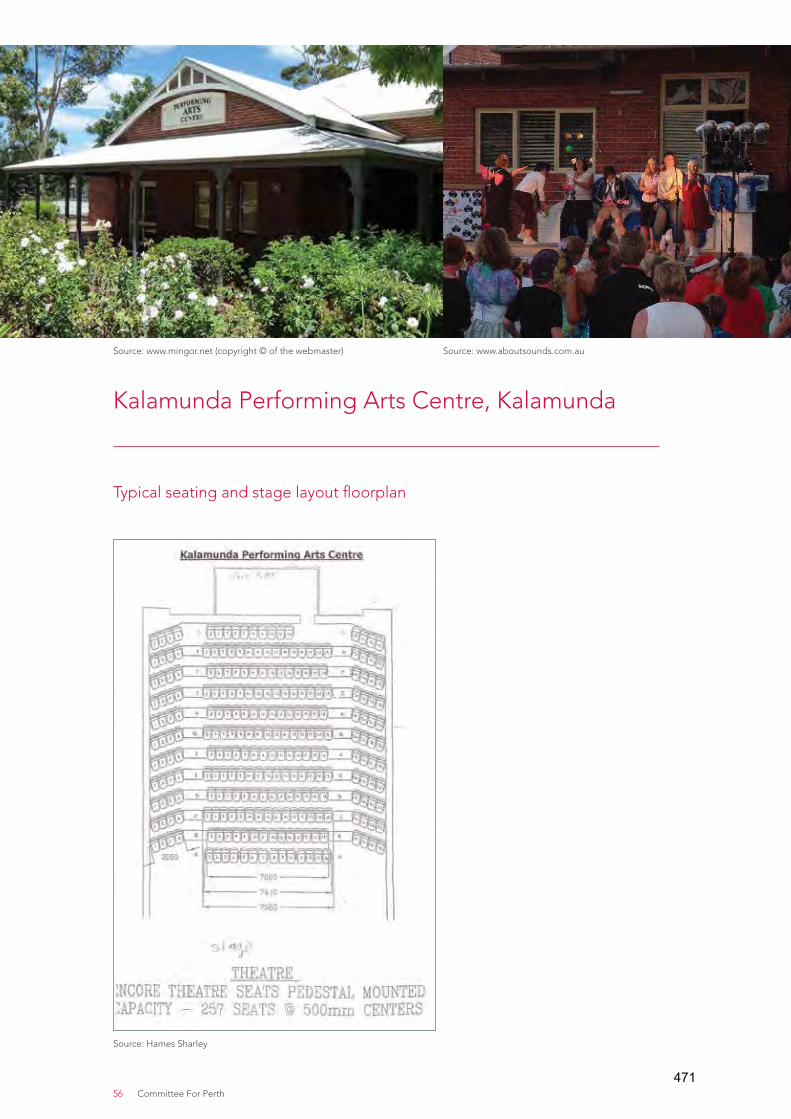
56 Committee For Perth
Kalamunda Performing Arts Centre, Kalamunda
Typical seating and stage layout floorplan
Source: www.mingor.net (copyright © of the webmaster) Source: www.aboutsounds.com.au
Source: Hames Sharley
471

Examining Perth’s Performing Arts Infrastructure 57
Kalamunda Performing Arts Centre, Kalamunda
Street Address 48 Canning Rd
Suburb Kalamunda
Best contact person for venue audit CatherineDaniels-Administrator
Map Ref 11
Directions 2031 Region North-East
Local Government Authority Shire of Kalamunda
Phone number 92572558(Tue-Thu:0900–1500hrs;Fri:0900–1700)
Email [email protected]
Venue website http://www.kalamunda.wa.gov.au/
Operator and management arrangements
Owner/operatedisShireofKalamunda.TicketingthroughPerformingArtsCentreorZig-ZagCulturalCentre
Funding sources Shire of Kalamunda. Proposal on table to source additional sponsorship
Primary purpose Primarily hired out to community groups, schools and dance teachers
Secondary purpose Hoping to arrange events such as concerts in future.
Stageconfigurationoptions Sprungstagecanbereconfiguredintoacatwalkormade smaller by removing the front block
Seating capacity (including seatingcapacityinallconfigurations)
Auditorium seats for 257 patrons Agricultural Hall seats 230 Teaching area seats 60 patrons Total capacity is 547
Facilities included The large foyer has a ticket box, bar area and comfortable seating. A hangtrac system enables this area to also be used for small exhibitions. A smaller teaching area can be used as a Black Box theatre. Kitchen in the Agricultural Hall
Year constructed 1996–DepartmentofEducationhelpedfinancethebuilding so it has shared use – up to 150 free hours. Agricultural Hall is more than 100 years old and is Heritage Listed
Significantrenovations- year of works and details
None
Additional amenities in the facility e.g. Bars, dining venues, exhibition space, meeting rooms
None
472

58 Committee For Perth
Kings Park and Botanic Garden
Typical seating and stage layout floorplan
Source: www.bpga.wa.gov.au
Source: www.bpga.wa.gov.au Botanic Garden & Parks Authority
473

Examining Perth’s Performing Arts Infrastructure 59
Kings Park and Botanic Garden
Street Address Fraser Avenue
Suburb Kings Park, West Perth
Best contact person for venue audit EventsCo-ordinatorZoeFulwoodorParkManagementOfficer
Map Ref 12
Directions 2031 Region Central
Local Government Authority Not applicable (State Government A class reserve land not officiallywithinlocalcouncilarea)
Phone number (8)94803624/(8)94803600
Email [email protected]
Venue website http://www.bgpa.wa.gov.au/kings-park
Operator and management arrangements Botanic Gardens and Parks Authority
Funding sources Approximately two thirds State Government funding for operational costs, and one third of annual budget generated from own source revenue including leases, licences, sales, consultancies, sponsorships and similar.
Primary purpose Significantconservation,recreational,historical/culturaland tourism purposes as the premier public Park, including the State War Memorial and State Botanic Garden.
Secondary purpose Family and Community gatherings and celebrations, Services (e.g. ANZAC day and many memorial services), School Programs, Tours and Walks, Outdoor Concerts, Theatre and Cinema.
Stageconfigurationoptions Feasibleforvarietyofuses,nofixedseating
Seating capacity (including seating capacity in all configurations)
6,000 capacity in Botanic Garden precinct for a concert event 2,000 capacity in Synergy Parkland for Outdoor Cinema 800 capacity for Shakespeare in the Park venue 500 capacity for Children’s Theatre at Saw Avenue Amphitheatre Floor plans are not available as these are temporary venues forfixedperiodseachsummeronly.SeatingisFestivalstyle(on grass).
Venues for hire for family social gatherings and special occasions.
Sportsbar, cafe and childcare Function rooms
Facilities included Education programs, Events, Public Toilets, Pathways, Playgrounds, Parklands, Shelters, Bushlands, Memorials, Cafes/Restaurants,generalvisitoramenities
Year constructed The whole of Kings Park was set aside as a park for public purposes in 1831 and gazetted and protected as a park in 1872. The 17 hectare Botanic Garden was established 1965.
Significantrenovations-yearofworksanddetails Ongoing renovations throughout the history of the Park, with most recent 20 years being a period of rapid refurbishment and development of amenities to support growing visitation and reputation of the Park.
Additional amenities in the facility e.g. Bars, dining venues, exhibition space, meeting rooms
Limited seminar facilities in some buildings Dining facilities in 3 cafes, a kiosk and a restaurant. High end gallery and gift shop in Aspects of Kings Park with WA and Australian designed products.
474
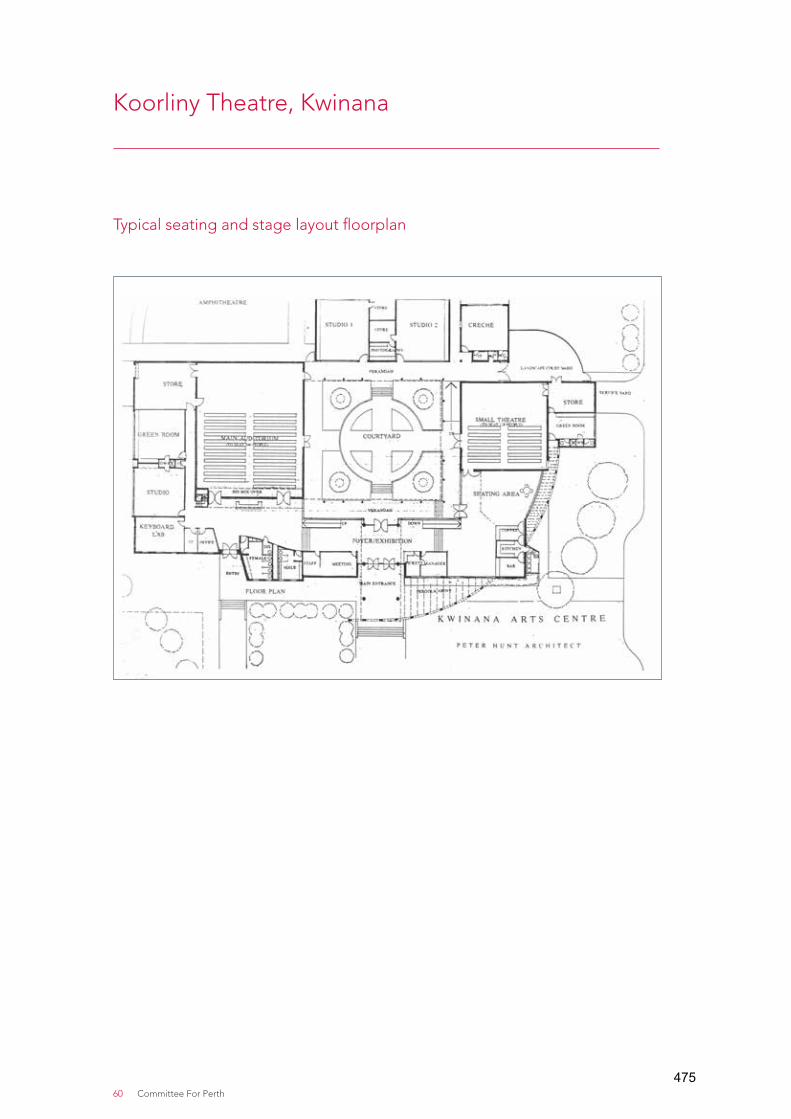
60 Committee For Perth
Koorliny Theatre, Kwinana
Typical seating and stage layout floorplan
475

Examining Perth’s Performing Arts Infrastructure 61
Koorliny Theatre, Kwinana
Street Address 20 Sulphur Road
Suburb Kwinana
Best contact person for venue audit Ryan Taaffe – General Manager
Map Ref 13
Directions 2031 Region South-West
Local Government Authority Town of Kwinana
Phone number 9467 7118
Email [email protected]
Venue website www.koorliny.com.au
Operator and management arrangements
LeasedfromtheTownofKwinanaandmanagedbyanot-for-profitBoard. Manage their own ticketing
Funding sources TownofKwinana;AMEXCorporationP/L;KwinanaCourier;Kwinana Industries Council; CSBP
Primary purpose Hiring out the venue
Secondary purpose Some theatrical productions
Stageconfigurationoptions Stages can be decreased or increased in the 2 theatres
Seating capacity (including seating capacityinallconfigurations)
1,000 Amphitheatre; 244 proscenium arch theatre; 100 black box theatre. Total capacity is 1,364
Facilities included Sound and lighting rigs; technician; dressing room. Also has a dancestudio,multi-purposestudiosandacourtyard,allofwhichcan be used for business functions, product releases, conferences and training programs
Year constructed 1991
Significantrenovations- year of works and details
2001 – Amphitheatre added (Bicentennial funding). Looking at potentially increasing stage size and seating capacity
Additional amenities in the facility e.g. Bars, dining venues, exhibition space, meeting rooms
Theatre bar
Source: Supplied by Ryan Taafe, General Manager Koorliny Theatre.
476

62 Committee For Perth
Mandurah Performing Arts Centre, Mandurah
Typical seating and stage layout floorplan
Source: Hames Sharley
477

Examining Perth’s Performing Arts Infrastructure 63
Mandurah Performing Arts Centre, Mandurah
Street Address Ormsby Terrace
Suburb Mandurah
Best contact person for venue audit Christine Steer – Operations Manager
Map Ref 14
Directions 2031 Region Peel
Local Government Authority City of Mandurah
Phone number 9550 3930
Email [email protected]
Venue website http://www.manpac.com.au/
Operator and management arrangements
OwnedbyCityofMandurah.Managedbynot-for-profitBoard.Doownticketingexceptforon-lineticketswhichareavailable through Tickets.com
Funding sources City of Mandurah; Lotterywest; Bendigo Bank
Primary purpose Provide arts and culture to Peel community
Secondary purpose Add to cultural opportunities through workshops, education & recreational programs in visual and performing arts
Stageconfigurationoptions Stages can be enlarged by using the orchestra pit in the Boardwalk Theatre and by retracting seating in the Fishtrap Theatre, in which the stage is part of the floor
Seating capacity (including seatingcapacityinallconfigurations)
Seating for a total of 944 patrons: Boardwalk Theatre accommodates 800 and Fishtrap Theatre 144
Facilities included 4 change rooms with showers & toilets; Green Room
Year constructed 1997
Significantrenovations- year of works and details
None so far but ideally looking to increase size of the stage and increase seating capacity to the Fishtrap Theatre
Additional amenities in the facility e.g. Bars, dining venues, exhibition space, meeting rooms
Bar
Source: Hames Sharley Source: MPAC supplied image of the Auditorium
478
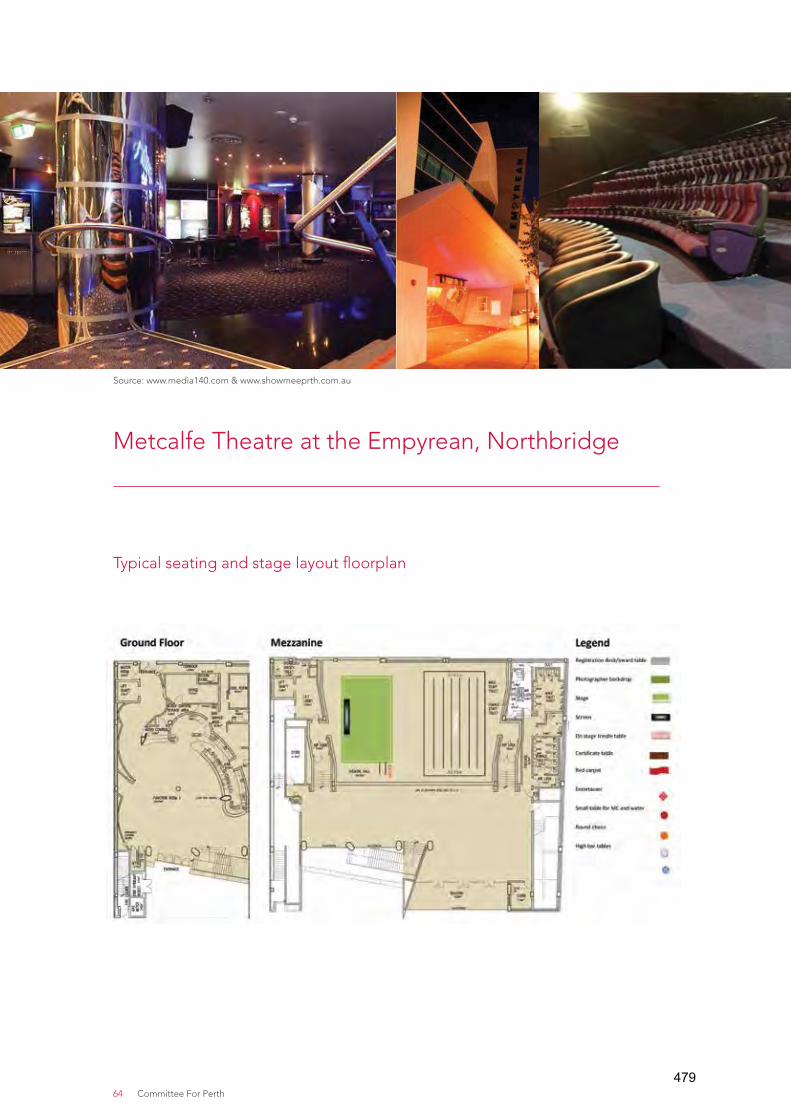
64 Committee For Perth
Metcalfe Theatre at the Empyrean, Northbridge
Typical seating and stage layout floorplan
Source: www.media140.com & www.showmeeprth.com.au
479

Examining Perth’s Performing Arts Infrastructure 65
Metcalfe Theatre at the Empyrean, Northbridge
Street Address 12 Lake St
Suburb Northbridge
Best contact person for venue audit Sam Outhred – Functions Manager
Map Ref 15
Directions 2031 Region Central
Local Government Authority City of Perth
Phone number 9228 1600
Email [email protected]
Venue website http://www.empyrean.net.au/
Operator and management arrangements
Venue is owner operated – managed by 2 directors and functions manager. Ticketing through Moshtix
Funding sources The owners and fees from their hospitality training academy, Empyrean Educational Institute
Primary purpose Mainly corporate functions. Boasts some of the best acoustics in theatre design. The Metcalfe Theatre offers the best setting for stage productions, visiting entertainers or important corporate seminars
Secondary purpose Live theatre and awards nights
Stageconfigurationoptions Large stage (17m x 8m) can be reduced by curtains
Seating capacity (including seating capacityinallconfigurations)
Theatre: 300 but most often capped at 280. Total capacity of theatre, lobby and mezzanine is 550
Facilities included 2 change rooms, Green Room
Year constructed 1997
Significantrenovations- year of works and details
2008–completelyre-designed.Lookingtopotentiallybuildtoilets on the ground floor (E Lobby area) so functions can be held in both areas simultaneously
Additional amenities in the facility e.g. Bars, dining venues, exhibition space, meeting rooms
ELobbyhasfullylicensedbar;14TVs;Wi-Fi;DJequipment; additional audio and visual capabilities Mezzanine has a balcony
480
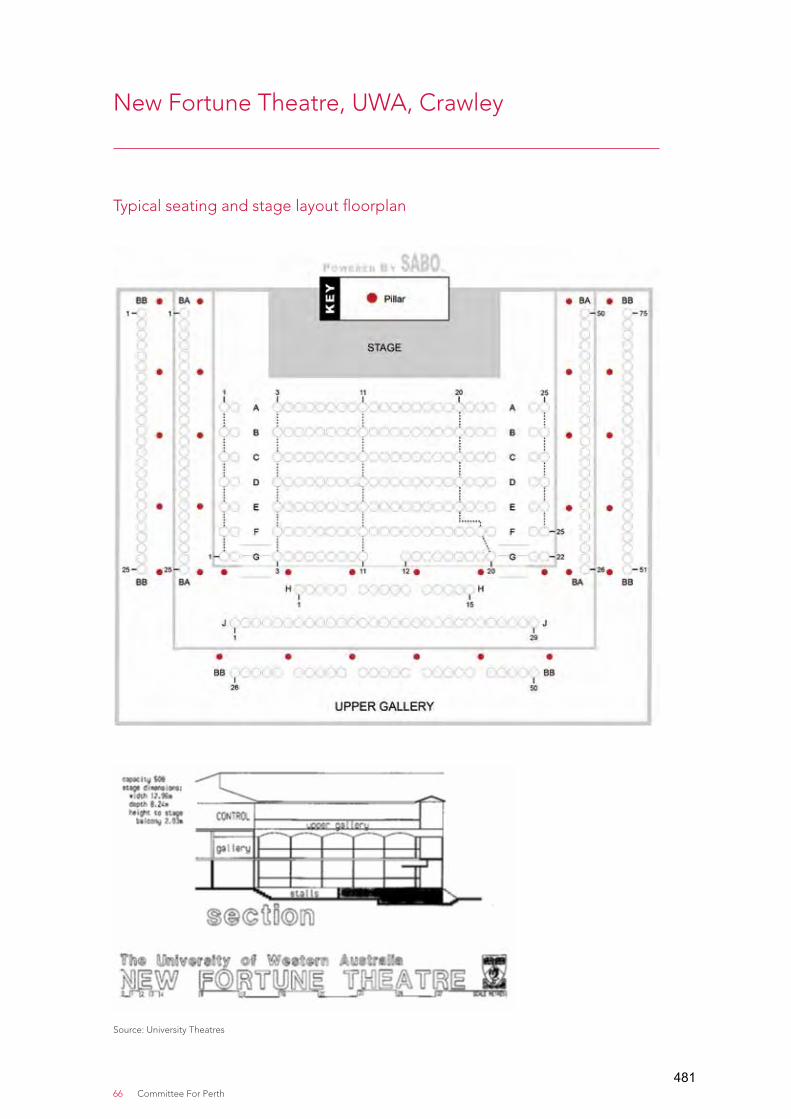
66 Committee For Perth
New Fortune Theatre, UWA, Crawley
Typical seating and stage layout floorplan
Source: University Theatres
481

Examining Perth’s Performing Arts Infrastructure 67
New Fortune Theatre, UWA, Crawley
Street Address The University of Western Australia, 35 Stirling Highway
Suburb Crawley
Best contact person for venue audit Bookings Coordinator
Map Ref 17b
Directions 2031 Region Central
Local Government Authority City of Subiaco
Phone number (08) 6488 7407
Email [email protected]
Venue website http://www.theatres.uwa.edu.au/venues/fortune
Operator and management arrangements Run by University Theatres
Funding sources None
Primary purpose Performing Arts
Secondary purpose Education
Stageconfigurationoptions None
Seating capacity (includingseatingcapacityinallconfigurations)
350
Facilities included Open air theatre. The only Elizabethan style theatre in the southern hemisphere
Year constructed 1964
Significantrenovations-yearofworksanddetails None
Additional amenities in the facility e.g. Bars, dining venues, exhibition space, meeting rooms
None
Source: University Theatres
482

68 Committee For Perth
NIB Stadium
Typical seating and stage layout floorplan
Source:SuppliedbyNIBStadium-ww.nibstadium.com.au
NIB Stadium
Street Address 310 Pier Street
Suburb Perth
Best contact person for venue audit Sam Burling (Brand Manager)
Map Ref 16
Directions 2031 Region Central
Local Government Authority City of Vincent
Phone number (08) 9422 1500
Email [email protected]
Venue website http://www.nibstadium.com.au/
Operator and management arrangements Allia Venue Management Ticketing through Ticketmaster (currently) Catering through Mustard Catering
483

Examining Perth’s Performing Arts Infrastructure 69
Funding sources Confidential,howevernibHealthCoveristhe‘stadium’naming rights sponsor and Bankwest is the ‘shed’ naming rights sponsor.
Primary purpose Multi-purposerectangularfacilityprimarilyforhostingsportingevents, though also for concerts and functions in spaces throughout the stadium.
Secondary purpose Concerts
Stageconfigurationoptions Feasible for variety of uses: Sport and Stage with floor standing or seating, function spaces with various layout options.
Seating capacity (including seating capacity in all configurations)
The stadium encompasses an area of approximately 4.4 hectares with a playing surface of 132 metres by 88 metres. NIB Stadium maximum spectator capacity for sporting events will be 20,565 once the State Government redevelopment is completed. The facility can cater for up to 35,000 spectators for concerts including standing on the pitch.
Facilities included • Playing area with lights• Team change rooms• Referee rooms• Physiotherapy rooms• Function rooms• Corporate suites
Year constructed The land on which the stadium was built was made a public reserve in 1904 where rugby was played. Perth Oval Main ground was developed in 1910.
Significantrenovations- year of works and details
2003-$11.4millionredevelopmenttotransformitintoarectangular pitch (funded by State & Local governments)
2009/2010-installationoftemporaryseatingandcorporatefacilities2012/2013-$95.14millionredevelopmentincluding:• replacing temporary seating in the east with a permanent
undercover stand containing a range of corporate, retail, toilet, merchandise and storage facilities;
• replacing temporary seating the south with a permanent uncovered stand;
• a new Gate 4 incorporating additional entry points and box offices;
• a new marquee will be installed in the south;• new pitch flood lighting towers and a new control room will
be installed in the SE corner of the ground;• new corporate facilities will be installed in the NE corner of
the ground;• 2 large, permanent screens will be installed onto the NW and
SE corners of the venue;• LED signage will be installed along the eastern pitch
perimeter;• a range of works will be under taken at Gate 1 to address
cosmetic and risk items; and• the pitch will be reconstructed and seating installed into the
northern bowl from July to October 2013.
Additional amenities in the facility e.g. Bars, dining venues, exhibition space, meeting rooms
• VIP Event Facilities• Function rooms• Media Facilities• Lounge
484

70 Committee For Perth
Octagon Theatre, UWA, Crawley
Typical seating and stage layout floorplan
Source: www.nearmap.comSource: www.lostoncampus.com.au
Source: University Theatres
485
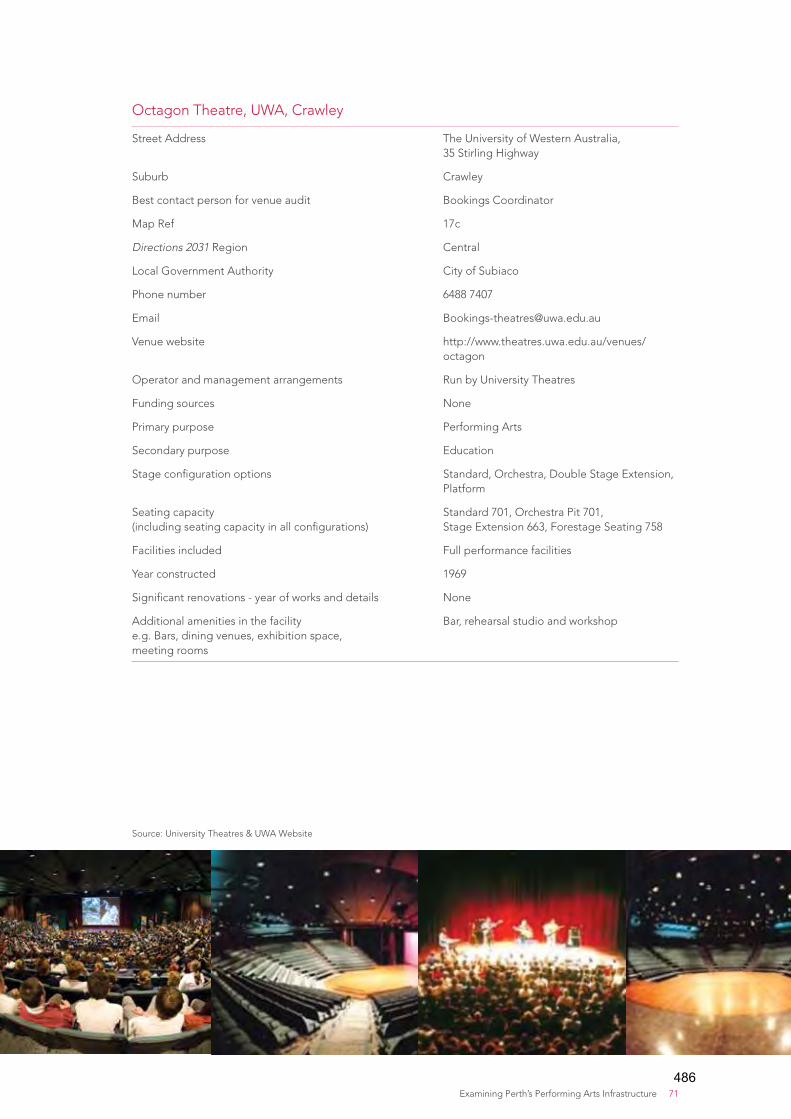
Examining Perth’s Performing Arts Infrastructure 71
Octagon Theatre, UWA, Crawley
Street Address The University of Western Australia, 35 Stirling Highway
Suburb Crawley
Best contact person for venue audit Bookings Coordinator
Map Ref 17c
Directions 2031 Region Central
Local Government Authority City of Subiaco
Phone number 6488 7407
Email [email protected]
Venue website http://www.theatres.uwa.edu.au/venues/octagon
Operator and management arrangements Run by University Theatres
Funding sources None
Primary purpose Performing Arts
Secondary purpose Education
Stageconfigurationoptions Standard, Orchestra, Double Stage Extension, Platform
Seating capacity (includingseatingcapacityinallconfigurations)
Standard 701, Orchestra Pit 701, Stage Extension 663, Forestage Seating 758
Facilities included Full performance facilities
Year constructed 1969
Significantrenovations-yearofworksanddetails None
Additional amenities in the facility e.g. Bars, dining venues, exhibition space, meeting rooms
Bar, rehearsal studio and workshop
Source: University Theatres & UWA Website
486

72 Committee For Perth
Paterson’s Stadium
Typical seating and stage layout floorplan
Source: www.ticketmaster.com.au
487

Examining Perth’s Performing Arts Infrastructure 73
Paterson’s Stadium
Street Address Subiaco Road
Suburb Subiaco
Best contact person for venue audit Shane Harris
Map Ref 18
Directions 2031 Region Central
Local Government Authority City of Subiaco
Phone number (08) 9381 2187
Email [email protected]
Venue website http://www.patersonsstadium.com.au/
Operator and management arrangements Venue managed by WAFC
Ticketing through Ticketmaster
Funding sources Internal
Primary purpose AFL and other major sporting events
Secondary purpose Concerts and functions
Stageconfigurationoptions Feasible for variety of uses: Sport and Stage withfieldstanding
Seating capacity (including seating capacity in all configurations)
43,405 AFL games Up to 60,000 in concert mode with full venue and oval use
Facilities included TAB, Wheelchair bays, Cash facilities, Oval with night lighting, Scoreboards and Video Screens.
Year constructed 1908
Significantrenovations-yearofworksanddetails 3TierStand-Opened31August1969 2TierStand-Opened27April1981 NABStand-Opened14May1995 EasternStand-Opened11March2000
Additional amenities in the facility e.g. Bars, dining venues, exhibition space, meeting rooms
7 Function rooms
Source: www.perthnow.com.au www.thedailytelegraph.com.au www.yoursubi.com.au
488

74 Committee For Perth
Perth Arena, Perth
Typical seating and stage layout floorplan
Basketball layout
Note: As seating can change for different events and performances, the seating map below
should be used as a guide only.
Source: Perth Arena website
489

Examining Perth’s Performing Arts Infrastructure 75
Perth Arena, Perth
Street Address 700 Wellington Street
Suburb Perth
Best contact person for venue audit John Lynch
Map Ref 19
Directions 2031 Region Central
Local Government Authority City of Perth
Phone number 9441 8222
Email [email protected]
Venue website http://www.pertharena.com.au
Operator and management arrangements
Owned by VenuesWest on behalf of the State Government. Managed by Ogden IFC. Ticketing through Ticketmaster
Funding sources Government of Western Australia
Primary purpose Providing a world class venue for entertainment productions and international performers
Secondary purpose Venue for sporting and corporate events. Home of the Perth Wildcats and the Hopman Cup
Stageconfigurationoptions Feasible for a variety of uses
Seating capacity (including seating capacityinallconfigurations)
The Perth Arena can seat 15,500 patrons. A flexible curtaining systemmakesmanysizesandconfigurations,downto3,500.The Granite Room can seat up to 510 in theatre style
Facilities included Retractable roof; tennis court; LED super screen in main bowl (13.6 x 8m); 5 function rooms; 36 hospitality suites for VIP patrons; catering, merchandise & beverage outlets; underground parking
Year constructed 2007-2012(opened10November2012)
Significantrenovations- year of works and details
None
Additional amenities in the facility e.g. Bars, dining venues, exhibition space, meeting rooms
Bars, food outlets, function rooms
Source: Photo supplied by VenuesWest
490

76 Committee For Perth
Perth Concert Hall, Perth
Typical seating and stage layout floorplan
Source: Image supplied by Perth Theatre Trust Source: PCH website
491
Examining Perth’s Performing Arts Infrastructure 77
Perth Concert Hall, Perth
Street Address 5 St Georges Tce
Suburb Perth
Best contact person for venue audit Alan Ferris – General Manager Perth Theatre Trust Ph: 6552 7552
Map Ref 20
Directions 2031 Region Central
Local Government Authority City of Perth
Phone number 9231 9900
Email [email protected]
Venue website www.perthconcerthall.com.au or http://www.perththeatretrust.com.au/
Operator and management arrangements
The Perth Concert Hall, is owned by the City of Perth and has been leased to the Perth Theatre Trust since 1980. The day to day operations of the Perth Concert Hall are managed by the external service provider, AEG Ogden (Perth). Ticketing is through Ticketek
Funding sources City of Perth
Primary purpose The facility is the principal performing and rehearsal venue of the West Australian Symphony Orchestra. In addition to regularseasonsbytheOrchestra,otherfineartscompaniesuse the venue
Secondary purpose The Perth Concert Hall is also hired by many organisations that present leading international contemporary artists. Also plays a civic role in hosting university and school graduations, business conventions and civic functions
Stageconfigurationoptions 20m wide at front, tapering to 14m at rear. Extensions available
Seating capacity (including seatingcapacityinallconfigurations)
1,731 divided into 3 main levels
Facilities included Themainfoyerlevelaccommodatesoffices,aticketingoutlet, a café and the Wardle Room which is available for hire for functions
Year constructed 1971-73
Significantrenovations- year of works and details
1982 extend into VIP car park area to provide additional officeaccommodation;1984Forecourtlandscaped;1985 Cooling towers in air conditioning replaced; c.1988 ConcertHallre-roofed;c.1992Restaurantrefurbished;asbestos removed; 1994 New artists’ facility completed; 1998 Replacement of air conditioning; 1999 Pedestrian link between Commonwealth Family Law Courts and Concert Hall; 2008 Major upgrades to the concrete exterior of the concert hall; 2011 replaced escalators between main entrance and underground car park
Additional amenities e.g. Bars, dining venues, exhibition space, meeting rooms
Restaurant
492

78 Committee For Perth
Perth Zoo
Typical seating and stage layout floorplan
Source:www.perthzoo.wa.gov.au-extractfromPerthZooMasterplan
493

Examining Perth’s Performing Arts Infrastructure 79
Perth Zoo
Street Address 20 Labouchere Road
Suburb South Perth
Best contact person for venue audit Ceri Price, Commercial Operations Manager
Map Ref 21
Directions 2031 Region Central
Local Government Authority City of South Perth
Phone number (8) 9474 0444
Email [email protected]
Venue website http://www.perthzoo.wa.gov.au/
Operator and management arrangements Perth Zoo Most concerts outsourced to external promoters Ticketing available through Ticketmaster
Catering through Mustard Catering (Spotless)
Funding sources Self funded revenue, Government funding (Government Agency)
Primary purpose Recreation, wildlife conservation research, animal breeding and conservation education
Secondary purpose Functions and events
Stageconfigurationoptions Temporary major concert stage
Seating capacity (including seating capacity in all configurations)
Max capacity 4,500 with other options from 30+ pax
Facilities included Concert area with lawn dance area, function centre, conference centre, small lawns, marquee, cafes, outdoor theatre. Full catering options through Mustard Catering
Year constructed 1898
Significantrenovations-yearofworksanddetails Too many to mention
Additional amenities in the facility e.g. Bars, dining venues, exhibition space, meeting rooms
Wedding, meeting and conference functions Group Picnic facilities, Children Birthday facilities, Catering, 2x cafes and function room, Exhibit spaces for functions, Carousel, Giraffe feeding tower, Japanese Gardens with outdoor amphitheatre
Source: Supplied by Perth Zoo and www.perthzoo.wa.gov.au
494

80 Committee For Perth
Quarry Amphitheatre, City Beach
Typical seating and stage layout floorplan
Source:JonDavison/eyeinthesky.com.au
Source: Justin Friend, Quarry Amphitheatre
495
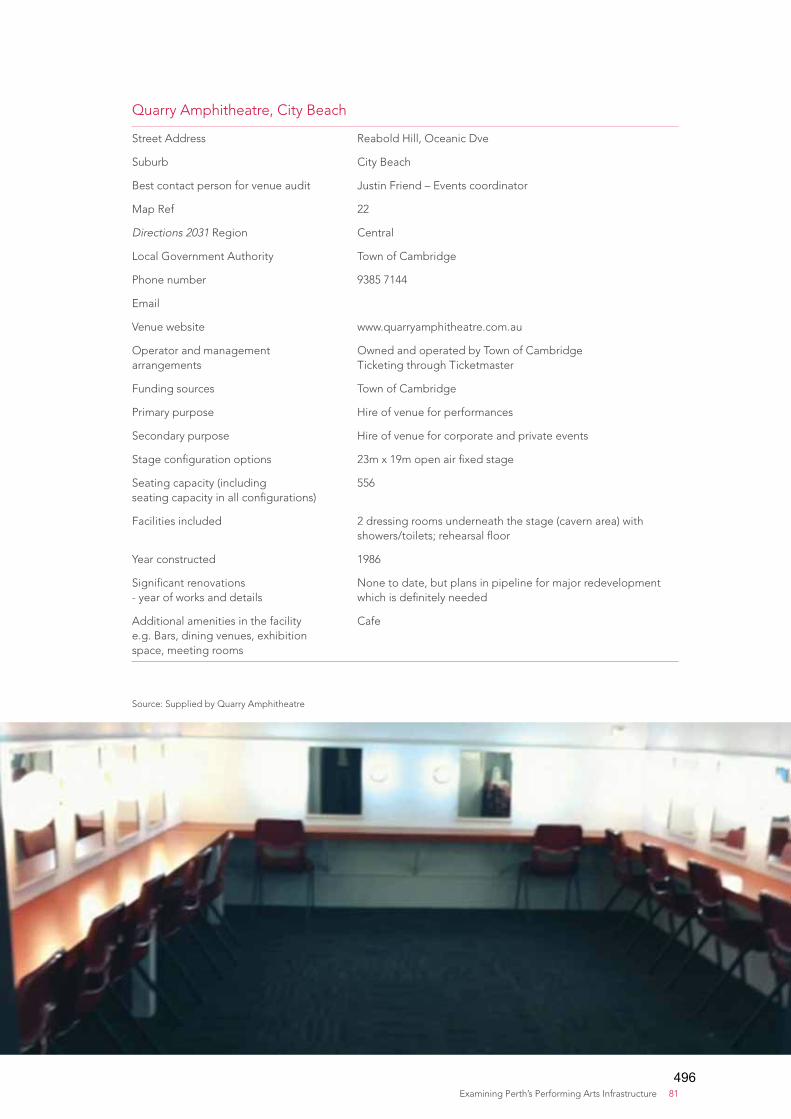
Examining Perth’s Performing Arts Infrastructure 81
Quarry Amphitheatre, City Beach
Street Address Reabold Hill, Oceanic Dve
Suburb City Beach
Best contact person for venue audit Justin Friend – Events coordinator
Map Ref 22
Directions 2031 Region Central
Local Government Authority Town of Cambridge
Phone number 9385 7144
Venue website www.quarryamphitheatre.com.au
Operator and management arrangements
Owned and operated by Town of Cambridge Ticketing through Ticketmaster
Funding sources Town of Cambridge
Primary purpose Hire of venue for performances
Secondary purpose Hire of venue for corporate and private events
Stageconfigurationoptions 23mx19mopenairfixedstage
Seating capacity (including seatingcapacityinallconfigurations)
556
Facilities included 2 dressing rooms underneath the stage (cavern area) with showers/toilets;rehearsalfloor
Year constructed 1986
Significantrenovations -yearofworksanddetails
None to date, but plans in pipeline for major redevelopment whichisdefinitelyneeded
Additional amenities in the facility e.g. Bars, dining venues, exhibition space, meeting rooms
Cafe
Source: Supplied by Quarry Amphitheatre
496
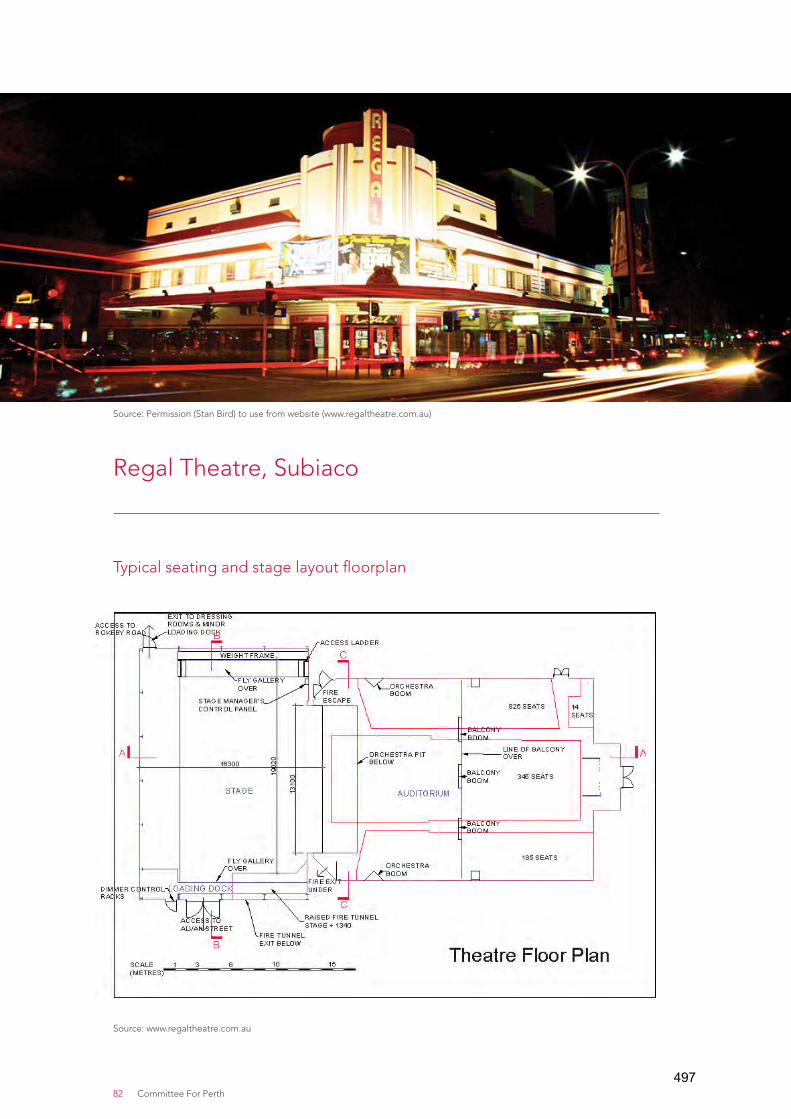
82 Committee For Perth
Regal Theatre, Subiaco
Typical seating and stage layout floorplan
Source: Permission (Stan Bird) to use from website (www.regaltheatre.com.au)
Source: www.regaltheatre.com.au
497

Examining Perth’s Performing Arts Infrastructure 83
Regal Theatre, Subiaco
Street Address 474 Hay St
Suburb Subiaco
Best contact person for venue audit Kim Knight – Manager
Map Ref 23
Directions 2031 Region Central
Local Government Authority City of Subiaco
Phone number 1300 795 012 0448 111 308 (Kim)
Email [email protected]
Venue website www.regaltheatre.com.au
Operator and management arrangements
Interstar leases theatre from Baker Theatre Trust. Tickets through Ticketek
Funding sources No external funding source
Primary purpose Live performances – concerts and theatre
Secondary purpose Nil
Stageconfigurationoptions Large stage can be made smaller by using curtains
Seating capacity (including seating capacityinallconfigurations)
1,086
Facilities included 7 dressing rooms; Green room with kitchen & lounge facilities, bathrooms & showers
Year constructed 1937-38
Significantrenovations- year of works and details
Futurerenovationsrequired–subjecttofinance
Additional amenities in the facility e.g. Bars, dining venues, exhibition space, meeting rooms
Bar&loungeupstairs,ticketingofficedownstairs
Source: Permission (Stan Bird) to use from website (www.regaltheatre.com.au)
498

84 Committee For Perth
Riverside Theatre, PCEC, Perth
Typical seating and stage layout floorplan
Source: PCEC website
499

Examining Perth’s Performing Arts Infrastructure 85
Riverside Theatre, PCEC, Perth
Street Address 21 Mounts Bay Rd
Suburb Perth
Best contact person for venue audit
Jay Pustkuchen, Head of Operations
Map Ref 24
Directions 2031 Region Central
Local Government Authority City of Perth
Phone number 9338 0300
Email [email protected]
Venue website http://www.pcec.com.au/home.aspx
Operator and management arrangements
Privately owned and is operated exclusively by Spotless Facility Services Pty Ltd. Tickets sold through Ticketek
Funding sources Privately funded
Primary purpose Catering for large exhibitions, conferences and events
Secondary purpose None
Stageconfigurationoptions Can be half or full sized; uses 2m and 4m extensions
Seating capacity (including seating capacityinallconfigurations)
The Riverside Theatre can seat 2,500 patrons
Facilities included State of the Art lighting & sound; 3 projectors; Green Room; VIP room; 4 dressing rooms; hearing augmentation throughout; 2 interpreter booths
Year constructed 2004
Significantrenovations- year of works and details
None
Additional amenities in the facility e.g. Bars, dining venues, exhibition space, meeting rooms
Expresso bar in foyer, other bar in foyer
Source: PCEC website
500

86 Committee For Perth
Short Street Theatre, Fremantle
Typical seating and stage layout floorplan
501

Examining Perth’s Performing Arts Infrastructure 87
Short Street Theatre, Fremantle
Street Address 1 Short St
Suburb Fremantle
Best contact person for venue audit
Megan Roberts – Business Manager
Map Ref 25
Directions 2031 Region Central
Local Government Authority City of Fremantle
Phone number 9335 5044
Email [email protected]
Venue website http://www.sppt.asn.au/
Operator and management arrangements
Owned by State Government – Spare Parts Puppet Theatre lease and arrange all activities and bookings
Funding sources State Government Department of Culture and the Arts
Primary purpose Spare Parts Puppet Theatre
Secondary purpose Hire out occasionally, mainly for the Fremantle Festival
Stageconfigurationoptions Static stage (no options to extend) but can be made smaller by curtaining
Seating capacity (including seatingcapacityinallconfigurations)
Licensed for 215 but usually cap seating at 190
Facilities included Rehearsal space; foyer which houses the Puppet Museum
Year constructed Facade is heritage listed
Significantrenovations- year of works and details
Extensions were made but not sure of the year. Ideally looking for a major renovation to increase capacity
Additional amenities in the facility e.g. Bars, dining venues, exhibition space, meeting rooms
None
Source: www.sppt.com.au; www.panaramio.com: Diana house (sauvaehouse113)
502

88 Committee For Perth
Spiegeltent
Typical seating and stage layout floorplan
Source: www.goodperthhunting.wordpress.com
503

Examining Perth’s Performing Arts Infrastructure 89
Spiegeltent
Street Address Mobile venue
Suburb Mobile venue
Best contact person for venue audit Amber Hasler
Map Ref 26
Directions 2031 Region Central
Local Government Authority Mobile venue
Phone number 92276288
Email [email protected]
Venue website artrage.com.au/fringeworld.com.au/ fringeontheroad.com.au
Operator and management arrangements
ARTRAGE
Funding sources Various
Primary purpose Cabaret & Theatre
Secondary purpose Music & Comedy
Stageconfigurationoptions Variable
Seating capacity (including seatingcapacityinallconfigurations)
260-320
Facilities included All
Year constructed Acquired by Artrage 2010 from Klessen Family of Llommer. Some components over 100 years old
Significantrenovations- year of works and details
None
Additional amenities in the facility e.g. Bars, dining venues, exhibition space, meeting rooms
None
Source: www.goodperthhunting.wordpress.com
504

90 Committee For Perth
State Theatre Centre, Northbridge
Typical seating and stage layout floorplan
Source: Kerry Hill Architects CentreStage winning design for the State Theatre Centre of WA
Source: The State Theatre Centre
505

Examining Perth’s Performing Arts Infrastructure 91
State Theatre Centre, Northbridge
Street Address 174-176WilliamStreet,cnrRoeSt
Suburb Northbridge
Best contact person for venue audit Alan Ferris, General Manager, Perth Theatre Trust Ph: 6552 7552
Map Ref 27
Directions 2031 Region Central
Local Government Authority City of Perth
Phone number 9212 9300
Email [email protected]
Venue website www.bsstc.com.au
http://www.perththeatretrust.com.au/
Operator and management arrangements
The day to day operations of The Centre are managed on behalf of the Perth Theatre Trust by the external service provider, AEG Ogden (Perth). Ticketing through Ticketek
Funding sources State Government (Dept of Culture and the Arts)
Primary purpose The State Theatre Centre presents contemporary performing arts, such as theatre and dance, in diverse ways with a focus on distinctive professional and contemporary work produced locally, nationally and internationally
Secondary purpose The State Theatre Company and The Black Swan Theatre are located at the venue
Stageconfigurationoptions Variable
Seating capacity (including seatingcapacityinallconfigurations)
575 seats Heath Ledger Theatre, 234 seats Studio Underground
Facilities included TheCourtyard,amulti-purposeoutdooreventsspace;tworehearsal rooms; two flexible use private suites; a running wardrobe and workshop
Year constructed 2007-2010
Significantrenovations- year of works and details
None
Additional amenities in the facility e.g. Bars, dining venues, exhibition space, meeting rooms
Breakout room, Bar, Restaurant
Source: The State Theatre Centre ; www.2011.Perthfesitval.com.au ; www.heraldsun.com.au
506

92 Committee For Perth
Subiaco Arts Centre, Subiaco
Typical seating and stage layout floorplan
Source: Image supplied by Perth Theatre Trust
Source: www.subiacoartscentre.com.au
507

Examining Perth’s Performing Arts Infrastructure 93
Subiaco Arts Centre, Subiaco
Street Address 180 Hamersley Rd
Suburb Subiaco
Best contact person for venue audit Alan Ferris, General Manager, Perth Theatre Trust Phone: 6552 7552
Map Ref 28
Directions 2031 Region Central
Local Government Authority City of Subiaco
Phone number (08) 9323 3400
Venue website www.perththeatretrust.com.au
Operator and management arrangements
The Subiaco Arts Centre is owned by the City of Subiaco. The Perth Theatre Trust has leased the Centre since 1984 when the building, originally built as the Subiaco City Hall, was converted to a performing arts centre
The day to day operations are managed by the external service provider, AEG Ogden. Ticketing through Ticketek
Funding sources City of Subiaco
Primary purpose Theatre
Secondary purpose Barking Gecko Theatre Company is based here
Stageconfigurationoptions Fixed stage
Seating capacity (including seatingcapacityinallconfigurations)
Main auditorium seats 305, Studio seats 115 and amphitheatre seats 500. Total capacity of 920
Facilities included Ticketing Outlet on the ground floor of the Centre
Year constructed 1956 as the Subiaco Town Hall
Significantrenovations- year of works and details
In2006a$4.7millionrefurbishmentwascarriedoutbytheState Government and the City of Subiaco. Renovations included upgraded rehearsal, studio and theatre spaces, improved patron amenities and disability access
Additional amenities in the facility e.g. Bars, dining venues, exhibition space, meeting rooms
BarFoyer,BarFoyerAlcove,Rehearsalroom,Gallery,multi-purpose room, The Undercroft and a meeting room
Source: www.psstuctures.com.au Source: Image by OlyaB : www.justberry.com.au
508

94 Committee For Perth
Sunken Gardens, UWA, Crawley
Typical seating and stage layout floorplan
Source: University Theatres
509

Examining Perth’s Performing Arts Infrastructure 95
Sunken Gardens, UWA, Crawley
Street Address The University of Western Australia, 35 Stirling Highway
Suburb Crawley
Best contact person for venue audit Bookings Coordinator
Map Ref 17d
Directions 2031 Region Central
Local Government Authority City of Subiaco
Phone number 6488 7407
Email [email protected]
Venue website http://www.theatres.uwa.edu.au/venues/sunken-garden
Operator and management arrangements Run by University Theatres
Funding sources None
Primary purpose Performing Arts
Secondary purpose Education
Stageconfigurationoptions Fixed Stage
Seating capacity (includingseatingcapacityinallconfigurations)
300 (on grass), 385 (on seats)
Facilities included Open air auditorium
Year constructed 1929
Significantrenovations-yearofworks and details
None
Additional amenities in the facility e.g. Bars, dining venues, exhibition space, meeting rooms
None
Source: www.treasures.uwa.edu.au
510

96 Committee For Perth
Swan Park Theatre, Midvale
Typical seating and stage layout floorplan
Source: Image by OlyaB : www.justberry.com.au
511
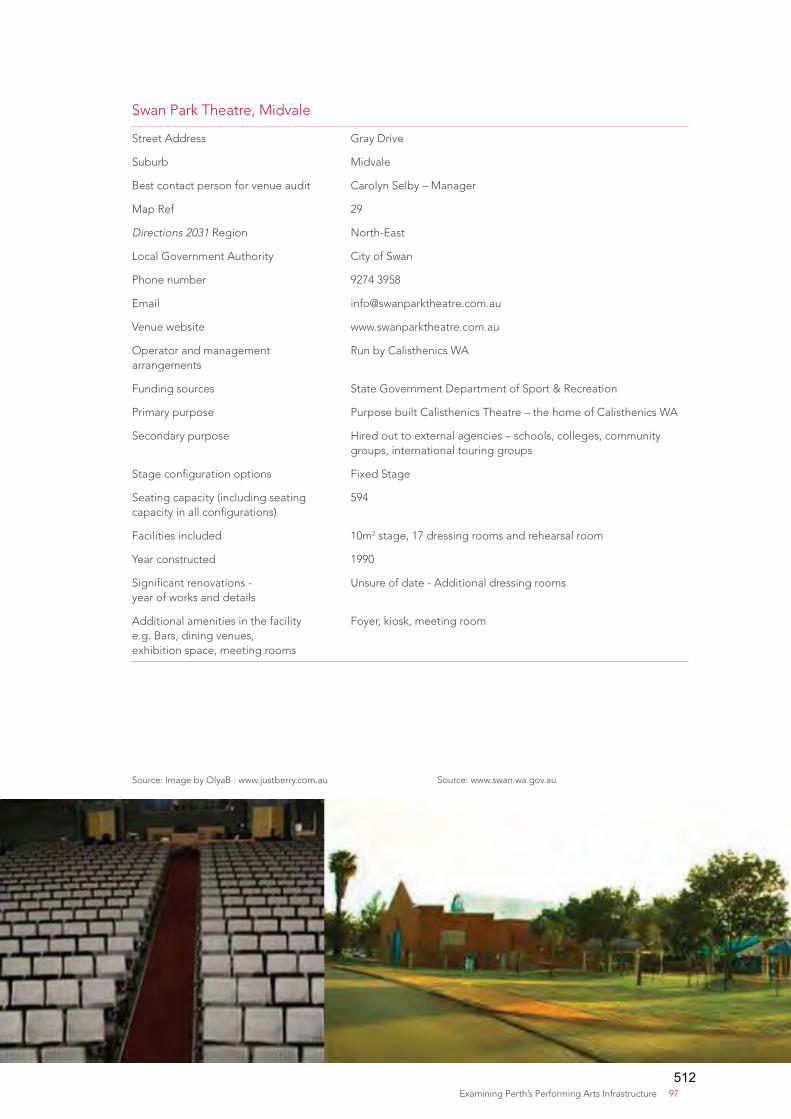
Examining Perth’s Performing Arts Infrastructure 97
Swan Park Theatre, Midvale
Street Address Gray Drive
Suburb Midvale
Best contact person for venue audit Carolyn Selby – Manager
Map Ref 29
Directions 2031 Region North-East
Local Government Authority City of Swan
Phone number 9274 3958
Email [email protected]
Venue website www.swanparktheatre.com.au
Operator and management arrangements
Run by Calisthenics WA
Funding sources State Government Department of Sport & Recreation
Primary purpose Purpose built Calisthenics Theatre – the home of Calisthenics WA
Secondary purpose Hired out to external agencies – schools, colleges, community groups, international touring groups
Stageconfigurationoptions Fixed Stage
Seating capacity (including seating capacityinallconfigurations)
594
Facilities included 10m2 stage, 17 dressing rooms and rehearsal room
Year constructed 1990
Significantrenovations- year of works and details
Unsureofdate-Additionaldressingrooms
Additional amenities in the facility e.g. Bars, dining venues, exhibition space, meeting rooms
Foyer, kiosk, meeting room
Source: Image by OlyaB : www.justberry.com.au Source: www.swan.wa.gov.au
512

98 Committee For Perth
The Bakery
Typical seating and stage layout floorplan
Source: www.somewhereelse.com.au
513

Examining Perth’s Performing Arts Infrastructure 99
The Bakery
Street Address 233 James St
Suburb Northbridge
Best contact person for venue audit Amber Hasler
Map Ref 30
Directions 2031 Region Central
Local Government Authority City of Perth
Phone number 9227 6288
Email [email protected]
Venue website www.artrage.com.au/ www.nowbaking.com.au
Operator and management arrangements ARTRAGE
Funding sources Boxoffice,bar,venuehire
Primary purpose MusicVenue/Multi-arts
Secondary purpose Exhibition/Performance
Stageconfigurationoptions Adaptable
Seating capacity (includingseatingcapacityinallconfigurations)
650 flatfloor
Facilities included All
Year constructed 2002
Significantrenovations-yearofworksanddetails 2010
Additional amenities in the facility e.g. Bars, dining venues, exhibition space, meeting rooms
Bars, Exhibition spaces, Rehearsal rooms
Source: www.nowbaking.com.au
514

100 Committee For Perth
WACA Stadium
Typical seating and stage layout floorplan
Source: www.austadiums.com.au
515

Examining Perth’s Performing Arts Infrastructure 101
WACA Stadium
Street Address WACA grounds, Nelson Crescent
Suburb East Perth
Best contact person for venue audit John Soutar, Business Manager
Map Ref 31
Directions 2031 Region Central
Local Government Authority City of Perth
Phone number (8) 9265 7222
Email [email protected]
Venue website http://www.waca.com.au/
Operator and management arrangements Tickets through Ticketmaster
Funding sources
Primary purpose Cricket
Secondary purpose Events, Concerts
Stageconfigurationoptions Feasible for variety of uses: Sport and Stage with fieldstanding
Seating capacity (including seating capacity in all configurations)
24,500 patrons
Facilities included Scoreboard and Media Night lighting and indoor Centre Changerooms
Year constructed 1880
Significantrenovations-yearofworksanddetails 1895 First Grandstand 1931 Farley Stand Demolished 1954 Replacement of scoreboard 1960 Players Pavilion with WACA administration 1970 Additional seating 1984-1988Realignmentandresurfacingofground,construction of new terracing and outer seating. 1986 Six large light towers installed. 2002Redevelopment-groundcapacityreducedand playing arena decreased by 31m and eastern and western boundaries.
Additional amenities in the facility e.g. Bars, dining venues, exhibition space, meeting rooms
Function Facilities, Catering, ATM
Source: www.gaurdian.co.uk www.sportskeeda.com
516

102 Committee For Perth
Winthrop Hall, UWA, Crawley
Typical seating and stage layout floorplan
Source: University Theatres
Source: www.theatres.uwa.edu.au
517