Embed Size (px)
Citation preview

Journal of Theoretical and Applied Information Technology 31
st August 2016. Vol.90. No.2
© 2005 - 2016 JATIT & LLS. All rights reserved.
ISSN: 1992-8645 www.jatit.org E-ISSN: 1817-3195
124
THE MODERATING EFFECT OF USER INVOLVEMENT ON
USER SATISFACTION ENABLERS OF HUMAN RESOURCE
MANAGEMENT SYSTEM
1MAZLAN MOHD SAPPRI,
2AHMAD SUHAIMI BAHARUDIN
1PhD student, School of Computer Science,
Universiti Sains Malaysia, Penang, Malaysia. 2 Senior Lecturer, School of Computer Science,
Universiti Sains Malaysia, Penang, Malaysia
Email: [email protected], [email protected]
ABSTRACT
This study aims to discuss the moderating variables namely user involvement (UI) in the information
system user satisfaction – individual benefits relationship. The purpose of this study to overcome the
shortcomings in understanding information system (IS) user satisfaction among public sector employees.
The totals of 250 public sector operational employees of Human Resource Management Information
System (HRMIS) in Kedah, Malaysia were used as sample for this study. Based on analysis and findings
gathered through structural equation modeling (SEM), it can be concluded that UI had slightly moderate
the relationship between user satisfaction and individual benefit. The results indicated strong support for UI
in Malaysian public sector context, and also hinted strong and positive influenced proven in the previous
studies for UI constructs. This study also will open new opportunities for those who want to further
investigate information system success in Malaysian context.
Keywords: DeLone and McLean, Information System, User Involvement, SEM-PLS, User Satisfaction
1. INTRODUCTION
The IS act as main medium in Malaysian
public sector; between services provided by an
organization and citizens to steer business
process and they are the key to lead to the
success or failure of an organization in public
sector [8]. According to [8], level of IS can be
divided into three categories of employees;
strategic employees, managerial employees and
operational employees. These category of
employees have different type of IS and each IS
specifically designed and developed to cater
multi-functions of job specifications especially
in public sector. The IS are characterized by
routine based applications to periodically based
applications. For example, IS at operational level
are characterized as routine based or transaction
based and this group of people need high job
concentration because of dealing with tons of
data and usually operating in a current time
frame [8]. Top level managements are relying on
operational workers to summarize data in
decision making process [16]. Operational
employees represent biggest portion in
Malaysian public sector employees and
according to Malaysian Labor Force Survey
Report 2012 which is 697,600 or 5.5% are
employed in public administrative in 2012.
We define user involvement (UI) in this
paper as the as user engagement which combined
user participation (the behavior) and user
involvement (the attitude), borrowing the
definition from [24]. In order to further
understand the role of UI on user satisfaction,
multiple constructs were considered namely US
enablers. US enablers consists of system quality,
information quality, service quality together with
technostress are commonly used to measure user
satisfaction. These quality factors were found to
be the most widely used surrogate of user
satisfaction in IS. This study aims to focus on
how the effect of UI on HRMIS usage in Kedah,
Malaysia. This study targets several benefits.
First, to understand the role of UI as a whole in
IS process development. Therefore, this study
would orient IS developers on how to involve
user actively to ensure the delivered IS is
optimize and worthwhile. Second, to create
Journal of Theoretical and Applied Information Technology 31
st August 2016. Vol.90. No.2
© 2005 - 2016 JATIT & LLS. All rights reserved.
ISSN: 1992-8645 www.jatit.org E-ISSN: 1817-3195
125
balance in communication between IS
developers and IS user, since there were thoughts
that assumed much participation from the user
would distract the development process. Third,
to overcome the government reputation in
providing IS applications to serve community
needs because in recent years there were many
complaints regarding government applications
such as SAPS, THIS, MySiKAP which
contributed to user dissatisfaction. Section 2
discusses the relevant literature review on IS/IT
acceptance, the foundation of the research
model, and the current state of IS/IT in the Arab
world. Section 3 introduces the proposed
research model. Section 4 presents the research
methodology. Section 4 describes the results and
their implications while the last section, Section
5, summarizes the findings and points out future
works directions.
2. STUDY BACKGROUND AND
LITERATURE REVIEW
2.1 Study Background
The Malaysian public sector has a strong
start to moving forward in successful
implementation and deployment of ICT in
government agencies. Government Chief
Information Officer (GCIO) was appointed in
2008 under MAMPU to coordinate policies and
legislation among government agencies. The
main responsibilities for GCIO are to ensure
infrastructure and standards are applied to
enabled ICT services provided, so that operation
cost can be controlled and uniformity among
government agencies. Software development
approaches can be divided into System
Development Life Cycle (SDLC) method and
agile method. Most developers choose agile
method in developing IS due to can gain rapid
client feedback, good communication between
clients and developers, fast outcome, continuous
attention between technical team and clients and
can accommodate for late changes in
requirements. But, sometimes SDLC method is
favorable when IS project is at large scale due to
effort estimation, proper documentation and
designation, improve project tracking and for
better decision making. User involvement in IS
development occurred at several stage such as
early phases (gathering requirements phase and
use cases), intermediate phase (user interface
design, unit testing) and implementation phase
(training and support). If user involvement
processes do not occurred or lacked in any
phases stated above, the tendency of IS project
will fail is high [27].
As for MAMPU, there are no standard
mechanisms to monitor level of user
involvement or participation in each IS
development project. Project Monitoring System
II (SPP II) was established as a web based tool to
facilitate the Ministry/Agency to record and
monitor development projects less than 5 years.
By using SPP II, projects’ progress can easily be
monitored, but it does not provide detailed
information regarding user involvement. For out-
sourced IS projects, appointed companies have
full authority to control the progress of the
project without interference from other parties, in
addition they only need to update the status of
project’s progress to MAMPU periodically. On
top of that, MAMPU also entrusted outsourced
companies to run the project as long the project
can be completed within timeframe. As a
conclusion, every outsourced company has their
own approaches and policies in participating the
user in there is projects. There are cases where IS
user only participating in the beginning or in
gathering requirement phase, but not getting
involved at almost every project stage. The IS
user are needed to do system testing at system
acceptance test without fully aware IS
capabilities in terms of systems’ functions,
interfaces and processes. The situation could lead
from bad to worse when IS user need to learn
how to use the IS based on developers’
perception, but not from their thoughts.
2.2 Literature Review
The review of literature begins in the early
80’s when [2] studied the impact of user
involvement on information satisfaction and that
was an earlier attempt for improving system
quality and ensuring successful IS
implementation. Based on user satisfaction
instrument developed by [1] used in the study,
the results demonstrate that user involvement
was proven significant to lead greater system
usage and user satisfaction in IS. Since then, user
involvement become vital role in measuring IS
user satisfaction, for example the studies made
by [9], [10], [12] and [16] proved that when user
are involved in IS development activities,
outcome of the IS are more acceptable and
satisfied in terms of user satisfaction and
usefulness.

Journal of Theoretical and Applied Information Technology 31
st August 2016. Vol.90. No.2
© 2005 - 2016 JATIT & LLS. All rights reserved.
ISSN: 1992-8645 www.jatit.org E-ISSN: 1817-3195
126
To draw attention why user involvement is
important construct, the past research shown
great interest in using user involvement as one of
the predictor to measure IS success and user
satisfaction. User involvement is used to increase
acceptance of an IS and it concerns to develop
realistic expectations of the system, provides
guideline between development team and the
users, and increases system ownership by the
user [1]; [17]. The issue between developer
involved the IS user too little, is a primary
concern why the user remains unsatisfied with
the current IS [1]. The similar studies also
revealed low user involvement suggests that IS
developer believe IS users does not have too
much involve in providing input to a technical
problem [2]; [16]. Their findings show that the
developer who worked within the same project
viewed the user involvement as unhelpful and
insignificant. Meanwhile, a study by
ComputerWeekly.com joined with Oxford
University in 2003 revealed user involvement
was at top three in most common risk factor
ranking in IS failure. The study indicates lack of
client or end-user commitment may resulting to
the IS failure especially when the product is
delivered to the user. In a separate study, [15]
has defined what it takes for success of an IS. In
his study namely CHAOS study suggested
commitment from users is ranked as most
important after top management support as for
improvement factors.
[19] and [18] also emphasized user
involvement can play role as moderator to the
user satisfaction especially at early stages (e.g.
system requirement definition). Their study
covers the obstacles and benefits of user
involvement from past researchers and a key
finding revealed that through developer’s
experience, they will get more accurate user
requirements by involving users. This in line
with findings by [27] also highlighted the
importance of user involvement at early stages.
[27] in their work of system design and
development, shown lacking of engagement of
customers in system development life cycle
(SDLC) could lead to discontentment with the
IS. This statement indicates that user
involvement had influence on IS user
satisfaction. However, [23] finds user
involvement is a not good predictor that can lead
user satisfaction and IS usage. Meanwhile, the
notion of user involvement used as moderator
inspired by suggestion from [27]. She
emphasized the role of user involvement can be
diversified either as moderator or mediator that
lead to user satisfaction. These studies have been
useful in shedding light in understanding the
relationship of user involvement and user
satisfaction in IS development. The main
concern of this study is to understand is it user
involvement have positive influence on IS user
satisfaction. Since this study considers only
mandatory environment on IS usage, so the use
construct is eliminated.
3. RESEARCH MODEL AND
HYPOTHESES
3.1 The research model
The research model (Figure 2) provides the
theoretical ground of the study. This model is
motivated by the DeLone and McLean IS
success model (Figure 1) with some
modifications is made regarding it constructs to
fit the purpose of this study. The model
investigates the relationship between seven
variables. These variables were included based
on a review of past IS/IT literature related to user
satisfaction in IS measurement. The included
variables are system quality, information quality,
technology stress, service quality, user
involvement, IS user satisfaction and net
benefits. Independent variables (IV) in the model
are grouped as User satisfaction enablers which
are system quality, information quality,
technology stress and service quality. The net
benefits will represent as dependent variable
(DV) in the proposed research model.
Meanwhile, user involvement is proposed to
moderate the relationship between IS user
satisfaction and net benefits.

Journal of Theoretical and Applied Information Technology 31
st August 2016. Vol.90. No.2
© 2005 - 2016 JATIT & LLS. All rights reserved.
ISSN: 1992-8645 www.jatit.org E-ISSN: 1817-3195
127
Figure 1:DeLone and McLean IS Success Model Figure 2: Proposed Research Model
3.2 Hypotheses
A set of hypotheses is proposed for each of the
construct in the model as stated below and
shown in the proposed research model. The
relationship behind each hypothesis is shown
below and is supported by previous literature.
H1: System Quality – IS User Satisfaction
System quality is positively associated with IS
user satisfaction. [10][15][39]
H2: System Quality – Net Benefits
System quality is positively associated with net
benefits. [15]
H3: Information Quality – IS User Satisfaction
System quality is positively associated with IS
user satisfaction. [10][15]
H4: Information Quality – Net Benefits
System quality is positively associated with net
benefits. [10][15]
H5: Technostress – IS User Satisfaction
Technostress is positively associated with IS user
satisfaction. [35][36]
H6: Technostress – Net Benefits
Technostress is positively associated with net
benefits. [35][36]
H7: Service Quality – IS User Satisfaction
System quality is positively associated with IS
user satisfaction. [15][10]
H8: Service Quality – Net Benefits
System quality is positively associated with net
benefits. [15][39]
H9: IS User Satisfaction – Net Benefits
IS User Satisfaction is positively associated with
net benefits. [10][39]
H10: User Involvement
The relationship between IS user satisfaction and
net benefits is moderate by user involvement.
[10]
4. RESEARCH METHOD
The survey instrument consists of a
structured questionnaire was developed to
measure individuals’ perceptions of user
involvement on IS user satisfaction. The totals of
250 public sector operational employees of
Human Resource Management Information
System (HRMIS) in Kedah, Malaysia were used
as sample for this study. In constructing this
research model, the authors followed a process
of fourth steps. First, existing literature on user
involvement, user satisfaction and IS success
was thoroughly reviewed. Second, based on
literature review the questionnaire items were
review and sorted to match the study purposes,
third the meeting with IS/IT managers in public
sector department in Kedah was held to obtain
view and thoughts regarding the selected items
which will be used in survey. The study posited
four independent variables which derived from
DeLone and McLean IS success model (Figure
2). The selected variables were deemed most
appropriate and measurable. Lastly, as for the
US enablers
(IVs) System
Quality
IS User
Satisfaction
Info.
Quality
Techno-
stress
Service
Quality
Net
Benefits
User
Involvement Info.
Quality
System.
Quality
Service
Quality
Intention to
use / Use
Net
Benefits User
Satisfaction

Journal of Theoretical and Applied Information Technology 31
st August 2016. Vol.90. No.2
© 2005 - 2016 JATIT & LLS. All rights reserved.
ISSN: 1992-8645 www.jatit.org E-ISSN: 1817-3195
128
purpose validity, the questionnaire was
overviewed before it was sent out to make sure
that the respondent would be able to understand
and answer the questions. The instrument was
reviewed by experts and academics with
knowledge of survey design technique.
4.1 Measures
A questionnaire was designed reflecting the
seven constructs of the research model. Items for
measuring each construct were selected from
prior studies. System Quality was assessed with
15 items from [32], Information Quality with 12
items also from [32], Technostress with 17 items
was adopted from [36] and Service Quality with
12 items from [33], IS User Satisfaction with 6
items were based from [10] and [39]. Instrument
of User Involvement with 11 items was adopted
from [24] and finally, Net Benefits with 6 items
was adopted from [12]. Items in the
questionnaire were measured on a seven-point
Likert scale ranging from (1) strongly agree to
(7) strongly disagree. The summary for each
construct is presented in Table 1 as shown
below.
Table 1: Construct and Items Adopted for this Study
Construct Items adopted from past
literature
System Quality [32]
Information Quality [32]
Technostress [36]
Service Quality [33]
IS User Satisfaction [10], [39]
User Involvement [24]
Net Benefits [12]
Questions related to characteristics of the
respondents such as gender, age, experience,
level of education and job title were also
included in the questionnaire.
4.2 Sample and pilot study
The subjects in this study are employees at
operational level of public sector organization in
Kedah, Malaysia. Totally 250 respondents were
participated in this study and focus groups are
operational level workers who currently worked
with HRMIS.
Pilot study was carried out to refine the
questionnaire before it sent out to the actual
respondents. Pilot test can minimize the potential
problems in the pre-designed questionnaire such
as feasibility, time, cost, adverse events and
sample size issue to predict an appropriate
sample size during a full-scale research project
[28]. It is a potentially valuable source to rectify
anything missing, so that can be added later to
improve the chances of good outcome.
In the study, both academicians and
practitioners were involved in the pilot test. The
first two drafted questionnaire first was sent out
to two research assistant in Universiti Utara
Malaysia (UUM) to review the content of
questionnaire in terms of structure, readability,
completeness and suitable for study domain. The
questionnaire was prepared in Malay to suit
respondent profile, where most of them are
coming from operational and support staff. After
minor adjustment has been made, 60
questionnaires were distributed to public sector
staff in Kedah covering federal government,
ministry, state, local and district council. Based
upon all the feedback received from pilot study,
the items in the questionnaire were rephrased,
corrected, changed and eliminated for better
improvement. From the pilot test distribution, 60
questionnaires were used and 47 questionnaires
(78.33%) were returned and only 40 (66.67%)
usable questionnaire were used due to
completion and meet the criteria. The
respondents were reminded that the distributed
questionnaire will be collected within two
weeks.
4.3 Data collection
Total of 323 questionnaires were randomly
distributed to public sector agency in Kedah,
Malaysia. Generally, all departments in
Malaysian public sector uses grade 17 to 32 to
represent operational and support staff at
different level, while ranging grade from 37 to
41 represent some of the professional staff. A list
of public sector staff in Kedah state is retrieved
from Public Service of Malaysia or known as
Jabatan Perkhidmatan Awam (JPA). This is
comprehensive list maintained and updated by
JPA regularly. The record from the list was used
and therefore there is confidence that the study
used an updated list of HRMIS usage.
After one month, a total of 169 complete
and usable questionnaires were returned. Two
weeks time was given as first reminder to the
respondents who still had not returned the
survey. Then, next two weeks after the first

Journal of Theoretical and Applied Information Technology 31
st August 2016. Vol.90. No.2
© 2005 - 2016 JATIT & LLS. All rights reserved.
ISSN: 1992-8645 www.jatit.org E-ISSN: 1817-3195
129
reminder was sent there were 13 usable
questionnaires returned and resulted 182 total
completed questionnaires. A second reminder
was sent to the respondents who still had not yet
responded and one month time frame is given.
After one month, only 87 questionnaires were
returned but 68 were usable for the study. After
following month, however, no more
questionnaires were received, thus it can be
concluded to stop follow up with the
organization and proceed with data analysis.
There are 250 out of 323 or 77.40% (Table 2)
questionnaires were returned and usable for
public sector in Kedah.
Table 2: Response Rate of the Questionnaire
Distribution
Category Num. of organizations
Ministry State
Federal
Local District Council
5 4
7
9 2
Num. of
questionnaires
sent
Num. of
returned
questionnaires
Num. of usable
questionnaires
323 269
(83.28%)
250
(77.40%)
Early
replies (1)
Late replies
(2)
Mean (1) Mean (2)
169 82 52.32% 25.39%
4.4 Data analysis
Structural equation model (SEM) technique
was applied using PLS-SEM through the
following steps: (1) specifying the measurement
model; (2) identifying the measurement model;
(3) data cleaning and dimension reduction; (4)
path model estimation; (5) assessment of the
results and (6) assessment the structural model.
The first step is specifying the measurement
model as shown in Figure 3. Then, the type of
the model was identified. As for this study, the
type of the model is reflective type (Figure 4)
and conceptually, a reflective measurement
model happens when the indicators of a construct
are considered to be caused by the construct.
Next, outer loadings test was performed to
ensure indicator reliability of each constructs
connected to it variable. Total, 80 indicators or
items from the questionnaire were used and 12
items were deleted because they do not satisfy
the criteria stated by [18]. Item with outer
loading in between 0.4 to 0.7 are considered to
be removed because it will influence the value of
average variance extracted (AVE) and validity.
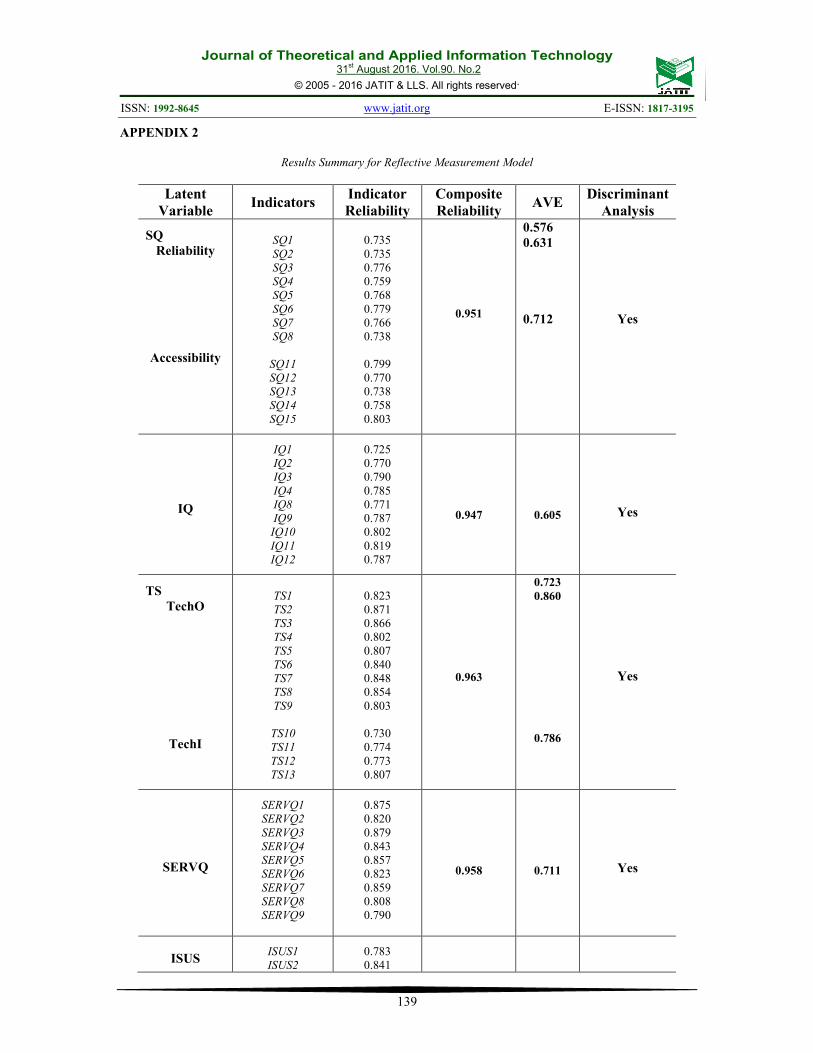
4.5 Convergent and discriminant validity
In PLS, validity is assessed by using convergent
and discriminant validity. Convergent validity
(CV) is the measurement to what extent to which
a measure correlates positively with the
alternatives measures of the same construct. In
other words, CV signifies that measures that
should be related are in reality related and share
a high proportion of variance. To establish CV,
the use of Average Variance Extracted (AVE) is
needed and outer loadings of the indicators
should be high (Table 3). AVE is the average
amount of variance in indicator variables that a
construct able to explain. An AVE value must at
least 0.5 indicates sufficient CV, meaning that a
latent variable is able to explain more than a half
of its indicators on average. Outer loading
relevance testing is carried out to determine
which indicator should be retained or eliminated.
Figure 3: The Proposed Research Model
Figure 4: Reflective Type Model with Indicators

Journal of Theoretical and Applied Information Technology 31
st August 2016. Vol.90. No.2
© 2005 - 2016 JATIT & LLS. All rights reserved.
ISSN: 1992-8645 www.jatit.org E-ISSN: 1817-3195
130
The purpose of discriminant validity is to
measure the extent to which a construct truly
distinct from other constructs by empirical
standards. It is done by examining the cross
loading values in PLS algorithm and indicator
outer loading on associated constructs should be
greater than all of its loadings on other constructs
Table 3: Average Variance Extracted (AVE)
Construct AVE
System Quality
• Accessibility
• Reliability
0.576 0.631
0.712
Information Quality 0.605
Technostress
• TechI
• TechO
0.723
0.860
0.786
Service Quality 0.711
ISUS 0.677
Net Benefits 0.676
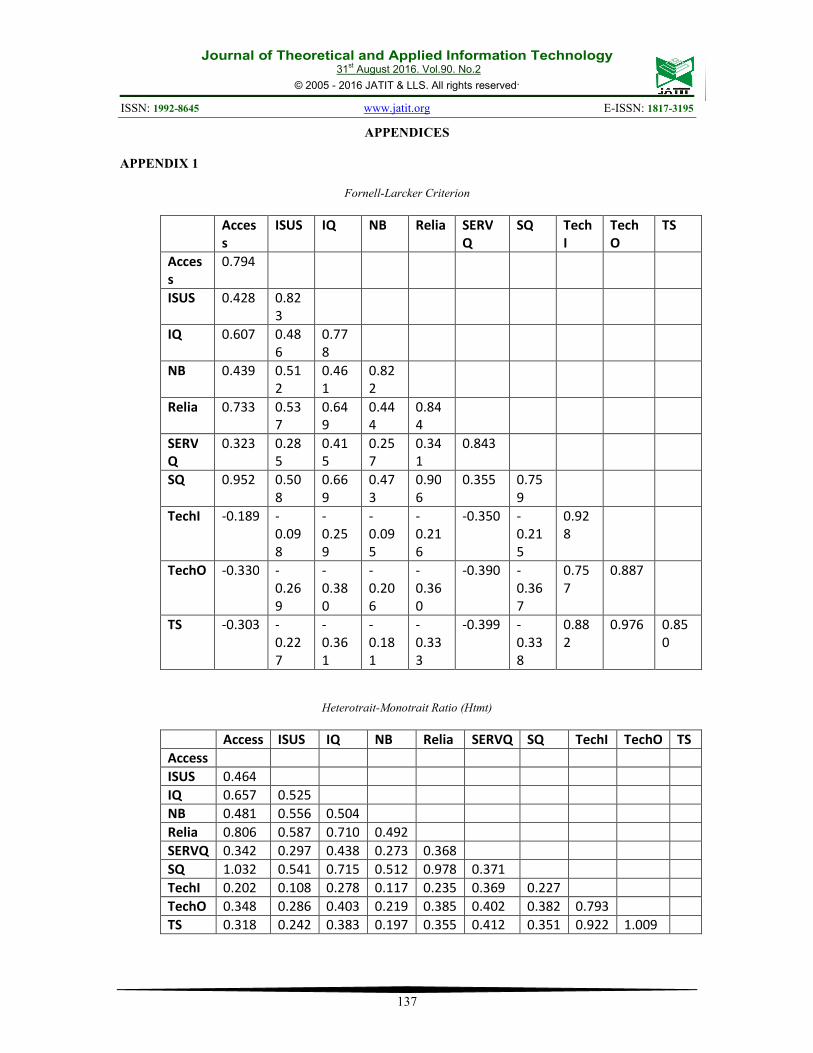
As for discriminant validity, three tests
must be accomplished which are Fornell Larcker,
cross loadings and heterotrait-monotrait ratio
(HTMT) as shown in Appendix 1. Based on the
results from the tests, discriminant validity has
been established.
After evaluation of the measurement model
(step 5) has been carried out, result summary for
the reflective measurement model is presented in
Appendix 2.
4.6 Assessing PLS-SEM results of the
structural model
It is very important to ensure the construct
measures have been confirmed and valid in order
to get reliable and valid judgment for the next
analysis. There are five systematic procedures to
be carried out to assess PLS-SEM structural
model. These procedures involve collinearity
assessment, assessing significance of the
structural model and assessing R2. The reason is
that the estimation of path coefficients in the
structural model is based on ordinary least square
(OLS) regression for each latent variable [18].
After reliability and validity test for each
construct of the measurement model were
undertaken, this section continues by focusing on
path analysis using PLS-Graph. It is carried out
by testing each path in conceptual model
proposed earlier to determine whether it is
statistically significant or otherwise. Based on
hypotheses have been proposed early in the
study, the assessment also will account previous
reported studies. For this purpose, bootstrapping
option in SmartPLS 3 was run twice; without
moderators and with moderators. Finally, to test
the hypotheses, the t-value of the beta (B) path
co-efficient was evaluated using a one-tailed test
where a t-value lies 1.645 or greater at the
confidence level of 0.05. The bootstrapping
result is shown in Appendix 3.
Table 4: Collinearity Assessment
ISUS NB
ISUS 1.43
IQ 1.97 2.05
NB
SERVQ 1.33 1.34
SQ 1.86 2.01
TS 1.27 1.27
*All VIF values < 5, so no collinearity exist.
Table 5: Summary of the Test of the Study
Constructs Β T-
value
Sig. Outcome
SQ -> ISUS H1 0.322 4.540 YES Support
SQ -> NB H2 0.190 2.537 YES Support
IQ -> ISUS H3 0.240 3.342 YES Support
IQ -> NB H4 0.170 2.114 YES Support
TS -> ISUS H5 -0.004 0.062 NO Reject
TS -> NB H6 0.036 0.729 NO Reject
SERVQ -> ISUS
H7 0.069 1.151 NO Reject
SERVQ ->
NB H8 0.040 0.652 NO Reject
ISUS -> NB H9 0.330 4.739 YES Support
*1 tailed test at 0.05*
4.7 Discussion of the Results
Based on summary of the results shown in
Table 5, 9 hypotheses were proposed for the
purpose of the study. The discussion begins with
The results for the beta path co-efficient between
SQ construct and ISUS construct (H1) is positive
and statistically significant at the 0.05 level
(� � 0.322; � � 4.540�. This results in line with
[27] and [20], who found strong support between
the relationship SQ and ISUS (β = 0.54, � �
0.05). The results for H2 between SQ and NB
also significant with (� � 0.190; � � 2.537� at
� � 0.05. This finding is in line with [29]
(� � 0.73; � � 0.001� and [12] (� � 0.20; � �
0.05�. Even [12] was adopted TAM as based
model, this study demonstrate significant
Journal of Theoretical and Applied Information Technology 31
st August 2016. Vol.90. No.2
© 2005 - 2016 JATIT & LLS. All rights reserved.
ISSN: 1992-8645 www.jatit.org E-ISSN: 1817-3195
131
findings for DeLone and McLean IS success
model.
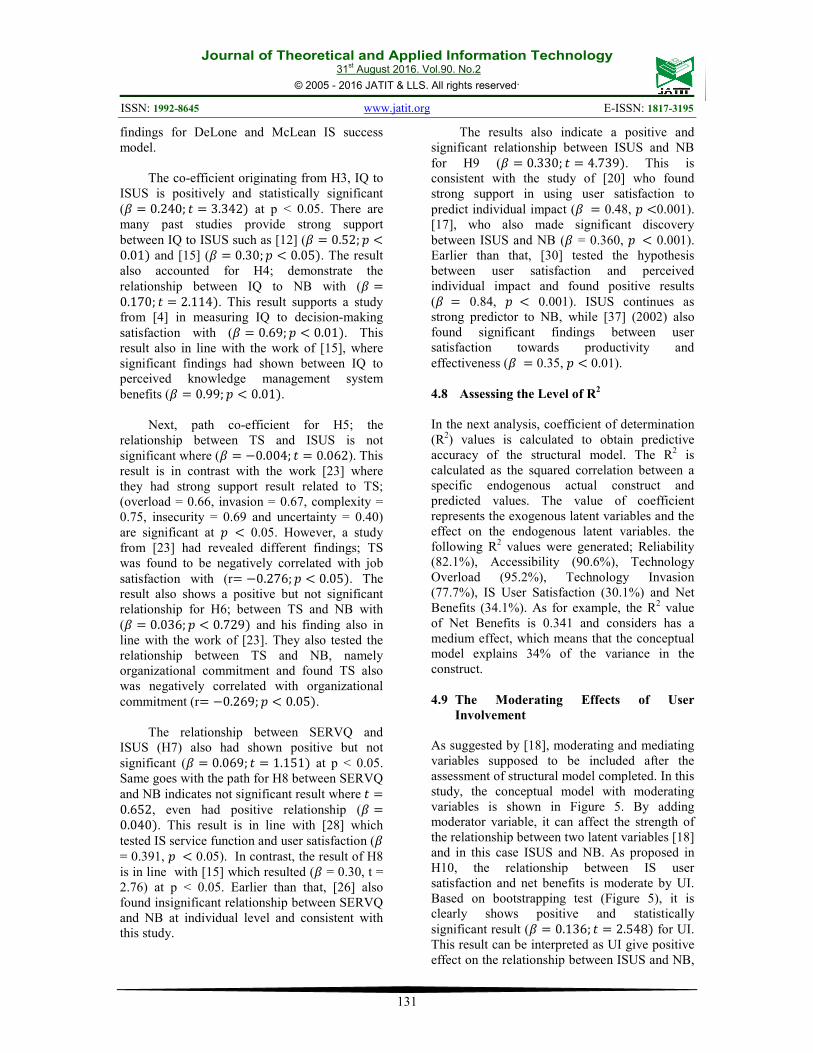
The co-efficient originating from H3, IQ to
ISUS is positively and statistically significant
(� � 0.240; � � 3.342� at p < 0.05. There are
many past studies provide strong support
between IQ to ISUS such as [12] (� � 0.52; � �
0.01� and [15] (� � 0.30; � � 0.05�. The result
also accounted for H4; demonstrate the
relationship between IQ to NB with (� �
0.170; � � 2.114�. This result supports a study
from [4] in measuring IQ to decision-making
satisfaction with (� � 0.69; � � 0.01�. This
result also in line with the work of [15], where
significant findings had shown between IQ to
perceived knowledge management system
benefits (� � 0.99; � � 0.01�.
Next, path co-efficient for H5; the
relationship between TS and ISUS is not
significant where (� � �0.004; � � 0.062). This
result is in contrast with the work [23] where
they had strong support result related to TS;
(overload = 0.66, invasion = 0.67, complexity =
0.75, insecurity = 0.69 and uncertainty = 0.40)
are significant at � � 0.05. However, a study
from [23] had revealed different findings; TS
was found to be negatively correlated with job
satisfaction with (r� �0.276; � � 0.05�. The
result also shows a positive but not significant
relationship for H6; between TS and NB with
(� � 0.036; � � 0.729� and his finding also in
line with the work of [23]. They also tested the
relationship between TS and NB, namely
organizational commitment and found TS also
was negatively correlated with organizational
commitment (r� �0.269; � � 0.05�.
The relationship between SERVQ and
ISUS (H7) also had shown positive but not
significant (� � 0.069; � � 1.151� at p < 0.05.
Same goes with the path for H8 between SERVQ
and NB indicates not significant result where� �
0.652, even had positive relationship (� �
0.040�. This result is in line with [28] which
tested IS service function and user satisfaction (�
= 0.391, � � 0.05). In contrast, the result of H8
is in line with [15] which resulted (� = 0.30, t =
2.76) at p < 0.05. Earlier than that, [26] also
found insignificant relationship between SERVQ
and NB at individual level and consistent with
this study.
The results also indicate a positive and
significant relationship between ISUS and NB
for H9 (� � 0.330; � � 4.739�. This is
consistent with the study of [20] who found
strong support in using user satisfaction to
predict individual impact (� � 0.48, � �0.001).
[17], who also made significant discovery
between ISUS and NB (� = 0.360, � � 0.001).
Earlier than that, [30] tested the hypothesis
between user satisfaction and perceived
individual impact and found positive results
(� � 0.84, � � 0.001). ISUS continues as
strong predictor to NB, while [37] (2002) also
found significant findings between user
satisfaction towards productivity and
effectiveness (� � 0.35, � � 0.01).
4.8 Assessing the Level of R2
In the next analysis, coefficient of determination
(R2) values is calculated to obtain predictive
accuracy of the structural model. The R2 is
calculated as the squared correlation between a
specific endogenous actual construct and
predicted values. The value of coefficient
represents the exogenous latent variables and the
effect on the endogenous latent variables. the
following R2 values were generated; Reliability
(82.1%), Accessibility (90.6%), Technology
Overload (95.2%), Technology Invasion
(77.7%), IS User Satisfaction (30.1%) and Net
Benefits (34.1%). As for example, the R2 value
of Net Benefits is 0.341 and considers has a
medium effect, which means that the conceptual
model explains 34% of the variance in the
construct.
4.9 The Moderating Effects of User
Involvement
As suggested by [18], moderating and mediating
variables supposed to be included after the
assessment of structural model completed. In this
study, the conceptual model with moderating
variables is shown in Figure 5. By adding
moderator variable, it can affect the strength of
the relationship between two latent variables [18]
and in this case ISUS and NB. As proposed in
H10, the relationship between IS user
satisfaction and net benefits is moderate by UI.
Based on bootstrapping test (Figure 5), it is
clearly shows positive and statistically
significant result (� � 0.136; � � 2.548� for UI.
This result can be interpreted as UI give positive
effect on the relationship between ISUS and NB,

Journal of Theoretical and Applied Information Technology 31
st August 2016. Vol.90. No.2
© 2005 - 2016 JATIT & LLS. All rights reserved.
ISSN: 1992-8645 www.jatit.org E-ISSN: 1817-3195
132
while path co-efficient value from ISUS to NB is
0.279. If the UI becomes higher for the example
increased by one standard deviation point, this
would imply that the relationship between ISUS
and NB would increase by the size of the
interaction term and obtain the value of 0.279 +
0.136 = 0.415. The UI construct was found push
the relationship between ISUS and NB.
Meaning, when more UI from the IS user, the
importance of one’s IS satisfaction become more
important for the explanation of the benefits of
IS itself. UI gives positive impact to ISUS and
NB (ISUS -> NB = 0.330), therefore UI
strengthened the relationship between ISUS and
NB. This result is in line with [2], when they
tested the relationship between UI and ISUS for
pre-development (� � 0.75; � � 0.001� and
post implementation phases (� � 0.31; � �
0.001�. The summary of the results for
moderating variable is presented in Table 6.
Table 6: Summary of the Results for the Moderating
Variables
Support/Rejection of moderating variables
Mod Β T-value Sig. Outcome
UI H9 0.136 2.548 Yes Support
5. DISCUSSIONS AND FUTURE WORKS
The objective of the conceptual model in
this study was to situate the ISUS and NB of
HRMIS based on theoretical and empirical
DeLone and McLean IS Success Model. The
findings have supported 5 out of 9 proposed
hypotheses in main conceptual model as
presented in Table 5. While, for moderating
variables UI had clearly shown significant result
between the relationship between ISUS and NB.
Overall, the findings have supported two
US enablers factors (SQ and IQ) except TS and
SERVQ, which not significant in predicting
ISUS and NB. SQ and IQ resulted strong and
positive impact in predicting ISUS and NB. The
finding for TS in line with previous work of [35]
which resulted not significant related to TS
predicting the NB. Meanwhile, SERVQ found
not significant in the study made by [6] and [29].
Based on respond of the survey, most
employees in Malaysia public sector were agreed
HRMIS absolutely benefited for them.
According to the interview with several IT
managers in public sector, clearly indicate that
the use of HRMIS is mandatory which in line
with one of the scope of the study. The
employees must interact with HRMIS in order to
perform tasks related to personnel, competency
assessment and personal record management or
in other words, there is no other way for them to
accomplish the tasks without HRMIS. This is to
confirm the role of mandatory usage of HRMIS
as one of the main concern of the study. On
contrast, many past studies posited usage as
strong predictor in measuring satisfaction ([39];
[31]; [20]; [17] and [5]). However, as suggested
by [39], IS use is a behavior and not a success
measure therefore it is not suitable in mandatory
environment. Under the mandatory environment,
IS use is not the option that a user can choose, so
IS use construct was eliminated in this case.
Based on survey carried out in this study,
HRMIS is adopted to replace previous human
resource system in public sector. The adoption of
HRMIS confirmed that the application is widely
used at a large scale in Malaysian public sector.
It was found there is no manual practice anymore
in this modern technology era. The result from
the survey also confirmed that computerized IS
(HRMIS) plays very important role in business
nowadays. The employees believed by
integrating HRMIS with other IS would bring
huge benefits to the organizations.
The survey findings revealed that the most
common IS used in public sector are personnel
IS, followed by registration IS and revenue IS.
The employees were also agreed that HRMIS is
well integrated with other IS and they were not
find many problems when operating HRMIS
with other applications. One of the major
concerns of this study is regarding user
satisfaction towards net benefits. The results
supported the first objective which indicated that
IS user satisfaction (ISUS) indeed is a predictor
to net benefits (NB). Even though, R2 value for
ISUS only at 0.341 or 34.1% explained the NB,
but it was sufficient enough to fulfill the first
objective of this study. The survey also
discovered that system quality (SQ) and
information quality (IQ) continue as importance
constructs to explain ISUS. However,
technostress (TS) and service quality (SERVQ)
was found not significant in explaining ISUS and
this is contradicted with past studies which
posited TS and SERVQ as predictors to ISUS.
However, this anomaly brings opportunities for
discussion on future research. In this study, TS

Journal of Theoretical and Applied Information Technology 31
st August 2016. Vol.90. No.2
© 2005 - 2016 JATIT & LLS. All rights reserved.
ISSN: 1992-8645 www.jatit.org E-ISSN: 1817-3195
133
was demonstrated insignificant due to most
employees felt that they were well-adapted with
current technology development and well
prepared for any technology changes. This is
because with rapid evolvement of technologies
nowadays, their openness toward technology was
not an issue or barrier for them to adapt with
HRMIS. The results on SQ, IQ, TS and SERVQ
answered the second objective of the study on
explaining ISUS.
The perception on employees toward
HRMIS also produced supportive findings
regarding user involvement (UI). The respond
from the survey indicated most of the employees
do not involved with the development of HRMIS
either pre and post implementation. The
application was already installed and ready to
use within the organization, so the employees do
not know much regarding HRMIS
implementation. However, based on interviews
with several employees who were directly
involved with HRMIS felt that they were only
allowed to involve at minimal level. There were
some discussion held between them and IS
developer, and then they were asked several
questions before HRMIS is implemented. Thus,
they felt do not fully engaged with HRMIS in
terms of involvement because they expected
more role should be played by them during
HRMIS implementation such as contributing
ideas, work difficulties, limitation technology
and most importantly HRMIS should be
designed based on their perspective of work and
not only from perspective managerial point of
view. However, the results from PLS analysis
shown that UI had slightly significant in
moderate the relationship between ISUS and NB.
This implied, UI still play important role to
influence satisfaction and according to [19] UI
between user and the developer
Figure 5: Results from the Conceptual Model
of the IS should be in line together in order to
ensure the IS is worthwhile of investment in
terms functionalities, satisfaction and benefits.
6. ACKNOWLEDGEMENTS
The authors would like to thank the School of
Computer Sciences, Universiti Sains Malaysia
(USM) as this research has been supported from
both Research University Grant (RUI) [Account
Number: 1001/PKOMP/811251] and Short Term
H1 0.322 (4.540)*
H2 0.190 (2.537)*
H3 0.240 (3.342)*
H4 0.170 (2.114)*
H5 -0.004 (0.062)
H6 0.036 (0.729)
H7 0.069 (1.151)
H8 0.040 (0.652)
H9 0.330 (4.739)*
H10 0.136 (2.548)*

Journal of Theoretical and Applied Information Technology 31
st August 2016. Vol.90. No.2
© 2005 - 2016 JATIT & LLS. All rights reserved.
ISSN: 1992-8645 www.jatit.org E-ISSN: 1817-3195
134
Research Grant [Account Number:
304/PKOMP/6312103] from the Universiti Sains
Malaysia.
REFERENCES
[1] Bailey, J.E. & Pearson, S.W., “Developing
a Tool for Measuring and Analyzing
Computer User Satisfaction”, Management
Science, Vol. 29, No.5, 1983, pp. 530-545.
[2] Barki, H., & Hartwick, J., “Explaining the
Role of User Participation in Information
System Use Participation vs Involvement
Theory of Reasoned Action (TRA)”,
Management Science, Vol. 40, No. 4, 1994,
pp. 440–465.
[3] Baroudi, J. J., Olson, M. H., & Ives, B., “
An Empirical Study of the Impact of User
Involvement on System Usage and
Information Satisfaction”, Communication
of ACM, Vol. 29, No. 3, 1986, pp. 232–
238.
[4] Belkhamza, Z., & Wafa, S., “The
Assessment of Information Systems
Success from the Organizational Context
Perspective, IEEE Transactions of
Software Engineering, 2011, pp. 792–795.
[5] Chiu C. M, Chiu C. S & Chang H.C.
“Examining the Integrated Influence of
Fairness and Quality on Learners’
Satisfaction and Web-based Learning
Continuance Intention”, Information
Systems Journal Vol. 17, No. 3, 2007, pp.
271–287.
[6] Choe, J. M., “The Relationships among
Performance of Accounting Information
Systems, Influence Factors, and Evolution
Level of Information Systems”, Journal of
Management Information Systems Vo. 12,
No. 4, 1996, pp. 215–239.
[7] Compeau, D.R., & Higgins, C.A.,
“Computer Self-Efficacy: Development of
a Measure and Initial Test”, MIS Quarterly,
Vol. 19, No. 2, 1995, pp. 189 - 211.
[8] Daud, M. N., “The Impact of Information
Systems on Organizations in Malaysia:
Knowledge Worker Aspect”, Vol. 1, 1997,
pp. 101–109.
[9] Davis, F. D., “Perceived Usefulness,
Perceived Ease of Use, and User
Acceptance of lnformation Technology”,
MIS Quaterly, Vol. 13, No. 3, 1989, pp.
319–340.
[10] DeLone, H. W., & McLean, E. R., “The
DeLone and McLean Model of Information
Systems Success : A Ten-Year Update”,
Journal of Management Information
Systems, Vol. 19, No. 4, 2003, pp. 9–30.
[11] Doll, W. and G. Torkzadeh, “The
Measurement of End-User Computing
Satisfaction. MIS Quarterly, Vol. 12, No. 2,
1994, pp. 259-74.
[12] Gable, G, Sedera, D & Chan, T., “Re-
conceptualising Information System
Success: the IS Impact Measurement
Model”, Journal of the Association for
Information Systems, Vol. 9, No. 7, 2008,
pp. 337 - 408.
[13] Garceau, L. et al., “Object Oriented
Analysis and Design: A New Approach to
Systems Development”, Journal of Systems
Management, Vol. 44, 1993, pp. 25–33.
[14] Goodhue, D. L., & Thompson, R. L., “Task
technology Fit and Individual
Performance”, MIS Quarterly, Vol. 19, No.
2, 1995, pp. 213−233.
[15] Gorla, N., Somers, T. M. & Wong, B.,
“Organizational Impact of System Quality,
Information Quality, and Service Quality”,
The Journal of Strategic Information
Systems, Vol. 19, No. 3, 2010, pp. 207-
228.
[16] Gurbaxani, V. & Whang, S., “The Impact
of Information Systems on Organizations
and Markets”, Communications of the
ACM, Vol. 34, No. 1, 1991, pp. 59-73.
[17] Halawi, L. A, McCarthy, R. V & Aronson,
J,E, “An Empirical Investigation of
Knowledge Management Systems’
Success”, J Comp Inf Syst, Vol. 48, No. 2,
2008, pp. 121-35.
[18] Hair, J.F., Hult, G.T.M., Ringle, C.M. &
Sarstedt, M., “A Primer on Partial Least
Squares. Structural Equation Modeling
(PLS-SEM)”, 2014, Sage Publication, Los
Angeles.
[19] Haslinda, S., Abd. Rahman, A., & Ibrahim,
O., “Government ICT Project Failure
Factors : Project Stakeholders Views”,
Journal of Information Systems Research
and Innovation, 2013, pp. 69–77.
[20] Iivari, J., “An Empirical Test of the Model
of Information System Success”, The DATA
BASE for Advances in Information Systems,
Vol. 36, No. 2, 2005, pp. 8–27.
[21] Ishman, M., “Measuring Information
Success at the Individual Level in Cross-
Journal of Theoretical and Applied Information Technology 31
st August 2016. Vol.90. No.2
© 2005 - 2016 JATIT & LLS. All rights reserved.
ISSN: 1992-8645 www.jatit.org E-ISSN: 1817-3195
135
Cultural Environments”, Information
Systems Success Measurement, 1998, pp.
60-78.
[22] Jackson, S., “Organizational Culture and
Information Systems Adoption: A Three-
Perspective Approach”, Information and
Organization, Vol. 21, No. 2, 2011, pp.
57–83.
[23] Jr, S. T. F., & Franz, C. R., “User
Involvement during Information Systems
Development : A Comparison of Analyst
and User Perceptions of System
Acceptance”, Journal of Engineering and
Technology Management, Vol. 16, 1999,
pp. 329–348.
[24] Kappelman, Leon A., & McLean, E. R.,
“The Respective Roles of User
Participation and User Involvement in
Information”, Proceedings of the Twelve
International Conference on Information
Systems, 1989, pp. 339–349.
[25] Kinzie, M. B., Delcourt, M. A. B., &
Powers, S. M., “Computer Technologies:
Attitudes and Self-Efficacy Across
Undergraduate Disciplines”, Research in
Higher Education, Vol. 35, 1994, pp. 745-
768.
[26] Kositanurit B, Ngwenyama O & Osei-
Bryson Kweku, “An Exploration of
Factors that Impact Individual
Performance in an ERP Environment: An
Analysis Using Multiple Analytical
Techniques”, European Journal of
Information Systems 15(6), 2006, pp. 556–
568.
[27] Kujala, S., “User Involvement: A Review
of the Benefits and Challenges”, Behaviour
& Information Technology, Vol. 22, No. 1,
2003, pp. 1-16.
[28] Leclercq, A., “The Perceptual Evaluation
of Information Systems Using the
Construct of User Satisfaction: Case Study
of a Large French Group”, The
DATABASE for Advances in Information
Systems, Vol. 38, No. 2, 2007, pp. 27–60.
[29] Marble, R. P., “A System Implementation
Study: Management Commitment to
Project Management”, Information &
Management, Vol. 41, No. 1, 2003, pp.
111–123.
[30] Mcgill, T. H. & Klobas, J., “User
Developed Applications and Information
Systems Success: A Test of DeLone and
McLean’s Model”, Information Resources
Management Journal, Vol. 16, No. 1, 2003,
pp. 24–45.
[31] McKeen, J.D., and Guimaraes, T.,
“Successful Strategies for User
Participation in Systems Development”,
Journal of Management Information
Systems, Vol. 14, No. 2, 1997, pp. 133-150.
[32] Nelson, R. R., Todd, P. A., & Wixom, B.
H., “Antecedents of Information and
System Quality : An Empirical
Examination Within the Context of Data
Warehousing”, Vol. 21, No. 4, 2005, pp.
199–235.
[33] Parasuraman, A., “Technology Readiness
Index (TRI): A Multiple-item Scale to
Measure Readiness to Embrace New
Technologies”, Journal of Service
Research, Vol. 2, No. 4, 2008, pp. 307 -
320.
[34] Petter, S., DeLone, W., & McLean, E.,
“Measuring Information Systems Success:
Models, Dimensions, Measures, and
Interrelationships”, European Journal of
Information Systems, Vol. 17, No. 3, 2008,
pp. 236–263. doi:10.1057/ejis.2008.15
[35] Rajesh, K., Roshan, L., Yashu, B. & Saran,
K.S., “Technostress in Relation to Job
Satisfaction and Organizational
Commitment among IT Professionals”,
International Journal of Scientific and
Research Publications, Vol. 3, No. 12,
2013, pp. 12-14.
[36] Ragu-Nathan, T. S., M. Tarafdar, B.S.
Ragu-Nathan & Q. Tu., “The Consequences
of Technostress for End Users in
Organizations: Conceptual Development
and Empirical Validation”, Information
Systems Research, Vol. 4, No. 19, 2008, pp.
417-433.
[37] Rai, A., Lang, S.S. and Welker, R.B.,
“Assessing the Validity of IS Success
Models: An Empirical Test and
Theoretical Analysis”, Information
Systems Research, Vol. 13, No. 1, 2002,
pp. 50-69.
[38] Seddon, P. B., “A Respecification and
Extension of the DeLone and McLean
Model of IS Success”, Information Systems
Research, Vol. 8, No. 3, 1997, pp. 240–
253.
[39] Seddon, P. B. & Kiew, M.Y., “A Partial
Test and Development of the DeLone and
McLean Model of IS Success”, Australian

Journal of Theoretical and Applied Information Technology 31
st August 2016. Vol.90. No.2
© 2005 - 2016 JATIT & LLS. All rights reserved.
ISSN: 1992-8645 www.jatit.org E-ISSN: 1817-3195
136
Journal of Information, Vol. 4, 1996, pp.
90-109.
[40] Sun, J., “User Readiness to Interact with
Information Systems-A Human Activity
Perspective”, phD thesis, 2005.
[41] Thomas, P., Information Systems Success
and Technology Acceptance within a
Government Organization”, phD thesis,
2008.
[42] Walczuch, R., Lemmink, J., & Streukens, S,
“The Effect of Service Employees’
Technology Readiness on Technology
Acceptance”, Information & Management,
Vol. 44, No. 2, 2007, pp. 206–215.
doi:10.1016/j.im.2006.12.005
[43] Weaver, K., & Olson, J. K.,
“Understanding Paradigms Used for
Nursing Research”, Journal of Advanced
Nursing, Vol. 53(, No. 4, 2006, pp. 459-
469.
[44] Wixom, B. H., & Todd, P. A., “A
Theoretical Integration of User Satisfaction
and Technology Acceptance”, Information
Systems Research, Vol. 16, No. 1, 2005, pp.
85–102. doi:10.1287/isre.1050.0042
Journal of Theoretical and Applied Information Technology 31
st August 2016. Vol.90. No.2
© 2005 - 2016 JATIT & LLS. All rights reserved.
ISSN: 1992-8645 www.jatit.org E-ISSN: 1817-3195
137
APPENDICES
APPENDIX 1
Fornell-Larcker Criterion
Acces
s
ISUS IQ NB Relia SERV
Q
SQ Tech
I
Tech
O
TS
Acces
s
0.794
ISUS 0.428 0.82
3
IQ 0.607 0.48
6
0.77
8
NB 0.439 0.51
2
0.46
1
0.82
2
Relia 0.733 0.53
7
0.64
9
0.44
4
0.84
4
SERV
Q
0.323 0.28
5
0.41
5
0.25
7
0.34
1
0.843
SQ 0.952 0.50
8
0.66
9
0.47
3
0.90
6
0.355 0.75
9
TechI -0.189 -
0.09
8
-
0.25
9
-
0.09
5
-
0.21
6
-0.350 -
0.21
5
0.92
8
TechO -0.330 -
0.26
9
-
0.38
0
-
0.20
6
-
0.36
0
-0.390 -
0.36
7
0.75
7
0.887
TS -0.303 -
0.22
7
-
0.36
1
-
0.18
1
-
0.33
3
-0.399 -
0.33
8
0.88
2
0.976 0.85
0
Heterotrait-Monotrait Ratio (Htmt)
Access ISUS IQ NB Relia SERVQ SQ TechI TechO TS
Access
ISUS 0.464
IQ 0.657 0.525
NB 0.481 0.556 0.504
Relia 0.806 0.587 0.710 0.492
SERVQ 0.342 0.297 0.438 0.273 0.368
SQ 1.032 0.541 0.715 0.512 0.978 0.371
TechI 0.202 0.108 0.278 0.117 0.235 0.369 0.227
TechO 0.348 0.286 0.403 0.219 0.385 0.402 0.382 0.793
TS 0.318 0.242 0.383 0.197 0.355 0.412 0.351 0.922 1.009

Journal of Theoretical and Applied Information Technology 31
st August 2016. Vol.90. No.2
© 2005 - 2016 JATIT & LLS. All rights reserved.
ISSN: 1992-8645 www.jatit.org E-ISSN: 1817-3195
138
Htmt Inference < 1.0
Original Sample
(O)
Sample Mean
(M)
5.0% 95.0%
ISUS -> NB 0.330 0.334 0.214 0.435
IQ -> ISUS 0.240 0.249 0.137 0.374
IQ -> NB 0.170 0.166 0.033 0.294
SERVQ -> ISUS 0.069 0.075 -0.027 0.171
SERVQ -> NB 0.040 0.042 -0.060 0.139
SQ -> Access 0.952 0.951 0.936 0.963
SQ -> ISUS 0.322 0.311 0.186 0.418
SQ -> NB 0.190 0.184 0.061 0.310
SQ -> Relia 0.906 0.905 0.878 0.927
TS -> ISUS -0.004 -0.003 -0.126 0.107
TS -> NB 0.036 0.038 -0.046 0.116
TS -> TechI 0.882 0.881 0.836 0.920
TS -> TechO 0.976 0.975 0.965 0.984
Journal of Theoretical and Applied Information Technology 31
st August 2016. Vol.90. No.2
© 2005 - 2016 JATIT & LLS. All rights reserved.
ISSN: 1992-8645 www.jatit.org E-ISSN: 1817-3195
139
APPENDIX 2
Results Summary for Reflective Measurement Model
Latent
Variable Indicators
Indicator
Reliability
Composite
Reliability AVE
Discriminant
Analysis
SQ
Reliability
Accessibility
SQ1
SQ2
SQ3
SQ4
SQ5
SQ6
SQ7
SQ8
SQ11
SQ12
SQ13
SQ14
SQ15
0.735
0.735
0.776
0.759
0.768
0.779
0.766
0.738
0.799
0.770
0.738
0.758
0.803
0.951
0.576
0.631
0.712
Yes
IQ
IQ1
IQ2
IQ3
IQ4
IQ8
IQ9
IQ10
IQ11
IQ12
0.725
0.770
0.790
0.785
0.771
0.787
0.802
0.819
0.787
0.947
0.605
Yes
TS
TechO
TechI
TS1
TS2
TS3
TS4
TS5
TS6
TS7
TS8
TS9
TS10
TS11
TS12
TS13
0.823
0.871
0.866
0.802
0.807
0.840
0.848
0.854
0.803
0.730
0.774
0.773
0.807
0.963
0.723
0.860
0.786
Yes
SERVQ
SERVQ1
SERVQ2
SERVQ3
SERVQ4
SERVQ5
SERVQ6
SERVQ7
SERVQ8
SERVQ9
0.875
0.820
0.879
0.843
0.857
0.823
0.859
0.808
0.790
0.958
0.711
Yes
ISUS ISUS1
ISUS2
0.783
0.841

Journal of Theoretical and Applied Information Technology 31
st August 2016. Vol.90. No.2
© 2005 - 2016 JATIT & LLS. All rights reserved.
ISSN: 1992-8645 www.jatit.org E-ISSN: 1817-3195
140
ISUS3
ISUS4
ISUS5
ISUS6
ISUS7
0.853
0.839
0.836
0.871
0.820
0.942
0.677
Yes
NB
NB1
NB2
NB3
NB4
NB5
NB6
0.726
0.808
0.845
0.837
0.786
0.824
0.917
0.676
Yes

Journal of Theoretical and Applied Information Technology 31
st August 2016. Vol.90. No.2
© 2005 - 2016 JATIT & LLS. All rights reserved.
ISSN: 1992-8645 www.jatit.org E-ISSN: 1817-3195
141
APPENDIX 3
Path Coefficient for Significance Testing
Original
Sample (O)
Sample
Mean (M)
Standard
Error (STERR)
T Statistics
(|O/STERR|)
P Values
ISUS -> NB 0.330 0.334 0.070 4.739 0.000
IQ -> ISUS 0.240 0.249 0.072 3.342 0.000
IQ -> NB 0.170 0.166 0.080 2.114 0.017
SERVQ ->
ISUS
0.069 0.075 0.060 1.151 0.125
SERVQ -> NB 0.040 0.042 0.061 0.652 0.257
SQ -> Access 0.952 0.951 0.008 113.255 0.000
SQ -> ISUS 0.322 0.311 0.071 4.540 0.000
SQ -> NB 0.190 0.184 0.075 2.537 0.006
SQ -> Relia 0.906 0.905 0.015 62.236 0.000
TS -> ISUS -0.004 -0.003 0.069 0.062 0.475
TS -> NB 0.036 0.038 0.049 0.729 0.233
TS -> TechI 0.882 0.881 0.025 35.262 0.000
TS -> TechO 0.976 0.975 0.006 165.991 0.000