Embed Size (px)
Citation preview

http://solutions.us.fujitsu.com
White paper Fujitsu vShape VDI using Fibre Channel and VMware
Page 1 of 39
White paper Fujitsu vShape Virtual Desktop Infrastructure (VDI) using Fibre Channel and VMware
The flexible and scalable vShape® VDI FC VMware® solution combines all aspects of a virtual desktop environment, based on reliable technologies and best practice solutions, with simple implementation and operation. This document is provided for those interested in understanding the performance characteristics of these smaller VDI solutions.

http://solutions.us.fujitsu.com
White paper Fujitsu vShape VDI using Fibre Channel and VMware
Page 2 of 39
Table of Contents 1 Introduction ...................................................................................................................................................................................................................... 3 2 Executive Summary .......................................................................................................................................................................................................... 3 3 vShape with PRIMERGY® and ETERNUS® for VMware ........................................................................................................................................................ 4
3.1 Notes on the vShape Architecture ........................................................................................................................................................................... 4 3.1.1 Redundant server, storage and network components ........................................................................................................................................ 4 3.1.2 iRMC included and ODD-drives excluded ............................................................................................................................................................ 4 3.1.3 FC Multipath, LAN Teaming / Load balancing ..................................................................................................................................................... 4 3.1.4 ESXi embedded .................................................................................................................................................................................................. 4 3.1.5 UPS ..................................................................................................................................................................................................................... 4 3.1.6 Warranty, Service and Support ........................................................................................................................................................................... 4
3.2 Desktop Virtualization with VMware products ......................................................................................................................................................... 5 3.2.1 VMware Horizon View ......................................................................................................................................................................................... 5 3.2.2 VMware vSphere® Desktop ................................................................................................................................................................................. 5 3.2.3 VMware vCenter® Server Desktop ....................................................................................................................................................................... 5 3.2.4 VMware Horizon View™ Manager ....................................................................................................................................................................... 5 3.2.5 VMware ThinApp® .............................................................................................................................................................................................. 5 3.2.6 VMware Horizon View Persona Management .................................................................................................................................................... 5 3.2.7 VMware Horizon View Composer ........................................................................................................................................................................ 5 3.2.8 VMware Horizon View Client ............................................................................................................................................................................... 5 3.2.9 VMware vShield® Endpoint ................................................................................................................................................................................. 5
4 Small Fibre Channel (250 Desktop) VDI vShape Configuration ......................................................................................................................................... 6 5 Medium Fibre Channel (500 Desktop) VDI vShape Configuration .................................................................................................................................... 7 6 Tested VDI Environment ................................................................................................................................................................................................... 9
6.1 General .................................................................................................................................................................................................................... 9 6.2 Tested Configuration Details ................................................................................................................................................................................... 9 6.3 Tested Configuration for 250 Users ....................................................................................................................................................................... 10 6.4 Tested Configuration for 500 Users ....................................................................................................................................................................... 11
7 Comparing Tested ESXi Servers with vShape Servers ...................................................................................................................................................... 12 8 Login VSI Testing ............................................................................................................................................................................................................. 13 9 Login VSI Test Results for 250 Users ................................................................................................................................................................................ 14
9.1 Performance of 250 Users with Medium Workload ............................................................................................................................................... 14 9.2 Performance of 250 Users with Heavy Workload ................................................................................................................................................... 18 9.3 Logon Storm with 250 Users ................................................................................................................................................................................. 22
10 Login VSI Test Results for 500 Users ........................................................................................................................................................................... 26 10.1 Performance of 500 Users with Medium Workload ............................................................................................................................................... 26 10.2 Performance of 500 Users with Heavy Workload ................................................................................................................................................... 31 10.3 Logon Storm with 500 Users ................................................................................................................................................................................. 35
List of Figures Figure 1 – 250 User Configuration Block Diagram ................................................................................................................................................................... 6 Figure 2 – 500 User Configuration Block Diagram ................................................................................................................................................................... 7 Figure 3 – VMware 250 Users Fibre Channel Test Environment ............................................................................................................................................. 10 Figure 4 – VMware 500 Users Fibre Channel Test Environment ............................................................................................................................................. 11 Figure 5 – PRIMERGY Model Performance Comparisons ........................................................................................................................................................ 12 Figure 6 – Login VSI Results for 250 User tests ....................................................................................................................................................................... 14 Figure 7 – Login VSI Response 250 Users – Medium Workload .............................................................................................................................................. 14 Figure 8 – ESXi Server Loadings – 250 Users, Medium Workload ........................................................................................................................................... 14 Figure 9 – ETERNUS CM Loading – 250 Users, Medium Workload.......................................................................................................................................... 15 Figure 10 – FTRP Maximum Drive Loading – 250 Users, Medium Workload .......................................................................................................................... 15 Figure 11 – Storage Array Traffic – 250 Users, Medium Workload ......................................................................................................................................... 16 Figure 12 – High Tier Traffic – 250 Users, Medium Workload ................................................................................................................................................. 17 Figure 13 – Low Tier Traffic – 250 Users, Medium Workload .................................................................................................................................................. 17

http://solutions.us.fujitsu.com
White paper Fujitsu vShape VDI using Fibre Channel and VMware
Page 3 of 39
Figure 14 – Login VSI Response 250 Users – Heavy Workload ............................................................................................................................................... 18 Figure 15 – ESXi Server Loadings – 250 Users, Heavy Workload ............................................................................................................................................ 18 Figure 16 – ETERNUS CM Loading – 250 Users, Heavy Workload ........................................................................................................................................... 19 Figure 17– FTRP Maximum Drive Loading – 250 Users, Heavy Workload .............................................................................................................................. 19 Figure 18 – Storage Array Traffic – 250 Users, Heavy Workload ............................................................................................................................................. 20 Figure 19 – High Tier Traffic – 250 Users, Heavy Workload .................................................................................................................................................... 21 Figure 20 – Low Tier Traffic – 250 Users, Heavy Workload ..................................................................................................................................................... 21 Figure 21 – ESXi Server Loadings – 250 Users, Logon Storm.................................................................................................................................................. 22 Figure 22 – ETERNUS CM Loading – 250 Users, Logon Storm ................................................................................................................................................ 22 Figure 23 – FTRP Maximum Drive Loading – 250 Users, Logon Storm ................................................................................................................................... 23 Figure 24 – Storage Array Traffic – 250 Users, Logon Storm .................................................................................................................................................. 24 Figure 25 – High Tier Traffic – 250 Users, Logon Storm .......................................................................................................................................................... 25 Figure 26 – Low Tier Traffic – 250 Users, Logon Storm ........................................................................................................................................................... 25 Figure 27 – Login VSI Results for 500 User tests ..................................................................................................................................................................... 26 Figure 28 – Login VSI Response 500 Users – Medium Workload ............................................................................................................................................ 26 Figure 29 – ESXi Server Loadings – 500 Users, Medium Workload......................................................................................................................................... 27 Figure 30 – ETERNUS CM Loading – 500 Users, Medium Workload ....................................................................................................................................... 27 Figure 31 – FTRP Maximum Drive Loading – 500 Users, Medium Workload .......................................................................................................................... 28 Figure 32 – Storage Array Traffic – 500 Users, Medium Workload ......................................................................................................................................... 29 Figure 33 – High Tier Traffic – 500 Users, Medium Workload ................................................................................................................................................. 30 Figure 34 – Low Tier Traffic – 500 Users, Medium Workload .................................................................................................................................................. 30 Figure 35 – Login VSI Response 500 Users – Heavy Workload ............................................................................................................................................... 31 Figure 36 – ESXi Server Loadings – 500 Users, Heavy Workload ............................................................................................................................................ 31 Figure 37 – ETERNUS CM Loading – 500 Users, Heavy Workload ........................................................................................................................................... 32 Figure 38 – FTRP Maximum Drive Loading – 500 Users, Heavy Workload ............................................................................................................................. 32 Figure 39 – Storage Array Traffic – 500 Users, Heavy Workload ............................................................................................................................................. 33 Figure 40 – High Tier Traffic – 500 Users, Heavy Workload .................................................................................................................................................... 34 Figure 41 – Low Tier Traffic – 500 Users, Heavy Workload ..................................................................................................................................................... 34 Figure 42 – ESXi Server Loadings – 500 Users, Logon Storm.................................................................................................................................................. 35 Figure 43 –ETERNUS CM Loading – 500 Users, Logon Storm ................................................................................................................................................. 35 Figure 44 – FTRP Maximum Drive Loading – 500 Users, Logon Storm ................................................................................................................................... 36 Figure 45 – Storage Array Traffic – 500 Users, Logon Storm .................................................................................................................................................. 37 Figure 46 –High Tier Traffic – 500 Users, Logon Storm .......................................................................................................................................................... 38 Figure 47 – Low Tier Traffic – 500 Users, Logon Storm ........................................................................................................................................................... 38
1 Introduction
A Virtual Desktop Infrastructure (VDI) provides an effective and economical solution to a general business issue of providing staff with suitable, supported computer applications for them to be successful in their various roles within the organization. In the business operations environment today, with the expanding use of various mobile devices and staff usage requirements, equipping all staff with fully capable devices and with access to the data they need, puts a severe strain on all IT departments. Through VDI, the different devices, from a notebook to a tablet to a thin client, can be provided to each of the staff members to enable efficient access to the applications and data that they need. At the same time, resources within the data center and the IT center staff can be much more effectively deployed.
VMware provides one of the most widely used VDI environments through their Horizon View family of products. It includes a number of components to support operational environments on a wide variety of end user devices, also known as client devices or clients. Provisions are made to ensure the security of each client, and to provide each client with a unique customizable desktop interface, with the services the client needs for their responsibilities. VMware environments often support large complements of clients ranging from 1,000 to 20,000, but they can also be configured for smaller requirements as well.
2 Executive Summary
This paper provides recommended vShape solution configurations for smaller VDI environments supporting 250 to 500 client desktops. In support of these recommended configurations are presented test results, using lab resources in similar configurations. Section 3 provides details of the Fujitsu vShape configurations that utilize highly reliable proven Fujitsu and partner components. Detailed charts provide insight into the impact that Automated Storage Tiering has to enable the effective use of the high performance SSDs, while minimizing the system cost through use of high density 900GB/10krpm HDDs for the major part of the required storage. VMware Horizon View version 5.3 is a key part of this solution package for smaller VDI environments. The industry standard tool “Login VSI” is used to provide measured realistic VDI load on the tested configurations.

http://solutions.us.fujitsu.com
White paper Fujitsu vShape VDI using Fibre Channel and VMware
Page 4 of 39
3 vShape with PRIMERGY® and ETERNUS® for VMware
The PRIMERGY RX servers used in these configurations are the convincing choice for the server pool of the Fujitsu vShape architectures. These servers are the solution for cutting data center infrastructure costs through the use of tried-and-tested data center technology. Investments in the modular PRIMECENTER rack supports seamless integration of PRIMERGY and SAN storage subsystems plus the infrastructure components including the SAN and LAN switches as well as the KVM switches necessary for operational control.
The ETERNUS DX storage arrays are the building blocks for the SAN storage that is part of the vShape architecture. The Fujitsu third generation of ETERNUS DX storage systems, the ETERNUS DX S3, are The Flexible Data Safe for Dynamic Infrastructures. Enterprise proven capabilities protect data assets across all types of IT infrastructure. Redundant components, RAID protection and built-in data protection provide the highest system reliability to ensure business continuity is maintained. ETERNUS DX S3 models provide comprehensive disk storage and state-of-the-art connectivity across the entire model range and delivers maximum configuration flexibility allowing choice in performance and TCO. Data-in-place upgrade options are also available throughout the system’s lifecycle to ensure maximum investment protection.
The ETERNUS SF software components provide unparalleled complementary capability within the ETERNUS family of products. SF Storage Cruiser provides the management for the Flexible Tiering feature within the ETERNUS DX S3 models through the Automated Storage Tiering (AST) facility. Policies are established for moving extents within the Virtual Logical Volumes between the different performance tiers within the Flexible Tiering Pool (FTRP), based on the traffic demands on the extents. This feature enables effective use of limited amounts of very high speed storage offered by SSDs, while minimizing the response time for the high traffic sections of the total storage. Less active sections within the same Virtual Logical Volumes are moved to the lower speed, lower cost HDDs within the storage pool.
Brocade® is the Fujitsu preferred networking partner. Brocade Fibre Channel switches are included in the vShape solution, providing leading switching technology with simplified management.
3.1 Notes on the vShape Architecture
3.1.1 Redundant server, storage and network components
All servers are equipped with redundant power supply units, fans, network adapters and/or host bus adapters.
All storage systems are equipped with redundant power supply units, controllers and RAID protection for both SSDs and HDDs.
All network components of the LAN and SAN sample configurations are designed for redundancy, including adapters, switches, and controllers. The exception to this is the management interface in the servers (iRMC).
3.1.2 iRMC included and ODD-drives excluded
All servers are configured with remote management iRMC (integrated Remote Management Controller) and do not contain any optical disk drives like DVD or Blu-Ray drives. These drives can optionally be added.
3.1.3 FC Multipath, LAN Teaming / Load balancing
Multipath software and virtual (LAN) switches are integral parts of ESXi. Teaming and load balancing are features of virtual switches.
3.1.4 ESXi embedded
The embedded UFM-device option saves time during setup at the customer site.
3.1.5 UPS
Customers often already have precautions or may desire to deal with the issue later, so the sample configurations are designed without UPS (uninterruptible power supply) units.
Fujitsu generally recommends that uninterruptible power supplies should be used. This will secure overall operations in the event of short term power failures, and if normal power supply fails for a longer period, ensures a clean shutdown of the servers with full security for the data. If no precautions against a power failure have been taken, this topic should be included in conversations and the configuration can be expanded to include UPS units.
3.1.6 Warranty, Service and Support
It is recommended that service and support packages covering the customer requirements be included in the order, according to the support facilities offered in the local area.

http://solutions.us.fujitsu.com
White paper Fujitsu vShape VDI using Fibre Channel and VMware
Page 5 of 39
3.2 Desktop Virtualization with VMware products
3.2.1 VMware Horizon View
Simplify desktop and application management while increasing security and control with VMware Horizon View (formerly known as VMware View). Horizon View enables delivery of a personalized high fidelity experience for end users across sessions and devices. It enables higher availability and agility of desktop services unmatched by traditional PCs while reducing the total cost of desktop ownership up to 50%. With Horizon View end users can enjoy new levels of productivity and the freedom to access desktops from more devices and locations while giving IT greater policy control. VMware Horizon View version 5.3 was used in the testing included in this report.
3.2.2 VMware vSphere® Desktop
Designed specifically for desktops, this vSphere edition provides a highly scalable, reliable and robust platform for running virtual desktops and applications, with built-in business continuity and disaster recovery capabilities to protect desktop data and availability without the cost and complexity of traditional solutions.
3.2.3 VMware vCenter® Server Desktop
This edition of vCenter Server, which is the central management hub for vSphere, provides complete control over and visibility into clusters, hosts, virtual machines, storage, networking and other critical elements of the virtual infrastructure. The operating system used is Windows Server 2008 R2. With every vCenter license a Microsoft SQL Server® Express license is included. VMware supports up to 5 nodes with SQL Server 2008 Express. If the installation requires more than 5 nodes within one vCenter an additional database or separate instance of an existing vCenter supported database will be required.
3.2.4 VMware Horizon View™ Manager
Horizon View Manager streamlines the management, provisioning and deployment of virtual desktops. IT administrators can centrally manage hundreds of desktops from a single console. End users connect through Horizon View Manager to securely and easily access Horizon View virtual desktops.
3.2.5 VMware ThinApp®
VMware ThinApp is an agentless application virtualization solution that streamlines application delivery while eliminating conflicts. As part of Horizon View, ThinApp simplifies repetitive administrative tasks and reduces storage needs for virtual desktops by maintaining applications independently of the underlying OS.
3.2.6 VMware Horizon View Persona Management
Horizon View Persona Management dynamically associates the user persona with stateless floating desktops. Administrators can easily deploy pools of lower-cost stateless, floating desktops and enable users to maintain their designated settings between sessions.
3.2.7 VMware Horizon View Composer
Horizon View Composer lets customers easily manage pools of “like” desktops by creating master images that share a common virtual disk. By updating a master image with Horizon view Manager, all the cloned desktops linked to the master image can be patched or updated without affecting the users’ settings, data or applications. In addition Horizon View Composer saves up to 80% of storage capacity.
3.2.8 VMware Horizon View Client
Horizon View Client enables access to centrally hosted virtual desktops from Windows PCs, Macs, thin clients, zero clients and iOS and Android-based mobile devices. Horizon View Client with Local Mode enables access to virtual desktops running on a local Windows-based endpoint, regardless of network availability.
3.2.9 VMware vShield® Endpoint
The vShield Endpoint offloads and centralizes anti-virus and anti-malware (AV) solutions, eliminating agent sprawl and AV storm issues while minimizing the risk of malware infection and simplifying AV administration in virtualized environment.

http://solutions.us.fujitsu.com
White paper Fujitsu vShape VDI using Fibre Channel and VMware
Page 6 of 39
4 Small Fibre Channel (250 Desktop) VDI vShape Configuration
The key components of the 250 User desktop VDI solution using Fibre Channel includes:
■ Servers: PRIMERGY RX200 S8, 3 nodes, each with two E5-2670v2 CPUs and 256GB memory
■ Storage Protocol: Fibre Channel – 8Gbps
■ Storage System: ETERNUS DX100 S3, 2x400GB SSDs, 9x900GB/10krpm HDDs, with 1xRAID1 SSD & 2xRAID5(3+1) HDD groups, plus 1xHS
■ Space Provided: High Tier 392.7GB, Low Tier 5279.6GB, Space per User 22.7GB
■ Fabric Switches: Brocade 6505 FC
■ Virtualization: VMware Horizon View v5.3
■ Workload: 250 Desktop VMs
Figure 1 – 250 User Configuration Block Diagram
Section 9 provides test results for the 250 User VDI environment. In choosing the PRIMERGY servers for this configuration, the effective capability of the servers used in the testing and the specific options that can be chosen in a vShape configuration were evaluated (see section 7). Although the use of the E5-2650v2 CPUs would provide satisfactory capability for the tested environment, with the optional demands that can be expected on the ESXi nodes, the E5-2670v2 CPUs are recommended and included in the solution configuration.
The tested ETERNUS storage array is the same as that included in the solution, so the performance reported in the test sections applies directly.
The test environment used only a single Fibre Channel Switch to provide access to the storage from the ESXi nodes, while the solution configuration uses two switches. This is to provide the level of redundancy that Fujitsu considers basic to the vShape VDI infrastructure.
In the test environment, the various VMware Horizon View components were hosted in servers outside of the ESXi nodes, but in many production environments these functions reside in Virtual Machines within the cluster. This provides reliability, as a VM supporting one of these components can be moved from one node to another within the cluster by using the management tools.
A key component of the vShape VDI solution is the use of Automated Storage Tiering (AST) through the ETERNUS SF Storage Cruiser software product in conjunction with ETERNUS DX firmware. This enables detection of high traffic areas within the data contents and provides the control to move those areas to the high performance SSD portion of the storage. This significantly enhances the performance, as evidenced in the reported test data (see section 9). In the test environment, the configuration with AST was exercised for a period of time prior to beginning the measured test runs. This was used to simulate use of the system over time to establish an expected normal operating environment. This includes the relocation of high traffic portions of the storage that were moved by AST to the SSD portion of the storage pool.

http://solutions.us.fujitsu.com
White paper Fujitsu vShape VDI using Fibre Channel and VMware
Page 7 of 39
Although there are several differences between the tested configuration for 250 Users and the recommended vShape VMware VDI solution, the solution provides greater performance capability than the configuration that was tested. It is expected to surpass the most demanding user requirements for environments in this size range.
5 Medium Fibre Channel (500 Desktop) VDI vShape Configuration
The key components of the 500 User desktop VDI solution using Fibre Channel includes:
■ Servers: PRIMERGY RX200 S8, 6 nodes, each with two E5-2670v2 CPUs and 256GB memory
■ Storage Protocol: Fibre Channel – 8Gbps
■ Storage System: ETERNUS DX100 S3, 4x400GB SSDs, 17x900GB/10krpm HDDs, with 2xRAID1 SSD, 4xRAID5(3+1) HDD groups, plus 1xHS
■ Space Provided: High Tier 785.4GB, Low Tier 10,559.2GB, Space per User 22.7GB
■ Fabric Switches: Brocade 6505 FC
■ Virtualization: VMware Horizon View v5.3
■ Workload: 500 Desktop VMs
Figure 2 – 500 User Configuration Block Diagram
Section 10 provides test results for the 500 User VDI environment. In choosing the PRIMERGY servers for this configuration, the effective capability of the servers used in the testing and the specific options that can be chosen in a vShape configuration were evaluated (see section 7). Again, the E5-2650v2 CPUs could be chosen, but with the optional demands that can be expected on the nodes, the E5-2670v2 CPUs are a better choice for this solution.
The tested ETERNUS storage array did not include the additional two SSDs that are included in the solution. The test results indicate the performance will be enhanced significantly with those two additional SSD drives. Otherwise the array configuration is the same as that tested.
Again the test environment for 500 Users included only a single Fibre Channel Switch to provide access to the storage from the ESXi nodes, the solution includes two switches. The dual switch configuration provides a level of redundancy that is needed in the environment.
In the test environment, the various VMware Horizon View components were hosted in servers outside of the ESXi nodes, while in many production environments these functions reside in Virtual Machines within the clusters. This provides reliability, as a VM supporting one of these components can be moved from one node to another within the cluster by using the management tools.
As noted for the 250 User environment, the vShape VDI solution includes Automated Storage Tiering through the ETERNUS SF Storage Cruiser software product in conjunction with the ETERNUS DX firmware. This provides recognition of high traffic areas within the storage area, and means to move them to the high performance SSD portion of the storage. This significantly enhances the performance. However, in the test environment, the amount of SSD storage available for the 500 User testing was less than is recommended for the vShape VDI solution, resulting in greater traffic on the HDD portion of the

http://solutions.us.fujitsu.com
White paper Fujitsu vShape VDI using Fibre Channel and VMware
Page 8 of 39
storage. Furthermore, when the 500 User tests were run, there were half of the HDD drives that were still being formatted. This added significant load on the HDDs that would normally not be active in a production environment. Also, AST was not provided an opportunity to relocate high traffic areas within the storage pool before the 500 User tests were run, further increasing the load imbalance between the SSD and HDD portions of the storage pool. In an operational environment, AST would redistribute the high traffic portions of the storage space to support the high demand areas on the SSDs.
Although there are several differences between the tested configuration for 500 Users and the recommended vShape VMware VDI solution, the solution provides greater performance capability than the configuration that was tested. It is expected to surpass the most demanding user requirements for environments in this size range.

http://solutions.us.fujitsu.com
White paper Fujitsu vShape VDI using Fibre Channel and VMware
Page 9 of 39
6 Tested VDI Environment
6.1 General
The test environment includes the following elements:
■ Datacenter infrastructure: Active Directory, DNS and DHCP on Windows Server 2008 R2
■ VDI infrastructure: VMware Horizon View 5.3 with vCenter Server, vComposer Server and vConnection Server on Windows Server® 2008 R2
■ Virtualization Host nodes for VDI Desktops: VMware ESXi 5.5 hypervisor running on PRIMERGY RX600 S5.
■ ETERNUS DX100 S3 storage array: configured with 2 x 400GB SSDs & 9 x 900GB/10krpm HDDs for 250 users and 17 x 900GB/10krpm HDDs for 500 users. The storage array was configured using the Automated Storage Tiering (AST) feature with two active tiers, the High Tier included the SSD group and the Low Tier included the HDD groups.
■ Desktop VM: Windows 7 Professional 32-bit English virtual desktops with Microsoft Office 2010 using linked-clone technology.
6.2 Tested Configuration Details
Datacenter & VDI Infrastructure
VMware vCenter Server v5.5.0
PRIMERGY RX300 S3
VMware vComposer Server v5.5.0
DHCP Server Microsoft Windows Server 2008 R2
ETERNUS SF Server v16.1
VMware Horizon View Administrator v5.3.0
AD Server Microsoft Windows Server 2008 R2 PRIMERGY RX300 S3
DNS Server
VMware vConnection Server v5.5.0 PRIMERGY RX300 S3
Login VSI Benchmark Infrastructure
Login VSI Session Indexer Control v4.1 PRIMERGY RX300 S7
Launchers 1-4 v4.0
Launchers 5-8 v4.0 PRIMERGY RX300 S7
Launchers 9-12 v4.0 PRIMERGY RX300 S7
Launchers 13-16 v4.0 PRIMERGY RX300 S8
Launchers 17-20 v4.0 PRIMERGY RX300 S8
Virtualization Host Nodes
VMware ESXi hypervisor v5.5.0
PRIMERGY RX600 S5 4 x Intel Xeon [email protected]
set of 4 for 250 users set of 8 for 500 users
vCenter Pool [i14y_001] Options
Manual Pool, Dedicated User Assignment with Automatic Assignment Enabled, vCenter virtual machines, No Connection Server restrictions, No power action,
do not auto logoff nor allow users to reset desktops, PCoIP Default display protocol & allow users to select protocol,
Number of Monitors 2 (1920x1200)
SAN Switch Brocade 8Gbps Fibre Channel
VDI Client Environment
Clone Type Linked Clone 250 / 500 VDI Users
Client VDI Package Microsoft Windows 7 Professional Microsoft Office 2010 Professional
1vCPU; 1GB Memory; 22.7 GB Disk (250 users) 21.9 GB Disk (500 users)
Login VSI workloads
Logon Storm v4.0
Medium Workload v4.0
Heavy Workload v4.0
SAN Storage Array ETERNUS DX100 S3 with Flexible Tier Pool & 4 x 8Gbps FC Host Ports
High Tier: 392.7GB 2 x RAID1 400GB SSD
Low Tier: 5,279.6GB for 250 users 10,559.2GB for 500 users
2 x RAID5(3+1)900GB HDD 4 x RAID5(3+1)900GB HDD

http://solutions.us.fujitsu.com
White paper Fujitsu vShape VDI using Fibre Channel and VMware
Page 10 of 39
6.3 Tested Configuration for 250 Users
The components used in the 250 User desktop tested VDI configuration include: (see Figure 3
■ Virtualization Host Nodes: PRIMERGY RX600 S5, 4 nodes, each with 4x E7540 S5 CPUs
■ Datacenter & VDI infrastructure: 3 PRIMERGY RX300 S3 units
■ VSI benchmark infrastructure: 4 PRIMERGY RX300 S7 and 2 PRIMERGY RX300 S8 units for Login VSI Launchers and Control Server
■ Fabric Switches: Brocade, Fibre Channel, 8Gbps
■ Workloads: 250 Desktop VMs; Medium, Heavy & Logon Storm defaults Login VSI for benchmark testing
■ Virtualization: VMware Horizon View v5.3
■ ETERNUS DX100 S3 storage array: High Tier 392.7GB in 1x RAID1 SSD group Low Tier 5279.6GB in 2x RAID5(3+1) HDD groups, plus 1xHS
Figure 3 – VMware 250 Users Fibre Channel Test Environment

http://solutions.us.fujitsu.com
White paper Fujitsu vShape VDI using Fibre Channel and VMware
Page 11 of 39
6.4 Tested Configuration for 500 Users
The components used in the 500 User desktop tested VDI configuration include: (see Figure 4)
■ Virtualization Host Nodes: PRIMERGY RX600 S5, 8 nodes, each with 4 E7540 S5 CPUs
■ Datacenter & VDI infrastructure: 3 PRIMERGY RX300 S3 units
■ VSI benchmark infrastructure: 4 PRIMERGY RX300 S7 and 2 PRIMERGY RX300 S8 units for Login VSI Launchers and Control Server
■ Fabric Switches: Brocade, Fibre Channel, 8Gbps
■ Workloads: 500 Desktop VMs; Medium, Heavy & Logon Storm defaults Login VSI for benchmark testing
■ Virtualization: VMware Horizon View v5.3
■ ETERNUS DX100 S3 storage array: High Tier 392.7GB in 1x RAID1 SSD group Low Tier 10559.2GB in 4x RAID5(3+1) HDD groups, plus 1xHS
Figure 4 – VMware 500 Users Fibre Channel Test Environment

http://solutions.us.fujitsu.com
White paper Fujitsu vShape VDI using Fibre Channel and VMware
Page 12 of 39
7 Comparing Tested ESXi Servers with vShape Servers
The testing results presented in sections 9 and 10 of this paper utilized different servers from those included in the recommended vShape solutions. To properly size the recommended servers, published test results on the PRIMERGY family of servers are compared in Figure 5.
The OLTP-2 test provides a combined performance metric on both the compute capability and the I/O capability of the systems. Although the E5-2630v2 CPU choice would provide ample capability for many environments, it is not considered sufficient for support of VMware VDI environments. The E5-2650v2 provides somewhat higher performance than the servers used in the test environment, but with the number of additional VMs for infrastructure support functions required, the E5-2670v2 is a much better choice. The vShape VDI configurations include PRIMERGY RX200 S8 systems with E5-2670v2 CPUs.
The OLTP-2 results referenced are available in the Performance Reports for each of the respective servers. Additionally, detailed information about the OLTP-2 benchmark can be found at http://globalsp.ts.fujitsu.com/dmsp/Publications/public/Benchmark_Overview_OLTP-2.pdf.
See http://www.fujitsu.com/global/products/computing/servers/primergy/benchmarks/rx600s5/index.html and select Performance Reports for performance details on the RX600 S5.
See http://www.fujitsu.com/global/products/computing/servers/primergy/benchmarks/rx200s8/index.html and select Performance Reports for performance details on the RX200 S8.
Figure 5 – PRIMERGY Model Performance Comparisons
Servers CPUs Cores Threads
Memory,
GB
Cache,
MB
Clock,
GHz OLTP‐2
Test Systems RX600 S5 (E7530) 1 4 24 48 64 48 1.866 1286 Test system servers
Set of RX600 S5 servers 4 16 96 192 256 192 5144 250 seats with 4 servers in test system
Set of RX600 S5 servers 8 32 192 384 512 384 10288 500 seats with 8 servers in test system
vShape RX200 S8 (E5‐2630v2) 1 2 12 24 96 30 2.6 1371 Base starting new generation CPU
Performance Gain RX200 S8 (2630v2) vrs RX600 S5: 7% Marginal advantage on OLTP‐2
Set of RX200 S8 (2630v2) servers 3 6 36 72 288 90 4113 ‐20% Less capable with only 3 servers
Set of RX200 S8 (2630v2) servers 6 12 72 144 576 180 8226 ‐20% Less capable with only 6 servers
vShape RX200 S8 (E5‐2650v2) 1 2 16 32 128 40 1.866 1809 More powerful CPU
Performance Gain RX200 S8 (2650v2) vrs RX600 S5: 41% Advantage on OLTP‐2
Set of RX200 S8 (2650v2) servers 3 6 48 96 384 120 5427 6% Better with only 3 servers
Set of RX200 S8 (2650v2) servers 6 12 96 192 768 240 10854 6% Better with only 6 servers
vShape RX200 S8 (E5‐2670v2) 1 2 20 40 128 50 2.5 2133 Much more powerful CPU
Performance Gain RX200 S8 (2670v2) vrs RX600 S5: 66% Significant advantage on OLTP‐2
Set of RX200 S8 (2670v2) servers 3 6 60 120 384 150 6399 24% Much better with only 3 servers
Set of RX200 S8 (2670v2) servers 6 12 120 240 768 300 12798 24% Much better with only 6 servers
Comments
PRIMERGY Models
Performance Comparisons

http://solutions.us.fujitsu.com
White paper Fujitsu vShape VDI using Fibre Channel and VMware
Page 13 of 39
8 Login VSI Testing
Login VSI (www.loginvsi.com) is the industry standard load testing solution for centralized virtualized desktop environments. Login VSI Session indexer is a benchmarking tool for establishing the operating capabilities of a VDI configuration. It has been used to provide the performance information within the tested environment. Three test profiles were used and results reported herein:
■ Medium Workload – includes segments with Microsoft® Internet Explorer, Outlook®, Word, PowerPoint®, and Excel; Adobe® Acrobat®, FreeMind, PhotoViewer, Doro PDF Writer; and includes viewing several 480p movies.
■ Heavy Workload – includes segments with Microsoft Internet Explorer, Outlook, Word, PowerPoint, and Excel; Adobe Acrobat, FreeMind, PhotoViewer, Doro PDF Writer; and includes viewing both 720p and 1080p movies.
■ Logon Storm – includes successive logon operations for an increasing number of Virtual Desktops to determine the maximum number that can be logged on in a chosen amount of time.
These tests are executed from a separate set of servers that run the Login VSI Launchers to provide the test load for the environment. They record the performance seen from their position within the environment, which is the position from which normal VDI users see the behavior of the system. Login VSI reports several measures of the operations within the system under test:
■ Active Sessions records the maximum number of sessions that successfully completed their test sequences.
■ VSI base provides a measure of the basic response level within the system.
■ VSI Max v4 Average provides a measure of the average response time for all the active user sessions throughout the test sequence.
■ VSI Max v4 Threshold establishes a measure of the maximum acceptable response time for the active user sessions in the test sequence.
■ VSI Max Result indicates if the VSI Max v4 Threshold was reached during the test, and if so, the number of active user sessions at which it was reached.
■ The Logon Storm test reports the number of user sessions that were able to be started within the allotted time.
These reported results are provided for each of the sets of Login VSI tests that were conducted, and are reported in the following sections.
http://solutions.us.fujitsu.com
White paper Fujitsu vShape VDI using Fibre Channel and VMware
Page 14 of 39
9 Login VSI Test Results for 250 Users
The three Login VSI test Scenarios provide data on the performance seen by the benchmark tool kit launchers.
Figure 6 – Login VSI Results for 250 User tests
9.1 Performance of 250 Users with Medium Workload
The performance information for this test is viewed in several ways. First is the view from the Login VSI tool kit which reflects the view from the users, shown in Figure 7.
Figure 7 – Login VSI Response 250 Users – Medium Workload
The next view of the performance under this workload level provides insight into the loading on the ESXi servers supporting the various VDI workload demands. Throughout this test, there are four active servers. The CPU Utilization and Memory Utilization for these are shown on these charts (Figure 8).
Figure 8 – ESXi Server Loadings – 250 Users, Medium Workload
1 250 Medium 250 2624 4638 5224 not reached result is good.
2 250 Heavy 250 2618 3559 5219 not reached result is good.
3 250logon storm
250 - - - -250 logon sessions completed within 3 minutes.
VSIMax v4 threshold
VSIMax Result
Noteactive
sessions
Login VSI scenario
(load)# of usersTest No. VSIbase
VSIMax v4 average

http://solutions.us.fujitsu.com
White paper Fujitsu vShape VDI using Fibre Channel and VMware
Page 15 of 39
The performance within the ETERNUS DX100 S3 provides additional insight into the manner in which the offered load is supported by the storage array. The Control Modules (CMs) manage and move the traffic to and from the storage devices within the array. With too great a load, they may become a limiting factor, however that is not the case as Figure 9 shows.
Figure 9 – ETERNUS CM Loading – 250 Users, Medium Workload
The storage array was configured to using AST with a Flexible Tiering Pool (FTRP) made up of three RAID groups. One of the groups provides the high tier and was formed with two 400GB SSDs in a RAID1 arrangement. The low tier was formed with two groups, each made up of four 900GB HDDs in a RAID5(3+1) arrangement. If there are insufficient resources within the FTRP, then the drives will become saturated, and limit the response time of the array. Portions of the storage are moved between the Low Tier to the High Tier, based on the traffic the different sections encounter. As can be seen from Figure 10, neither of the tiers in the FTRP is near saturation, indicating that there is plenty of storage resource available to support the demand.
Figure 10 – FTRP Maximum Drive Loading – 250 Users, Medium Workload
http://solutions.us.fujitsu.com
White paper Fujitsu vShape VDI using Fibre Channel and VMware
Page 16 of 39
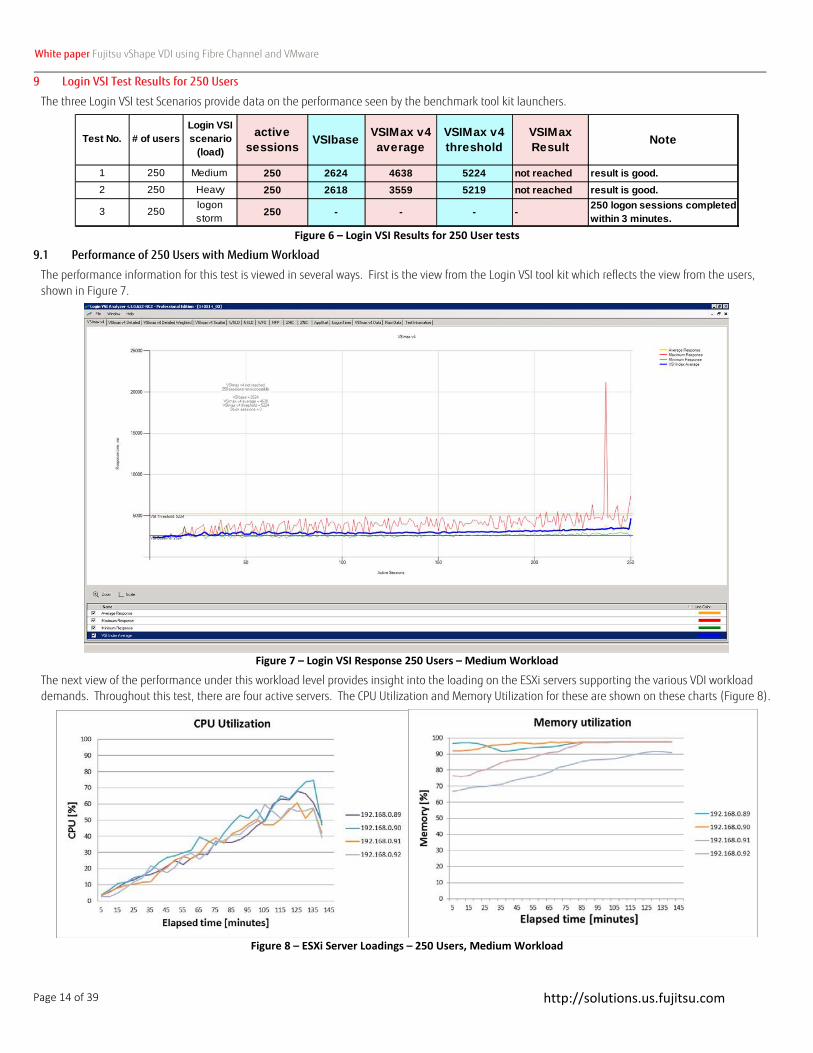
The traffic seen on the storage array can be viewed in terms of the IO requests per second (IOPs) and the response times (RT) to those IO requests. As shown in Figure 11, the Average Response Time to the requests from the ESXi servers remains under 2.5ms throughout Medium workload test.
Figure 11 – Storage Array Traffic – 250 Users, Medium Workload

http://solutions.us.fujitsu.com
White paper Fujitsu vShape VDI using Fibre Channel and VMware
Page 17 of 39
Another level of insight into the performance of the storage array is to consider the traffic and response time data for each of the two tiers separately. The High Tier is within the SSDs while the Low Tier is supported by the 10krpm SAS HDDs. Each of these is supporting part of the system traffic shown in Figure 11. The impact of the Automated Storage Tiering (AST) optimization feature can be seen in the portions of the traffic that is carried by each of the two tiers (Figure 12. and Figure 13). The High Tier represents only a small portion of the total storage space (6.9%), but yet is carrying the greatest portion of the traffic. The AST optimization has moved the highly active parts of the storage to the High Tier and the parts with lower activity to the Low Tier to provide the best response times for the demands.
Figure 12 – High Tier Traffic – 250 Users, Medium Workload
Figure 13 – Low Tier Traffic – 250 Users, Medium Workload

http://solutions.us.fujitsu.com
White paper Fujitsu vShape VDI using Fibre Channel and VMware
Page 18 of 39
9.2 Performance of 250 Users with Heavy Workload
This first view from the Login VSI tool kit reflects the performance view from the users, illustrated in Figure 14, when the Heavy Workload was active.
Figure 14 – Login VSI Response 250 Users – Heavy Workload
The next view of the performance under this workload level provides insight into the loading on the ESXi servers supporting the various VDI workload demands. Throughout this test, there are four active servers. The CPU Utilization and Memory Utilization for these are shown in these charts (Figure 15).
Figure 15 – ESXi Server Loadings – 250 Users, Heavy Workload

http://solutions.us.fujitsu.com
White paper Fujitsu vShape VDI using Fibre Channel and VMware
Page 19 of 39
The performance within the ETERNUS DX100 S3 provides additional insight into the manner in which the offered load is supported by the storage array. The CM loading is shown in the chart as Figure 16.
Figure 16 – ETERNUS CM Loading – 250 Users, Heavy Workload
As noted previously, the storage array was configured to use an FTRP made up of three RAID groups. One provides the high tier using SSDs and the other two provide the low tier using HDDs. Within the FTRP, the AST feature moves active portions of the data to the high tier and less active portions to the low tier. The view of the maximum drive busy in each of the tiers provides a view of the loading on the storage devices. As can be seen from Figure 17, neither of the tiers in the FTRP is near saturation. This indicates there is still plenty of storage resource available to support the demand.
Figure 17– FTRP Maximum Drive Loading – 250 Users, Heavy Workload

http://solutions.us.fujitsu.com
White paper Fujitsu vShape VDI using Fibre Channel and VMware
Page 20 of 39
The traffic seen on the storage array can be viewed in terms of the IOPs and RT as noted previously. As shown in Figure 18, the Average Response Time to the requests from the ESXi servers remains below 1.6ms throughout the Heavy workload test.
Also notice that the storage array loading is less in the Heavy Workload test than it was in the Medium Workload test. This is an indication that many of the demands are being serviced from the data available within the ESXi servers.
Figure 18 – Storage Array Traffic – 250 Users, Heavy Workload

http://solutions.us.fujitsu.com
White paper Fujitsu vShape VDI using Fibre Channel and VMware
Page 21 of 39
The impact of the AST feature upon the traffic under the Heavy Workload can be seen with the traffic loadings on the high tier and the low tier. As noted earlier, the AST optimization feature moves the active portions of the traffic to the High Tier, and the less active portions to the Low Tier. Figure 19 and Figure 20 show the traffic loading in each of the tiers. Observe that the High Tier is supporting the majority of the traffic, while sustaining Average Response Times under 1ms. The Low Tier supports the remainder of the traffic with Average Response Times under 5ms. This results in the overall Average Response Times under 1.6ms that are shown in Figure 18.
Figure 19 – High Tier Traffic – 250 Users, Heavy Workload
Figure 20 – Low Tier Traffic – 250 Users, Heavy Workload

http://solutions.us.fujitsu.com
White paper Fujitsu vShape VDI using Fibre Channel and VMware
Page 22 of 39
9.3 Logon Storm with 250 Users
The third Login VSI test set that was run involved a specified number of VDI desktops logging on to begin work. The profile has each user login then waits for a time then log back out. The load builds as all of the requested users are brought on, and then removed. Figure 21 indicates that all 250 of the requested users were able to logon within 3 minutes. The Login VSI tool kit provides a view of the load on the ESXi servers during this operation.
Figure 21 – ESXi Server Loadings – 250 Users, Logon Storm
The CM loading during this short high demand period is provided in Figure 22. This indicates that the CMs did not constrain the logon process.
Figure 22 – ETERNUS CM Loading – 250 Users, Logon Storm

http://solutions.us.fujitsu.com
White paper Fujitsu vShape VDI using Fibre Channel and VMware
Page 23 of 39
With the storage array configured to use a FTRP, it is helpful to look at the maximum drive loading in the two tiers during this short but very critical test. Although the short term activity on the storage devices is higher than during the two workload tests, it is by no means approaching saturation where the SSDs and HDDs would limit the handling of the logon operations.
Figure 23 – FTRP Maximum Drive Loading – 250 Users, Logon Storm

http://solutions.us.fujitsu.com
White paper Fujitsu vShape VDI using Fibre Channel and VMware
Page 24 of 39
When the traffic in the storage array is viewed in terms of IOPs and RTs during this Logon Storm test, Figure 24 indicates that the Average Response Times are quite reasonable, staying under 3ms.
Figure 24 – Storage Array Traffic – 250 Users, Logon Storm

http://solutions.us.fujitsu.com
White paper Fujitsu vShape VDI using Fibre Channel and VMware
Page 25 of 39
A further look at the traffic on each of the two tiers in the FTRP indicates that, as with the two workloads, the Logon Storm traffic is primarily serviced by the High Tier SSDs (see Figure 25 and Figure 26), while maintaining a less than 2ms Average Response Time.
Figure 25 – High Tier Traffic – 250 Users, Logon Storm
Figure 26 – Low Tier Traffic – 250 Users, Logon Storm

http://solutions.us.fujitsu.com
White paper Fujitsu vShape VDI using Fibre Channel and VMware
Page 26 of 39
10 Login VSI Test Results for 500 Users
The three Login VSI test Scenarios provide data on the performance seen by the benchmark tool kit launchers.
Figure 27 – Login VSI Results for 500 User tests
Notice that not all 500 of the requested sessions were able to complete logon within the allotted 5 minutes. There are two aspects to this result – first that a longer time would have permitted all 500 to complete logon; or second that more resources would have supported logon for all 500 users within the allotted 5 minute timeframe.
10.1 Performance of 500 Users with Medium Workload
For the two Scenarios that measure traffic, Medium and Heavy, Login VSI provides response time charts as seen by the benchmark tool kit launchers.
Figure 28 – Login VSI Response 500 Users – Medium Workload
Notice that in the table (Figure 27), the VSIMax v4 Threshold was reached with 493 Users. This indicates that under this Medium workload, the test environment was not quite able to support all 500 of the simulated users. This is indicated on the chart (Figure 28) by the red marker right near the right side of the chart. Still in operational environments it is expected that 500 users will be supported satisfactorily.
4 500 Medium 497 2678 3862 5278 493A few session failed, but result is good.
5 500 Heavy 500 2670 3529 5270 not reached result is good.
6 500logon storm
415 - - - -415 logon sessions completed within 5 minutes.
VSIMax v4 threshold
VSIMax Result
Noteactive
sessions
Login VSI scenario
(load)# of usersTest No. VSIbase
VSIMax v4 average

http://solutions.us.fujitsu.com
White paper Fujitsu vShape VDI using Fibre Channel and VMware
Page 27 of 39
The next view of the performance under this workload level provides insight into the loading on the ESXi servers supporting the various VDI workload demands. Throughout this test, there are eight active servers. The CPU Utilization and Memory Utilization for these are shown on the charts (Figure 29).
Figure 29 – ESXi Server Loadings – 500 Users, Medium Workload
The performance within the ETERNUS DX100 S3 provides additional insight into the manner in which the offered load is supported by the storage array. The Control Modules (CMs) manage and move the traffic to and from the storage devices within the array. With too great a load they may become a limiting factor, however that is not the case as Figure 30 shows.
Figure 30 – ETERNUS CM Loading – 500 Users, Medium Workload

http://solutions.us.fujitsu.com
White paper Fujitsu vShape VDI using Fibre Channel and VMware
Page 28 of 39
The storage array was configured to use a Flexible Tiering Pool (FTRP) made up of five RAID Groups. One of the groups provides the high tier and was formed with two 400GB SSDs in a RAID1 arrangement. The low tier was formed with four groups, each made up of four 900GB HDDs in a RAID5(3+1) arrangement. If there are insufficient resources within the FTRP, then the drives will become saturated, and limit the response time of the array. Portions of the storage are moved between the Low Tier to the High Tier, based on the traffic the different sections encounter. Figure 31 indicates that while the High Tier does not come near drive saturation, the Low Tier drives do become saturated at times during the later phases of this workload run.
This may have caused some extended response times for requests during that phase of the test. Also notice that RG09 and RG0a already had about 70% loading prior to the start of the test. This is due to the fact that those drives were added to the Low Tier sub-pool a short time before making the run and the drives were still being formatted. This led to the saturation that caused the VSImax v4 Threshold to be reached with only 483 users, falling short of the requested 500 users. This is certainly not a normal running case, but illustrates that there is headroom available within the storage array to accommodate expansion of the storage, while supporting a substantial number of users.
Figure 31 – FTRP Maximum Drive Loading – 500 Users, Medium Workload

http://solutions.us.fujitsu.com
White paper Fujitsu vShape VDI using Fibre Channel and VMware
Page 29 of 39
The traffic seen on the storage array can be viewed in terms of the IO requests per second (IOPs) and the response times (RT) for those IO requests. As shown in Figure 32, the Overall Average Response Time to the requests from the ESXi servers reached well over 10ms during a portion of this Medium workload test run.
Figure 32 – Storage Array Traffic – 500 Users, Medium Workload
Another level of insight into the performance of the storage array is to consider the traffic and response time data for each of the two tiers separately. The High Tier is within the SSDs while the Low Tier is supported by the 10krpm SAS HDDs. Each of these is supporting part of the system traffic shown in Figure 32. The impact of the Automated Storage Tiering (AST) optimization feature can be seen in the portions of the traffic that is carried by each of the two tiers (Figure 33 and Figure 34). The High Tier represents only a small portion of the total storage space (3.6%), but yet is carrying nearly as much traffic as the Low Tier. The AST optimization has moved the highly active parts of the storage to the High Tier and the parts with lower activity to the Low Tier to provide the best response times for the demands.

http://solutions.us.fujitsu.com
White paper Fujitsu vShape VDI using Fibre Channel and VMware
Page 30 of 39
Figure 33 – High Tier Traffic – 500 Users, Medium Workload
Figure 34 – Low Tier Traffic – 500 Users, Medium Workload
The extended response time on the Low Tier, due to the formatting of drives added to the FTRP prior to the test, resulted in the VSImax v4 value reaching the Threshold with only 483 of the 500 users active. This is not a normal state, and illustrates the capability of the system to accommodate expansion of the storage capacity while still servicing users.

http://solutions.us.fujitsu.com
White paper Fujitsu vShape VDI using Fibre Channel and VMware
Page 31 of 39
10.2 Performance of 500 Users with Heavy Workload
This first view from the Login VSI tool kit reflects the performance view from the users, illustrated in Figure 35.
Figure 35 – Login VSI Response 500 Users – Heavy Workload
The next view of the performance under this workload level provides insight into the loading on the eight ESXi servers supporting the various VDI workload demands. The CPU Utilization and Memory Utilization for the eight active servers are shown in these charts (Figure 36).
Figure 36 – ESXi Server Loadings – 500 Users, Heavy Workload

http://solutions.us.fujitsu.com
White paper Fujitsu vShape VDI using Fibre Channel and VMware
Page 32 of 39
The performance within the ETERNUS DX100 S3 provides additional insight into the manner in which the offered load is supported by the storage array. The CM loading is shown in the chart as Figure 37.
Figure 37 – ETERNUS CM Loading – 500 Users, Heavy Workload
Notice that in the 250 user tests, the CM Busy Factors started at or below 2%, while in both of these 500 user tests, they are at 10% before the test even starts. This is due to the sets of drives that are being formatted when the tests were run on the 500 user environment. In addition, the newly introduced drives (being formatted) have little data assigned to them – most of the data extents are assigned to the first two RAID Groups in the Low Tier pool.
As noted previously, the storage array was configured to use a FTRP made up of five RAID groups. One provides the high tier using SSDs and the other four provide the low tier using HDDs. Within the FTRP, the AST feature moves active portions of the data to the high tier and the less active portions to the low tier. The view of the maximum drive busy in each of the tiers provides a view of the loading on the storage devices. As can be seen from Figure 38, neither of the tiers in the FTRP is saturated, indicating that there is sufficient storage device resource to support the demand.
Figure 38 – FTRP Maximum Drive Loading – 500 Users, Heavy Workload

http://solutions.us.fujitsu.com
White paper Fujitsu vShape VDI using Fibre Channel and VMware
Page 33 of 39
As noted in the 500 Users, Medium Workload, the drives for RG09 and RG0a were being formatted when this test was run. The formatting completed on RG09 near the end of this test run, while formatting continued on RG0a, as shown by the drop in loading on RG09 at about 6:43 on the above chart. RG0a continued formatting beyond the end of this test run. Even so, the Heavy Workload did not drive any of the drives near saturation.
The traffic seen on the storage array can be viewed in terms of the IOPs and RT as noted previously. As shown in Figure 39, the Average Response Time to the requests from the ESXi servers remains below 4ms for most of the time throughout the Heavy workload test.
Also, as with the 250 User tests, the storage array loading is less in the Heavy Workload test than it was in the Medium Workload test. Again, this may be an indication that many of the demands are being served from the data available within the ESXi servers. As expected, there is about twice the amount of traffic in the 500 User tests than there was in the 250 User tests.
Figure 39 – Storage Array Traffic – 500 Users, Heavy Workload

http://solutions.us.fujitsu.com
White paper Fujitsu vShape VDI using Fibre Channel and VMware
Page 34 of 39
The impact of the AST feature upon the traffic under the Heavy Workload can be seen with the traffic loadings on the high tier and low tier. As noted earlier, the AST optimization feature moves the active portions of the traffic to the High Tier, and the less active portions to the Low Tier. Figure 40 and Figure 41 show the traffic loading in each of the tiers to be nearly the same. The SSDs making up the High Tier provide much better Average Response Times.
Figure 40 – High Tier Traffic – 500 Users, Heavy Workload
Figure 41 – Low Tier Traffic – 500 Users, Heavy Workload
http://solutions.us.fujitsu.com
White paper Fujitsu vShape VDI using Fibre Channel and VMware
Page 35 of 39
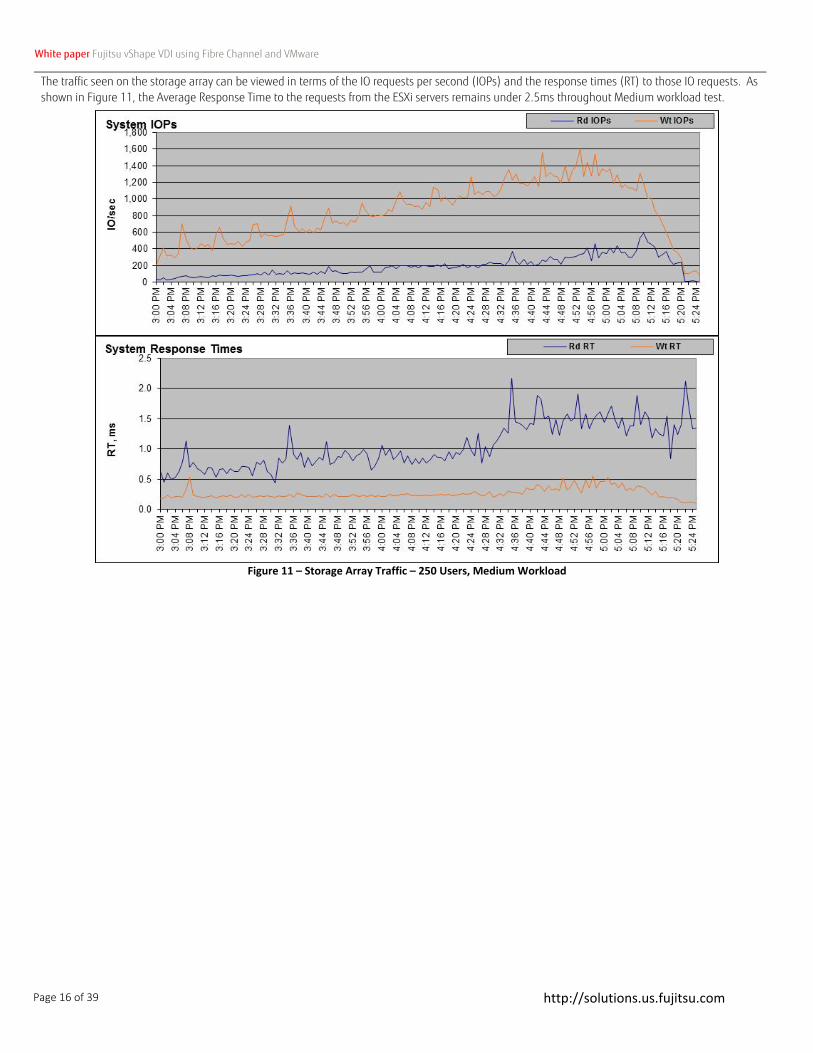
10.3 Logon Storm with 500 Users
The other Login VSI test set that was run involved a specified number of VDI desktops logging on to begin work. The profile defines each user to login, then wait for a time, then log out. The load builds as all of the requested users are brought on, and then removed. Figure 27 indicates that only 415 of the users were able to logon within 5 minutes. The Login VSI tool kit provides a view of the load on the ESXi servers during this operation.
Figure 42 – ESXi Server Loadings – 500 Users, Logon Storm
The CM loading during this short high demand period is provided in Figure 43. This indicates that the CMs did not constrain the logon process.
Figure 43 –ETERNUS CM Loading – 500 Users, Logon Storm

http://solutions.us.fujitsu.com
White paper Fujitsu vShape VDI using Fibre Channel and VMware
Page 36 of 39
With the storage array configured to use the FTRP, it is helpful to look at the maximum drive loading in the two tiers during this short but very critical test. Although the short term activity on the storage devices is higher than during the two workload tests, it is by no means approaching saturation where the SSDs and HDDs would limit the handling of the logon operations. Although two of the Low Tier HDDs reach 90% for part of the time, there is still sufficient.
Figure 44 – FTRP Maximum Drive Loading – 500 Users, Logon Storm
The low activity at the beginning of this test indicates that the formatting operations on the drives in RG09 and RG0a had completed prior to this test. However, the portion of the traffic supported on these two groups as not as great as the other two groups. This indicates that there is an imbalance in the allocations within the Low Tier of the FTRP. This is a result of the addition of the drives in RG09 and RG0a, but not yet having gone through a rebalancing of the sub-pool content. Rebalancing distributes the active extents across all of the drives within the pool, resulting in more even loading and better overall service of the requests. No rebalancing was performed after the addition of the groups into the sub-pool.

http://solutions.us.fujitsu.com
White paper Fujitsu vShape VDI using Fibre Channel and VMware
Page 37 of 39
When the traffic in the storage array is viewed in terms of IOPs and RTs during this Logon Storm test, Figure 44 indicates that the Overall Average Response Times are reasonable, staying under 6ms. However, this does not appear to be sufficient to complete the login of the 500 users in the requested 5 minutes, as only 415 succeeded.
Figure 45 – Storage Array Traffic – 500 Users, Logon Storm
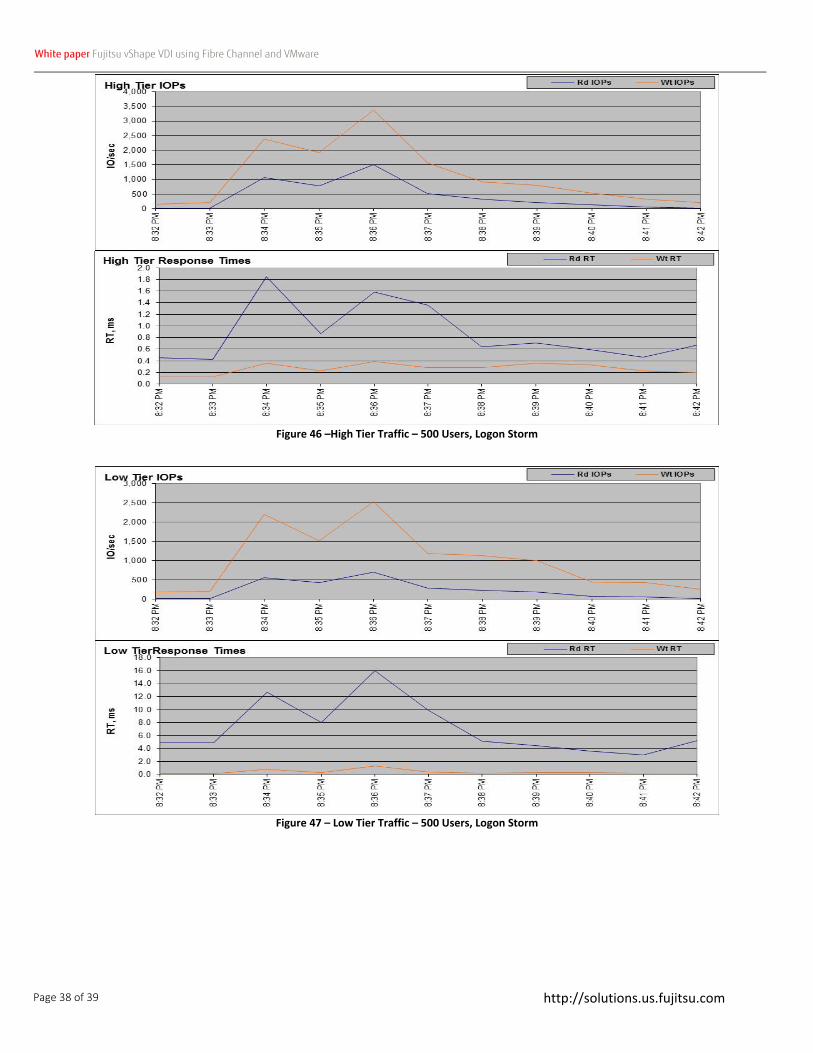
A further look at the traffic on each of the two tiers in the FTRP indicates that the Logon Storm traffic is serviced more by the High Tier SSDs than by the Low Tier HDDs (see Figure 46 and Figure 47). However, the High Tier loading for the 500 Users Logon was not nearly as high as it was with the 250 Users Logon shown in Figure 25. Also observe that the Response Time in the Low Tier for the 500 Users Logon (Figure 47) is much greater than it was for the 250 Users Logon (Figure 26). This extended Response Time is likely due to the imbalance between the drives in the 500 Users Low Tier sub-pool, while the load was evenly distributed across the drives in the 250 Users Low Tier sub-pool. The number of users that can logon in a given time is largely governed by the response time from the storage, and a more effective distribution of the storage between the High Tier and within the drives in the Low Tier would improve the number of users that can logon during the requested interval.
http://solutions.us.fujitsu.com
White paper Fujitsu vShape VDI using Fibre Channel and VMware
Page 38 of 39
Figure 46 –High Tier Traffic – 500 Users, Logon Storm
Figure 47 – Low Tier Traffic – 500 Users, Logon Storm

http://solutions.us.fujitsu.com
White paper Fujitsu vShape VDI using Fibre Channel and VMware
Page 39 of 39
About Fujitsu America Fujitsu America, Inc., is a leading ICT solutions provider for organizations in the U.S., Canada and the Caribbean. Fujitsu enables clients to meet their business objectives through integrated offerings and solutions, including consulting, systems integration, managed services, outsourcing and cloud services for infrastructure, platforms and applications; data center and field services; and server, storage, software and mobile/tablet technologies. For more information, please visit: http://solutions.us.fujitsu.com/ and http://twitter.com/fujitsuamerica
FUJITSU AMERICA, INC. Address: 1250 East Arques Avenue Sunnyvale, CA 94085-3470, U.S.A. Telephone: 800 831 3183 or 408 746 6000 Website: http://solutions.us.fujitsu.com Contact Form: http://solutions.us.fujitsu.com/contact
Have a question? Email us at: [email protected]
About Login VSI Login VSI, Inc. delivers industry-standard testing solutions for virtualized desktop and server environments. The world’s leading virtualization vendors use the flagship product, Login VSI, to benchmark the performance scalability of their solutions. Enterprise IT departments use Login VSI in all phases of their virtual desktop deployment – from capacity planning, to load testing, to change impact prediction – for more predictable performance, higher availability and a more consistent end user experience. With minimal configuration, Login VSI works in VMware Horizon View, Citrix XenDesktop and XenApp, Microsoft Remote Desktop Services (Terminal Services) and any other Windows-based virtual desktop solution. Fujitsu, the Fujitsu logo, ETERNUS, vShape and “shaping tomorrow with you" are trademarks or registered trademarks of Fujitsu Limited in the United States and other countries. PRIMERGY is a trademark of or registered trademark of Fujitsu Technology Solutions in the United States and other countries. VMware, vCenter, VMmark, VShield, vComposer, Horizon View, ThinApp and vSphere are trademarks or registered trademarks of Vmware, Inc. BROCADE is a trademark or a registered trademark of Brocade Communications Systems, Inc. in the United States and/or in other countries. Microsoft, Microsoft SQL Server, Windows Server, Outlook and PowerPoint are registered trademarks or trademarks of Microsoft Corporation in the United States and other countries. Adobe Acrobat is a registered trademark of Adobe Systems, Inc. All other trademarks referenced herein are the property of their respective owners. The statements provided herein are for informational purposes only and may be amended or altered by Fujitsu America, Inc. without notice or
liability. Product description data represents Fujitsu design objectives and is provided for comparative purposes; actual results may vary based on a
variety of factors. Specifications are subject to change without notice. Copyright© 2015 Fujitsu America, Inc. All rights reserved. FPC65-7286-02 02/15. 15.0168