Embed Size (px)
Citation preview
13a Case Study : Load Test Of Sg. Kinarut Bridge, Sabah
Manual on Bridge Asset Management 13a-1
13a Case Study : Load Test Of Sg. Kinarut Bridge 1.0 Introduction
The load test of the bridge over Sungai Kinarut in Sabah was conducted under the Jabatan Kerja Raya Malaysia (JKR) project ‘The Study on Inspection, Inventorisation and Maintenance of Federal Bridges in Sabah and Sarawak’ in 2006. The load test, which was part of the scope of work under the Project, was a behavioural test aims at validating the theoretical procedure in strength evaluation.
2.0 Bridge Description
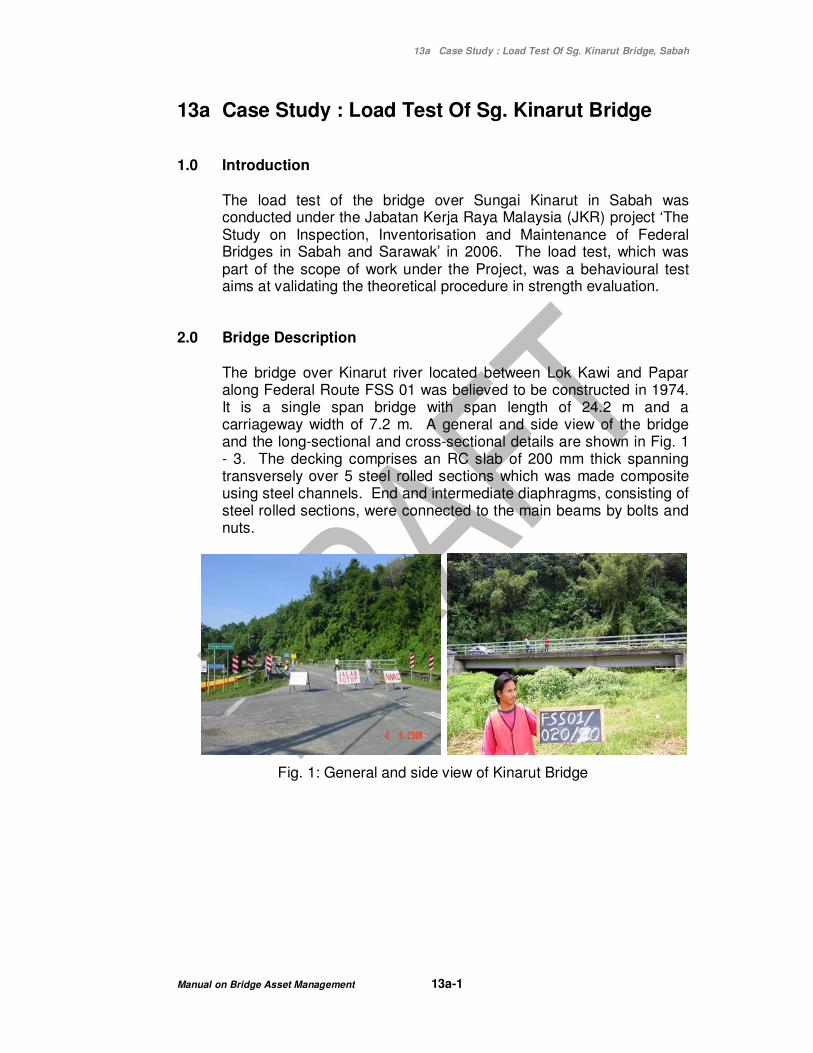
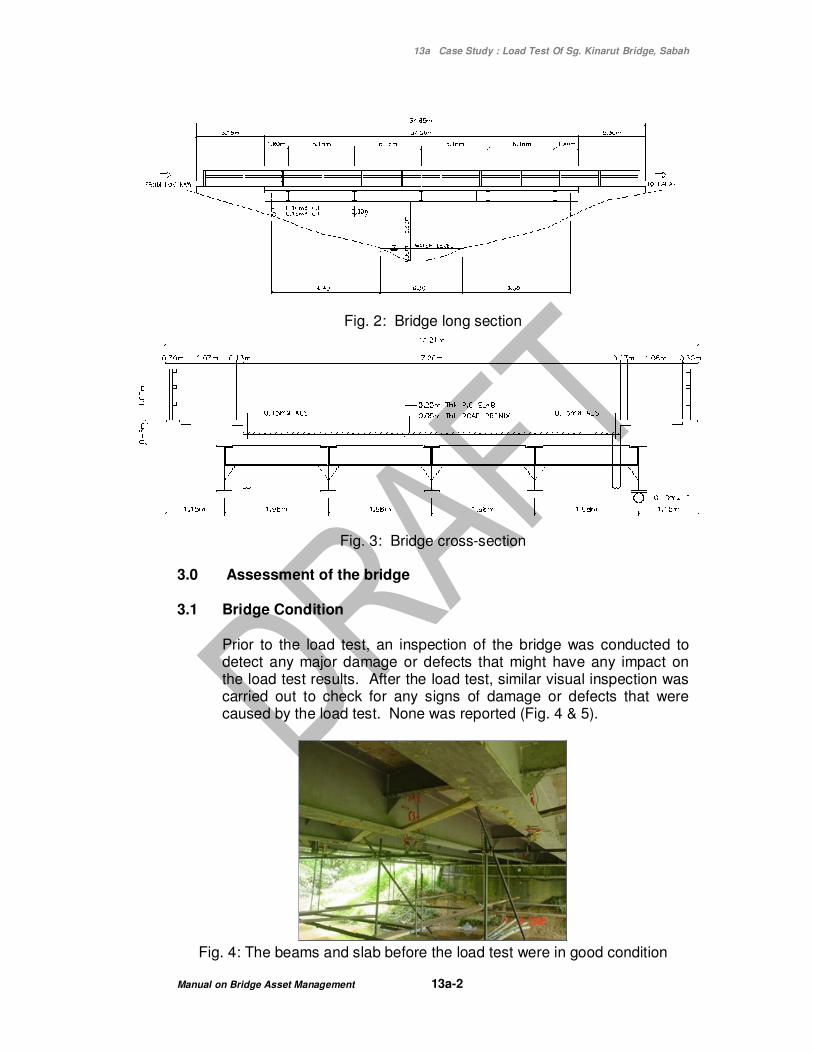
The bridge over Kinarut river located between Lok Kawi and Papar along Federal Route FSS 01 was believed to be constructed in 1974. It is a single span bridge with span length of 24.2 m and a carriageway width of 7.2 m. A general and side view of the bridge and the long-sectional and cross-sectional details are shown in Fig. 1 - 3. The decking comprises an RC slab of 200 mm thick spanning transversely over 5 steel rolled sections which was made composite using steel channels. End and intermediate diaphragms, consisting of steel rolled sections, were connected to the main beams by bolts and nuts.
Fig. 1: General and side view of Kinarut Bridge
13a Case Study : Load Test Of Sg. Kinarut Bridge, Sabah
Manual on Bridge Asset Management 13a-2
Fig. 2: Bridge long section
Fig. 3: Bridge cross-section 3.0 Assessment of the bridge
3.1 Bridge Condition
Prior to the load test, an inspection of the bridge was conducted to detect any major damage or defects that might have any impact on the load test results. After the load test, similar visual inspection was carried out to check for any signs of damage or defects that were caused by the load test. None was reported (Fig. 4 & 5).
Fig. 4: The beams and slab before the load test were in good condition

13a Case Study : Load Test Of Sg. Kinarut Bridge, Sabah
Manual on Bridge Asset Management 13a-3
Fig. 5: No damage was detected on the bridge after the load test. 3.2 Bridge Load Carrying Capacity
Analytical evaluation was carried out to determine the theoretical capacity of the bridge. From the analysis, it was found that the JKR evaluation load rating (ELR) was 1.04 in LTAL and 19.04 in SV units. These ratings were considered good in relation with the current legal load limits under Weight Restriction Order (1989) that is equivalent to some 80% of LTAL only.
4.0 Details of Instrumentation and Test 4.1 Instrumentation
The bridge was instrumented with vibrating wire strain gauges (Fig. 6), linear variable displacement transducers (LVDT) (Fig. 7), which were connected to the data loggers, CR10X from Cambell Scientific Inc. USA and TDS-302 from Tokyo Sokki Kenkyujo, Japan (Fig. 8).
Fig. 6: Vibrating wire strain gauge
13a Case Study : Load Test Of Sg. Kinarut Bridge, Sabah
Manual on Bridge Asset Management 13a-4
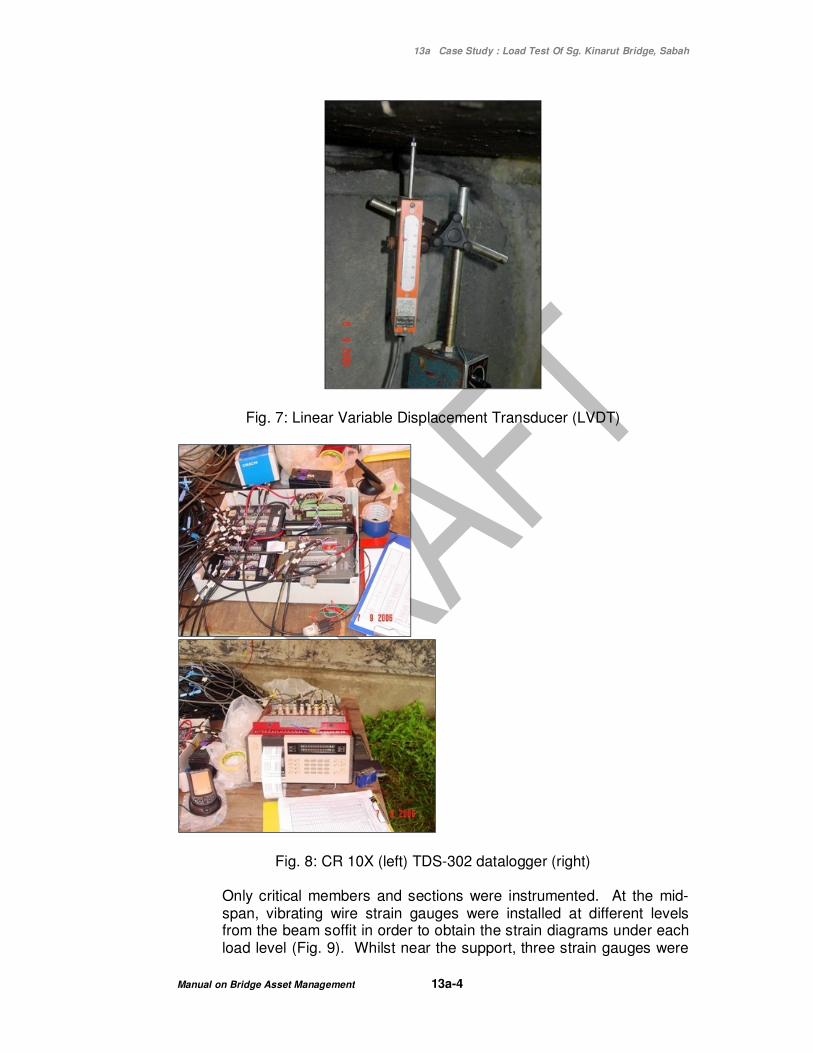
Fig. 7: Linear Variable Displacement Transducer (LVDT)
Fig. 8: CR 10X (left) TDS-302 datalogger (right)
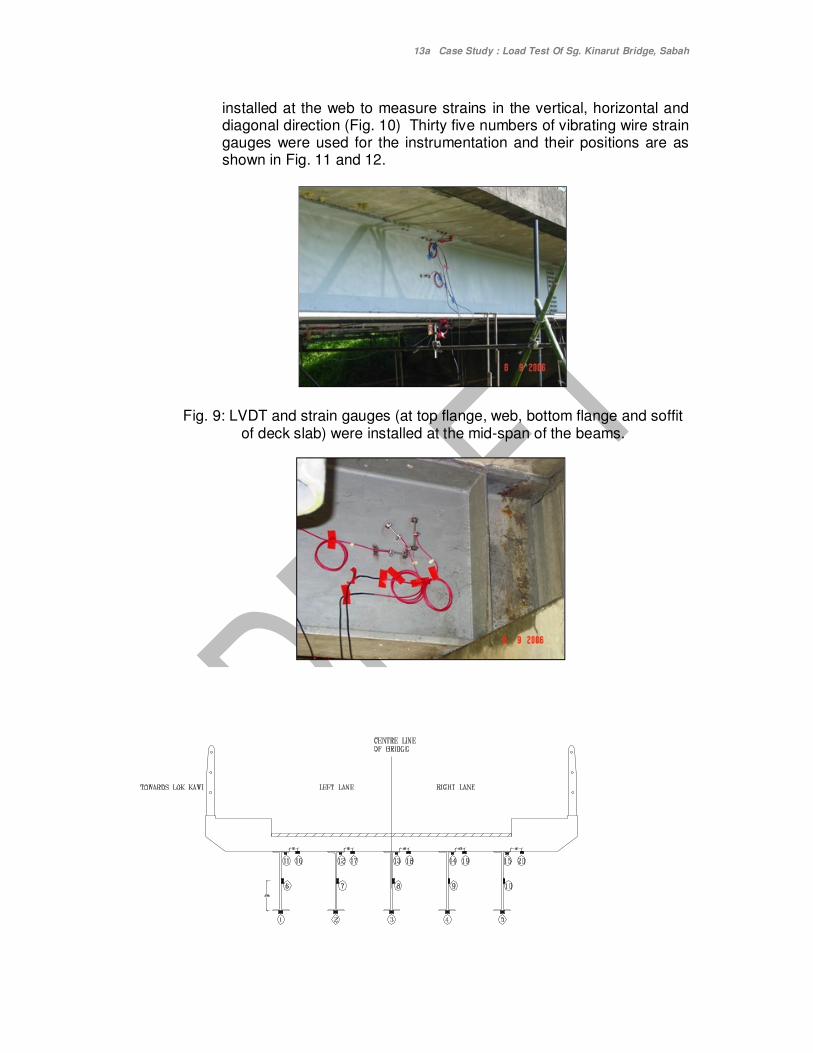
Only critical members and sections were instrumented. At the mid-span, vibrating wire strain gauges were installed at different levels from the beam soffit in order to obtain the strain diagrams under each load level (Fig. 9). Whilst near the support, three strain gauges were
13a Case Study : Load Test Of Sg. Kinarut Bridge, Sabah
Manual on Bridge Asset Management 13a-5
installed at the web to measure strains in the vertical, horizontal and diagonal direction (Fig. 10) Thirty five numbers of vibrating wire strain gauges were used for the instrumentation and their positions are as shown in Fig. 11 and 12.
Fig. 9: LVDT and strain gauges (at top flange, web, bottom flange and soffit of deck slab) were installed at the mid-span of the beams.
Fig. 10: Strain gauges installed at the web near the beam support to measure shear strain.
13a Case Study : Load Test Of Sg. Kinarut Bridge, Sabah
Manual on Bridge Asset Management 13a-6
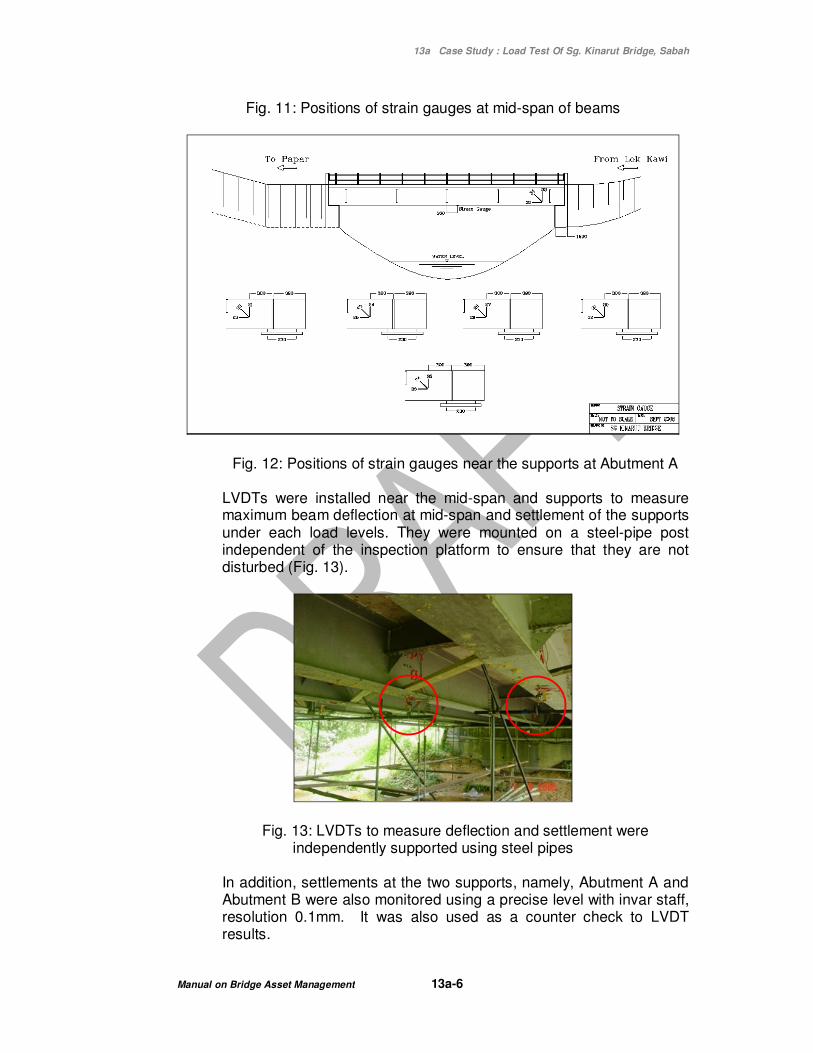
Fig. 11: Positions of strain gauges at mid-span of beams
Fig. 12: Positions of strain gauges near the supports at Abutment A
LVDTs were installed near the mid-span and supports to measure maximum beam deflection at mid-span and settlement of the supports under each load levels. They were mounted on a steel-pipe post independent of the inspection platform to ensure that they are not disturbed (Fig. 13).
Fig. 13: LVDTs to measure deflection and settlement were independently supported using steel pipes
In addition, settlements at the two supports, namely, Abutment A and Abutment B were also monitored using a precise level with invar staff, resolution 0.1mm. It was also used as a counter check to LVDT results.
13a Case Study : Load Test Of Sg. Kinarut Bridge, Sabah
Manual on Bridge Asset Management 13a-7
The strains and deflections and the temperature variations were monitored for a period of 24 hours (readings logged every hour when there was no load on the bridge) to:
i. Check the functionality of the instrumentation ii. Check the load effects caused by temperature variations alone. Temperature readings were taken at a spot over the bridge (at deck top) and another under the bridge (at deck soffit) with the use of thermocouples with a digital thermometer.
4.2 Test Loads
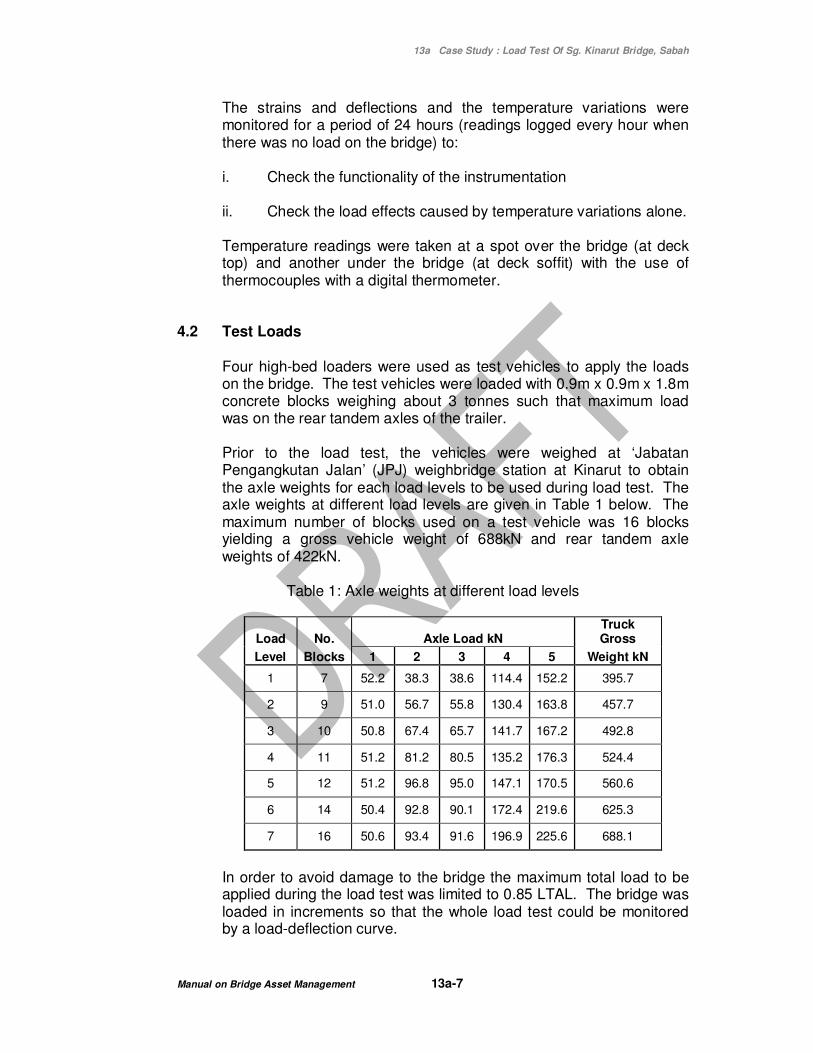
Four high-bed loaders were used as test vehicles to apply the loads on the bridge. The test vehicles were loaded with 0.9m x 0.9m x 1.8m concrete blocks weighing about 3 tonnes such that maximum load was on the rear tandem axles of the trailer. Prior to the load test, the vehicles were weighed at ‘Jabatan Pengangkutan Jalan’ (JPJ) weighbridge station at Kinarut to obtain the axle weights for each load levels to be used during load test. The axle weights at different load levels are given in Table 1 below. The maximum number of blocks used on a test vehicle was 16 blocks yielding a gross vehicle weight of 688kN and rear tandem axle weights of 422kN.
Table 1: Axle weights at different load levels
Load No. Axle Load kN Truck Gross
Level Blocks 1 2 3 4 5 Weight kN
1 7 52.2 38.3 38.6 114.4 152.2 395.7
2 9 51.0 56.7 55.8 130.4 163.8 457.7
3 10 50.8 67.4 65.7 141.7 167.2 492.8
4 11 51.2 81.2 80.5 135.2 176.3 524.4
5 12 51.2 96.8 95.0 147.1 170.5 560.6
6 14 50.4 92.8 90.1 172.4 219.6 625.3
7 16 50.6 93.4 91.6 196.9 225.6 688.1
In order to avoid damage to the bridge the maximum total load to be applied during the load test was limited to 0.85 LTAL. The bridge was loaded in increments so that the whole load test could be monitored by a load-deflection curve.
13a Case Study : Load Test Of Sg. Kinarut Bridge, Sabah
Manual on Bridge Asset Management 13a-8
4.3 Load test plan
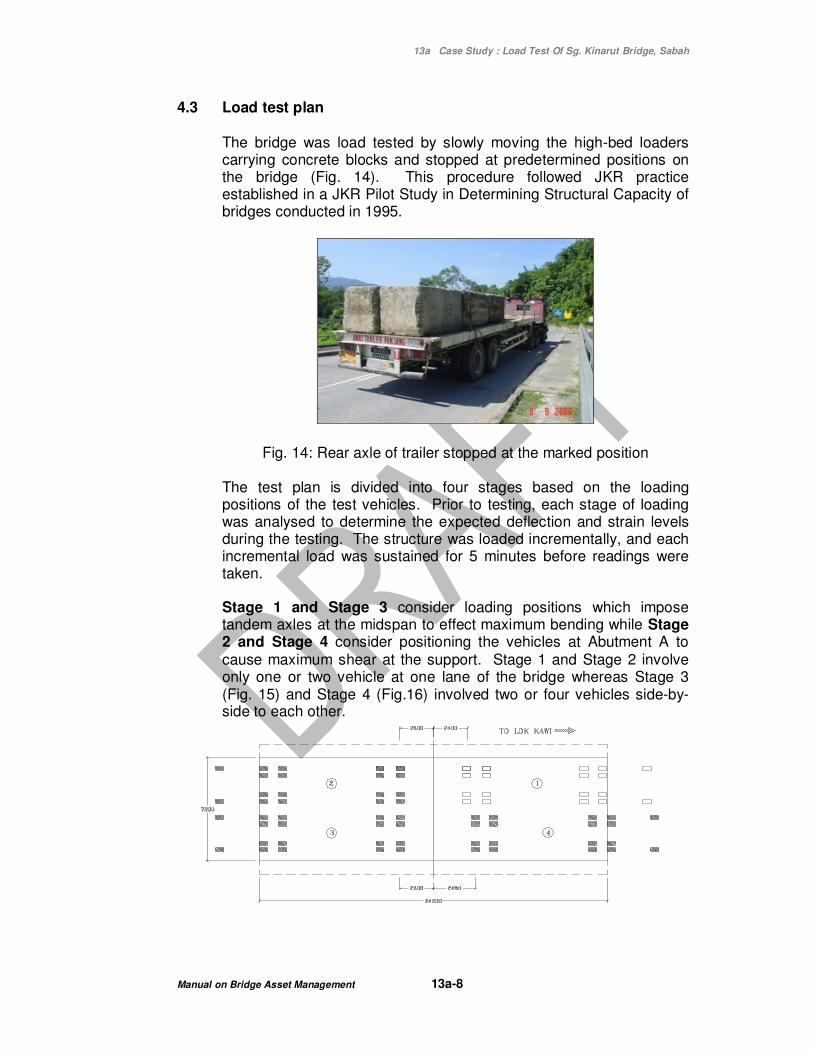
The bridge was load tested by slowly moving the high-bed loaders carrying concrete blocks and stopped at predetermined positions on the bridge (Fig. 14). This procedure followed JKR practice established in a JKR Pilot Study in Determining Structural Capacity of bridges conducted in 1995.
Fig. 14: Rear axle of trailer stopped at the marked position
The test plan is divided into four stages based on the loading positions of the test vehicles. Prior to testing, each stage of loading was analysed to determine the expected deflection and strain levels during the testing. The structure was loaded incrementally, and each incremental load was sustained for 5 minutes before readings were taken. Stage 1 and Stage 3 consider loading positions which impose tandem axles at the midspan to effect maximum bending while Stage 2 and Stage 4 consider positioning the vehicles at Abutment A to cause maximum shear at the support. Stage 1 and Stage 2 involve only one or two vehicle at one lane of the bridge whereas Stage 3 (Fig. 15) and Stage 4 (Fig.16) involved two or four vehicles side-by-side to each other.

13a Case Study : Load Test Of Sg. Kinarut Bridge, Sabah
Manual on Bridge Asset Management 13a-9
Fig.15: Test vehicles arrangement for Stage 3 to impose maximum moment on the bridge.
Fig.16: Test vehicles arrangement for Stage 4 to impose maximum shear on the bridge.
Because the traffic volume on Kinarut Bridge is quite light and alternative route is available, the bridge was completely closed during the load test.
5.0 Theoretical Calculation of load effects
For the purpose of comparisons, the bridge superstructure was analyzed using STRAP. The analysis was carried out for two restraint conditions: pinned-free and pinned-pinned. The purpose was to check if condition of the bearings would at all affect the results. Two cases of composite actions were assumed. For the comparison of measured deflections/strains and theoretical values, Stage 3 and Stage 4 were considered.
6.0 Test Results 6.1 Beam Strains at midspan
Loading positions Stage 3 of the test vehicles, which are identified in Fig. 15, produced the maximum midspan flexural strains. Accordingly, only the results corresponding to this position are presented. Bottom flange strains in all beams at the midspan for Stage 3 loading positions and load levels of the test loading are plotted in Fig. 17. It can be seen in this chart that the pattern of transverse distribution of these strains for any load position remains unaffected by the load level, thus confirming the accuracy and repeatability of the instrumentation. The midspan bottom flanges strains distribution show that the live load is well distributed transversely.

13a Case Study : Load Test Of Sg. Kinarut Bridge, Sabah
Manual on Bridge Asset Management 13a-10
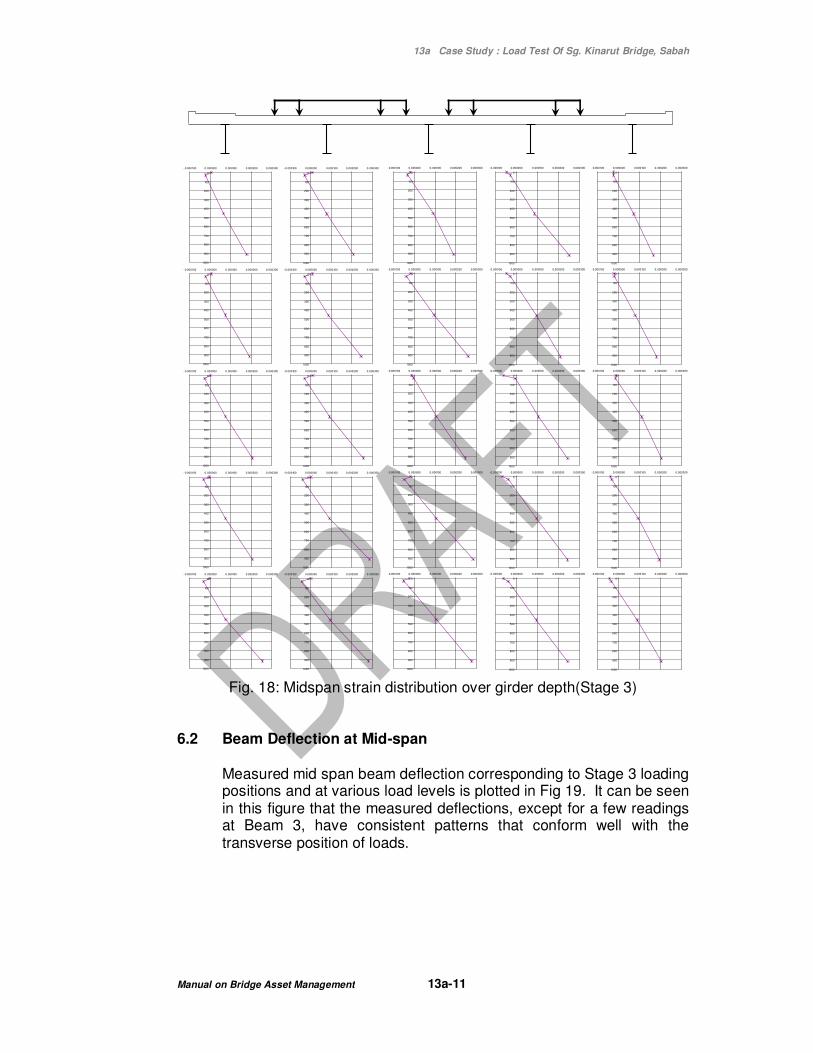
Midspan strain distribution over girder depth for various load levels for Stage 3 vehicles arrangement are shown in Fig. 18. The chart shows that there are considerable levels of composite action between the concrete deck and the steel girders as the neutral axes are very close to the top flanges.
Fig. 17: Bottom flange strains in beam at midspan (Stage 3)
Load level Vs. Strain (Stage 3)
0.00015
0.00017
0.00019
0.00021
0.00023
0.00025
0.00027
0.00029
0 1 2 3 4 5 6
Beam Number
Str
ain
L1 L2 L3 L4 L5
13a Case Study : Load Test Of Sg. Kinarut Bridge, Sabah
Manual on Bridge Asset Management 13a-11
Fig. 18: Midspan strain distribution over girder depth(Stage 3)
6.2 Beam Deflection at Mid-span
Measured mid span beam deflection corresponding to Stage 3 loading positions and at various load levels is plotted in Fig 19. It can be seen in this figure that the measured deflections, except for a few readings at Beam 3, have consistent patterns that conform well with the transverse position of loads.
0
100
200
300
400
500
600
700
800
900
1000
-0.000100 0.000000 0.000100 0.000200 0.000300
0
100
200
300
400
500
600
700
800
900
1000
-0.000100 0.000000 0.000100 0.000200 0.000300
0
100
200
300
400
500
600
700
800
900
1000
-0.000100 0.000000 0.000100 0.000200 0.000300
0
100
200
300
400
500
600
700
800
900
1000
-0.000100 0.000000 0.000100 0.000200 0.000300
0
100
200
300
400
500
600
700
800
900
1000
-0.000100 0.000000 0.000100 0.000200 0.000300
0
100
200
300
400
500
600
700
800
900
1000
-0.000100 0.000000 0.000100 0.000200 0.000300
0
100
200
300
400
500
600
700
800
900
1000
-0.000100 0.000000 0.000100 0.000200 0.000300
0
100
200
300
400
500
600
700
800
900
1000
-0.000100 0.000000 0.000100 0.000200 0.000300
0
100
200
300
400
500
600
700
800
900
1000
-0.000100 0.000000 0.000100 0.000200 0.000300
0
100
200
300
400
500
600
700
800
900
1000
-0.000100 0.000000 0.000100 0.000200 0.000300
0
100
200
300
400
500
600
700
800
900
1000
-0.000100 0.000000 0.000100 0.000200 0.000300
0
100
200
300
400
500
600
700
800
900
1000
-0.000100 0.000000 0.000100 0.000200 0.000300
0
100
200
300
400
500
600
700
800
900
1000
-0.000100 0.000000 0.000100 0.000200 0.000300
0
100
200
300
400
500
600
700
800
900
1000
-0.000100 0.000000 0.000100 0.000200 0.000300
0
100
200
300
400
500
600
700
800
900
1000
-0.000100 0.000000 0.000100 0.000200 0.000300
0
100
200
300
400
500
600
700
800
900
1000
-0.000100 0.000000 0.000100 0.000200 0.000300
0
100
200
300
400
500
600
700
800
900
1000
-0.000100 0.000000 0.000100 0.000200 0.000300
0
100
200
300
400
500
600
700
800
900
1000
-0.000100 0.000000 0.000100 0.000200 0.000300
0
100
200
300
400
500
600
700
800
900
1000
-0.000100 0.000000 0.000100 0.000200 0.000300
0
100
200
300
400
500
600
700
800
900
1000
-0.000100 0.000000 0.000100 0.000200 0.000300
0
100
200
300
400
500
600
700
800
900
1000
-0.000100 0.000000 0.000100 0.000200 0.000300
0
100
200
300
400
500
600
700
800
900
1000
-0.000100 0.000000 0.000100 0.000200 0.000300
0
100
200
300
400
500
600
700
800
900
1000
-0.000100 0.000000 0.000100 0.000200 0.000300
0
100
200
300
400
500
600
700
800
900
1000
-0.000100 0.000000 0.000100 0.000200 0.000300
0
100
200
300
400
500
600
700
800
900
1000
-0.000100 0.000000 0.000100 0.000200 0.000300

13a Case Study : Load Test Of Sg. Kinarut Bridge, Sabah
Manual on Bridge Asset Management 13a-12
Fig. 19: Beam deflection (Stage 3)
7.0 Discussion of Results
7.1 Positions of Neutral Axes and composite actions
The strain results at mid span of all the beams indicate that the neutral axis (location of zero strain) is close to the deck slab for every beam. This is indicative of high interaction between the deck slab and the beam. Linear strain at each load level confirms the common assumption in bending theory that “a plane section remains plane after bending”.
7.2 Lateral load distribution
The results of deflections and strains across the bridge deck at every load levels conclude that the lateral load distribution property of the bridge is similar to that suggested by the theory. Comparison of the measured load effects with theoretical values give the notion that grillage analysis is acceptable for this form of construction.
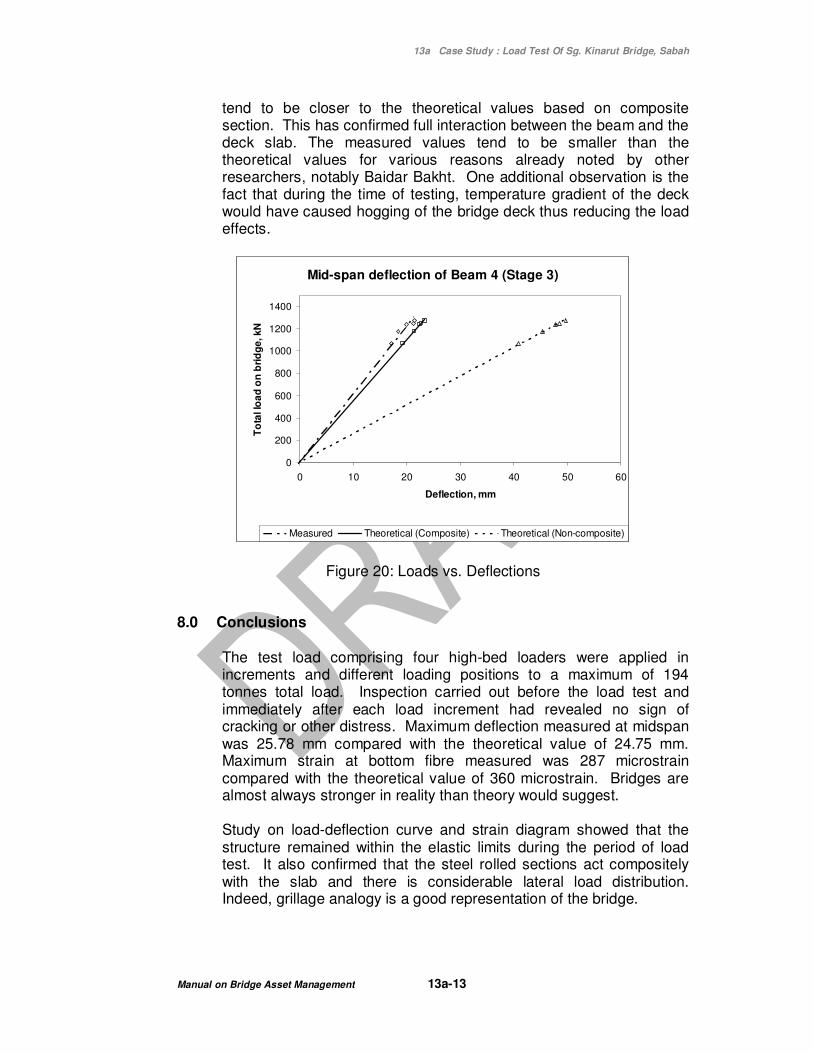
7.3 Proof load
A plot of the total imposed loads versus the measured deflections for beam B4 is presented in Fig. 20. This graph shows that the load-deflection relationship is linear throughout the test. Hence the structure has remained within the elastic limits during the period of load testing until maximum total load of 194 tonnes. The measured values of deflections at each load level are much smaller than the theoretical ones. This demonstrates that the bridge has much higher stiffness than that given by calculation. The measured deflections
Load level Vs. Deflection (Stage 3)
-28.00
-26.00
-24.00
-22.00
-20.00
-18.00
-16.00
-14.00
-12.00
0 1 2 3 4 5 6
Beam Number
De
fle
cti
on
, m
m
L1 L2 L3 L4 L5
13a Case Study : Load Test Of Sg. Kinarut Bridge, Sabah
Manual on Bridge Asset Management 13a-13
tend to be closer to the theoretical values based on composite section. This has confirmed full interaction between the beam and the deck slab. The measured values tend to be smaller than the theoretical values for various reasons already noted by other researchers, notably Baidar Bakht. One additional observation is the fact that during the time of testing, temperature gradient of the deck would have caused hogging of the bridge deck thus reducing the load effects.
Figure 20: Loads vs. Deflections 8.0 Conclusions
The test load comprising four high-bed loaders were applied in increments and different loading positions to a maximum of 194 tonnes total load. Inspection carried out before the load test and immediately after each load increment had revealed no sign of cracking or other distress. Maximum deflection measured at midspan was 25.78 mm compared with the theoretical value of 24.75 mm. Maximum strain at bottom fibre measured was 287 microstrain compared with the theoretical value of 360 microstrain. Bridges are almost always stronger in reality than theory would suggest. Study on load-deflection curve and strain diagram showed that the structure remained within the elastic limits during the period of load test. It also confirmed that the steel rolled sections act compositely with the slab and there is considerable lateral load distribution. Indeed, grillage analogy is a good representation of the bridge.
Mid-span deflection of Beam 4 (Stage 3)
0
200
400
600
800
1000
1200
1400
0 10 20 30 40 50 60
Deflection, mm
To
tal lo
ad
on
bri
dg
e, kN
Measured Theoretical (Composite) Theoretical (Non-composite)

13a Case Study : Load Test Of Sg. Kinarut Bridge, Sabah
Manual on Bridge Asset Management 13a-14
The maximum total load that had been subjected to the bridge was by four test vehicles each introducing two rear axle loads of around 32 tonnes vide their two rear axles. These loads are equivalent to 34 units of HB vehicle. The structure has not experienced any excessive deflection, cracking throughout the test period. Although not very conclusive for the lack of maintaining the proof load as per BS5400, it is suggestive that the bridge can at least carry the full JKR standard loading LTAL, which is well within the legal load limits allowed under the current Weight Restriction Order 1989 (WRO’89).


![CALIFORNIA [ADVANCE RELEASE] · Sh Sh MgCp SG SG SG SG SG SG SG SG SG Fe Fe Gr-s Gr-s Per CS Pum Pum Salt Salt Salt S-o S-o Zeo Dia Bent Bent Bent B B Clay Clay Dia DS DS DS DS DS](https://img.dokumen.tips/doc/110x75/5d435e0888c993ea558bc1de/california-advance-release-sh-sh-mgcp-sg-sg-sg-sg-sg-sg-sg-sg-sg-fe-fe-gr-s.jpg)