Embed Size (px)
Citation preview
13 - 1
Module 13: Normal Distributions
This module focuses on the normal distribution and how to use it.
Reviewed 05 May 05/ MODULE 13

13 - 2
Sampling Distributions
Individual
observations
Means for
n = 5
Means for
n = 20
149 153.0 151.6
146.
.
.
146.4.
.
.
151.3.
.
.
µ = 150 lbs µ = 150 lbs µ = 150 lbs
2 = 100lbs
= 10 lbs
22 220 lbsx n
2
2 25 lbsx n
4.47 lbsxn
2.23 lbsxn

13 - 3
The normal distribution is defined by the density function:
This function happens to be Symmetrical, Bell-shaped, and easy to use tables are available.
21
21( )
2
x
f x e
Normal Distribution Density Function

13 - 4
%
%
Pro
bab
ilit
y / %
Normal Distribution

13 - 5
Population Distributions

13 - 6
Population Distributions
13 - 7
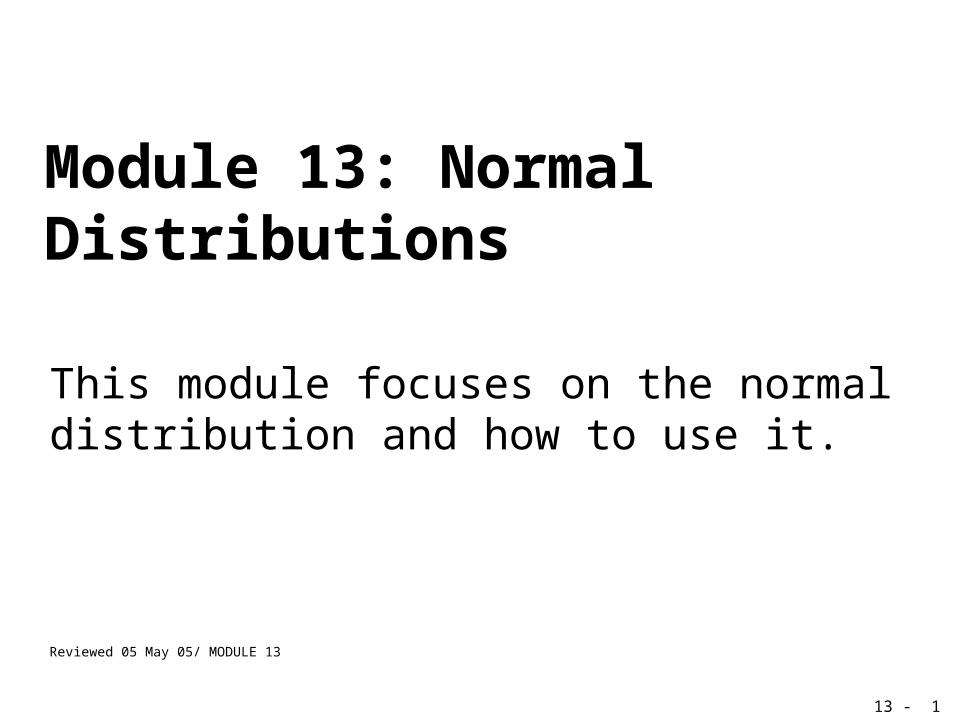
We can use the normal tables to obtain probabilities
for measurements for which this frequency distribution
is appropriate. For a reasonably complete set of
probabilities, see TABLE MODULE 1: NORMAL
TABLE.
This module provides most of the z-values and
associated probabilities you are likely to use; however,
it also provides instructions demonstrating how to
calculate those not included directly in the table.
Using the Normal Tables

13 - 8
Normal Tables (contd.)
The table is a series of columns containing numbers
for z and for P(z). The z represents the z-value for a
normal distribution and P(z) represents the area under
the normal curve to the left of that z-value for a
normal distribution with mean µ = 0 and standard
deviation σ = 1.

13 - 9
Using the Normal Tables
Z
(1) Area Below z = -2; P(z < -2) = 0.0228
2
(0,1)
0
1
N

13 - 10
Using the Normal Tables
Z
2
(0,1)
0
1
N
(2) Area Below z = -1; P(z < -1) = 0.1587
13 - 11
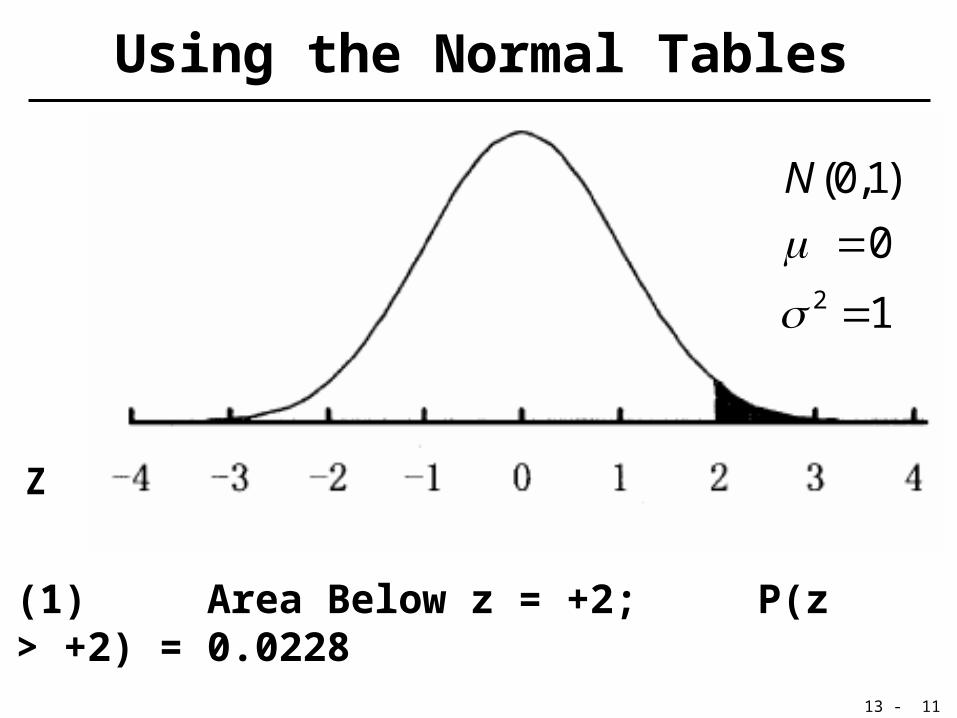
Using the Normal Tables
Z
2
(0,1)
0
1
N
(1) Area Below z = +2; P(z > +2) = 0.0228

13 - 12
Using the Normal Tables
Z
2
(0,1)
0
1
N
(2) Area Below z = +1; P(z > +1) = 0.1587
13 - 13
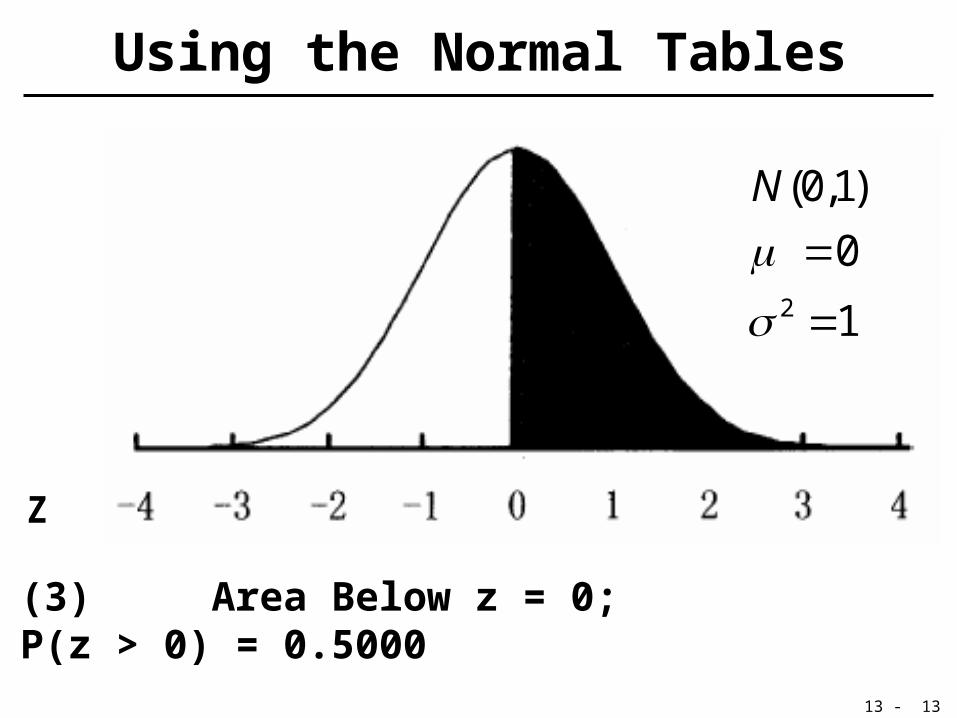
Using the Normal Tables
2
(0,1)
0
1
N
(3) Area Below z = 0; P(z > 0) = 0.5000
Z

13 - 14
Calculating the Area Under the Normal Curve
Z
2
(0,1)
0
1
N
(1) Area between -1, +1; P( -1 < z < +1)up to z = +1: .8413up to z = -1 : .1587
.6826

13 - 15
Calculating the Area Under the Normal Curve
Z
2
(0,1)
0
1
N
(2) Area between -2, +2; P( -2 < z < +2)up to z = +2: .9772up to z = -2 : .0228
.9544
13 - 16
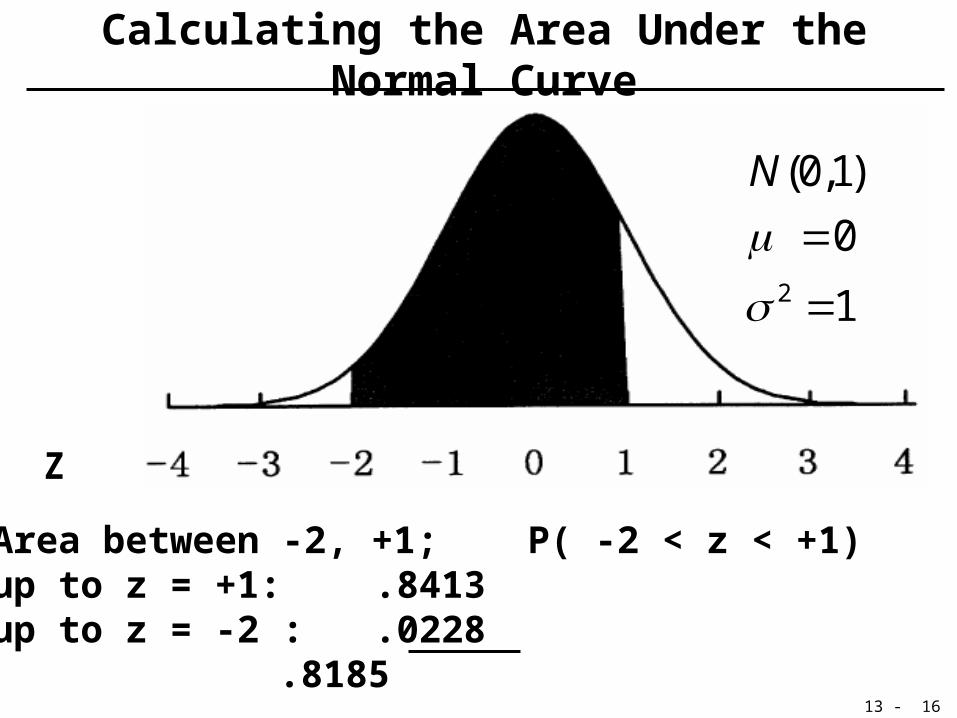
Calculating the Area Under the Normal Curve
2
(0,1)
0
1
N
(3) Area between -2, +1; P( -2 < z < +1)up to z = +1: .8413up to z = -2 : .0228
.8185
Z

13 - 17
Standard Normal Distribution
2
(0,1)
0
1
N
(1) Values of z that bracket middle 95% -1.96 to +1.96
Z
13 - 18
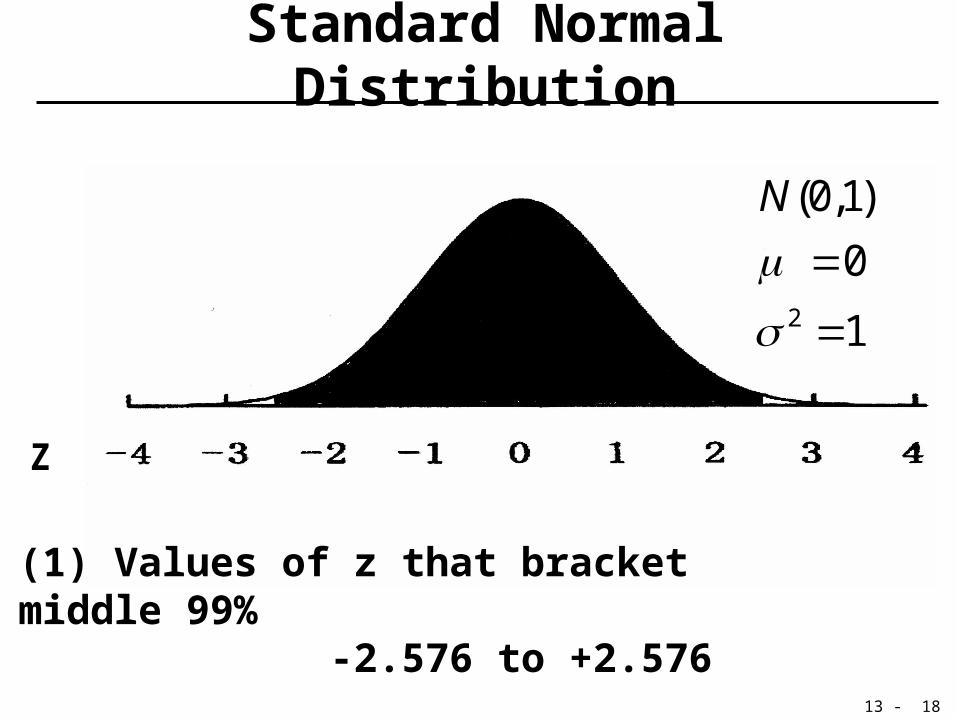
Standard Normal Distribution
2
(0,1)
0
1
N
(1) Values of z that bracket middle 99% -2.576 to +2.576
Z

13 - 19
Calculating z-values
and ~ (0,1)Z N
If ~ ( , )x xX N
then the corresponding z value for x is given as
x
x
xz
i.e. µz = 0 and z2 = 1

13 - 20
; if ~N( 150,10) . . 150, 10
150 150when = 150; 0
10170 150 20
when = 170; 210 10
xx x
x
xz X i e
x z
x z
Calculating z-values
2
~ (0,1)
0
1
z
z
Z N
Z
~ ( , )
150
10
x x
x
x
X N
110 120 130 140 150 160 170 180 190 2x x 2x x 1x x 3x x 1x x x 3x x
13 - 21
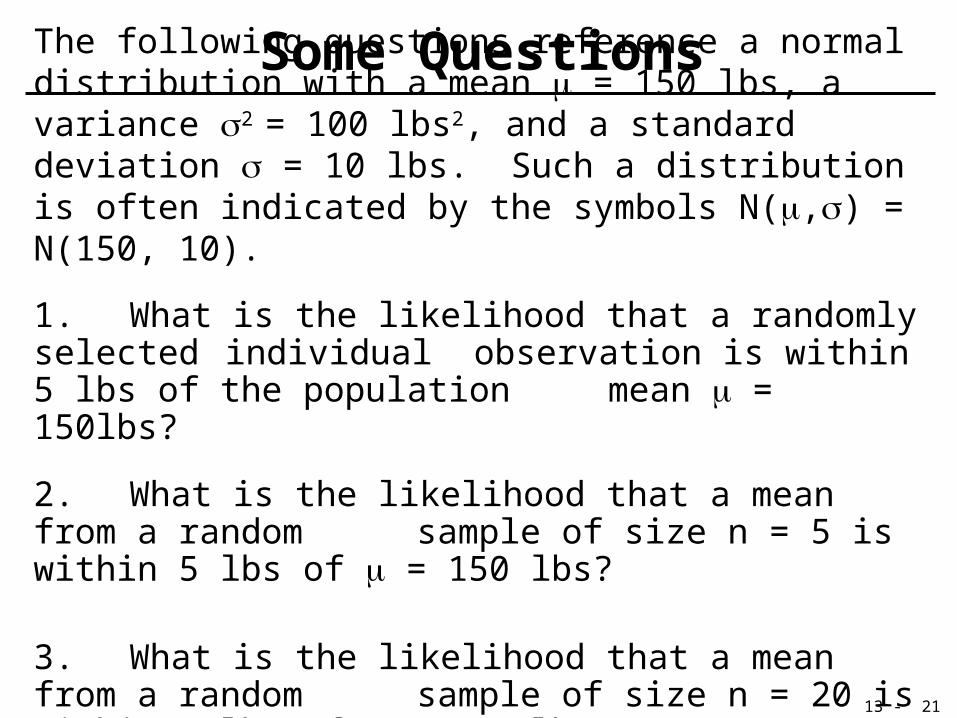
The following questions reference a normal distribution with a mean = 150 lbs, a variance 2 = 100 lbs2, and a standard deviation = 10 lbs. Such a distribution is often indicated by the symbols N(,) = N(150, 10).
1. What is the likelihood that a randomly selected individual observation is within 5 lbs of the population mean = 150lbs?
2. What is the likelihood that a mean from a random sample of size n = 5 is within 5 lbs of = 150 lbs?
3. What is the likelihood that a mean from a random sample of size n = 20 is within 5 lbs of = 150 lbs?
Some Questions

13 - 22
Solution to Question 1
0.38292
X
155 1500.5
10Upper x
Upperx
xz
Area between z upper and z lower = 0.38292
145 150 0.5
10Lower x
Lowerx
xz
, Area up to z upper = 0.69146
, Area up to z lower = 0.30854
~ (150,10)
1
150
10
x
x
X N
n
lbs
lbs
13 - 23
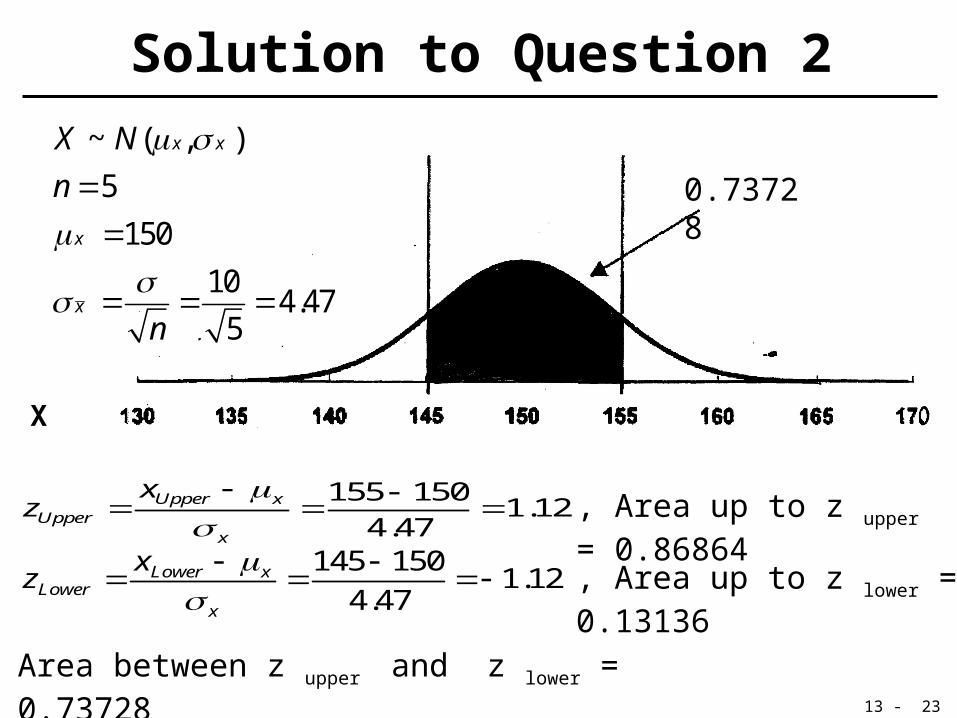
Solution to Question 2
Area between z upper and z lower = 0.73728
0.73728
155 1501.12
4.47Upper x
Upperx
xz
145 1501.12
4.47Lower x
Lowerx
xz
, Area up to z upper = 0.86864
, Area up to z lower = 0.13136
~ ( , )
5
150
104.47
5
x x
x
x
X N
n
n
X

13 - 24
Solution to Question 3
0.97490
155 1502.24
2.23Upper x
Upperx
xz
145 1502.24
2.23Lower x
Lowerx
xz
, Area up to z upper = 0.98745
, Area up to z lower = 0.01255
Area between z upper and z lower = 0.97490
~ ( , )
20
150
2.23
x x
x
x
X N
n
lbs
lbsn
X

13 - 25
1150 10
nlbslbs
0.38292
5150
= 4.47 x
nlbs
lbsn
20150
= 2.23 x
nlbs
lbsn
0.73728
0.97490

13 - 26
• When centered about = 150 lbs, what proportion of the total distribution does an interval of length 10 lbs cover?• How many standard deviations long must an
interval be to cover the middle 95% of the distribution?
• From - (??) standard deviations to + (??) standard deviations covers (??) % of the distribution?
All these questions require that the value for be known and that it be placed in the center of these “intervals”.
Some More Questions
![· Pathfinder Module: The Emerald Spire Superdungeon: Character Chronicle Slow 3—5 2, 400 Slow Normal C]Normal C)Normal P yer Name Character Name](https://img.dokumen.tips/doc/110x75/5b1cdf237f8b9a06758b805e/-pathfinder-module-the-emerald-spire-superdungeon-character-chronicle-slow.jpg)